Abstract
A conventional thermoelectric plant (TP) in the sandy bar of the Tampamachoco Lagoon (Gulf of Mexico slope) emits particulate matter (PM) transporting trace metals that affect a mangrove forest. Wind transports the emission plume from north to south in the northerly wind season (NWS); the dry season (DS) showed calm periods. We analyzed whether PM2.5 and PM10 emissions from the TP and their trace metals impact Rhizophora mangle leaves. The experimental design included three sampling sites along the main lagoon axis (north to south) during the NWS and DS. Mangrove leaves were collected; PM was obtained with a cascade impactor and trace elements were analyzed by atomic absorption spectrophotometry. Leaves were measured and tested for metal and chlorophyll content, and for metal detection with SEM-EDX. Calm periods in the DS promote high atmospheric PM concentrations. Wet deposition in the NWS caused the highest trace metal deposition on mangrove leaves. A north-to-south gradient was identified on the mangrove forest, being the south site of the lagoon where lower chlorophyll and leaf area, higher stomatal width and density, and higher Cd concentrations were recorded. The morpho-physiological modifications observed on mangrove leaves affect functions such as photosynthesis and gas exchange.
1. Introduction
Fossil fuel-based electricity generation is an important component of the economy and an essential primary product [1]. In recent years, more than 78% of electricity worldwide was produced using conventional technologies based on fossil fuels as the primary energy sources [2]. Although the electricity sector contributes substantially to the economy in several countries, it also involves the intensive use of natural resources and causes adverse environmental impacts. In this sense, air pollution and greenhouse gases generated by this sector are a major concern [1], particularly in the case of power plants operating with fuel oil.
Latin America and the Caribbean are highly vulnerable to extreme weather events such as droughts and floods [3]; therefore, preserving mangrove areas is a pressing issue. The dependence on energy generated in these regions is mainly due to the burning of fossil fuels (39.3%), with almost 500 thermoelectric power plants spread throughout the region, many of which are located in coastal areas and adjacent to mangrove forests.
Although most countries have committed to reducing emissions in the electricity sector, they continue relying on thermal energy over other more sustainable options. In this sense, the continued assessment of the impact of emissions on key species, such as mangroves, is of the utmost importance [4,5].
In North America, the Commission for Environmental Cooperation (CEC) evaluated suspended particulate emissions (PM2.5 and PM10), showing that two-thirds of the emissions released by thermoelectric power plants in Mexico derived from burning fuel oil. The “Presidente Adolfo López Mateos” Thermoelectric Power Plant (CT-PALM) (with an effective installed capacity of 2100 MW [6]), located on the Gulf of Mexico slope, was evaluated along with other thermoelectric power plants located in North America. Of the 10 thermoelectric power plants with the highest emissions, CT-PALM ranked first in PM2.5 and PM10 emissions, with 6033 tons year−1 and 8277 tons year−1, respectively, and fourth in Hg emissions, with 0.036 tons year−1 [1]. Recently, based on official emission data for 2021 [7,8,9], it was estimated that 26 279.48 tons·year−1 of PM were released into the atmosphere. Undoubtedly, the environmental impact of CT-PALM on the Gulf of Mexico coast should be investigated. However, García [10] demonstrated the lack of recent and detailed information on the behavior of atmospheric pollutants emitted by thermoelectric plants in the Gulf of Mexico.
Particulate matter (PM) is classified according to various methods, including a method based on particle size, with PM10 and PM2.5 corresponding to particles with an aerodynamic diameter of less than 10 μm or 2.5 μm, respectively [11]. Trace elements (chemical elements such as heavy metals present at low levels) associated with PM are usually distributed in size ranges that are characteristic of the emission source. Therefore, these trace elements can be used as markers of anthropogenic sources [12]. Likewise, the combustion of heavy fuel oil contributes quantities of nickel (Ni) and vanadium (V) to the atmosphere. Thus, the concentrations of the main metallic elements in this fuel are 82, 55, 10, 2.3, 1.3, and 0.1 ppm of V, Ni, mercury (Hg), lead (Pb), chromium (Cr), and cadmium (Cd), respectively [13].
Studies addressing health effects have identified at least two characteristics related to the composition of atmospheric particles that appear to exacerbate health damage. These are the presence of transition metals (e.g., copper (Cu), iron (Fe), V, Ni, and zinc (Zn)) and aerosol acidity. In addition to particle composition, another factor with an apparent health impact is the presence of ultrafine particles (<0.1 µm in diameter). The PM generated from the combustion of residual fuel oils exhibits all these characteristics, i.e., transition metals, acidity, and ultrafine size [14]. Both PM2.5 and PM10 penetrate deep into the lungs, but PM2.5 even enters the bloodstream, affecting the cardiovascular and respiratory systems, as well as other organs. In 2013, outdoor air pollution and PM were classified as carcinogenic by the International Agency for Research on Cancer of the World Health Organization (WHO) [15]. For example, Jiang [16] reported that Cr in PM2.5 poses carcinogenic risks; in addition, adults and children in Zhengzhou, China, were exposed to arsenic (As), Ni, and Pb linked to PM2.5 in winter and summer. These metals have a known carcinogenic potential, with children being most sensitive to high atmospheric levels [15,16].
Plants are directly exposed to air pollutants, enduring practically lifelong exposure. The harmful effects of airborne particles on higher plants include morphological, physiological, and biochemical alterations [17]. One of the important morphological characteristics is stomatal characterization because stomata play a vital role in maintaining plant homeostasis [18]. PM deposition on the leaf epidermis, and mainly on stomatal pores, obstructs the passage of gases and affects respiration efficiency. Photosynthesis may be reduced, and oxidative stress from the generation of reactive oxygen species by the presence of pollutants reduces chlorophyll content in leaves [19]. For example, Ledesma [20] found that the highest Pb and Ni contents in leaves decreased chlorophyll levels in Tithonia diversifolia growing at a roadside and exposed to motor car emissions.
The CT-PALM is located in the vicinity of a coastal lagoon, Laguna de Tampamachoco, on the Gulf of Mexico slope. Mangrove forests surround the lagoon, where Rhizophora mangle, considered an umbrella species, is abundant [21]. In agreement with the conservation biology concept, umbrella species serve as proxies for entire communities and ecosystems, so that the whole system is conserved when they are preserved. Preliminary studies suggest a significant difference in the leaf area of R. mangle in mangroves adjacent to a thermoelectric plant compared to areas away from these facilities [22]. Several studies report the buildup of non-nutritive metals in mangrove sediments and their bioaccumulation in aerial tissues. Toxicity studies in mangroves have focused on the effects of trace metals (Cu, Cd, Hg, Mn, Pb, and Zn). Thus, some studies are focusing on the use of mangrove trees as phytoremediators [23,24,25]. Under controlled conditions, the effect of trace pollutants on mangrove plants reveals that photosynthesis, growth, and biomass are reduced, while mortality increases [26]. Although there are several laboratory studies on the natural resistance of mangroves to trace metals, little research has been conducted in situ on the impact of thermoelectric PM emissions on the leaves of R. mangle, which also experiences the seasonal effects of meteorological conditions. Likewise, there is little information on the fluctuations of these pollutants in mangrove areas, as well as the potential morphological and biochemical alterations in mangrove leaves throughout the year. Assessing the biological response of those organisms that are particularly affected by pollution is a powerful tool to evaluate environmental health because it provides robust indications about the various stress levels imposed on these organisms by air pollution [27]. In this sense, there is a gap in the knowledge about Rhizophora mangle as a bioindicator species to detect the impact of thermoelectric plant emissions and in the use of the morpho-functional traits of this species’ responses to these emissions.
The mangroves of the Tampamachoco Lagoon are suitable for assessing the effect of pollutants emitted by a thermoelectric plant located in the sandy bar bordering this coastal lagoon. Therefore, considering the importance of the ecological function of R. mangle, the global distribution of mangrove forests in intertropical regions, and their vulnerability to climate change and atmospheric pollutants, the aim of this research was to assess the effects of PM2.5 and PM10 and their associated trace metals emitted by CT-PALM on this umbrella species, mainly focusing on any potential morpho-biochemical impairment on their leaves under different meteorological conditions. The present study was carried out in two contrasting periods of the year (northerly-wind and dry seasons).
2. Materials and Methods
2.1. Study Area
The Tampamachoco Lagoon is located in the northern portion of the Gulf of Mexico slope (Figure 1), covering an area of 1500 ha [28]. The Thermoelectric Power Plant (CT-PALM), which uses fuel oil, is located on its sandy bar approximately at the middle point of the longitudinal axis of the lagoon. An extensive mangrove area covering approximately 3500 ha surrounds the Tampamachoco Lagoon, with tree height strata from 8 m to 15 m, composed of 4 mangrove species listed as threatened [29]: Rhizophora mangle L., (red mangrove), Avicennia germinans (L.) L. (black mangrove), Laguncularia racemosa (L.) C. F. Gaertn (white mangrove), and Conocarpus erectus L. (buttonwood mangrove) [21]. R. mangle, as an umbrella species [21], plays a central role in the stabilization of the coastal zone. The coastal zone, used as a nursery area for commercial species, is the habitat for several terrestrial and aquatic species; in addition, it is relevant for carbon sequestration and is a source of leaf litter, detritus, and organic matter for the mangrove-adjacent ecosystems [30]. Considering the key role of R. mangle in mangrove ecosystems, we used it as the study species to assess the effect of PM and trace metals associated with emission from the CT-PALM.
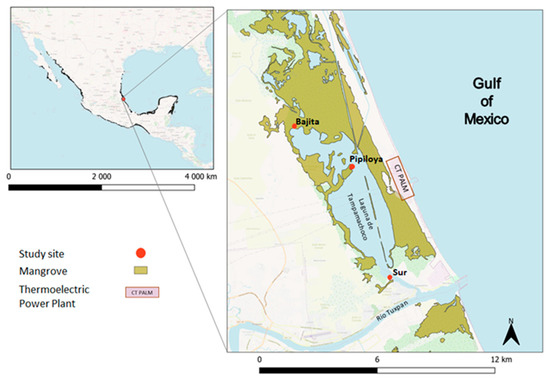
Figure 1.
Location of CT-PALM and study sites in the Tampamachoco Lagoon. Map uses data from the Comisión Nacional para el Conocimiento y Uso de la Biodiversidad (2021).
The Tampamachoco Lagoon was declared a Ramsar site (designation number 1602), as a wetland of importance for conservation, as it meets Ramsar conservation criteria 1, 2, 3, and 7 [28]. Coastal lagoons are particularly vulnerable to environmental changes for being relatively closed and protected habitats with limited seawater exchange [31]. Mangroves forests are classified as coastal wetlands and provide widely known ecosystem services such as flood control and wildlife refuge [32]. These forests serve as sinks for anthropogenic pollutants, acting on chemical speciation and, therefore, influencing the bioavailability of pollutants.
2.2. Meteorological Analysis, Pollutant Dispersion Modeling, and Monitoring Campaigns
In the meteorological analysis, a climograph (Figure A1) was produced; in addition, wind rose diagrams (Figure A2) were created with the R 4.2.1 software using information from the Tuxpan meteorological station of the National Meteorological Service-Automatic Meteorological Stations (SMN-ESMA). Additionally, pollutant dispersion maps were elaborated for the northerly wind and dry seasons using the free software Hybrid Single-Particle Lagrangian Integrated Trajectory (HYSPLIT) (Figure A3 and Figure A4).
The climate of the Tampamachoco Lagoon is classified as A(w2) (warm subhumid with summer rains) according to Köppen-García’s classification [33]. The mean annual temperature is 24.9 °C; January is the coldest month (mean 19.9 °C) and June the warmest month (mean 28.3 °C). The total annual precipitation is 1 341.7 mm; the dry season ranges from November to May and the rainy season from June to October. January is the driest month, with 33 mm, and July is the rainiest with 175.7 mm [34] (Figure A1). Tropical storms or hurricanes occur mainly from June to September, with wind gusts exceeding 120 km h−1. The predominant winds, locally known as “Nortes” (northerly winds), flow from the north in the cold season (October to February), reach 80 km h−1, and are accompanied by rain (Figure A2). From March to June, winds flow mainly from the south; known as southerly winds (Figure A2), these are warm and dry, reducing atmospheric humidity [28]; less intense winds from the north also flow in this period. During the northerly wind season (NWS hereafter), the emission plume from the CT-PALM flows in a southerly direction, producing a gradient of higher to lower concentration of atmospheric pollutants in this same direction; during the dry season (DS hereafter), the plume flows primarily to the north and produces a gradient opposite to the one observed in the NWS (Figure A2, Figure A3 and Figure A4).
Based on HYSPLIT modeling (the plume flow and gradient of pollutants) and meteorological analyses, we selected three study sites (Figure 1). One site (Bajita) was located to the northwest of CT-PALM, a point that may be unaffected by the emission plume during the northerly winds season (NWS hereafter) (Figure A3); the second (Pipiloya), in front of CT-PALM, and the third (Sur), to the southeast of CT-PALM, under the influence of the emission plume, mainly during the NWS (Figure A3). Likewise, we selected two periods of study based on the influence of wind direction (Figure A2), the period influenced by northerly winds (NWS) along with wet deposition in November (from 22 to 27 November 2021), and the period influenced by southerly and northerly winds (dry season, DS hereafter) in May (from 2 to 7 May 2022). This criterion considers changes in the direction of the plume flow (from north to south and vice versa during the NWS and DS, respectively) following the main wind direction (Figure A3 and Figure A4).
2.3. Monitoring
In each study period, atmospheric PM were sampled with an 8-stage impactor (Andersen TE-20-800) fitted with fiberglass filters (Gelman Sciences, Bloomfield Hills, MI, USA) adapted to a 7.9 cm diameter; the air suction flow rate was set at 22 L min−1. The impactor was placed at the Sur site because it works with electricity; it operated for 4 days at 24 h intervals. A portable weather station (Davis Vantage Pro2™ Wireless) was also installed, and the data collected were used for elaborating wind rose diagrams for each study period.
At each study, biological samples (R. mangle leaves) were collected manually wearing polyethylene gloves; 8 leaves per sampling point were collected from 3 branches at the middle stratum of the tree (mean height 2.50 m). Each leaf was placed in labeled Petri dishes. All samples were stored at approximately 4 °C for preservation during transport.
2.4. Trace Element Analysis
The filters used in the cascade impactor and the R. mangle leaves collected were processed by atomic absorption spectrophotometry in an Agilent model PSD120 graphite furnace at the Central Instrumentation Laboratory, ENCB-IPN. In the case of mangrove leaves, one gram (dry weight) of sample was analyzed. Samples were first digested separately and 50 mL of digested samples was obtained; then, each sample was filtered with Type-1 water and Whatman No. 40 filters 125 mm in diameter into 50 mL flasks. The spectrophotometry analysis was performed as per the Mexican standard NMX-AA-051-SCFI-2016 [35]. A high-purity standard (ICP-200.7-6 Solution A) was used to build the calibration curve, for quality control. Each metal was read at the wavelength shown in Table A1.
2.5. Total Chlorophyll
Chlorophyll was quantified in a circular fraction of each leaf. Circles were delineated using a template (Stenrot, S-14 circles) measuring 1 cm in diameter and the contour of the circle was cut with a stainless-steel dissecting knife. Chlorophyll content was determined according to the procedure proposed by Uka [36], at 663 nm and 646 nm for chlorophyll-a and chlorophyll-b, respectively, using a visible light spectrophotometry (spectrophotometer Hach® DR3900). The weight of each leaf disc was determined with an analytical balance (Ohaus, model PA214). Total chlorophyll was estimated with the following equation:
where A is the absorbance of the extract at a given wavelength, V is the total volume of the chlorophyll solution (mL), and W is the weight of the leaf disc (g).
Another fraction from the same leaf used for the laboratory tests described above was used for microscopy analyses according to the protocol proposed by Sierra [37]. In these analyses and the chlorophyll test, we used one leaf from each of the three branches in each study site (three leaves per study site).
2.6. Leaf Area
Leaf area was calculated with the software ImageJ 1.46r, as proposed by Rincón [38].
2.7. Microscopy (SEM-EDX)
Chemical composition analysis (micro-elemental analysis of Pb, Cd, Cr, Ni, Hg, and V) on the surface of R. mangle leaves was performed using scanning electron microscopy (SEM) with energy dispersive X-ray (EDX) analysis [39] with a microscope (FEI, model Quanta FEG 250) fitted with an EDS detector (Bruker, Billerica, MA, USA, model XFlash 6160) at the Center for Nanosciences and Micro and Nanotechnologies, Instituto Politécnico Nacional. Since the microscope operated in low vacuum, samples did not require preprocessing. Magnifications up to 8000x were performed while the accelerating voltage of the electron beam was set at 15 Kv to obtain signals from the K, L, and M transitions (for identification of heavy metals); the working distance to perform the SEM-EDX analysis was 10 mm.
We analyzed microscope images of the leaf underside. Images of stomata were recorded, and measurements of stomatal length and width were obtained with the software ImageJ 1.46r. Additionally, panoramic views were obtained for the enumeration of stomata per unit of leaf area following the procedure of Egas [19].
2.8. Statistical Analysis
The data were tested for significant differences in morphometric and biochemical characteristics between study sites for each study period. First, data homoscedasticity and normality were assessed; then, an ANOVA was performed for parametric data and Kruskal–Wallis tests for nonparametric data, with the results expressed as mean value ± standard error.
A principal component analysis (PCA) was performed for both study periods (NWS and DS) using a matrix with values of the variables studied: total chlorophyll, leaf area, stomatal density, stomatal length and width, trace elements on the surface of mangrove leaves, and carbon monoxide (CO) by site and study period; additionally, as supplementary variables, we included wind speed, frequency of calm periods (defined as wind speed equal to zero), wind direction (in Azimuth degrees), and plume emissions from the CT-PALM. The PCA was run with data standardized according to Ln (x + 1) and using Spearman’s correlation matrix. All statistical analyses were performed with the software XLSTAT ver. 2020.4.1 [40].
3. Results and Discussion
3.1. Meteorology and Air Pollution
During the NWS monitoring, the dominant winds flew from north to south, with wind speed values between 0 m s−1 and 4 m s−1 and peaks of 4 m s−1 to 6 m s−1 (Figure 2a), and with rains throughout the week. During the DS, the dominant winds flew from south to north and east, both with a lower frequency relative to the NWS; wind speed ranged from 0 m s−1 to 2 m s−1, and calm periods were frequent (37.4%) (Figure 2b).
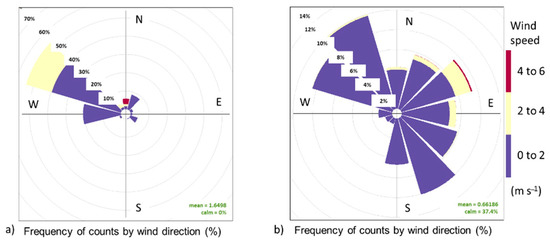
Figure 2.
Wind direction and intensity. (a) Northerly wind season, (b) dry season.
During the monitoring periods, there were contrasting meteorological conditions according to the season of the year. In the NWS, the emissions plume flew predominantly toward the Sur study site, while Bajita was the site least affected by CT-PALM emissions (Figure A3). On the other hand, during the DS, the emissions plume flew predominantly to the north (Figure 2b and Figure A4). Wind direction and intensity in both monitoring periods are important as both influence the dispersion of pollutants emitted by the CT-PALM stack, thus affecting the three sampling points differently. According to [41], their influence is related to the physical properties of the stack, such as its height, and the meteorological conditions that determine the dispersion of the PM plume.
The PM concentrations recorded with the cascade impactor at Sur in the NWS showed the effect of the wet deposition and strong winds recorded in that period. In the DS, lower wind speed and calm periods were recorded, which led to the highest atmospheric PM10 and PM2.5 concentrations (57.92 µg m−3 and 54.87 µg m−3, respectively). In addition, pasture burning near the Sur site was recorded in the dry season, which likely contributed to further increased atmospheric PM levels. Our findings coincide with the pattern described in the literature. For example, a study by Mues [42] in Europe during the summer revealed that low wind speed, low precipitation, and high temperature favor the accumulation of pollutants in the lower troposphere. Likewise, Arrieta [43] stated that low wind speed causes lower PM transport and dispersion, favoring higher atmospheric concentrations. Separately, fine particles have half-lives in the atmosphere in the order of days to weeks and travel distances of 100 km or more, while coarse particles are deposited quickly, with half-lives in the atmosphere of only minutes, so their concentrations show a greater spatial variability within the same region [9]. On the other hand, stronger winds can lead to greater evaporative loss and indirectly reduce PM2.5 concentrations [44].
3.2. Trace Elements in Glass Fiber Filters
During the NWS (Table 1), the trace element with the highest percent concentration in air was V, with 2.4037 µg·m−3 and 1.9965 µg·m−3 in the coarse and fine PM fractions, respectively, followed by Cr (1.0085 µg·m−3 and 0.7828 µg·m−3, respectively). In the DS (Table 1), V had a higher percent concentration in air (1.4962 µg·m−3 in the fine fraction), followed by Cr, with 0.7008 µg·m−3 in the fine fraction (Table 1).

Table 1.
Concentration of trace elements in PM10 and PM2.5 collected in glass fiber filters during the two study periods (NWS and DS).
The chemical composition of PM is strongly associated with its source emission [12]. The concentration of the main metallic elements found and associated with incomplete fuel oil combustion is 82 ppm (V), 55 ppm (Ni), 10 ppm (Hg), 2.3 ppm (Pb), 1.3 ppm (Cr), and 0.1 ppm (Cd). The concentration of Cd, Cr, Ni, Pb, and V increases with smaller particle sizes (~2.4 µm) [13]. The chemical analysis of impactor glass fiber filters detected trace elements in the atmosphere associated with fuel oil burning. V showed the highest concentration in both monitoring campaigns and in both fractions; in the NWS, V concentration in the coarse fraction was 0.9 µg m−3, followed by Cr, Ni, and Pb. It should be considered that the impactor used for collecting PM samples was installed at the Sur site. Therefore, during the DS, when the predominant winds were flowing from south to north, at lower speeds and frequencies than in the NWS, a decrease in all trace elements in the atmosphere was observed compared to the NWS. Furthermore, in the NWS, rains favor a greater wet deposition of CT-PALM emissions.
3.3. Analysis of Trace Elements in Mangrove Leaves
The atomic absorption analysis showed that in the NWS, vanadium (V) attained the highest mean concentration in leaves in the 3 study sites: Pipiloya, with a 9.37 ± 4.22 µg g−1 (mean ± SE), followed by Bajita and Sur, with 6.9 ± 0.86 µg g−1 and 4.07 ± 0.34 µg g−1, respectively (Figure 3a). In the DS, V was also the element with the highest mean concentration in Pipiloya (35.55 ± 9.99 µg g−1), followed by Cr in Bajita and Pipiloya, with 29.22 ± 27.8 µg g−1 and 20.59 ± 6.71 µg g−1, respectively. In fact, V concentrations in Pipiloya during the DS were the highest, being significantly different from all study sites in both seasons (Tukey, p < 0.025) (Figure 3b).
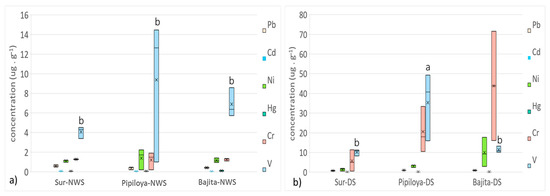
Figure 3.
Spatial and temporal variations in the concentration of trace elements analyzed in leaves of R. mangle from each study site. (a) Northerly wind season, (b) dry season. Different letters indicate a significant difference (Kruskal–Wallis test). Different letters represent significant differences at p < 0.05 probability level.
Atomic absorption spectrophotometry of leaves revealed the presence of trace elements associated with fuel oil burning. Pipiloya, the island in front of the CT-PALM, showed the highest mean V concentration (12.6 µg g−1), followed by Ni. In addition, microscopy analysis (SEM-EDX, under vacuum) confirmed that PM is deposited on leaves, where particles corresponding to the fine fraction were observed. The Sur site had the highest Pb, Ni, V, Cd, and Hg levels, which were found more frequently on the underside than on the beam during the NWS. In the DS, V was found only on the beam of leaves collected in the Pipiloya site. This difference in concentrations between seasons and sampling sites is related to particle size and local meteorology. Notably, these trace element concentrations can be taken up by plants when PM is absorbed by the stomata [19].
Microscopy Analysis of Trace Elements on the Surface of Mangrove Leaves
In the NWS, trace elements were detected on the surface of mangrove leaves from the three study sites, with Sur having the highest levels of trace elements compared to the other sampling sites. The estimated total percentage levels (by weight) were 0.03% for Ni, 0.22% for Pb, 0.03% for V, and 0.025% for Hg (Figure 4a,b). In Bajita, the percent value of Pb was 0.20% (Figure 4c). The highest percentage values of Cd were found in Pipiloya (0.42%) (Figure 4d). In the DS (Figure 4e), percent levels of trace metals were only observed in Pipiloya, where a conglomerate of particles was found in the leaf bundle, and 0.7% of V was recorded.
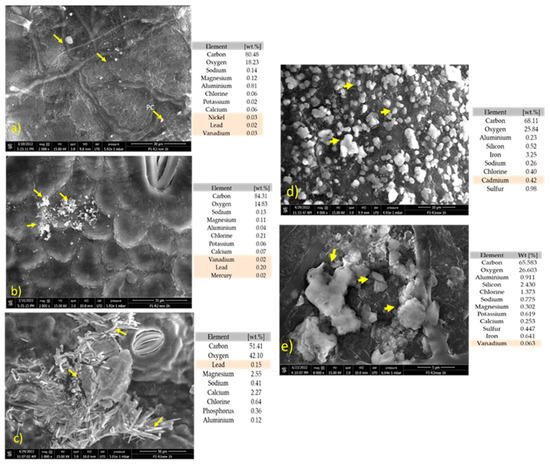
Figure 4.
SEM-EDX microscopy with a qualitative analysis of the percentage of trace elements (by weight). (a) Sur site during the NWS, magnification of a particle cluster on the leaf beam, SEM 2000×; (b) Sur site during the NWS, magnification of a particle cluster on the leaf underside, SEM 2000×; (c) Bajita site during the NWS, magnification of a particle cluster on the leaf underside, SEM 1000×; (d) Pipiloya site during the NWS, magnification of particles on a leaf beam, SEM 4000×; (e) Pipiloya site during the DS, magnification of a particle cluster on the leaf beam, SEM 8000×. (Note: yellow arrows indicate some of the particles in the particle cluster analyzed).
The findings detailed above confirm the presence of trace elements from the burning of fuel oil on mangrove leaves. These findings are consistent with the results of the modeling of the pollutant plume, where in the NWS (Figure A3) the Sur site had the highest frequency of impact and was the site with the highest levels of trace elements on the surface of mangrove leaves. Likewise, in the DS (Figure A4), the modeling yielded a higher frequency of impact at Pipiloya. This finding coincides with the findings of the microscopy analyses of leaves, where Pipiloya was the only study site where we found a trace element typical of emissions from fuel oil burning.
3.4. Biological and Morpho-Anatomical Analysis
3.4.1. Total Chlorophyll (Chl), Chlorophyll a and b, and Chl a/Chl b Ratio
In the NWS, total chlorophyll reached the highest values (mean ± SE) at the Bajita site (76 ± 21 µg g−1) and the lowest at the Sur site (14 ± 2.27 µg g−1) (Figure 5a). Significant differences were found between Bajita and Sur (Kruskal–Wallis, p = 0.018). For the DS, Bajita showed the highest total chlorophyll value, with 94 ± 4.73 µg g−1, while in Pipiloya, it increased to 77 ± 11.86 µg g−1. In general, the trend observed in both monitoring periods was a decrease in total chlorophyll from the north to south (i.e., from Bajita to Sur). Significant differences were found seasonally in Sur (NWS) relative to Pipiloya (DS; Kruskal–Wallis, p = 0.043) and Bajita (DS; Kruskal–Wallis, p = 0.002).
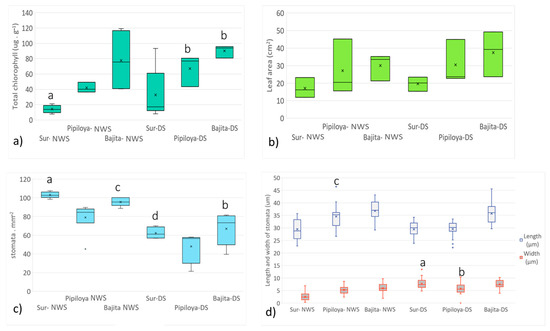
Figure 5.
Spatial and temporal variations in the mangrove leaf parameters measured. (a) Total leaf chlorophyll (µg g−1); (b) leaf area (cm2); (c) stomatal density (stomata mm−2); (d) stomatal length and width (µm). Different letters indicate a significant difference (Kruskal–Wallis test). Different letters represent significant differences at p < 0.05 probability level.
A case study on mangroves exposed to pollution from a port and a thermoelectric plant in Guayaquil showed a decrease in chlorophyll levels in leaves of R. harrisoni collected at sampling points closer to the most polluted sites [37]. During leaf collection, we observed that Sur has the greatest anthropogenic impact, not only of the thermoelectric plant emissions, but also due to the expansion of the urban area and the presence of urban waste. In Pipiloya, an island located in front of the CT-PALM, fishers come to rest, and urban waste is observed.
Our results for chlorophyll a and b are shown in Table 2. The lowest Chl a levels in the NWS corresponded to Pipiloya (165 ± 13.09 µg·g−1), while Sur showed the lowest Chl b content (83 ± 11.49 µg·g−1), and Bajita had the highest Chl a and b content (385 ± 58.47 and 206 ± 76.85 µg·g−1, respectively). In the DS, Sur attained the lowest Chl a and b levels (270 ± 71.64 and 116 ± 33.64 µg·g−1). The Chl a/Chl b ratio in green leaves was found to decrease gradually with the duration of exposure to direct sunlight [45]; in this sense, it is worth mentioning the conditions in the Sur, where mangrove trees were cleared for urbanization. This contrasts with the other two sites studied, particularly Bajita, a site located to the north and away from any human activity, where the mangrove forest was denser. The increase in the Chl a/Chl b ratio between seasons may be associated with the meteorological conditions, as in the NWS the sky was clouded most of the day during the study period, whereas in the DS the sky was clear over the whole study period.

Table 2.
Differences in chlorophyll (Chl) content (a and b) and Chl a/Chl b ratio.
On the other hand, Zening and Munzuroglu [46] found an increase in the Chl a/Chl b ratio in plants exposed to heavy metals such as Pb, Cd, Cu, and Hg, suggesting that this response is associated with an increase in the antioxidants α-tocopherol, retinol, and ascorbic acid, which protect from oxidative stress caused by metals and, consequently, favor a higher Chl a/Chl b ratio. In our study, we detected higher trace metal concentrations in the Sur site, coinciding with the site with the higher Chl a/Chl b ratio.
Additionally, a lower chlorophyll content may produce a decrease in photosynthesis, biomass production, net primary production, and even affect gross primary production in the long term [47,48].
D’Addazio [49] pointed out that, although metal uptake by mangrove trees translates into short-term bioremediation, the long-term decrease in carbon uptake and primary productivity may reduce or outweigh ecosystem services provided by mangrove forests, including metal uptake.
3.4.2. Morpho-Anatomical Analysis
Leaf area was highest at Bajita (33 ± 4.40 cm2 and 39 ± 7.43 cm2 in the NWS and the DS, respectively). On the other hand, Sur showed lower values (16 ± 3.29 cm2 and 20 ± 2.33 cm2 in the NWS and the DS, respectively). Although these differences were not statistically significant, a trend of decreasing leaf area was observed from north to south (i.e., from Bajita to Sur) (Figure 5b). Our results are consistent with those of Poukhabbaz [50], who found that leaf area decreased in oriental plane trees (Platanus orientalis) in urban areas, due to atmospheric pollution, compared with trees in rural areas in India. González [22] suggested that the reduced development of R. mangle leaves adjacent to the Tampamachoco Lagoon may have resulted from the constant anthropogenic impacts in this area, along with atmospheric pollution and the presence of heavy metals.
The examination of stomata on the underside of leaves revealed that during the NWS, stomatal density was highest in all study sites; at the Sur site, we detected higher trace metals (103 ± 1.39 stomata mm−2) (Figure 5c). In this study period, significant differences were found between Pipiloya and Sur (Kruskal–Wallis, p = 0.011). On the other hand, during the DS, Bajita showed the highest stomatal density, with 73 ± 7.80 stomata mm−2. Pipiloya showed the lowest stomatal density in both seasons. Statistically significant differences in stomatal density between seasons were observed in Bajita and Sur (Kruskal–Wallis, p = 0.021 and p = 0.001, respectively). Stomatal density differed between Bajita in the DS and Sur in the NWS, while Pipiloya in the DS differed from Sur in the NWS (Kruskal–Wallis, p < 0.0001) and from Bajita in the NWS (Kruskal–Wallis, p = 0.002). Bruno [51] reported that stomatal density decreases when the epidermis is protected by trichomes, which act as filters, preventing the uptake of particles through stomata. It is worth mentioning that in the leaves sampled, trichomes were not found on the leaf underside or the beam.
Stomatal length showed the highest value in Bajita (Figure 5d) in both monitoring periods (37 ± 0.86 µm in the NWS and 36 ± 0.94 µm in the DS). Pipiloya showed significant differences between the study periods (Tukey, p < 0.0001), with stomata being longer in the NWS. Likewise, stomata of leaves collected from Pipiloya were longer than those from Sur in the NWS (Tukey, p < 0.0001). As for stomatal width, Bajita reached the greatest value in the NWS, with 6 ± 0.48 µm, while Sur showed the lowest, with 3 ± 0.34 µm. In the DS, Sur showed the widest stomata, with 7 ± 0.44 µm, while Pipiloya had the narrowest, with approximately 6 ± 0.55 µm. During the DS, stomatal width at Pipiloya was significantly different from the other 2 study sites (Tukey, p < 0.0001). Stomatal width at Sur differed between study periods, being greater in the DS (Tukey, p < 0.0001).
Stomatal density and chlorophyll concentrations were related seasonally. The highest stomatal density was observed in the NWS in all study sites, while chlorophyll showed a decreasing concentration gradient from Bajita to Sur, with the lowest chlorophyll concentrations in Sur and the highest in Bajita in both seasons and with higher concentrations in the DS versus the NWS (Figure 6). Our results are consistent with those of Bruno [51], who stated that plants exposed to atmospheric pollution, which respond by reducing chlorophyll production, likely compensate for this response by increasing the number of stomata. The lower chlorophyll level may reflect higher chlorophyllase activity, one of the factors influencing chlorophyll concentration in plants. Joshi and Swami [52] have also reported decreases in chlorophyll content caused by acid pollutants such as SO2, which promotes the production of phaeophytin from chlorophyll acidification. These authors have also reported lower chlorophyll content in various crop plants after exposure to SO2 and O3. In this respect, we cannot rule out the potential impact on R. mangle of other polluting gases emitted by the CT PALM. However, our study focused on evaluating the impact of heavy metals associated with PM emitted from oil fuel burning, which are not part of the gaseous phase when emitted to the atmosphere; therefore, the present work addressed atmospheric PM only.
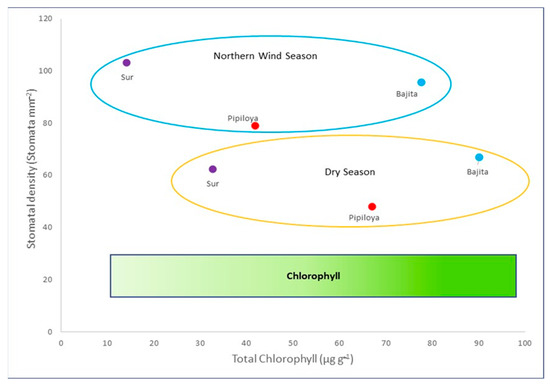
Figure 6.
Relationship between total chlorophyll concentration and stomatal density showing a seasonal gradient of stomatal density and a spatial gradient of chlorophyll concentrations.
In this sense, the effects of PM deposited on leaves are related to the acidity, salinity, nutrients, trace metal content, and surfactant properties of particles; their effects on foliar processes are negligible, if any, except when exposure is considerably high, causing reduced growth [19]. Specifically, PM deposited on leaves can cause abrasion and radiative heating; these reduce the flow of photosynthetically active photons reaching photosynthetic tissues and obstruct leaf stomata, affecting gas exchange and physiological activity [19].
PM contains trace elements (heavy metals) which cause oxidative stress in plants, degrade chlorophyll molecules, and reduce the efficiency of chloroplasts; altogether, these affect the photosynthetic rate and ultimately reduce growth rate [17,53,54]. In most plants, cadmium toxicity produces two recognizable symptoms: leaf chlorosis and reduced root growth rate [53,54]. In the present study, low total chlorophyll concentrations were recorded for the Sur site in both study periods; additionally, the microscopy analyses showed particulate matter obstructing the stomata.
Chaudhary [55] reported that the stomatal index was higher in a heavily polluted site than in low-pollution sites. Dust deposited on the leaf surface limits gas exchange. A higher stomatal index suggested an increased area for gas exchange. A higher stomatal index in Ficus benghalensis indicates its adaptability to high dust loads. Under controlled conditions, photosynthesis, growth, and biomass of mangrove plants decrease due to the effect of trace pollutants, ultimately leading to increased mortality [26]. These observations are consistent with the results of the present study. The Sur sampling site—which shows the influence of the plume emissions in the NWS and displays the heaviest disturbance—recorded the lowest chlorophyll content, along with a lower leaf area and higher stomatal densities in the two seasons. Smaller stomata display a faster dynamic; i.e., stomata open and close faster, and thus can respond more rapidly to environmental changes; as a result, the long-term water use efficiency improves and the risk of disruption of leaf hydraulics is reduced [56]. Several authors [57,58,59] stated that lower Cd treatments stimulated chlorophyll synthesis in Lonicera japonica Thunb and Bechmeria nivea (L.) Gaud. This was explained as resulting from an increase in the antioxidant activity represented by the ascorbate–glutathione pathway along with an increase in chlorophyll content, which has been considered a compensatory response. The present study found that in sites with lower total chlorophyll and higher stomatal density, stomata are smaller in length and width, which, according to Bruno [51], can be explained as a response to a lower chlorophyll content. Additionally, a higher number of stomata and lower chlorophyll levels were associated with smaller stomata, which could be an adaptation to the stress caused by atmospheric pollution in the area and anthropogenic pollution in general.
3.5. PM and Trace Elements and Their Relationship with the Biological and Morphological Characteristics of Mangrove Leaves
The PCA of study sites and seasons facilitates detecting spatial and temporal patterns (gradients) from the relationships (by correlation analysis) between the variables analyzed (trace metals on the surface of mangrove leaves, leaf characteristics, wind direction, plume emissions, wind speed, and frequency of calm periods) in both study periods. The bootstrap hulls diagram (Figure 7a) shows the similarity between study sites and periods. The Sur site in the NWS displayed the highest dissimilarity; by contrast, Bajita in both periods (the DS and NWS) and Pipiloya in the NWS are more similar to each other. Pipiloya and Sur in the DS were part of a different cluster (Figure 7a).
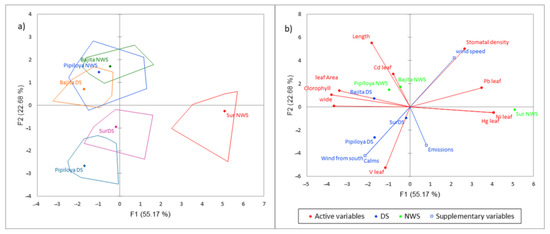
Figure 7.
Principal component analysis for the NWS, the DS, and study sites (axes F1 and F2: 77.84% of the explained variance). (a) Bootstrap hulls, (b) PCA biplot.
In the PCA biplot, study sites were scattered along the environmental gradients of the variables analyzed for each season. In the NWS, meteorological conditions were characterized by strong winds flowing from north to south, and plume emissions were transported predominantly to the south. In this season, the study sites were scattered along a gradient characterized by high Ni, Hg, and Pb concentrations, reaching peak levels on mangrove leaves positioned at the right quadrant where the Sur site (the site towards which the emission plume was transported) is located. The study sites Bajita and Pipiloya showed the opposite conditions, with the lowest Ni, Hg, and Pb concentrations and the highest values of leaf area, chlorophyll concentration, and stomata length and width. Particularly, Bajita in the NWS had the highest Cd concentrations on leaves and the highest stomata length. This environmental gradient separated Sur as the most affected site due to the wind direction transporting the emission plume and its trace elements to the south. By contrast, Bajita and Pipiloya were the least affected sites, showing better leaf traits.
In the DS, characterized by a high frequency of calm periods, lower wind speed, and winds flowing from south to north, the study sites were clustered according to a different environmental gradient. Pipiloya and Sur had the highest V concentrations and the lowest stomatal density on mangrove leaves, while Bajita had the lowest V concentration on the mangrove leaf surface and showed higher leaf area, chlorophyll, and stomatal length and width (Figure 7b).
This analysis showed that meteorological conditions (wind direction, frequency of calm periods, and wind speed) regulate the seasonal and spatial trends of trace elements on the surface of mangrove leaves and the responses in terms of leaf traits. The relationships show that in both seasons, Sur was the most affected site by the deposition of trace metals related to fuel oil combustion, with mangrove leaves displaying impairments in morpho-biochemical traits, while Bajita displayed better morpho-biochemical traits in both seasons. Furthermore, the DS affected two study sites (Sur and Pipiloya) due to the low wind speed and increased frequency of calm periods, which caused a higher deposition of V on leaves; however, the NWS led to wet deposition of trace metals (particularly Hg, Ni, and Pb), which showed higher concentrations at the Sur study site.
The mechanisms related to the detected gradient on mangrove responses are integrated in the HYSPLIT model, which incorporates wind speed and direction to produce transport scenarios of emissions from the thermoelectric plant. For the Tampamachoco lagoon, we identified a north-to-south transport of emissions during the NWS (generating a gradient of emissions in the same direction) and in the opposite direction during the DS. Leaves of mangrove responses were consistent with these scenarios. Additionally, rains during the NWS favored wet deposition.
Weeberb [60] points out that, given the PM formation and removal mechanisms and its diverse components, the impacts of climate on PM are more complex than on other atmospheric pollutants; for example, atmospheric particles are effectively eliminated by wet deposition (particles eliminated by clouds or rain). In Tampamachoco Lagoon during the NWS, precipitation led to wet deposition of PM (and metal associated) on mangrove leaves.
In view of the environmental issues that arise from conventional thermoelectric plants in Latin America, there is currently a trend towards the conversion to combined-cycle plants [3,4]. Particularly for the CT-PALM, there is a proposal to build a combined-cycle thermoelectric power plant that is expected to reduce PM emissions by up to 46% [61].
Another alternative to reduce PM emissions is the installation and correct operation of emission control equipment, such as electrostatic precipitators [62], aiming to significantly reduce the emission levels of pollutants currently impacting the region.
4. Conclusions
The emissions plume produced by the CT-PALM generates a north-to-south gradient impact on the mangrove forest in the Tampamachoco Lagoon. Meteorological conditions play a critical role in the movement of the emissions plume, where the speed and wind direction are the promoters of the emission plume gradient. Additionally, the NWS season poses the greatest risk for Rhizophora mangle due to rains favoring the highest trace metal deposition on the surface of mangrove leaves. The metals Pb, Ni, V, and Hg were associated with PM from plume emission. The damage in morpho-functional traits of R. mangle related to PM impacts essential physiological functions such as photosynthesis and gas exchange. Stomatal and density metrics and morphology of leaves were also affected, which imperils its role as umbrella species. In the long term, this could provoke a decrease in net and gross primary production in the mangrove forest. To mitigate the observed impacts modifying the CT-PALM to a combined-cycle thermoelectric power plant could reduce PM emissions.
Author Contributions
Conceptualization, E.L.-L., H.A.B.-H. and M.A.-C.; methodology, E.L.-L., H.A.B.-H. and M.A.-C.; validation, H.A.B.-H. and M.A.-C.; formal analysis, E.L.-L., H.A.B.-H., M.A.-C. and J.E.S.-D.; investigation, M.A.-C.; resources, E.L.-L., H.A.B.-H. and J.E.S.-D.; data curation, M.A.-C.; writing—original draft preparation, M.A.-C.; writing—review and editing, E.L.-L.; visualization, M.A.-C. and J.E.S.-D.; funding acquisition, E.L.-L. and H.A.B.-H. All authors have read and agreed to the published version of the manuscript.
Funding
This research was funded by Secretariat for Research and Graduate Studies (Grant Nos. SIP- 20231961, 20231990, and 20221008) and “The APC was funded by SIP”.
Institutional Review Board Statement
Not applicable.
Informed Consent Statement
Not applicable.
Data Availability Statement
The raw data supporting the conclusions of this article will be made available by the authors, without undue reservation.
Acknowledgments
María Elena Sánchez-Salazar edited the English manuscript. Mario Molina Center for Strategic Studies on Energy and Environment for facilitating the use of low-cost sensors in field work.
Conflicts of Interest
The authors declare no conflict of interest. The funders had no role in the design of the study; in the collection, analyses, or interpretation of data; in the writing of the manuscript; or in the decision to publish the results.
Appendix A

Figure A1.
Climograph of the Tuxpan de Rodríguez Cano weather station (20.95972° N, 97.41722° W), with data from the Servicio Meteorológico Nacional (National Weather Service).
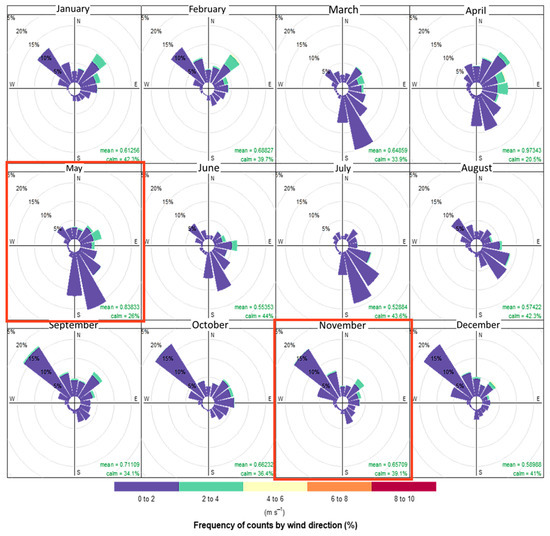
Figure A2.
Wind rose in the Tampamachoco Lagoon for each month of the year 2020, with frequency of counts by wind direction in percentage (%) and wind speed in m s−1 (scale at the bottom). Created by the authors with data from the National Weather Service.
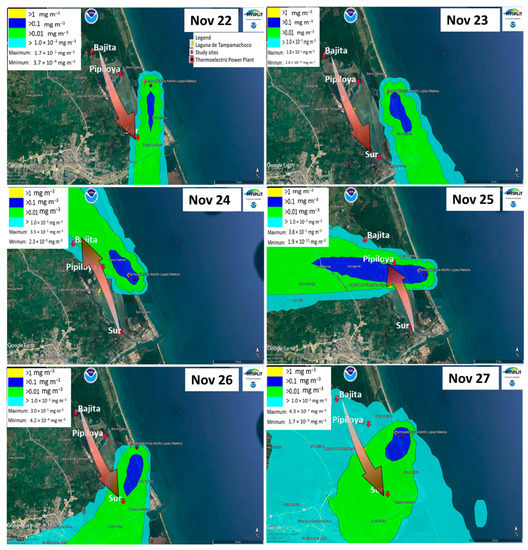
Figure A3.
Dispersion of CT-PALM emissions from the last weeks of northerly wind season using the HYSPLIT software. On the scale, yellow represents values >1 mg m−3; dark blue, >0.1 mg m−3; green, >0.01 mg m−3; and light blue, >1.0−0.03 mg m−3. The arrow indicates the concentration gradient in the study sites, specific for each day, according to the dispersion of the emissions.
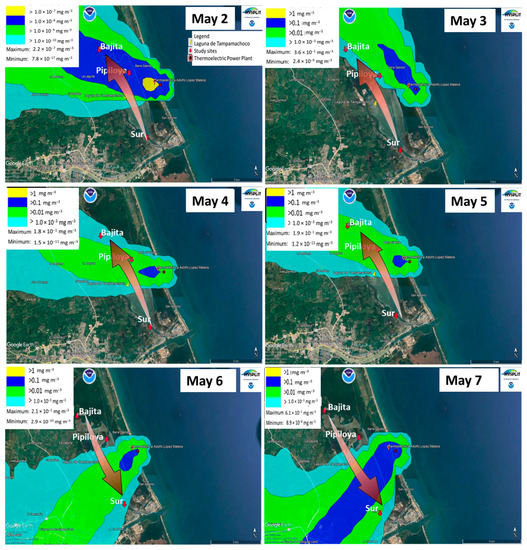
Figure A4.
Dispersion of CT-PALM emissions during the last weeks of the dry season using the HYSPLIT software. On the scale, yellow represents values >1 mg m−3; dark blue, >0.1 mg m−3; green, >0.01 mg m−3; and light blue, >1.0 −0.03 mg m−3. The arrow indicates the concentration gradient in the study sites, specific for each day, according to the dispersion of the emissions.

Table A1.
Wavelengths for the determination of heavy metals by atomic absorption spectrophotometry [63,64,65,66].
Table A1.
Wavelengths for the determination of heavy metals by atomic absorption spectrophotometry [63,64,65,66].
| Metal | λ (nm) |
|---|---|
| Cd | 228.8 |
| Cr | 357.9 |
| Hg | 253.7 |
| Ni | 232 |
| Pb | 283.3 |
| V | 318.5 |
References
- CEC (Commission for Environmental Cooperation). Atmospheric Emissions from Power Plants in North America; CEC: Montreal, QC, Canada, 2011; ISBN 978-2-89700-011-0. [Google Scholar]
- De Lara, S.; Castelo, L.; Ramón, I.; Cristín, M.; Chávez, J.; Hernández, H.; Montero, J.; Vázquez, M. Modernization of control systems for turbogas-type generating units. Energy Transit. 2019, 1, 2–11. [Google Scholar]
- Reyer, C.; Albrecht, T.; Baarsch, F.; Boit, A.; Canales, N.; Cartsburg, M.; Coumou, D.; Eden, A.; Fernandes, E.; Langerwisch, F.; et al. Climate change impacts in Latin America and the Caribbean and their implications for development. Reg. Environ. Chang. 2017, 17, 1601–1621. [Google Scholar] [CrossRef]
- Bermúdez, L.A. Stranded Energy? Mapping Latin America’s Thermoelectric Plants. Available online: https://dialogochino.net/es/clima-y-energia-es/38222/ (accessed on 7 February 2023).
- OLADE. Energy Panorama of Latin America and the Caribbean 2020, Energy Prospective Chapter; OLADE: Quito, Ecuador, 2020; 353p. [Google Scholar]
- CFE (Comisión Federal de Electricidad). Thermoelectric. CFE Website. Available online: https://web.archive.org/web/20110427213556/http://www.cfe.gob.mx/QuienesSomos/estadisticas/listadocentralesgeneradoras/Paginas/Termoelectricas.aspx (accessed on 25 April 2023).
- Cedula de Operación Anual (COA). Registro de Emisiones y Transferencia de Contaminantes (RETC) Para Establecimientos de Jurisdicción Federal; Gobierno de Mexico: Mexico City, Mexico, 2021. [Google Scholar]
- EPA (United States Environmental Protection Agency). Chapter 1: External combustion Sources. 1.3 Fuel oil Combustion. Table 3.1-1. AP 42, Fifth ed.; Volume I. Available online: https://www.epa.gov/sites/default/files/2020-09/documents/1.3_fuel_oil_combustion.pdf (accessed on 24 April 2023).
- López, M. Application of the CALPUFF Dispersion Model for the Estimation of PM2.5 Concentrations. Master’s Thesis, National Autonomous University of Mexico, Mexico City, Mexico, 2009. [Google Scholar]
- Muriel-García, M.; Cerón-Bretón, R.; Cerón-Betrón, J. Air Pollution in the Gulf of Mexico. Open J. Ecol. 2016, 6, 32–46. [Google Scholar] [CrossRef]
- EPA (United States Environmental Protection Agency). Particulate Matter (PM) Basics. EPA. Available online: https://www.epa.gov/pm-pollution/particulate-matter-pm-basics#PM (accessed on 9 September 2021).
- Finlayson-Pitts, B.J.; Pitts, J.N. Chemistry of the Upper and Lower Atmosphere: Theory, Experiments and Applications; Academic Press: San Diego, CA, USA, 2000. [Google Scholar]
- Vouk, B.; Warren, T. Metallic elements in fossil fuel combustion products: Amounts and form of emissions and evaluation of carcinogenicity and mutagenicity. Environ. Health Perspect. 1983, 47, 201–225. [Google Scholar] [CrossRef] [PubMed]
- William, P.; Miller, A.; Wendt, J. Fine particle emissions from residual fuel oil combustion: Characterization and mechanisms of formation. Proc. Combust. Inst. 2000, 28, 2651–2658. [Google Scholar]
- WHO. New WHO Global Air Quality Guidelines Aim to Prevent Millions of Deaths Due to Air Pollution [Press Release]. 22 September 2021. Available online: https://www.who.int/es/news/item/22-09-2021-new-who-global-air-quality-guidelines-aim-to-save-millions-of-lives-from-air-pollution (accessed on 14 March 2023).
- Jiang, N.; Liu, X.; Wang, S.; Yu, X.; Yin, S.; Duan, S.; Wang, S.; Zhang, R.; Li, S. Pollution Characterization, Source Identification, and Health Risks of Atmospheric-Particle-Bound Heavy Metals in PM10 and PM2.5 at Multiple Sites in an Emerging Megacity in the Central Region of China. Aerosol Air Qual. Res. 2019, 19, 247–271. [Google Scholar] [CrossRef]
- Hubai, K.; Kováts, N.; Teke, G. Effects of urban atmospheric Particulate Matter on higher plants using Lycopersicon esculentum as model species. SN Appl. Sci. 2021, 3, 770. [Google Scholar] [CrossRef]
- Guo-Feng, J.; Brodribb, T.; Roddy, A.; Jin-Yan, L.; Huai-Tong, S.; Pahadi, P.; Yong-Jiang, Z.; Kun-Fang, C. Contrasting Water Use, Stomatal Regulation, Embolism Resistance, and Drought Responses of Two Co-Occurring Mangroves. Water 2021, 13, 1945. [Google Scholar] [CrossRef]
- Egas, C. Biological Characteristics of Urban Trees To Contribute with New Criteria for Tree Species Selection. Master’s Thesis, Environmental Management and Planning, Santiago, Chile, 2017. [Google Scholar]
- Ledesma, C. Bioaccumulation and Effects of Trace Metals by Dry Deposition on Leaves of Ligustrum sp. and Juniperus sp. Master’s Thesis, Environmental Science, Toluca, Mexico, 2014. [Google Scholar]
- Vicencio, F. Rhizophora mangle Linnaeus, 1753 as an umbrella species and biological rationale for the protection and restoration of the Tampamachoco lagoon, Veracruz, Mexico. BIOCYT Biol. Cienc. Tecnol. 2012, 5, 341–352. [Google Scholar]
- González-Sánchez, R.; López-Herrera, M.; Monks, S.; Elorza-Martínez, P. Differences in the foliar characteristics of Rhizophora mangle Linn. in two mangrove zones of Tuxpan, Veracruz. Biol. Agropecu. 2016, 4, 38–44. [Google Scholar]
- Paz-Alberto, A.; Celestino, A.; Sigua, G. Phytoremediation of Pb in the sediment of a mangrove ecosystem. J. Soils Sediments 2014, 14, 251–258. [Google Scholar] [CrossRef]
- Kaewtubtim, P.; Meeinkuirt, W.; Seepom, S.; Pichtel, J. Heavy metal phytoremediation potential of plant species in a mangrove ecosystem in Pattani bay, Thailand. Appl. Ecol. Environ. Res. 2016, 14, 367–382. [Google Scholar] [CrossRef]
- Rahman, M.S.; Hossain, M.B.; Babu, S.O.F.; Rahman, M.; Ahmed, A.S.; Jolly, Y.N.; Choudhury, T.R.; Begum, B.A.; Kabir, J.; Akter, S. Source of metal contamination in sediment, their ecological risk, and phytoremediation ability of the studied mangrove plants in ship breaking area, Bangladesh. Mar. Pollut. Bull. 2019, 141, 137–146. [Google Scholar] [CrossRef] [PubMed]
- Maiti, S.; Chowdhury, A. Effects of Anthropogenic Pollution on Mangrove Biodiversity: A Review. J. Environ. Prot. 2013, 4, 1428–1434. [Google Scholar] [CrossRef]
- Nakazato, R.K.; Esposito, M.; Cardoso-Gustavson, P.; Bulbovas, P.; Pedroso, A.; Lembo, P.; Assis, S.; Domingoa, M. Efficiency of biomonitoring methods applying tropical bioindicator plants for assessing the phytoxicity of the air pollutants in SE, Brazil. Environ. Sci. Pollut. Res. 2018, 25, 19323–19337. [Google Scholar] [CrossRef] [PubMed]
- Basáñez, A. Ramsar Wetlands Information Sheet (FIR); Faculty of Biological and Agricultural Sciences, Universidad Veracruzana: Veracruz, Mexico, 2005; p. 14. [Google Scholar]
- SEMARNAT (Secretaría de Medio Ambiente, Recursos Naturales y Pesca). Protección Ambiental–Especies Nativas de México de Flora y Fauna Silvestres—Categorías de Riesgo y Especificaciones Para Su Inclusión, Exclusión o Cambio. Lista de Especies en Riesgo; Norma Oficial Mexicana (NOM-059-SEMARNAT-2010); Diario Oficial; Gobierno de Mexico: Mexico City, Mexico, 2010. [Google Scholar]
- DeYoe, H.; Lonard, R.I.; Judd, F.W.; Stalter, R.; Feller, I. Biological Flora of the Tropical and Subtropical Intertidal Zone: Literature Review for Rhizophora mangle L. J. Coast. Res. 2020, 36, 857–884. [Google Scholar] [CrossRef]
- Herbert, R.J.; Ross, K.; Whetter, T.; Bone, J. Maintaining Ecological Resilience on a Regional Scale: Coastal Saline Lagoons in a Northern European Marine Protected Area. In Marine Protected Areas: Science, Policy and Management; Humphreys, J., Clark, R.W.E., Eds.; Elsevier: Amsterdam, The Netherlands, 2020; pp. 631–647. [Google Scholar]
- Velázquez, S. Mangroves of Mexico. Update and Analysis of 2020 Data; National Commission for the Knowledge and Use of Biodiversity: Mexico City, Mexico, 2021; p. 168. [Google Scholar]
- García, E. Modifications to Koppen’s Climatic Classification System, 5th ed.; UNAM: Mexico City, Mexico, 2004; p. 52. [Google Scholar]
- INEGI. Estado de Veracruz. Cuaderno Estadístico Municipal; Gobierno del Estado de Veracruz e Instituto Nacional de Estadística Geografía e Informática: Tuxpan, Mexico, 2001; 180p. [Google Scholar]
- Government of México. Available online: https://docplayer.es/68594902-Norma-mexicana-nmx-aa-051-scfi-2016.html (accessed on 10 February 2023).
- Uka, U. Roadside air pollution in a tropical city: Physiological and biochemical response from trees. Bull. Natl. Res. Cent. 2019, 43, 90. [Google Scholar] [CrossRef]
- Sierra, W. Determination of soluble proteins and chlorophyll in Rhizophora harrisonii by visible light spectrophotometry as indicators of pollution in a sector of the port of Guayaquil. Bachelor’s Thesis, University of Guayaquil, Guayaquil, Ecuador, 2016. [Google Scholar]
- Rincón, N.; Olarte, M.; Pérez, J. Leaf Area Measurement in Photographs Taken with a Webcam, a Cell Phone or a Semi Professional Camera. Natl. Fac. Agron. Mag. 2012, 65, 6399–6405. [Google Scholar]
- Paz, M. Evaluation of the effect of the addition of chemical chelating agents on Sedum praealtum-assisted phytoextraction of heavy metals and their distribution in the root system. Bachelor’s Thesis, National School of Biological Sciences, Mexico City, Mexico, 2011. [Google Scholar]
- Addinsoft. XLSTAT Statistical and Data Analysis Solution. New York, USA. 2023. Available online: https://www.xlstat.com (accessed on 14 March 2023).
- Eslami Doost, Z.; Dehghani, S.; Samaei, M.R.; Arabzadeh, M.; Baghapour, M.A.; Hashemi, H.; Oskoei, V.; Mohammadpour, A.; De Marcoc, A. Dispersion of SO2 emissions in a gas refinery by AERMOD modeling and human health risk: A case study in the Middle East. Int. J. Environ. Health Res. 2023, 22, 1–14. [Google Scholar] [CrossRef] [PubMed]
- Mues, A.; Manders, A.; Schaap, M.; Kerschbaumer, A.; Stern, R.; Builtjes, P. Impact of the extreme meteorological conditions during the summer 2003 in Europe on particulate matter concentrations. Atmos. Environ. 2012, 55, 377–391. [Google Scholar] [CrossRef]
- Arrieta, A. Dispersion of particulate matter (PM10), with Interrelation of meteorological and topographical factors. Eng. Res. Dev. 2016, 16, 43–54. [Google Scholar] [CrossRef]
- Chen, Z.; Chen, D.; Zhao, C.; Kwan, M.; Cai, J.; Zhuang, Y.; Zhao, B.; Wang, X.; Chen, B.; Yang, J.; et al. Influence of meteorological conditions on PM2.5 concentrations across China: A review of methodology and mechanism. Environ. Int. 2020, 139, 105558. [Google Scholar] [CrossRef]
- Lichtenthaler, H.K.; Babani, F. Contents of photosynthetic pigments and ratios of chlorophyll a/b and chlorophylls to carotenoids (a+b)/(x+c) in C4 plants as compared to C3 plants. Photosynthetica 2022, 60, 3–9. [Google Scholar] [CrossRef]
- Zengin, F.; Munzuroglu, O. Effects of some heavy metals on content of chlorophyl, proline and some antioxidant chemicals in bean (Phaseolus vulgaris L.) seedlings. Ser. Bot. 2005, 47, 157–164. [Google Scholar]
- Ying, L.; Liu, C.; Zhang, J.; Yang, H.; Xu, L.; Wang, Q.; Sack, L.; Wu, X.; Hou, J.; He, N. Variation in leaf chlorophyll concentration from tropical to cold-temperate forests: Association with gross primary productivity. Ecol. Indic. 2018, 85, 383–389. [Google Scholar] [CrossRef]
- Carter, G.; Knapp, A. Leaf Optical Properties in Higher Plants: Linking Spectral Characteristics to Stress and Chlorophyll Concentration. Am. J. Bot. 2001, 88, 677–684. [Google Scholar] [CrossRef]
- D’Addazio, V.; Pereira, M.; Alves, A.; Ralph, A.; Barcellos, M.; Gontijo, I.; de Oliveira, M. Impact of Metal Accumulation on Photosynthetic Pigments, Carbon Assimilation, and Oxidative Metabolism in Mangroves Affected by the Fundao Dam Tailings Plume. Coasts 2023, 3, 125–144. [Google Scholar] [CrossRef]
- Pourkhabbaz, A.; Rastin, N.; Olbrich, A.; Langenfeld-Heyser, R.; Polle, A. Influence of Environmental Pollution on Leaf Properties of Urban Plane Trees, Platanus orientalis L. Bull. Environ. Contam. Toxicol. 2010, 85, 251–255. [Google Scholar] [CrossRef]
- Bruno, G.; Stiefkens, L.; Hadid, M.; Liscovsky, I.; Cosa, M.; Dottori, N. Effect of environmental pollution on leaf anthomy of Ligustrum lucidum (Oleaceae). Bol. Soc. Argent. Bot. 2007, 42, 231–236. [Google Scholar]
- Joshi, P.C.; Swami, A. Physiological responses of some tree species under roadside automobile pollution stress around city of Haridwar, India. Environmentalist 2007, 27, 365–374. [Google Scholar] [CrossRef]
- Davari, A.; Danehkar, A.; Khorasani, N.; Poorbagher, H. Heavy metal contamination of sediments in mangrove forests of the Persian Gulf. J. Food Agric. Environ. 2010, 8, 1280–1284. [Google Scholar]
- Moreno, A.; Cruz, M.; Marina, L. Physiological Response of Avicennia germinans and Rhizophora mangle Seedlings to Cadmium. In Marine World Studies Network, 1st ed.; Marina, L., Garcia, C., Eds.; National University of Colombia: Bogota, Colombia, 2013; pp. 153–174. [Google Scholar]
- Chaudhary, I. Suspended particulate matter deposition and its impact on urban trees. Atmos. Pollut. Res. 2018, 9, 1072–1082. [Google Scholar] [CrossRef]
- Peel, J.; Mandujano, M.; López, J.; Golubov, J. Stomatal density, leaf area and plant size variation of Rhizophora mangle (Malpighiales: Rhizophoraceae) along a salinity in the Mexican Caribbean. Trop. Biol. 2017, 65, 701–712. [Google Scholar] [CrossRef]
- Liu, Z.; Tian, L.; Chen, M.; Zhang, L.; Lu, Q.; Wei, J.; Duan, X. Hormesis Responses of Growth and Photosynthetic Characteristics in Lonicera japonica Thunb. to Cadmium Stress: Whether Electric Field Can Improve or Not? Plants 2023, 12, 933. [Google Scholar] [CrossRef] [PubMed]
- Liu, Y.; Wang, X.; Zeng, G.; Qu, D.; Gu, J.; Zhou, M.; Chai, L. Cadmium-induced oxidative stress and response of the ascorbate–glutathione cycle in Bechmeria nivea (L.) Gaud. Chemosphere 2007, 69, 99–107. [Google Scholar] [CrossRef]
- Agathokleous, E. The rise and fall of photosynthesis: Hormetic dose response in plants. J. For. Res. 2021, 32, 889–898. [Google Scholar] [CrossRef]
- Weeberb, J.; Jhun, I.; Coull, B.; Koutrakis, P. Climate impact on ambient PM2.5 elemental concentration in the United States: A trend analysis over the last 30 years. Environ. Int. 2019, 131, 104888. [Google Scholar] [CrossRef]
- Government of México. Available online: https://apps1.semarnat.gob.mx:8443/dgiraDocs/documentos/ver/resolutivos/2018/30VE2018E0060.pdf (accessed on 10 February 2023).
- Turner, J.; Lawless, P.; Yamamoto, T.; Coy, D. Particulate Matter Controls, Chapter 3; Electrostatic Precipitators. Environmental Protection Agency. Available online: https://www.epa.gov/sites/default/files/2020-07/documents/cs6ch3.pdf (accessed on 26 April 2023).
- Sanders, J. Monitoring Heavy Metals by Atomic Absorption Spectroscopy for Compliance with RoHS and WEEE Directives, Application Note; Agilent Technologies: Santa Clara, CA, USA, 2012. [Google Scholar]
- Stella, M. Determination of Total Heavy Metals with Acid Digestion and Soluble, Direct Reading by Atomic Absorption Spectrophotometry; Institute of Hydrology, Meteorology and Environmental Studies: Colombia, 2004. [Google Scholar]
- Hidalgo, J. Quantification of V, Ni, Zn and Fe in asphalt by atomic absorption spectroscopy. Métodos Mater. 2017, 7, 20–28. [Google Scholar]
- El-Sharabasy, H.; Ibrahim, A. Communities of Oribatid Mites and Heavy Metal Accumulation in Oribatid Species in Agricultural Soils in Egypt Impacted by Waste Water. Plant Protect. Sci. 2010, 46, 159–170. [Google Scholar] [CrossRef]
Disclaimer/Publisher’s Note: The statements, opinions and data contained in all publications are solely those of the individual author(s) and contributor(s) and not of MDPI and/or the editor(s). MDPI and/or the editor(s) disclaim responsibility for any injury to people or property resulting from any ideas, methods, instructions or products referred to in the content. |
© 2023 by the authors. Licensee MDPI, Basel, Switzerland. This article is an open access article distributed under the terms and conditions of the Creative Commons Attribution (CC BY) license (https://creativecommons.org/licenses/by/4.0/).