Abstract
The present study aim is to elucidate the effect and influencing mechanism of land use change on soil C, N, and P stoichiometric characteristics, soil enzyme activity and the microbial community in the karst ecosystem of southwest China. The three typical successive evolution land use types of original forest land, slope farmland and shrub-grassland were selected as the study objects in the present study. Additionally, the change in the laws and relationships of soil, the C, N, and P stoichiometric characteristics, the five soil enzyme activities of urease, sucrose, alkaline phosphatase, amylase and protease, and soil microbial community during the land use evolution process were studied. Results showed that (1) during the evolution process of the three land use types, soil C, N, and P stoichiometric characteristics, enzyme activities and microbial PLFAs (phospholipid fatty acids) varied significantly or extremely significantly; (2) in the three land use types studied, there were significant or extremely significant correlations between soil C, N, and P stoichiometric characteristics, enzyme activities and microbial PLFAs; (3) the ecological project of returning farmland to woodland had remarkable ecological effects on increasing soil C and N sink, repairing soil microbial community and improving soil quality; (4) artificial afforestation should be used as the most important and preferential measure for karst vegetation restoration and reconstruction. The present results not only provided scientific bases for land sustainable utilization, vegetation restoration and reconstruction, but also had important value in reducing the release and increasing the sequestration of soil C and N in karst ecosystems of Southwest China.
1. Introduction
Soil, the base material of plant growth in the ecosystem, not only accepts the supply of external nutrients, but also transfers the nutrients to plants for their growth [1]. So, the quality of soil is the key factor of its ecological function. C (Carbon), N (nitrogen) and P (phosphorus) are the essential constituent elements of individual plants and the prerequisite elements for plant growth, of which N and P often are the limiting factors in terrestrial ecosystems [2]. Soils and plants are connected closely through the migration and transformation of these nutrients in terrestrial ecosystems. Soil microbes, the most active factor in soil ecosystems, are an important factor driving soil nutrient cycle and an important part of soil fertility [3,4], which plays a leading role in the soil nutrient cycle and sustainable utilization, and controls the key processes of soil ecological function [5]. So, soil microbe is increasingly used as an important indicator for evaluating soil quality and ecological process [6,7]. In the index system of the soil microbiome for soil quality evaluation, soil enzyme activity, microbial biomass and community diversity have always been used as very important indicators [8]. Among them, soil enzymes, an important active component which catalyze various biochemical reactions in soils, participates in soil organic matter decomposition and energy conversion, directly affects soil quality and indirectly influences plant growth [9]. Soil microbial diversity sensitively reflects the changes in the soil ecological environment and reveals the differences in soil microbial functions [10].
Land use change caused by human activities is bound to break C, N and P original balance in terrestrial ecosystems [11]. Land use change destroys soil aggregate structure, accelerates the breakdown of the soil humus, and animal, plant and microbe residues, excrements and secretions, and makes them easier to be microbially decomposed, chemically oxidized and physically released, resulting in changes in the soil C, N and P content and stoichiometric ratio [12,13]. Analyses by Guo and Gifford (2002) based on global data showed that when the land use of natural forest converted into artificial forest or farmland, soil total C content decreased by 13% or 42%, respectively [11]. Meanwhile, when the farmland converted into natural secondary forest or artificial forest, soil total C content increased by 18% or 53%, respectively. The study of Xu et al. (2008) showed that soil total C, N, and P content decreased significantly when the land use changed from natural forest to first generation artificial forest or second generation artificial forest [14]. In the same way, the soil microbiome is remarkably sensitive to soil environmental changes [5]. Land use change leads to obvious differences in soil environment, which significantly affect soil enzyme activity, microbial community structure and diversity [3]. Additionally, the changes in soil enzymes and microbes through these impacts can retroact on the soil environment and aboveground plant growth [4]. It can be seen clearly that the influences of different land use changes on soil enzyme activity and the microbial community and their retroactions on soil environment and aboveground plant growth are obvious and different. So, it is of great significance to carry out scientific and reasonable land use type for the sustainable development of agriculture and ecological conservation.
In recent decades, remarkable land use changes happened in China caused by rapid social and economic development. Additionally, at present, for ecological restoration and construction, the Chinese government is continuously carrying out massive ecological projects to adjust the land use structure, such as the returning farmland to forest project in the watershed of the Yangtze River, and the karst rocky desertification control project in Southwest China Karst [15]. All of these have aimed to change soil C, N and P stoichiometrical characteristics, impact soil enzyme activity and the microbial community, and influence the ecological and service function of ecosystems [16]. Southwest China Karst is one of the three contiguous karst distribution areas in the whole world. In this area, the strong carbonate development, wide karst distribution, shallow and barren soil, and fragile and sensitive ecological environment, coupled with the enormous population and strong human activity, led to the numerous transformations of land use type from forest land to slope farmland, and caused serious soil degeneration and severe ecological issues in the second half of the last century [13]. During the end of the last century to the beginning of this century, to rehabilitate the soil degeneration and improve the ecological environment, a large number of ecological projects have been carried out, causing massive numbers of slope farmlands to be abandoned and converted into secondary forests or shrub-grasslands in this area [13].
However, how did soil C, N, and P ecostoichiometric characteristics, soil enzyme activity and the soil microbial community change during these conversions? What is the driving mechanism of these changes by the land use conversions? Additionally, are these land use conversions scientific and reasonable? All of these key scientific problems are still unclear and urgently need to be clarified. So, in this study, the typical area of Southwest China Karst was selected as the experimental site, and the following investigations were conducted: (1) the responses of soil C, N, and P stoichiometric characteristics to the land use changes, (2) the impacts of the land use change on the soil enzyme activity and microbial community, and (3) the influential mechanism of land use changes on these soil properties, in order to provide scientific theoretical bases for soil C, N and P cycle regulation, land sustainable utilization, vegetation recovery and construction in the karst ecosystems.
2. Materials and Methods
2.1. Study Area Description
The study area was located on both sides of the Beipan River of Guanling County, Anshun City of Guizhou Province, China (105°36′30″~105°46′30″ E, 25°39′13″~25°41′00″ N) (Figure 1). The landform is a typical karst plateau canyon with a large proportion of bare and rugged surface. The terrain is strongly undulating with an elevation range of 600~1200 m. The annual temperature is 18.4 °C and total annual temperature is 6542.9 °C with an annual maximum and minimum temperature of 32.4 °C and 6.6 °C, respectively. The average annual rainfall is 1100 mm with uneven spatial and temporal distribution. The rainfall is mainly distributed from May to October, accounting for 83% of the annual total rainfall. The climate belongs to the humid subtropical monsoon climate with a warm and dry spring and a hot and humid summer. The rock is mainly limestone, and the soil is mainly calcareous soil and partly yellow soil. In the area, the karst rocky desertification happened extensively. The native vegetation of the subtropical evergreen-deciduous conifer-broadleaf mixed forest, is basically destroyed. The present vegetation is mainly secondary forest with Zanthoxylum planispinum var. dintanensis, Lonicera japonica, Toona sinensis, Broussonetia papyrifera, Celtis sinensis, Phyllanthus emblica, Opuntia stricta var. dillenii, Amomum villosum and so on.
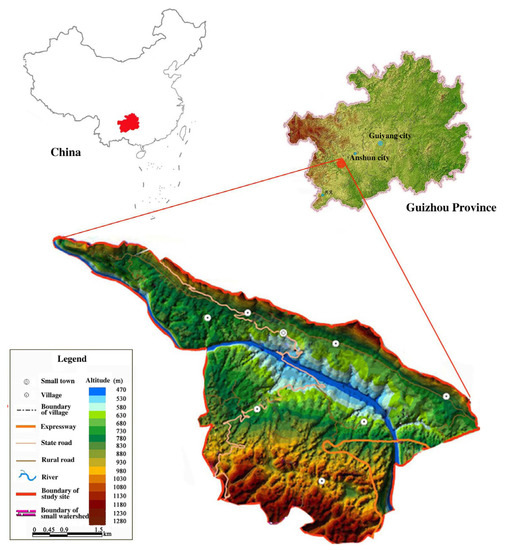
Figure 1.
Location and basic information of the study area.
2.2. Sample Plot Set and Soil Sample Collection
After field investigation, in the study area, three sample plots with the same or similar background environmental factors of altitude, soil properties, slope, aspect, and slope position (Table 1), representing the three typical successive evolution land use types of original forest land (FL), slope farmland (SF) cultivated from FL, and shrub-grassland (SGL) abandoned from SF, respectively, were set up. The area of each sample plot of land use type was 1 hm2 (100 × 100 m). Additionally, three sample squares with areas of 10 × 10 m, respectively, in each sample plot were randomly set (Table S1). Enough (>2000 kg) soil samples from each sample square were collected both in the two soil layers of 0–10 cm and 10–20 cm by ring knives. Soil samples of the soil layer of 0–20 cm were obtained by the soil mixture of 0–10 cm and 10–20 cm soil layers with a 1:1 ratio. All soil samples were collected once in April and once in October of 2021, respectively. For each soil sample three replicates were collected.

Table 1.
Basic information of the sample plots.
2.3. Soil Total C, N and P Content Determination
Soil samples collected were aired in a dark place. After being dried, these soil samples were broken into granules screened by a 2 mm sieve for the determination of soil organic carbon (SOC), and total N and P (Table S2). SOC content was determined by the potassium dichromate oxidation –ferrous sulphate titrimetry method. Total N content was tested by the alkaline potassium persulfate digestion–UV spectrophotometric method. Total P content was determined by the Burriel-Hernando method. All these methods referred to the methods of Wang et al. (2011) [17].
2.4. Soil Enzyme Activity Measurement
Soil samples collected were dried in air and then used to measure enzyme activity. Five soil enzyme activities of urease (URE), protease (PRO), sucrase (SUC), amylase (AMY), and alkaline phosphatase (ALP) were measured (Tables S3 and S4). URE and PRO activity was measured by indigo blue chronometry and the ninhydrine colorimetric method, respectively, and expressed by the NH3-N mass (mg) produced in 1 g soil cultured for 24 h at 37 °C. SUC and AMY activity were both determined by the 3, 5-dinitrosalicylic acid colorimetric method, expressed by glucose and maltose mass (mg) generated per hour in 1 g soil incubated at 30 °C for 24 h, respectively. ALP activity was determined by the disodium phenyl phosphate colorimetric method and expressed by the phenol mass (mg) released in 1 g soil incubated at 37 °C for 24 h. All these measurements referred to the methodology of Kotroczó et al. (2014) [18]. All enzyme determinations were replicated by three times.
2.5. PFLAs Extraction and Identification
After being ground and screened by a 0.3 mm sieve, the soil (5 g) was used to extract the phospholipid fatty acids (PFLAs) by the modified method of Frostegård et al. (1993) [19]. Soil samples were mixed successively by the phosphate buffer (0.069 g:7.9 mL:10 mL:20 mL of dipotassium hydrogen phosphate:ultrapure water:dichloromethane:methanol), acetocaustin buffer (0.38 g:7.6 mL:10 mL:20 mL of acetocaustin:ultrapure water:dichloromethane:methanol) to extract lipids. Then, lipids were fractionated into phospholipids and other components by a 3 mL silicic acid column with a particle size of 45 μm and surface area of 475 m2·g−1. After decomposed in an alkaline methanol solution, the phospholipids were analyzed by the gas chromatograph system of Agilent 6850 with an Agilent Ultra 19091B-102E 25% pheny methyl siloxane column and an FID detector. C19:0 served as an internal standard and a MIDI Sherlock microbial identification system (Version 6.1, MIDI Inc., Newark, DE, USA) was used to identify and analysis the PFLAs. The identification and calculation method of PFLAs referred to Bardgett et al. (1996) [20]. PLFAs of 18:2ω6,9 were used as the markers of fungi. PLFAs of cy17:0, cy19:0, 16:1ω7, 16:1ω5, 18:1ω7 and 17:1ω9 were represented as the markers of Gram-negative bacteria (BG−). PLFAs of i15:0, a15:0, i16:0, a16:0, i17:0 and a17:0 were the markers of Gram-positive bacteria (BG+). Additionally, PLFAs of actinomycetes were identified as 10Me16:0, 10Me17:0 and 10Me18:0. The absolute concentration (nmol g−1 soil) of total bacterial, BG−, BG+, fungal, actinomycete, total saturated and monounsaturated PLFAs were calculated, respectively. Ratios of F/B (fungal PLFAs/bacterial PLFAs) and S/M (saturated PLFAs/monounsaturated PLFAs) were also calculated. The ratios F/B and S/M were used as indicators of microbial biomass changes and physiological stress, respectively [21,22]. The measuration data were filled in Tables S5, S6 and S7, respectively.
2.6. Statistical Analyses
The significant difference comparisons were conducted by the one-way ANOVA method. The differences between multiple comparisons were conducted by the Duncan method. The correlations between variables were analyzed by the Pearson correlation test. All statistical analyses were performed in SPSS software (Version 19.0, IBM, Chicago, USA). The software Canoco (Version 5.0, Microcomputer Power, Ithaca, NY, USA) was used to performance the principal component analysis (PCA).
3. Results
3.1. Soil C, N, and P Stoichiometrical Characteristics
There were significant differences in the soil C:N:P contents and ratios between the three land use types (Figure 2). The soil total C contents in the 0~10 cm and 10~20 cm soil profiles of FL were significantly more than those of SF; soil total N contents in the three soil profiles of FL were significant more than those of SF and SGL; and the soil total P contents in the 10~20 cm and 0~20 cm soil profiles of FL and SF were significant more than those of SGL. Soil C:N ratios in the three soil profiles of FL were significantly lower than those of SGL; soil C:P ratios in the 0~10 cm and 10~20 cm soil profiles of FL and SF were significantly lower than those of SGL; and soil N:P ratios in the 10~20 cm and 0~20 cm soil profiles of FL were significantly higher than those of SF and SGL.
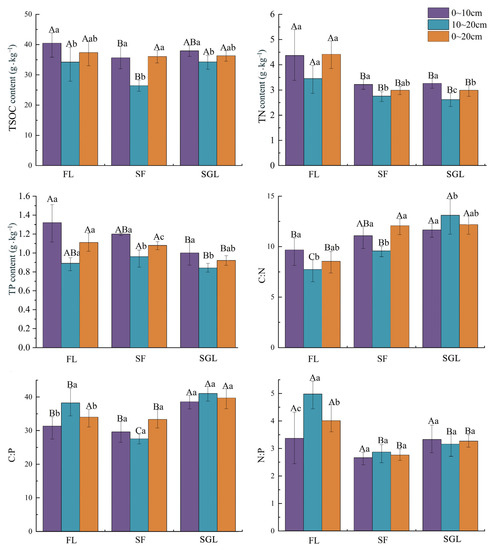
Figure 2.
Soil C, N, and P contents and ratios of the three land use types studied. Note: FL, forest land; SF, slope farmland; SGL, shrub-grassland. Capital letters represent the significant difference between different land use types of the same soil profile and small letters represent the significant difference between different soil profiles of the same land use type (α = 0.05).
With the evolution of land use type from FL and SF to SGL, the soil total N and P content decreased progressively and the soil C:N and C:P ratios roughly showed a progressive increase. Results also showed that with the increase in soil depth, soil total C, N, and P content decreased obviously; however, soil C:P and N:P increased remarkably or had no significant change.
3.2. Soil Enzyme Activities
There were also significant differences in the five soil enzyme activities of URE, AMY, PRO, SUC and ALP between the three land use types studied (Figure 3). URE activities in the 0~20 cm soil profile of FL were significantly more than those of SF and SGL; SUC and ALP activities in the three soil profiles of FL were significantly higher than those of SF and SGL; AMY activities in the 0~10 cm and 0~20 cm soil profile of FL and SGL were significantly higher than those of SF. Additionally, no significant difference in PRO activities between land the use types of FL, SF and SGL was obtained.
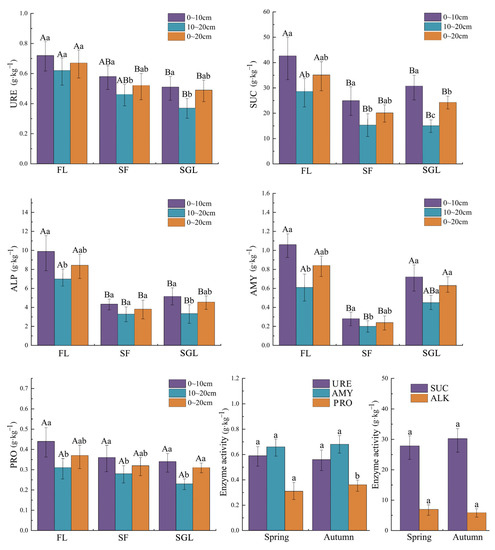
Figure 3.
Five soil enzyme activities of URE, SUC, ALP, AMY and PRO in the three land use types studied and between spring and autumn. Note: FL, forest land; SF, slope farmland; SGL, shrub-grassland; URE, urease; SUC, sucrose; ALP, alkaline phosphatase; AMY, amylase; PRO, protease. Capital letters represent the significant difference between different land use types of the same soil profile and small letters represent the significant difference between different soil profiles of the same land use type (α = 0.05).
With the evolution process of land use type from FL, to SF to SGL, URE activity decreased progressively, AMY activity decreased at first and then increased, and the activities of SUC and ALP decreased roughly at first and then increased. The present results also showed that with soil depth increase, most of the five soil enzyme activities changed significantly (α = 0.05) in the three land use types studied. The five soil enzyme activities of all the sample plots and the three layers between the two different seasons of spring and autumn were compared. Comparison results showed that, except for the fact that the soil PRO activity in spring was significantly less than that in autumn, there were no significant differences between the remaining four soil enzyme activities between spring and autumn.
3.3. Soil Microbial PLFAs
There were significant differences both in the S and M PLFA concentration and the S:M ratio between the different soil profiles or between the three types of land use (Table 2). Specifically, the S PLFA concentrations in the three soil profiles of FL and SF were significantly more than those of SGL; M PLFA concentrations in the 0~10 cm and 0~20 cm soil profiles of FL were significantly more than those of SF and SGL; and the S:M ratio in the 10~20 cm soil profile of FL was significantly more than that of SF and SGL. Among all of the three land use types studied, the S and M PLFA concentrations and S:M ratios of the 0~10 cm soil profiles all were significantly more than those of the 10~20 cm soil profiles.
Table 2.
Types and contents of soil microbial PLFAs in the three land use types (nmol·g−1).
Land use change obviously affected the soil microbial PLFA concentrations (Figure 4). Bacterial PLFA concentrations in the three soil profiles of SGL were significantly more than those of FL and SF. Additionally, effects of the land use change on BG- and BG+ were obvious. The BG- PLFA concentrations of SGL were significant more than those of FL and SF. However, the BG+ PLFA concentration in the 0~20 cm soil profile of SGL was near to that of SF, and significantly more than that of FL. For fungal PLFAs, the concentrations in the 0~10 cm soil profile of FL was significantly more than that of SGL. The F:B ratio in the 0~20 cm soil profile of FL was also significantly more than that of SGL. For actinomycetic PLFAs, the concentrations in the three soil profiles of FL were significantly more than those of SF and SGL. In addition, with soil depth increase, PLFA concentrations of bacteria, BG−, BG+, actinomycetes and fungi all decreased significantly.
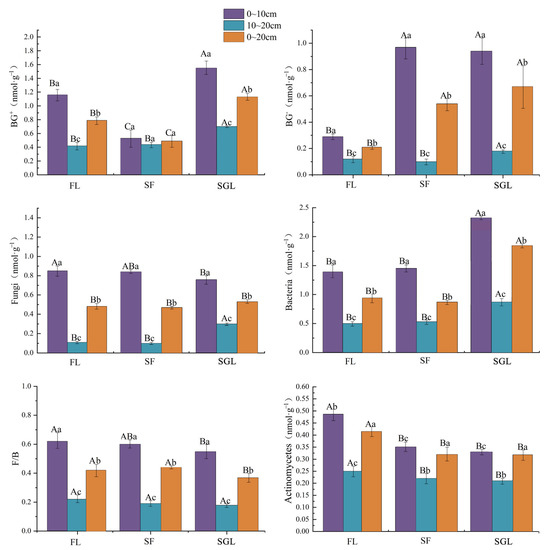
Figure 4.
The PLFA concentrations of bacteria, BG−, BG+, actinomycetes, and fungi in the three land use types studied. Note: FL, forest land; SF, slope farmland; SGL, shrub-grassland; BG+, Gram-positive bacteria; BG−, Gram-negative bacteria. Capital letters represent the significant difference between different land use types of the same soil profile and small letters represent the significant difference between different soil profiles of the same land use type (α = 0.05).
3.4. Correlations between soil C, N, and P Stoichiometrical Characteristics, Soil Enzyme Activities and Microbial PLFAs
Correlation analyses between soil C, N, and P stoichiometrical characteristics, soil enzyme activities and microbial PLFA concentrations were conducted (Table 3). There were extremely significant correlations between soil C, N, and P stoichiometrical characteristics and soil enzyme activities. All five of the soil enzyme activities studied were extremely positively related to soil C, N and P content. In addition, URE activity was significantly negatively related to soil C:N and significantly positively related to soil N:P. Additionally, ALP activity was extremely significantly negatively related to soil C:N.
Table 3.
Correlations of soil C, N, and P stoichiometrical characteristics, soil enzyme activity and microbial PLFAs.
There were remarkable positive correlations between the soil enzyme activities and microbial PLFA concentrations. URE activity showed a significant positive correlation with the bacterial, fungal and M PLFAs and the S:M ratio, and an extremely significant positive correlation with S PLFAs; SUC activity showed a significant positive correlation with bacterial and fungal PLFAs, and the F:B and S:M ratios, and an extremely significant positive correlation with S and M PLFAs; ALP activity was extremely significantly positively related to the bacterial, fungal, S and M PLFAs; AMY activity was significantly positively related to actinomycetic PLFAs, and extremely significantly positively correlated with M PLFAs; PRO activity was significantly positively related to bacterial, BG+, and fungal PLFAs, and extremely significantly positively related to S and M PLFAs.
There also were clear correlations between soil C, N, and P stoichiometrical characteristics and microbial PLFA concentrations. Soil total N content showed an extremely significant positive correlation with the bacterial, fungal, S and M PLFAs, and the F:B and S:M ratios; soil total P content showed a significant positive correlation with BG+, S and M PLFAs; soil C:N showed a significant negative correlation with bacterial, fungal, S and M PLFAs, and an extremely significant negative correlation with the S:M ratio; and soil N:P showed a significant positive correlation with bacterial PLFAs.
3.5. PCA Analysis
PCA results showed that the cumulative percentage of the first three principal components was 81.00% (Table 4), indicating that these first three principal components could represent the vast majority of the 20-factor variation information caused by the land use changes. The contribution percentage of the first three principal components was 40.94%, 23.92%, and 16.15%, respectively. In the 1st principal component, the weight coefficients of URE, SUC, ALP and PRO activity, total C, N and P content, and C:N and N:P ratios were high, with values of 0.859, 0.913, 0.759, 0.905, 0.873, 0.931, 0.928, −0.711, and −0.819, respectively; this suggests that the 1st principal component primarily was the soil enzyme activity and the soil C, N, and P stoichiometrical characteristics. In the 2nd principal component, the weight coefficients of the BG-, bacteria, and M PLFA concentrations, the S:M ratio, and AMY activity were high, with values of 0.877, 0.788, 0.886, −0.723 and 0.736, respectively, suggesting the 2nd principal component was mainly BG- bacteria and M PLFAs. In the 3rd principal component, the weight coefficients of BG+ and S PLFA concentrations were high with values of 0.722 and 0.956, respectively, suggesting the 3rd principal component mainly was BG+ bacteria and S PLFAs.
Table 4.
Principal component analysis of land use change based on soil C, N, and P stoichiometrical characteristics, enzyme activity and microbial PLFAs.
Figure 5 also showed that the arrows of URE, SUC, ALP, PRO, total C, N, and P, and the C:N and C:P ratios were long in Axis 1, and arrows of BG-, bacterial, and M PLFAs, S:M, AMY, and N:P were long in Axis 2, indicating that these factors had clear responses to the land use transformations. In Figure 5, the arrows of actinomyces and S PLFAs were very short, indicating that these two factors had very weak responses to the land use transformations.
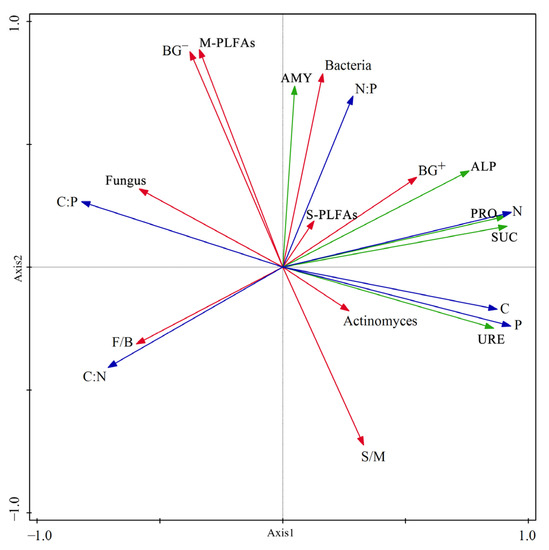
Figure 5.
PCA ordination diagram. Note: URE, urease; SUC, sucrose; ALP, alkaline phosphatase; AMY, amylase; PRO, protease; BG+, Gram-positive bacteria; BG-, Gram-negative bacteria; S-PLFAs, Saturated PLFAs; M-PLFAs, Monounsaturated PLFAs.
4. Discussion
4.1. Effects of Land Use Changes on Soil C, N, and P Stoichiometrical Characteristics in the Karst Ecosystem
The present results showed that there were significant differences in soil C, N and P content both in the surface soil layer (0~10 cm) and the deeper soil layer (10~20 cm) between the three different land use types with the same or a similar soil background. In the evolution process from forest land (FL) to slope farmland (SF), soil C and N were lost by an average of 16.90% and 23.53%, respectively. Compared with the global average (42%) of soil C loss caused by land use change [11], the present loss rate of soil C was lower, which could be attributed to the infertile soil with a low C content in Southwest China Karst. After the abandoned slope farmland transformed into shrub-grassland, soil C increased on average by 16.00%, comparable to the global average of 18% [11]. It can be seen that, in Southwest China Karst, the return of farmland to forest or grassland had the obvious ecological effect of increasing soil C sequestration. Soil C and N, mainly coming from the decomposition of aboveground plants and underground litters, can be obviously affected by vegetation, climate and human activities [23]. Land use change can remarkably result in the variations of soil C and N content [24]. Different to the soil C and N elements, soil P is mainly derived from rock weathering, and soil P content heavily depends on the geological characteristics of the site and is less affected by human activities [17,25]. The present results showed that soil P content change was significantly lower than that of soil C and N during the evolution of land use types, consistent with the previous conclusion [25]. The present results also showed that soil P content decreased after the slope farmland was abandoned, and transformed into shrub-grassland, which could be due to the large amount of human disturbances resulting in the increase in soil organic P decomposition and then the loss due to surface runoff [26].
Studying the elemental ecological stoichiometry from a regional to global scale was an effective way to clarify the responses of the C, N and P nutrient cycles to environmental changes in ecosystems [27]. On a big scale, stoichiometric ratios of soil C:N, C:P and N:P between different ecosystems were significantly different [28]. The present study showed, in the small scale, that land use changes also significantly affected these stoichiometric ratios, consistent with the big-scale study results [28,29]. Compared with soil C:N ratios, soil C:P and N:P showed more obvious spatial variations and was easily affected by climate, soil texture, soil depth and rocky weathering [29]. The present results also showed that, as the forest land changed into slope farmland, the soil N:P varied more remarkably than the soil C:P and C:N ratios. Therefore, it can be concluded that the soil N:P ratio was more sensitive than those of C:N and C:P in indicating the soil nutrition alteration to land use change. The soil C:N ratio was inversely proportional to SOC decomposition rates [30]. The present results showed that the soil C:N ratio of the shrub-grassland abandoned as slope farmland increased with soil depth increase, consistent with previous results [31]. So, the abandonment of slope farmland could raise C sequestration of deep soils in Southwest China Karst. Among the three land uses, only the soil C:N ratio of shrub-grassland showed this vertical distribution, suggesting that the deep soil of shrub-grassland in Southwest China Karst had obvious C sequestration potential. It can be inferred that the farmland returning to woodland could significantly reverse the soil C and N loss, having the obvious ecological function of increasing soil C and N sequestration.
4.2. Responses of Soil Enzyme Activities and Microbe Communities to Land Use Changes in the Karst Ecosystem
Land use changes as a result of direct and rapid human activity, altering soil internal structures, water and heat conditions, and nutrient sources and cycles significantly change soil enzyme activities and biochemical cycle processes of ecosystems [32]. The present study confirmed the intense human disturbance of land use change could cause soil nutrient loss and result in soil enzyme activities changing profoundly. In the present study, except for PRO, the other four soil enzyme activities in forest land were the highest. So, it can be inferred that, in the forest land, plant roots were more, and litters, microbial diversity and biomass were all richer, all of which are conducive to form the good soil environmental conditions to promote nutrient accumulation and cycle and to enhance soil enzyme activities. This conclusion also can be supported by previous studies in the karst regions of Southwest China [33]. Therefore, it can be concluded that, among the three land uses, forest land had the best ecological function of improving soil microbes and enzyme activities. Artificial afforestation should be used as the most important engineering measure for the restoration of karst degradation ecosystems in Southwest China.
Microbes are an important component of soil ecosystems and play extremely important roles in soil nutrient cycles. Additionally, land use change can significantly drive soil microbe variation [34]. The existence and abundance of soil PLFAs can reveal the existence and abundance of soil microbial specific species or populations [35]. In the present study, all of the total soil PLFAs, S PLFAs and M PLFAs were significantly reduced after the forest land conversion into slope farmland, suggesting that this land use change had significant coercive stress on soil microbes in Southwest China Karst. Land use was the most important factor affecting the structure of the soil microbial community [36,37]. The present results confirmed that soil microbes were affected significantly by land use changes. Land use affected the soil microbial community structure by changing soil salinity and alkalinity, pH, moisture content, organic matter content, and so on [38]. The present result that the biomass of soil total microbes, actinomyces and fungi in forest land were all the highest could be due to the high coverage of litters and a large number of plant roots in the forest land. High coverage of litters reduces soil surface temperature and moisture evaporation, increases soil nutrition through its decomposition and provides more C source and energy. The large number of plant roots provided more nutrition and energy for soil microbes, and thus promoted the increase in soil microbial biomass. The present results showed that bacteria and BG+ biomass increased significantly when abandoned slope farmland transformed into shrub-grassland, indicating that human disturbances decreased, vegetation increased, and the soil microbial community improved significantly during this land use transformation. Therefore, it can be inferred that the returning of the slope farmland to shrub-grassland obviously repaired the soil microbial community and promoted soil quality improvement.
4.3. Relationships between Soil Nutrition Stoichiometrical Characteristics, Enzyme Activities and Microbes
Soil enzymes, the important biocatalysts in soil ecosystems, are the main limiting factors for SOC decomposition and mineralization and soil C, N and P cycles [39]. Soil SUC hydrolyzes sucrose to provide substances for the absorption and utilization of soil organisms, and soil SUC activity can reflect the accumulation and transformation of soil organic matter [33]. Soil URE directly participates in the transformation of organic matter with N and catalyzes the hydrolysis of C-N bonds [40]. The present results were completely consistent with the above conclusion and showed that soil C, N and P contents were extremely significantly positively related to the soil enzyme activities of URE, SUC, ALP, AMY and PRO. It is well known that most of soil enzymes come from soil microbes and soil enzyme activity can reflect the status of the soil microbial community [5]. The present result supported the above conclusion. The five enzyme activities had significant or extremely significant positive correlations with soil microbial PLFA concentrations. Soil PRO activity closely relates to the total activity of soil microbes [35]. In the present study, soil PRO activity showed an extremely significant positive correlation with S and M PLFA concentrations, and a significant positive correlation with bacteria, BG+ and Fungi PLFA concentrations.
Soil microbes, the promoters and participants of soil biochemical reactions, are the important component of soil systems and the important indicator in evaluating soil quality [32]. Soil microbial PLFA concentrations were in close correlation with soil C and N content, and soil microbial biomass change was closely related to soil organic C and N changes [40]. The present results showed that there was an extremely significant positive correlation between soil N content and microbial PLFA concentrations, and a significant positive correlation between soil P content and microbial PLFA concentrations. However, there was no significant correlation between soil C content and microbial PLFA concentrations. Additionally, the present PCA analysis also showed that the contribution rates of soil N and P for the karst land use change were higher than that of soil C. These results can be attributed to the karst soil being extremely infertile with very low organic C content, suggesting that soil organic C is the key factor for the vegetation restoration and land use regulation in Southwest China Karst.
5. Conclusions
Soil C, N, and P stoichiometric characteristics, enzyme activities of URE, SUC, AMY, ALP and PRO, and microbial PLFAs varied significantly or extremely significantly during land use changes in Southwest China Karst. Soil C, N, and P stoichiometric characteristics were closely related to the soil enzyme activities and microbial PLFAs in land use changes. There was remarkable soil C and N loss during the land use change from forest land to slope farmland. Soil N:P was a better ecological indicator in indicating soil nutrition variation to land use change than C:N and C:P in Southwest China Karst. The returning of farmland to woodland could significantly reverse soil C and N loss, having the obvious ecological function of increasing soil C and N sequestration, repairing the soil microbial community and improving soil quality. Additionally, forest land had the best ecological function on the soil microbial community and enzyme activity improvement. Artificial afforestation should be used as the most important engineering measure for the restoration of degraded karst ecosystems. The present results not only provided scientific theoretical bases for land sustainable utilization, vegetation restoration and reconstruction, but also had important values in reducing release and increasing sequestration of soil C and N in karst ecosystems.
Supplementary Materials
The following supporting information can be downloaded at: https://www.mdpi.com/article/10.3390/f14050971/s1, Table S1: basic information of sample squares in the present study; Table S2: contents and stoichiometrical ratios of soil C, N and P of the sample squares; Table S3: soil enzyme activities of the sample squares in period of April to May; Table S4: soil enzyme activities of the sample squares in period of September to October; Table S5: phospholipid fatty acids (PLFAs) of FL01, SF01 and AF01; Table S6: PLFAs of FL02, SF02 and AF02; Table S7: PLFAs of FL03, SF03 and AF03.
Author Contributions
Conceptualization, L.W. and M.S.; formal analysis, L.W.; funding acquisition, M.S.; methodology, M.S.; software, L.W.; supervision, L.W. and M.S.; writing—original draft, L.W.; writing—review and editing, M.S. All authors have read and agreed to the published version of the manuscript.
Funding
This work was supported by grants from the Key Project of Guizhou Science and Technology Fund (Qiankehe Jichu [2020]1Z012) and the China National Natural Science Foundation (42107250).
Institutional Review Board Statement
Not applicable.
Informed Consent Statement
Not applicable.
Data Availability Statement
The original contributions presented in the study are included in the article/Supplementary Material. Further inquiries can be directed to the corresponding author.
Acknowledgments
We thank Jie Yin, Faying Yuan, Suili Zhang, Xianxian He, and Chu Zhao for assistance with collecting plant and soil samples.
Conflicts of Interest
The authors declare no conflict of interest.
References
- Bai, Y.X.; Sheng, M.Y.; Hu, Q.J.; Zhao, C.; Xiao, H.L. Response of soil organic carbon and its active fractions to restoration measures in the karst rocky desertification ecosystem, SW China. Pol. J. Environ. Stud. 2021, 30, 1991–2011. [Google Scholar] [CrossRef] [PubMed]
- Wang, L.J.; Wang, P.; Sheng, M.Y.; Tian, J. Ecological stoichiometry and environmental influencing factor of soil nutrients in the karst rocky desertification ecosystem, southwest China. Glob. Ecol. Conserv. 2018, 16, e00449. [Google Scholar] [CrossRef]
- Ha, K.V.; Marchner, P.; Bünemann, E.K. Dynamics of C, N, P and microbial community composition in particulate soil organic matter during residue decomposition. Plant Soil 2008, 303, 253–264. [Google Scholar] [CrossRef]
- Anderson, T.H. Microbial eco-physiological indicators to asses soil quality. Agr. Ecosyst. Environ. 2003, 98, 285–293. [Google Scholar] [CrossRef]
- Rathore, A.P.; Chaudhary, D.R.; Jha, B. Seasonal patterns of microbial community structure and enzyme activities in coastal saline soils of perennial halophytes. Land Degrad. Dev. 2017, 28, 1779–1790. [Google Scholar] [CrossRef]
- Insam, H.; Hutchinson, T.C.; Reber, H.H. Effects of heavy metal stress on the metabolic quotient of the soil microflora. Soil Biol. Biochem. 1996, 28, 691–694. [Google Scholar] [CrossRef]
- Merino, C.; Godoy, R.; Matus, F. Soil enzymes and biological activity at different levels of organic matter stability. J. Soil Sci. Plant Nut. 2016, 16, 14–30. [Google Scholar]
- Tian, J.; Sheng, M.Y.; Wang, P.; Wen, P.C. Influence of land use change on litter and soil C, N, P stoichiometric characteristics and soil enzyme activity in karst ecosystem, Southwest China. Environ. Sci. 2019, 40, 431–439. [Google Scholar]
- Liu, E.K.; Zhao, B.Q.; Li, X.Y.; Jiang, R.B.; Li, Y.T.; Hwat, B.S. Biological properties and enzymatic activity of arable soils affected by long-term different fertilization systems. Chin. J. Plant Ecol. 2008, 32, 176–182. [Google Scholar]
- Kevin, Z.M.; Bahar, S.R.; Yakov, K. Land use affects soil biochemical properties in Mt. Kilimanjaro region. Catena 2016, 141, 22–29. [Google Scholar]
- Guo, L.B.; Gifford, R.M. Soil carbon stocks and land use change: A meta analysis. Glob. Chang. Biol. 2002, 8, 345–360. [Google Scholar] [CrossRef]
- Jobbágy, E.G.; Jackson, R.B. The distribution of soil nutrients with depth: Global patterns and the imprint of plants. Biogeochemistry 2001, 53, 51–77. [Google Scholar] [CrossRef]
- Sheng, M.Y.; Xiong, K.N.; Wang, L.J.; Li, X.N.; Li, R.; Tian, X.J. Response of soil physical and chemical properties to rocky desertification succession in South China Karst. Carbonate Evaporite 2018, 33, 15–28. [Google Scholar] [CrossRef]
- Xu, Z.H.; Ward, S.; Chen, C.R.; Blumfield, T.; Prasolova, N.; Liu, J.X. Soil carbon and nutrient pools, microbial properties and gross nitrogen transformations in adjacent natural forest and hoop pine plantations of subtropical Australia. J. Soil Sediment 2008, 8, 99–105. [Google Scholar] [CrossRef]
- Hu, Q.J.; Sheng, M.Y.; Bai, Y.X.; Yin, J.; Xiao, H.L. Response of C, N, and P stoichiometry characteristics of Broussonetia papyrifera to altitude gradients and soil nutrients in the karst rocky ecosystem, SW China. Plant Soil 2022, 475, 123–136. [Google Scholar] [CrossRef]
- Wang, L.J.; Sheng, M.Y.; Li, S.; Wu, J. Patterns and dynamics of plant diversity and soil physical-chemical properties of the karst rocky desertification ecosystem, SW China. Pol. J. Environ. Stud. 2021, 30, 1393–1408. [Google Scholar] [CrossRef]
- Wang, W.J.; Qiu, L.; Zu, Y.G.; Su, D.X.; An, J.; Wang, H.Y.; Zheng, G.Y.; Sun, W.; Chen, X.Q. Changes in soil organic carbon, nitrogen, pH and bulk density with the development of larch (Larix gmelinii) plantations in China. Glob. Chang. Biol. 2011, 17, 2657–2676. [Google Scholar]
- Kotroczó, S.; Veres, Z.; Fekete, I.; Krakomperger, Z.; Tóth, J.A.; Lajtha, K.; Tóthmérész, B. Soil enzyme activity in response to long-term organic matter manipulation. Soil Biol. Biochem. 2014, 70, 237–243. [Google Scholar] [CrossRef]
- Frostegård, A.; Bååth, E.; Tunlid, A. Shifts in the structure of soil microbial communities in limed forests as revealed by phospholipid fatty acid analysis. Soil Biol. Biochem. 1993, 25, 723–730. [Google Scholar] [CrossRef]
- Bardgett, R.D.; Hobbs, P.J.; Frostagård, A. Changes in soil fungal: Bacterial biomass following reduction in the intensity of management of an upland grassland. Biol. Fert. Soils 1996, 22, 261–264. [Google Scholar] [CrossRef]
- Bååth, E. The use of neutral lipid fatty acids to indicate the physiological conditions of soil fungi. Microb. Ecol. 2003, 45, 373–383. [Google Scholar] [CrossRef]
- Bossio, D.A.; Scow, K.M. Impacts of carbon and flooding on soil microbial communities: Phospholipid fatty acid profiles and substrate utilization patterns. Microb. Ecol. 1998, 35, 265–278. [Google Scholar] [CrossRef]
- Rumpel, C.; Kgel-Knabner, I. Deep soil organic matter–a key but poorly understood component of terrestrial C cycle. Plant Soil 2011, 338, 143–158. [Google Scholar] [CrossRef]
- Don, A.; Schumacher, J.; Freibauer, A. Impact of tropical land-use change on soil organic carbon stocks—A meta-analysis. Glob. Chang. Biol. 2011, 17, 1658–1670. [Google Scholar] [CrossRef]
- Chen, X.W.; Li, B.L. Change in soil carbon and nutrient storage after human disturbance of a primary Korean pine forest in Northeast China. Forest Ecol. Manag. 2003, 186, 197–206. [Google Scholar] [CrossRef]
- Meersmans, J.; van Wesemael, B.; de Ridder, F.; Fallas, D.M.; de Baets, S.; van Molle, M. Changes in organic carbon distribution with depth in agricultural soils in northern Belgium, 1960–2006. Glob. Chang. Biol. 2009, 15, 2739–2750. [Google Scholar] [CrossRef]
- Sistla, S.A.; Schimel, J.P. Stoichiometric flexibility as a regulator of carbon and nutrient cycling in terrestrial ecosystems under change. New Phytol. 2012, 196, 68–78. [Google Scholar] [CrossRef]
- Cleveland, C.C.; Liptzin, D. C:N:P stoichiometry in soil: Is there a “Redfield ratio” for the microbial biomass? Biogeochemistry 2007, 85, 235–252. [Google Scholar] [CrossRef]
- Tian, H.Q.; Chen, G.S.; Zhang, C.; Melillo, J.M.; Hall, C.A.S. Pattern and variation of C:N:P ratios in China’s soils: A synthesis of observational data. Biogeochemistry 2010, 98, 139–151. [Google Scholar] [CrossRef]
- Xiao, L.; Liu, G.; Li, P.; Xue, S. Ecological stoichiometry of plant-soil-enzyme interactions drives secondary plant succession in the abandoned grasslands of Loess Plateau, China. Catena 2021, 202, 105302. [Google Scholar] [CrossRef]
- Hamer, U.; Potthast, K.; Burneo, J.I.; Makeschin, F. Nutrient stocks and phosphorus fractions in mountain soils of Southern Ecuador after conversion of forest to pasture. Biogeochemistry 2013, 112, 495–510. [Google Scholar] [CrossRef]
- Zhu, M.L.; Gong, L.; Zhang, L.L. Soil enzyme activities and their relationships to environmental factors in a typical oasis in the upper reaches of the Tarim River. Environ. Sci. 2015, 36, 2678–2685. [Google Scholar]
- Yu, P.; Li, Y.; Liu, S.; Liu, J.; Ding, Z.; Ma, M.; Tang, X. Afforestation influences soil organic carbon and its fractions associated with aggregates in a karst region of Southwest China. Sci. Total Environ. 2022, 814, 152710. [Google Scholar] [CrossRef] [PubMed]
- Drenovsky, R.E.; Steenwerth, K.L.; Jackson, L.E.; Scow, K.M. Land use and climatic factors structure regional patterns in soil microbial communities. Glob. Ecol. Biogeogr. 2010, 19, 27–39. [Google Scholar] [CrossRef] [PubMed]
- Yan, H.; Cai, Z.C.; Zhong, W. Method for the analysis of phospholipid fatty acids and its application in the study of soil microbial diversity. Acta Pedol. Sin. 2006, 43, 851–859. [Google Scholar]
- Bossio, D.A.; Girvan, M.S.; Verchot, L.; Bullimore, J.; Borelli, T.; Albrecht, A.; Scow, K.M.; Ball, A.S.; Pretty, J.N.; Osborn, A.M. Soil microbial community response to land use change in an agricultural landscape of Western Kenya. Microb. Ecol. 2005, 49, 50–62. [Google Scholar] [CrossRef]
- Cui, J.; Song, D.; Dai, X.; Xu, X.; He, P.; Wang, X.; Liang, G.; Zhou, W.; Zhu, P. Effects of long-term cropping regimes on SOC stability, soil microbial community and enzyme activities in the Mollisol region of Northeast China. Appl. Soil Ecol. 2021, 164, 103941. [Google Scholar] [CrossRef]
- Joshi, R.K.; Garkoti, S.C.; Gupta, R.; Kumar, S.; Mishra, A.; Kumar, M. Recovery of soil microbial biomass, stoichiometry, and herb-layer diversity with chronosequence of farmland land abandonment in the central Himalayas, India. Restor. Ecol. 2023, 31, e13782. [Google Scholar] [CrossRef]
- Koerselman, W.; Meuleman, A.F.M. The vegetation N:P ratio: A new tool to detect the nature of nutrient limitation. J. Appl. Ecol. 1996, 33, 1441–1450. [Google Scholar] [CrossRef]
- Yao, H.; He, Z.; Wilson, M.J.; Campbell, C.D. Microbial biomass and community structure in a sequence of soils with increasing fertility and changing land use. Microb. Ecol. 2000, 40, 223–237. [Google Scholar] [CrossRef]
Disclaimer/Publisher’s Note: The statements, opinions and data contained in all publications are solely those of the individual author(s) and contributor(s) and not of MDPI and/or the editor(s). MDPI and/or the editor(s) disclaim responsibility for any injury to people or property resulting from any ideas, methods, instructions or products referred to in the content. |
© 2023 by the authors. Licensee MDPI, Basel, Switzerland. This article is an open access article distributed under the terms and conditions of the Creative Commons Attribution (CC BY) license (https://creativecommons.org/licenses/by/4.0/).