Article

Assessing and Mapping Forest Functions through a GIS-Based, Multi-Criteria Approach as a Participative Planning Tool: An Application Analysis

by
Anna Rita Bernadette Cammerino
*,
Michela Ingaramo
,
Lorenzo Piacquadio
and
Massimo Monteleone
Department of Science of Agriculture, Food, Natural Resources and Engineering, University of Foggia, Via Napoli, 25, 71122 Foggia, Italy
*
Author to whom correspondence should be addressed.
Forests 2023, 14(5), 934; https://doi.org/10.3390/f14050934
Submission received: 20 February 2023 / Revised: 26 April 2023 / Accepted: 28 April 2023 / Published: 2 May 2023
(This article belongs to the Section Forest Inventory, Modeling and Remote Sensing)

Abstract

:
A relatively new planning tool in Italy is the Local Forest Plan, which stands at a broader level in the land planning scale compared to the Forest Management Plan but at a finer scale considering a Regional or even National Forest Plan. This intermediate scale was considered the most appropriate for working out a planning process based on a multi-criteria assessment of forest functions. The proper functioning of forest ecosystems can provide services conceived as benefits people can obtain through ecological processes that sustain and satisfy essential needs of human life. Four particular forest functions providing services were identified: protective, productive, naturalistic and touristic, respectively. A set of functional criteria, as well as attributes within criteria, were recognized to perform an “Analytic Hierarchy Process” (AHP). A specific application of this methodological approach was selected as a case study. This multi-criteria decision-making process involved the participation of five selected experts in a preliminary phase, followed by the participation of thirty representative stakeholders who contributed to the forest planning process and the subsequent selection of actions to be taken. Data related to forest types and management, physical and morphological features of the forested terrain and infrastructure such as forest roads, touristic trails and hiking pathways, together with natural protected areas or wildlife preservation areas, were explicitly located in space by using a “geographical information service” (GIS) software. The combined application of AHP and GIS can be considered as a significant methodological innovation presented in the case study, together with the implementation of a participative process aimed at the management of forest resources and the creation of possible new professional and entrepreneurial forest activities for the benefit of the entire residential community.

1. Introduction

Forest ecosystems provide a range of tangible and intangible services that directly benefit their users, both specific groups of people and society as a whole. Several positive impacts (“externalities”) are generated. They occur at different spatial scales, ranging from local to global benefits [1]. “Ecological services” result from the integrated functioning of the forest as an ecosystem. Forest Ecosystem Services (FES) can be of considerable public importance and should be regarded as “commons” to be carefully addressed in any forest-related policy, e.g., by emphasizing the significant role of forests in climate change mitigation and adaptation, nature conservation and biodiversity protection, or as a source of organic feedstock in the bioeconomy sector, and so on [2,3].
From this perspective, forest ecological integrity is decisive in contributing to the sustainable development of local communities and their well-being or preserving their cultural identity [4,5,6]. Forest biodiversity directly supports the livelihoods of communities by providing goods (e.g., wood and non-wood products), generating other income opportunities (e.g., ecotourism) and providing many other ecosystem services of relevant value. The value of several of these FES is challenging to estimate economically, such as pollination, pest and disease control, climate regulation, water and nutrient cycling and protection and mitigation from the risk of hydrogeological land instability, such as landslides, floods, etc. [7].
A key problem in forest planning is the upscaling from forest units to a large geographical area (i.e., achieving a broad landscape dimension). First, there is a need to balance two apparently contrasting activities: the conservation and use of forest resources—in other words, to sustainably maintain their constant renewal while promoting forms of social and economic development of local communities through their compatible use. Factors responsible for forest degradation should be considered in the first place in applying planning procedures [8,9]. Forest policies (such as regional or sub-regional operational programs) should result from an adequate combination of spatially explicit planning tools and forest physical and ecological characterization, the latter based on specific site and forest traits. This approach may prove to be a key element in forest planning at the landscape scale and over large areas, especially where conflicts between forest conservation and socio-economic forest uses might arise [10,11].
Conventionally, a Forest Management Plan (FMP) aims to translate the general forestry policy framework and forest legislation into a coordinated program relating to a specific Forest Management Unit (FMU) and to achieve an optimum balance between productive and environmental objectives over a given period through the application of technical prescriptions, operations and monitoring [12]. Therefore, forest planning is mainly focused on a “forest unit”, possibly composed of different types of forest compartments, rather than on a large forest area with a variety of forest ecosystems and environmental conditions. This is usually the case whether forests are private or public, whether they are part of a protected area or not and whether they are coppices or uneven-aged high forests.
A relatively new planning tool in Italy is the Local Forest Plan (LFP), which, compared to the FMP, is at a broader land planning scale but at a finer scale considering a Regional Forest Plan [13,14,15].
It should be emphasized (Figure 1) that the LFP is developed on an intermediate territorial scale between the PFM, placed on a finer spatial scale, and the Regional (or County) Forestry Plan (RFP), placed on a broader spatial scale. In particular, the LFP is not strictly a “management” document aimed at short-term forest operations (like the FMP) but should be seen as a planning tool aimed at providing general guidelines for the medium- and long-term maintenance and development of forest resources.
The specific scale of the LFP appears to be the most appropriate for ensuring a sustainable relationship between people and the forest, which appropriately reconciles the protection and use of the forest for the benefit of the community living in the area. Unlike the FMP, where specific management operations are defined as prescriptions, the LFP is not conceived as a set of necessarily mandatory operational activities. On the contrary, the LFP is a document that proposes several possible silvicultural guidelines and alternative optional scenarios of forest development and use according to the prevailing environmental and socio-economic characteristics of the area.
The proper functioning of ecosystems can provide services understood as benefits that people receive [16,17,18] through ecological processes that sustain and satisfy essential human needs [19]. In addition to delivering goods, known as “provisioning” services, ecosystems may also offer life-“supporting” and -“regulating” services, such as cleaning and purification, recycling and renewal, protection and control, as well as many intangible aesthetic and cultural benefits [20]. When considering a local forest planning procedure, forest functions (FF) are associated with different categories of FES [21]. These functions, in turn, can provide several services, thus offering a wide range of benefits, either tangible or intangible and monetary or non-monetary, ultimately improving the quality of human life [22].
Therefore, a kind of “cascade effect” may be activated: ecosystem structure > ecosystem functions > ecosystem services > human well-being [23,24]. Four main FF were considered in this analysis [25]:
  • Productive function (PRD) includes all the activities that remove wood from the forests for use as timber or fuelwood, as well as other possible forest resources (such as cork). Non-wood products should also be included in the possible range of forest products (such as mushrooms, small fruits and berries, herbs, hunting, free-range grazing animals and their products, etc.). According to the CICES classification system, these functions are grouped under the provisioning service.
  • Protective function (PRT) comprises the defense of soil from wind and water erosion, as well as the reduction in landslides, water run-off, and flood risks, together with other environmental benefits provided by tree land cover. Protection against soil hydrogeological instability can be assigned to a regulation and maintenance service according to the CICES classification system.
  • Naturalistic function (NTR) involves biodiversity safeguards and landscape conservation. Indeed, forests serve as important habitats for a wide variety of species (both flora and fauna). By hosting so many species, forests support a rich biodiversity that needs to be protected. This function is now seen as a strategic benefit that meets an important societal demand. The CICES classification system places this type of service under the category of regulation of the biotic environment, which also includes protection of habitats and gene pools (ecosystem, species and genes are recognized as the three hierarchical levels of biodiversity). “Carbon sink and sequestration” can also be included in this type of function, as afforestation and reforestation are recognized as important climate change mitigation measures.
  • Tourist function (TRS) refers to the cultural and recreational use of forests. Forests can provide a host of outdoor recreational activities for young and elderly people, encouraging an active and healthy lifestyle and improving the well-being of the body and mind. A wide range of physical, mental and health activities can be carried out in the forest, including traditional activities such as hiking and trekking. As suggested by both the Millennium Ecosystem Assessment [26,27] and the CICES classification system, the tourist or recreational function can be included in the broader category of cultural services, defined as “nonmaterial benefits that people derive from ecosystems through spiritual enrichment, cognitive development, reflection, recreation and aesthetic experiences”.
It can be noted that the LFP addresses a wide range of goals; it involves multiple social, ecological and political interactions; consequently, it should inform the management of several forest units or forest compartments that make up the geographical area in question.
Most importantly, given the complexity, the relevant social outcomes and the technical results that the procedure may produce, the engagement and active participation of a wide range of stakeholders should be ensured. Various participatory tools such as public consultation forums, public comment solicitations and opinion polls can be used to test public opinion, capture expert judgment and obtain input from communities [28]. Consequently, the task of integrating ecosystem services into decision making through participatory approaches has recently been identified as a crucial aspect of forest planning [29]. This form of forest planning is more challenging than ever and goes far beyond a purely technical forestry tool. Decisions on the sustainable management and use of forests cannot be taken only from a technical perspective, just considering their economic cascading effects; they must also take into account other important factors such as environmental and social issues [30].
Accordingly, the local planning process involves various stakeholders, such as forest experts, technicians, operators, owners, users, public administrators and decision makers, all related to the forest sector and possibly beyond. Each of them brings a particular vision, specific needs and exclusive objectives that need to be taken into account and reconciled with those of the others [31].
When the overall planning goal is to define the optimal combination of forest resources to be used sustainably, the strategy to be followed is often to apply some decision support systems [32]. In this way, a number of alternative forest scenarios are generated, and, consequently, a variety of forest functions to be identified, management operations to be applied and productive value chains to be established are defined.
One such approach is called Multi-Criteria Decision Analysis (MCDA). MCDA is a set of decision analysis tools that can be used to address problems with multiple, sometimes conflicting objectives, with the ultimate goal of achieving their harmonization [33]. MCDA was originally developed for use by a single decision maker, but its multi-objective nature has made it also very useful in participatory planning procedures and group decision making, where it is necessary to take into account the opinions of several, even numerous, stakeholders.
One of the most commonly used MCDA tools in participatory planning is the Analytic Hierarchy Process (AHP), originally developed by Saaty in the 1970s [34,35]. The AHP is a decision-making procedure that compares multiple options and helps to select the “best” decision by identifying a set of relevant criteria. It allows a complex choice to be broken down into a hierarchical structure of possible decision components. The main goal (or decision to be made) is placed at the top level, while the alternative options and their associated criteria are placed at a lower level. The different options are ranked according to their “importance”, which results from assigning a comparative “score” to a set of selected criteria. Preference is “picked out” among several possible alternatives (or options) by first identifying a set of evaluation criteria and then making a pairwise comparison among each of them and the others [36]. Pairwise comparison is applied systematically, i.e., instead of making a judgment about all the criteria considered at once, these criteria are compared two at a time. This makes it easier to perform a relative comparison and also to check the consistency of the ranking between the criteria. The result of this comparison process allows for a “weight” to be assigned to each criterion in determining the “score” for each option.
While AHP is one of the most common tools within the MCDA family, a huge number of other tools have been proposed to retrieve attribute weights based on experts’ preferences [37,38], many of which are implemented by specialized decision-making software [39]. Given the wide variety of MCA methods developed over the years, a comprehensive discussion of all the existing techniques, systematically capturing their similarities and differences, remains a specialized problem beyond the scope of this paper.
In general, discrete MCDA methods are based on comparison and, therefore, better reflect real-world planning problems where the alternatives to be evaluated are limited in number and well defined at the beginning of the analysis. The vast majority of formal discrete MCDA methods fall into the category of “full aggregation” methods. They aim to synthesize the performance of an option against a comprehensive set of different criteria into a single global score [40]. Over the course of time, several methods have followed one another: the Multi-Attribute Utility Theory (MAUT) represents a weighted sum of the utility functions for each individual criterion; the Simple Multi-Attribute Rating Technique (SMART) represents a less complex (but also a less theoretically sound) multi-attribute approach [41]. A few variants of this method, namely, SMARTS (Simple Multi-attribute Rating Technique using Swings) and SMARTER (Simple Multi-attribute Rating Technique Exploiting Ranks) have also been developed in the attempt to address concerns over the logical consistency of SMART [42,43]. In addition, the reliability of the ranking results produced with the AHP has been the subject of substantial debate among MCDA specialists, with several authors questioning, among other things, the validity of the eigenvector method, the coherence of the pairwise comparisons and the justification for the interpretation of the nine-point semantic scale [40]. Over the years, there have been several attempts to modify this method [44,45,46]. Rezaei [47], for instance, has proposed the Best-Worst Method (BWM), which uses only two extreme criteria, the best and the worst, respectively, for the pairwise comparisons. With the BWM, after the identification of criteria, two criteria, namely, the best and the worst ones, are (arbitrarily) selected and considered as the reference [48]. In this way, the number of possible pairwise comparisons is reduced when it could become excessive (similar to Parsimonious-AHP). Other forms of MCDA methods differ in terms of the types of data and information that they can handle (e.g., quantitative or qualitative, complete or fuzzy) as well as in terms of the rules and procedures employed for determining the level of dominance of an option over the others [40]. For example, Fuzzy AHP uses a membership function to calculate a grade of membership that a given variable belongs to, and triangular and trapezoidal functions are usually used in fuzzy logic because they are simple to use but also accurate [49,50]. The Preference Ranking Organization Method for Enrichment Evaluation (PROMETHEE) is one of the most recent MCDA techniques, first developed by Brans [51,52]. The Parsimonious-AHP method allows for analyzing the Decision Maker (DM) problems considering a plurality of qualitative and quantitative criteria and by reducing the number of pairwise comparisons between the alternatives when this number may be too large [53].
Practical applications have shown that different methods can even produce different results when applied to the same decision-making situation [54]. Indeed, each method has its own properties as well as its own advantages and disadvantages when it comes to analyzing and presenting data and information. In this paper, we would like to emphasize the importance of involving experts, stakeholders and public administrators in decision making through well-structured and well-conducted participatory processes, taking into account the AHP approach. The AHP tool was chosen over many others simply because the hierarchical structure of preferences used was relatively simple, the number of criteria considered was quite limited, the tool was easy to implement through stakeholder questionnaires and meetings, it had already been used by our research team in other applications and also because we could obtain good help from software available online that would have made the calculations much easier (see “AHP application” in the section “Materials and Methods”); it is the most applied and successful MCDA method despite its possible limitations.
The specific and original contribution of this paper is to propose a fruitful combined application of GIS and AHP procedures. The AHP procedure was applied by considering several spatial land characteristics as evaluation criteria; subsequently, the AHP was performed, and its results were applied to each forest land unit that the considered geographical area was divided into. This approach proved to be valuable and effective in addressing complex issues by dealing with a variety of forest characteristics and applying a rigorous and objective analytical procedure [55,56,57].
The integration of AHP with GIS is an excellent spatial analysis tool that allows for working with a comprehensive spatial database in processing multi-criteria routines and performing procedures such as land evaluation, land suitability analysis and land planning. With this tool, the user can evaluate (qualitatively or quantitatively) different alternatives based on multiple, sometimes conflicting objectives [58,59].
All this considered, this paper aims to apply a combined AHP-GIS approach to map the spatial distribution of FF in the geographical area known as “Monti Dauni” (Apulia region, South Italy). For each forest unit of the assigned area, the main forest functions have been identified; as a result, the most coherent entrepreneurial economic activities and value chains have been selected to be launched and supported. These professional activities should be combined with optimal forest management, thus contributing to the sustainable conservation of forest resources and promoting the development of local communities by capturing the specific benefits (in terms of FES) that forests can provide.
On the other hand, some of these FESs may have the character of public goods or common resources; they therefore have no reference market, even though they are considered essential and valuable services. This means that alternative policy approaches are needed to ensure their sustainability, different from the traditional ones, based simply on supporting productive value chains or strengthening markets.
This approach requires the involvement of different stakeholder groups in order to reach a consensus on the prioritization of all possible functions and uses of forest resources; it also requires great care not to jeopardize the sustainable development of the area concerned.
The theoretical and applied framework developed in performing this case study can be a valuable analytical tool for decision makers and planners in the forest sector.

2. Materials and Methods

2.1. The Study Area

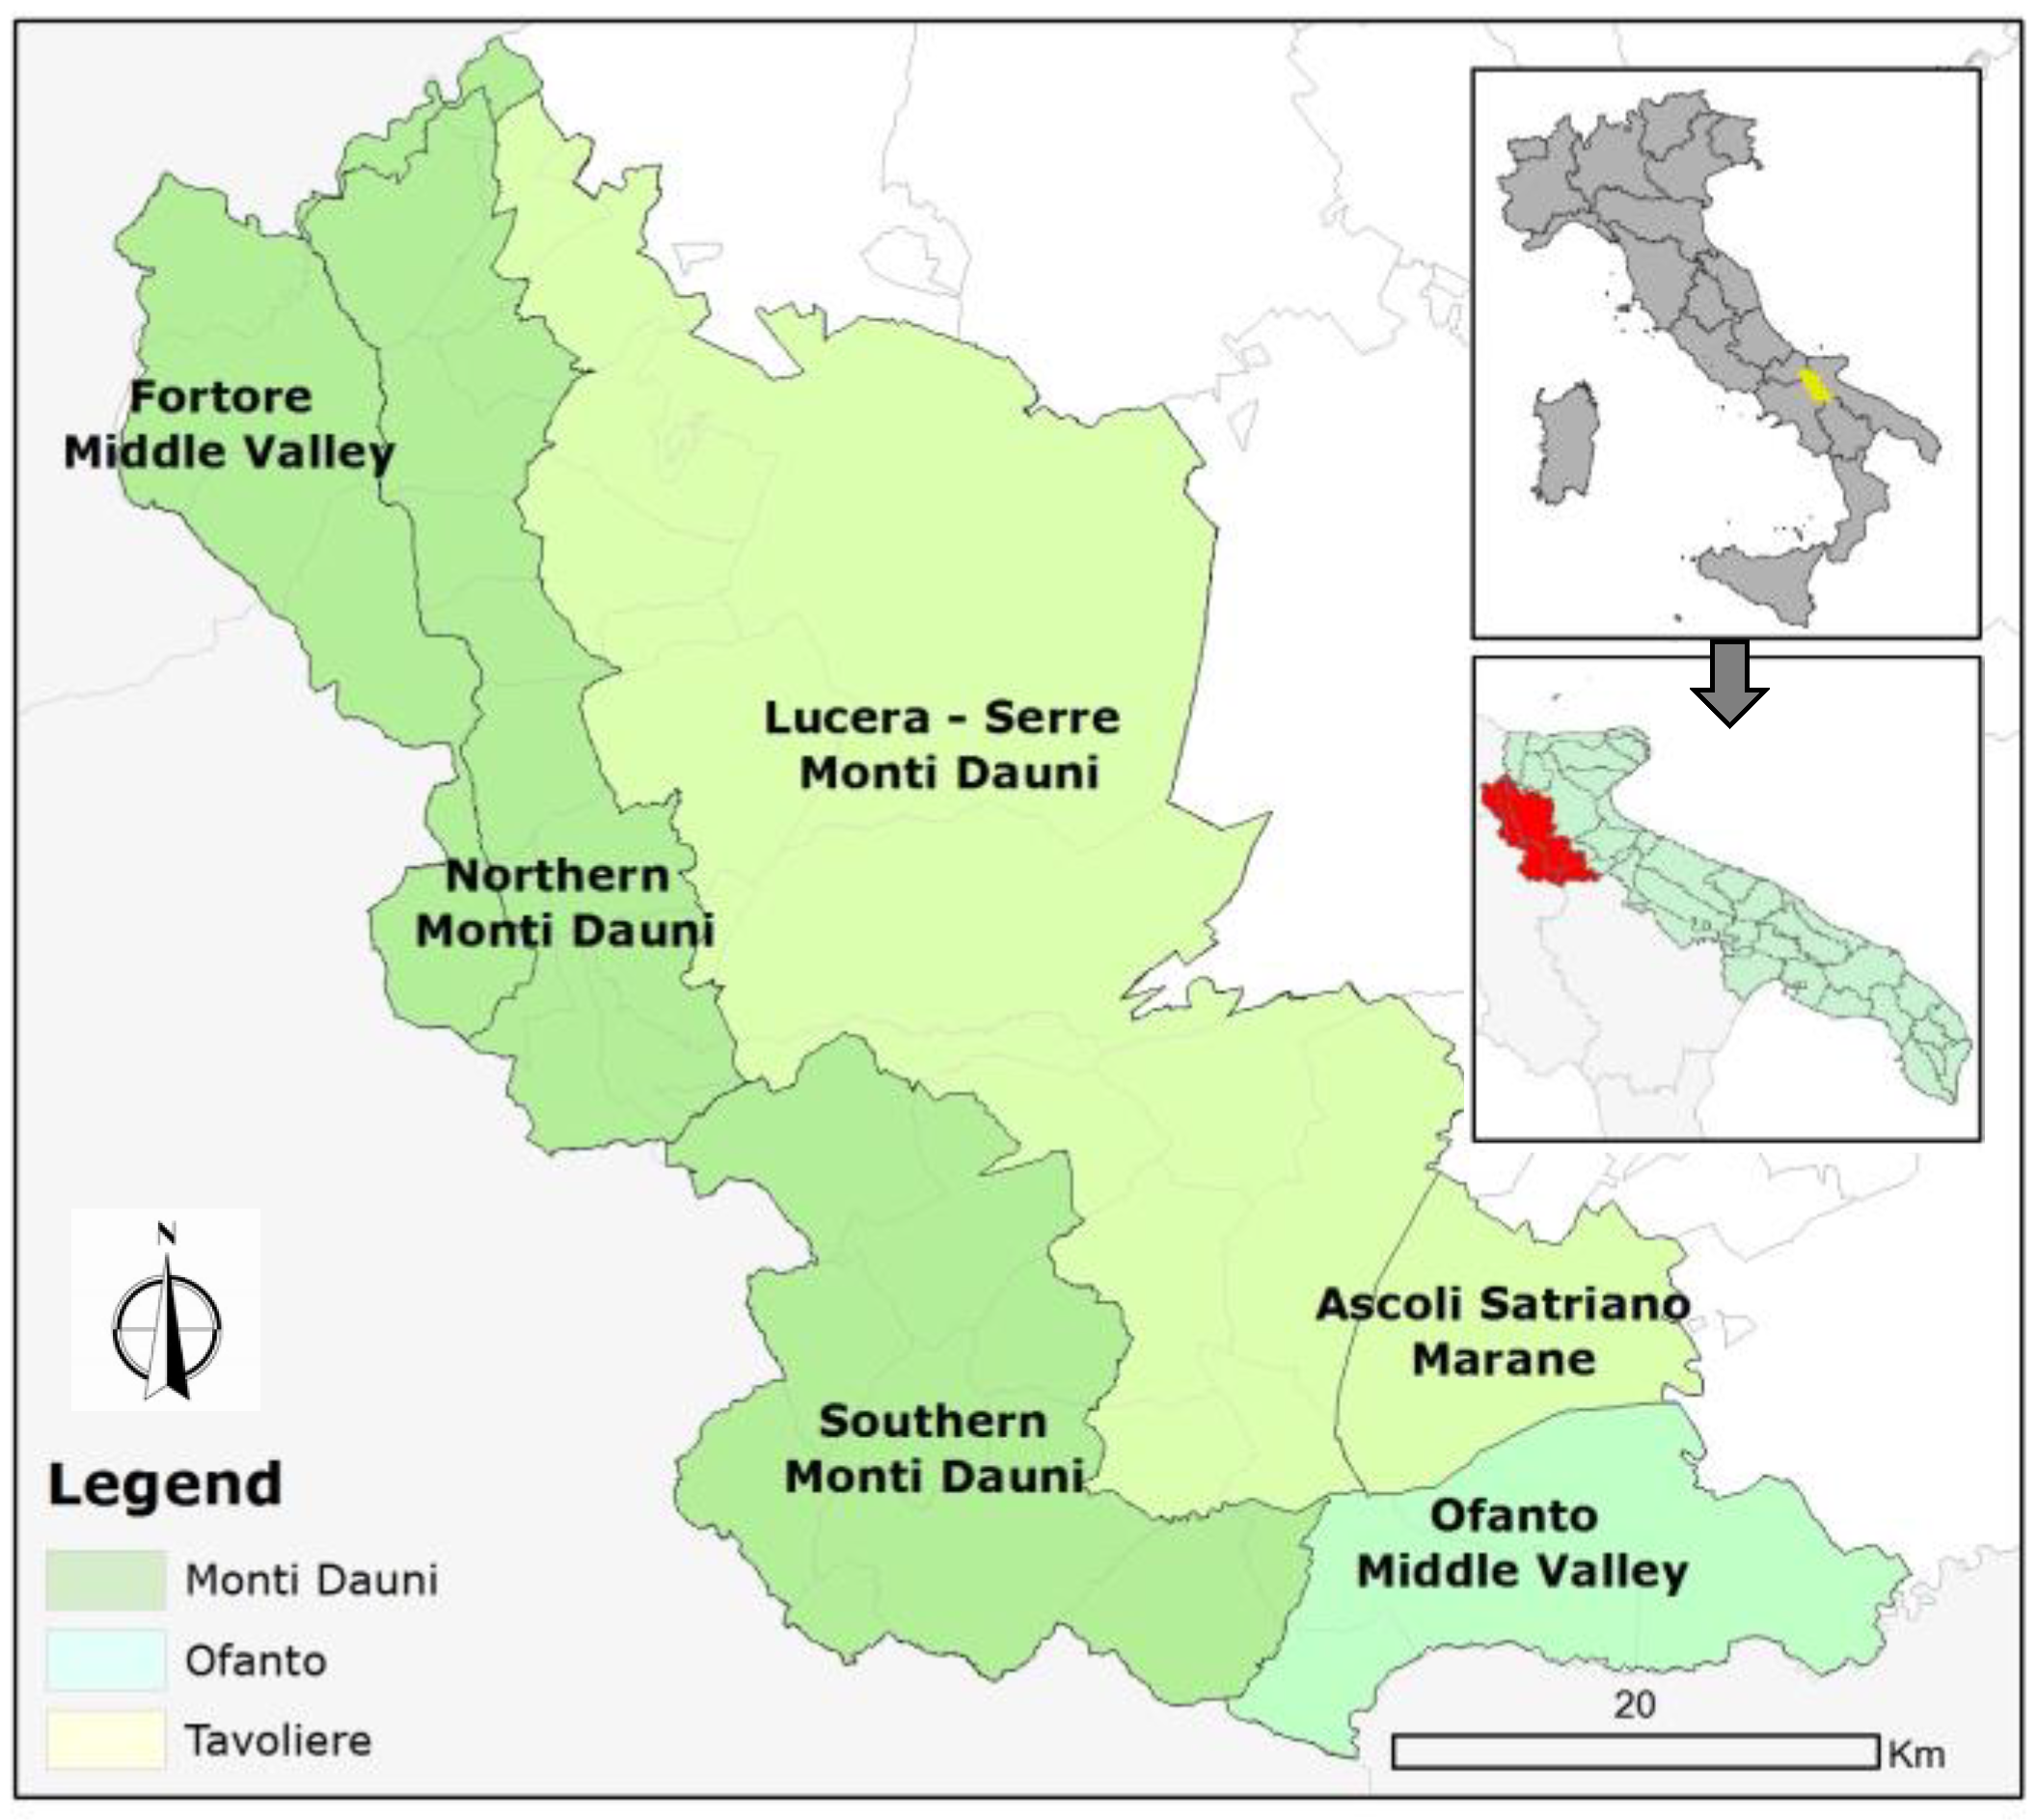
The study area (Figure 2) is located in the Foggia Province (Apulia Region, Southern Italy) and has a total geographical area is of approximately 2260 km2. It includes 31 municipalities belonging to three geomorphological zones, as defined in the Regional Landscape Plan: Monti Dauni (MD) and, only partially, Tavoliere (TV) and Ofanto Valley (OF). Each zone has in turn been sub-divided into even more homogeneous subzones, always according to more detailed geomorphological characteristics. In particular, the Monti Dauni was divided into the Middle Valley of Fortore (MD1), Northern Monti Dauni (MD2) and Southern Monti Dauni (MD3); Tavoliere was divided into Lucera-Serre dei Monti Dauni (TV1) and Marane di Ascoli Satriano (TV2), while the Ofanto area was represented by only a small part of its land, the Ofanto Middle Valley (OF1).
Monti Dauni is an area that stretches along a narrow strip in the north-western part of Apulia, right next to the Apennines. Its land morphology is typically hilly and mountainous, characterized by a well-developed hydrographic network; the rivers have a torrential regime.
Various types of anthropogenic transformation have contributed to the fragmentation of the natural areas and to the increase in the hydraulic and geomorphological risk. The forest vegetation is dominated by Quercus cerris, associated with Carpinus betulus, Carpinus orientalis, Cornus sanguinea, Rosa canina, Hedera helix and Crataegus monogyna, while Quercus pubescens becomes increasingly common and dominant on low and medium slopes. Agriculture is mainly extensive and widespread throughout the area, but only where the orographic and pedological conditions allow for its practice. The strong presence of arable land (grain cereals) is irregularly mixed with olive groves and, less frequently, vineyards.
Tavoliere is characterized by a vast and flat area, mainly cultivated with intensive agriculture, which extends to the hilly foothills of the Daunia Mountains. In terms of its hydrographical characteristics, the whole plain is crossed by several waterways, among the most important in the Apulia region (Carapelle, Candelaro, Cervaro and Fortore). These rivers have contributed significantly to the geological formation of the area with their constant and prolonged supply of sediments. The boundary that separates this plain from the Daunia Mountains is gradual and usually corresponds to the first reliefs formed by allochthonous geological strata.
Only a small part of the Ofanto Valley is included in the study area, which runs parallel to the banks of the Ofanto river itself. The hydrological regime of the Ofanto river is typically torrential, characterized by long periods of drought combined with short but intense floods, especially in the autumn–winter period. In this predominantly man-made environment, any type of human transformation leads to a reduction in the few remaining semi-natural areas and represents a strong critical “vulnus”. The main factor in the conversion of land use and the consequent degradation of the natural environment is agricultural activities, which tend to expand by eliminating the riparian vegetation and the few remaining wooded areas.

2.2. Methodological Approach

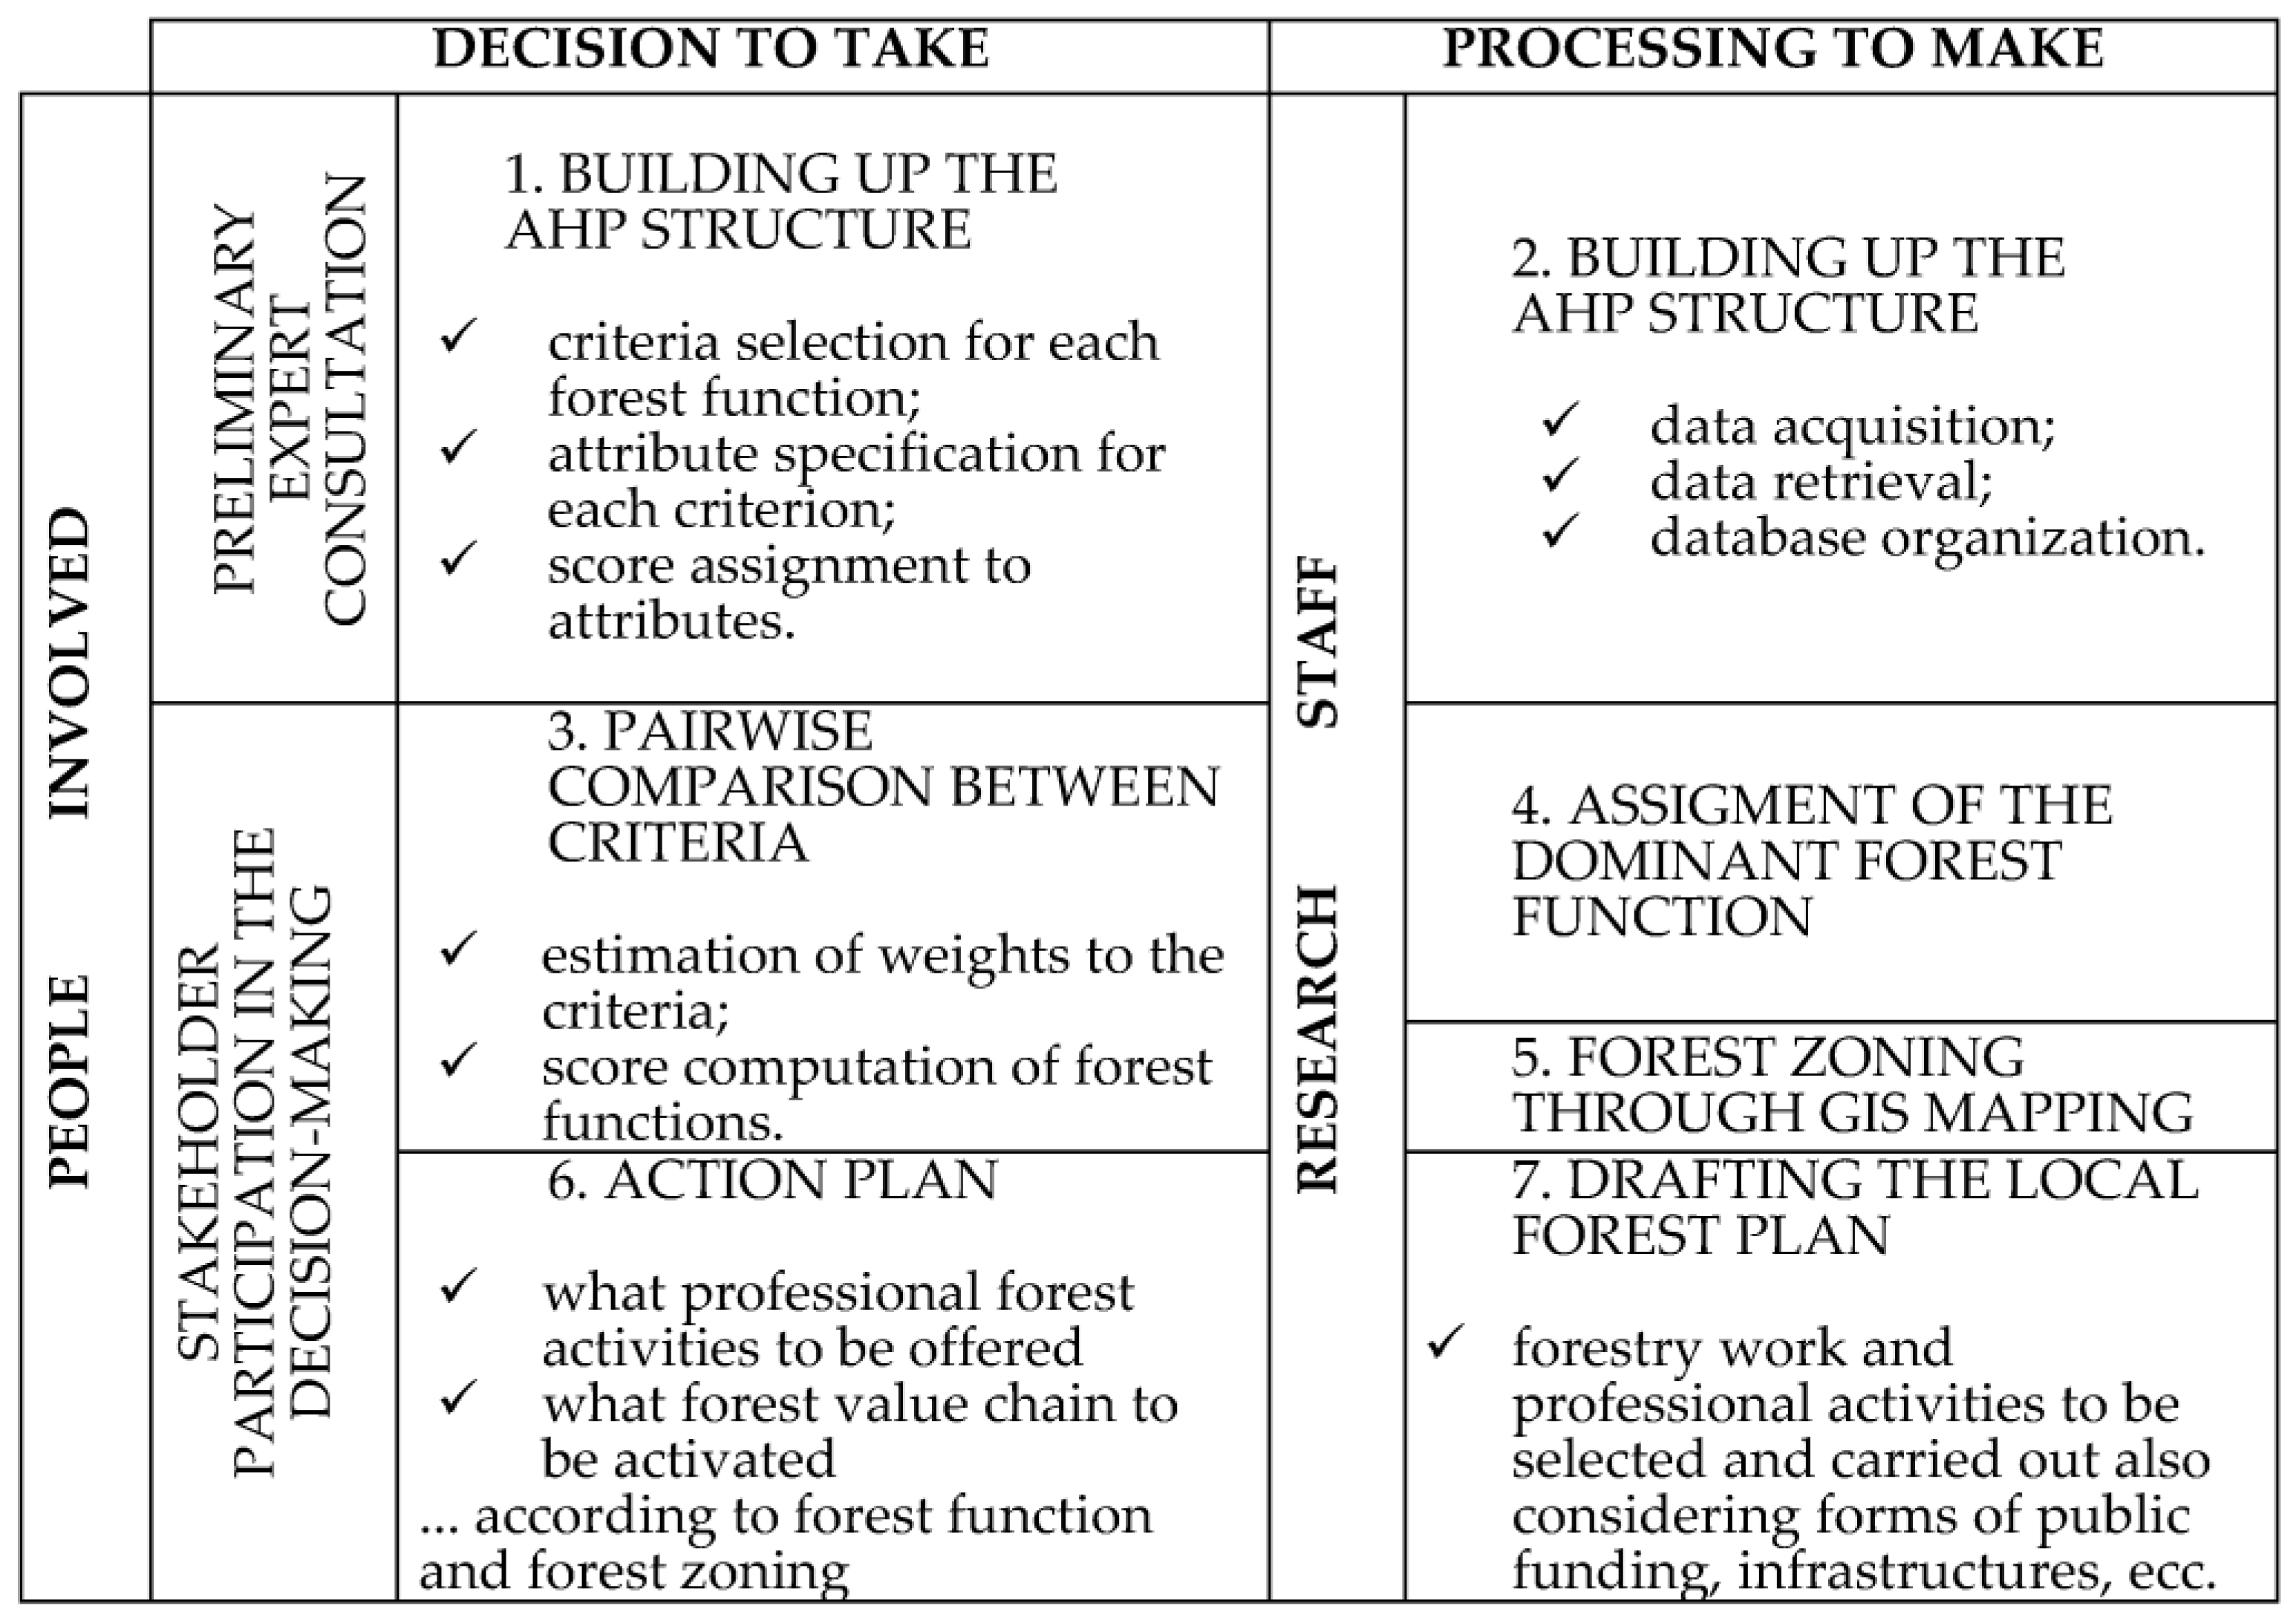
The AHP multi-criteria assessment [60] was carried out in combination with GIS, as mentioned in the previous section. Therefore, the applied methodology was split into two successive phases: (a) AHP application and (b) forest zoning through GIS mapping. The AHP itself is a complex procedure that consists of several consecutive steps. These steps also require the direct involvement of experts (for preliminary consultation) and stakeholders (for final decision making). Figure 3 describes the rationale of the methodological approach used in the case study and its sequential steps. The same outline also shows the organizational structure of the paper. Once the zoning of the four forest functions and their mapping had been completed, the results were commented on, taking into account the range of forest entrepreneurial activities to be supported and the professional services to be offered (last step: drafting the local forest plan).

2.3. AHP Application

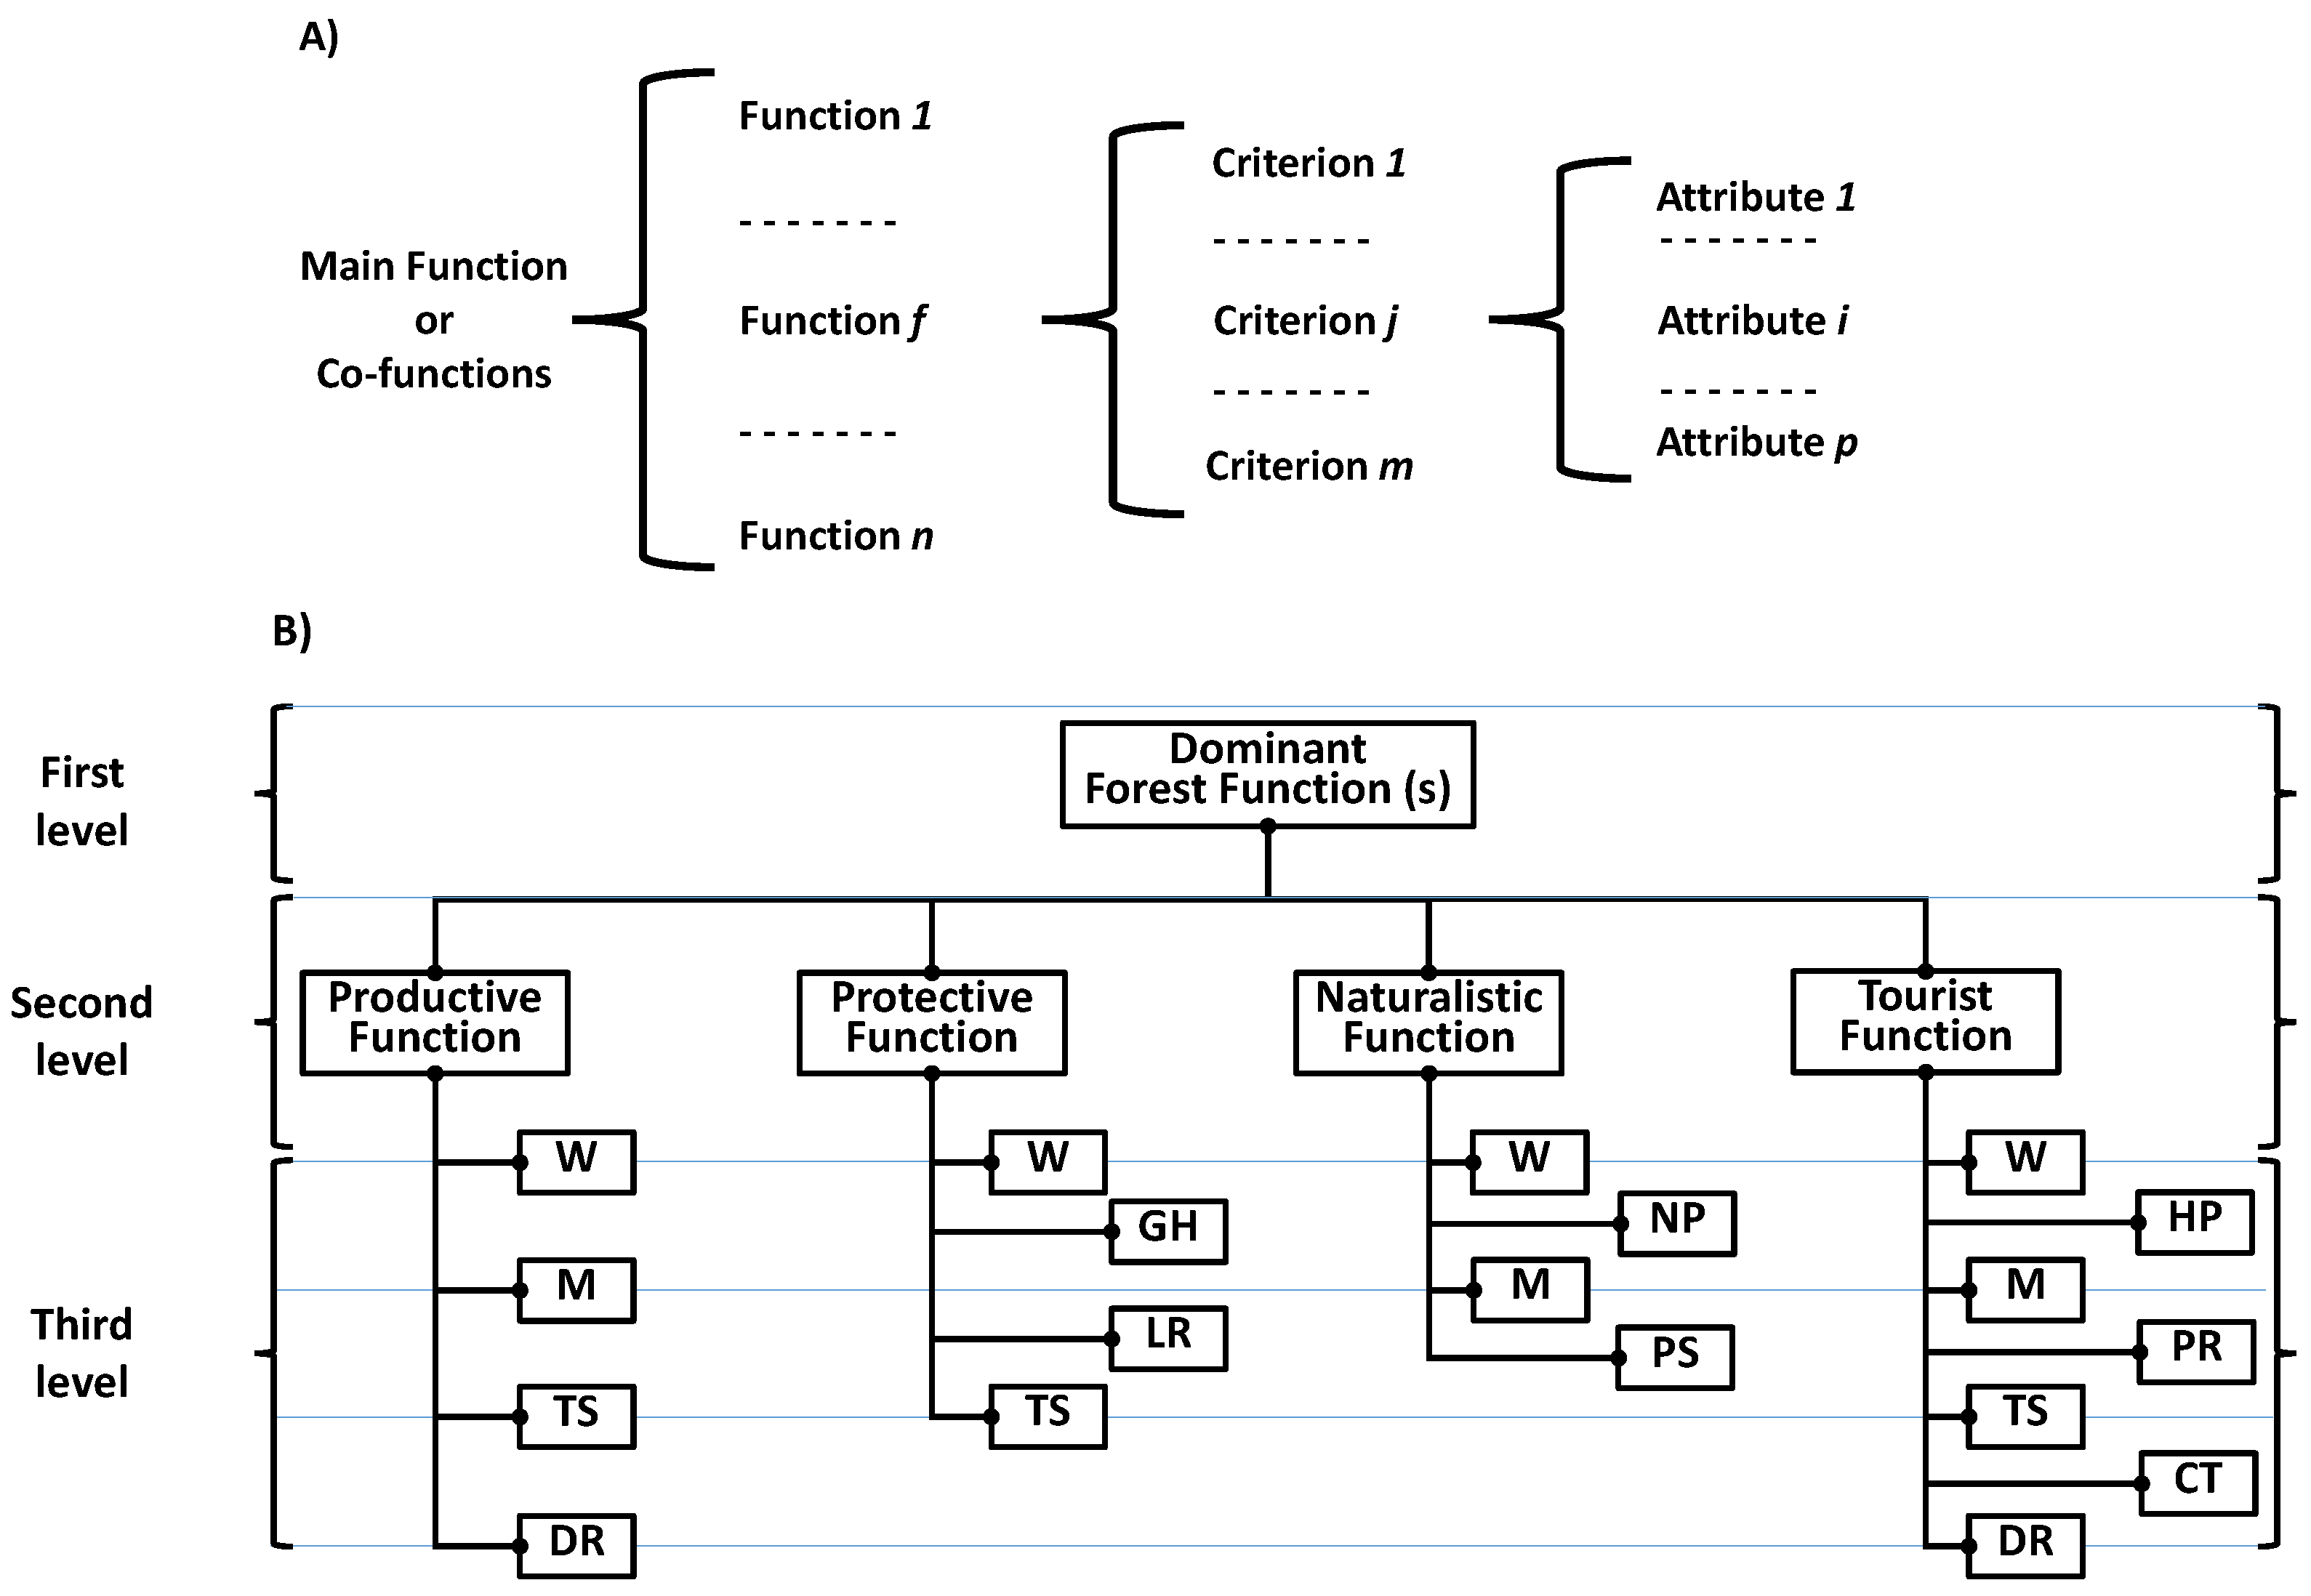
The final goal of the procedure was to objectively identify the dominant FF for each forest unit in the area by considering the four alternative options already mentioned in Section 1 and shown in Figure 4B. The steps were as follows.
(a) Establishment of the analytical hierarchical structure: criteria selection and score assignment by experts. The approach was based on breaking down the decision to be made (i.e., identifying the dominant FF) into different evaluation steps according to a hierarchical structure (Figure 4). The goal is placed at the first level (i.e., the final decision), the four forest function options are placed at the second level and, finally, several criteria affecting each forest function are placed at a lower level, in turn defined by a certain number of attributes (Figure 4A). It was up to a limited pool of “experts” to decide on the number, type and nature of these criteria and to assign scores to each criterion attribute. Five scientists and technicians in environmental and forestry sciences were asked to select noteworthy criteria and their corresponding attributes that affect each forest function. The criteria were then assigned to the four FFs according to the experts’ judgement. It could be the case that the same criterion was assigned to characterize all FFs (as in the case of W), three of the four FFs (as in the case of M and TS) or two (in DR); see Figure 4B. In other words, some criteria proved to be strategically relevant, and a certain degree of “redundancy” in the dataset was considered necessary.
As suggested by local experts, five forest land use categories (W attributes) were identified, i.e., evergreen oak forest; deciduous oak forest; other deciduous forest; riparian woods; and afforestation with conifers. The W criterion was assigned to each FF (Figure 4B). Three forest management (M) typologies were considered for each FF, i.e., high forest; forest coppice; forest in natural evolution (M attributes). The M criterion should affect every FF except the protective one, i.e., PRD, PRT and TRS (Figure 4B). The distance from the road (DR) affects the productive and tourist functions (PRD and TRS): the closer the road, the higher the score. The road network includes national, provincial, local and forest roads. Three terrain slope ranges (TS attributes) were identified, from 0 to 10%, 10 to 20% and more than 20%. TS affects productive, protective and tourist FFs (PRD, PRT and TRS, respectively). The geomorphological hazard (GH) areas were classified in three different levels (GH attributes), i.e., low-, medium- and high-hazard conditions, in accordance with the Regional Hydrological Plan. Landslide risk (LR) is related to current or past conditions of land instability, and, when present, the maximum score was always applied. Specifically, landslide risk includes areas with the presence of gullies (“calanchi”) and landslide bodies (“corpi di frana”) and areas with widespread instability (“dissesto diffuso”). Both GH and LR were only associated with the protective FF (PRT). The presence of footpaths or hiking pathways (HP) is strictly related to the forest tourist function (TRS), together with roads of scenic and panoramic value (PR) and places of cultural interest (CT) or tourist–recreational facilities. Natural protected areas (NP) and protected wild species (PS) are criteria specifically linked to the forest naturalistic function (NAT). In particular, the PS criterion takes into account the overlapping presence of the species listed in the Habitat Directive Annexes in each mesh of the 10 × 10 km grid covering the entire study area.
(b) Data acquisition and retrieval. According to the selected criteria, the combined AHP and GIS application required the organization of a huge database and the collection of a large number of digital data, both in vector and raster formats. All the data were retrieved from different institutional websites, while the database on the spatial distribution of forest categories was mapped by a couple of forest technicians with solid knowledge of the local forests, although supported by the availability of the regional CORINE land use/cover map (Table 1). The digital data have been converted into a raster format, taking into account a regular grid with a mesh of 30 × 30 m, which captured all kinds of polygonal vector data. As a result, the entire dataset consisted of an impressive number of cells (Not = 219,459). The spatial data were all referenced to the World Geodetic System 1984 (WGS84) and UTM (Universal Transverse Mercator) projection in the 33 North zone.
(c) Pairwise comparison of criteria: weights attribution by stakeholders. The next step of the procedure involved a participatory approach for estimating the weights of the criteria selected by the “experts”. The stakeholders consulted were chosen from among professionals, local policymakers, regional administrators, academics, representatives of local citizens’ associations, local opinion leaders, individual entrepreneurs or representatives of entrepreneurs’ associations, NGOs and environmental activists. Their involvement made it possible to address the full range of issues to be considered in forest planning (social, environmental, economic, cultural, etc.). Moreover, an important side effect of this participative procedure was the sharing and empowerment of social learning and decision making [61]. Thirty stakeholders were engaged in a one-day meeting to complete a questionnaire and to discuss and share their views on FF and FES. The questionnaire was structured to present different matrices of criteria in each function. Stakeholders played their role by estimating the relative importance of each criterion compared to another within the same forest function, according to the pairwise approach on which the AHP is based. The AHP procedure was explained to the participants, and they were also given guidelines on how to fill in the questionnaire form. A full description of the AHP procedure can be found in [60]. In addition, an online AHP application is available [62], together with an AHP Excel template [63], for easily performing all the matrix/eigenvalue calculations and obtaining the full set of appropriate check indices on the results. Briefly, successive pairwise comparisons between criteria were performed using the well-known nine-step scale (AHP scale: 1—equal importance, 3—moderate importance, 5—strong importance, 7—very strong importance, 9—extreme importance, while the 2, 4, 6 and 8 values are in between); the resulting matrix calculation allows for obtaining the corresponding weights. The degree of reliability of the behavior of each stakeholder (i.e., decision-maker) was estimated by calculating an index called the “Consistency Ratio” (CR). If the CR value was less than or equal to 0.1, the combination of weights assigned to the set of criteria per each function was considered satisfactory; otherwise, some or all of the pair comparisons had to be revised [45]. In this way, all criteria associated with each forest function were weighted by each stakeholder. The well-known property of weights is, of course, that their sum must be equal to 1. The weight distribution of criteria among different stakeholders was analyzed using Shannon entropy [63]. The total entropy was partitioned in two independent components (α- and β-entropy) to derive an AHP consensus indicator. The consensus indicator ranges from 0% (no consensus) to 100% (full consensus). The whole range is divided into five categories: very low, low, moderate, high and very high. Consensus on weighting should be at least “moderate” in order to proceed; otherwise, a higher degree of consensus should be achieved through discussion and iterative reprocessing of the pairwise comparison [64]. Provided that the consensus indicator is satisfactory, the individual stakeholder judgements derived from each pairwise comparison within the criterion (i.e., weight estimation) can be aggregated by using either the Geometric Mean (GM) or the Arithmetic Mean (AM). The GM vs. AM aggregation methods have attracted some criticisms in terms of their transparency and suitability for achieving a real and true group consensus. A long dissertation in favor of one or the other method can be found in [65]. The AM-AHP was the method used in this work to extract stakeholder opinions or judgements (criteria weights), just for the sake of simplicity and clarity.
(d) Assignment of the dominant forest function to forest units. Once the partial scores and weights have been determined for each criterion (j) within each forest function (f), the calculation of the overall score to be assigned to each forest function is obtained from the weighted sum of the partial scores. A new and comprehensive raster format layer (30 × 30 m mash size) was obtained through the weighted linear combination of all the raster layers considered, corresponding to the selected criteria; each layer was in fact spatially related to one of the previously considered criteria. The following equation was applied (Equation (1)):
C i f = j = 1 m w i f * C i f j
where Cif was the final score of the ith cell of the grid considering the fth forest function, wif was the weight assigned to the jth criterion of the fth forest function from the AHP analysis, Cifj was the score assigned to the ith cell of the grid considering only the single jth criterion of the fth forest function and m represents the total number of criteria considered in this fth forest function [66].
To assign the prevailing FF to each ith cell of the grid, the easiest way would be to select the maximum normalized score and assign its corresponding FF to the ith cell of the grid, according to the following Equations (2) and (3):
C i f = C i f C M I N f C M A X f C M I N f
C i = M a x C i f f A ; A = { f 1 , f 2 , f 3 , f 4 }
However, this solution was considered to be too “sharp” or “crisp”, while a relative “fuzziness” should be more suitable for applications such as this. A different approach was therefore devised as follows. The quantile values (Qif) of each Cif were calculated according to the following equation (Equation (4)):
Q i f = 100 * R i f N + 1
where Rif is the “averaged rank” of the Cif score (for each ith cell of the grid considering the fth forest function). If the score is unique, then the averaged rank is the same as the rank; if the score occurs k times, then the averaged rank is computed as the sum of the score’s ranks divided by k. The following step is to assign to each Qif the ordinal value of its corresponding quintile category (Zif), a quintile being any of five equal groups into which the Qif population can be divided according to its distribution (Equation (5)):
Zif = 1;  if:  0 ≤ Qif < 20
Zif = 2;  if:  20 ≤ Qif < 40
Zif = 3;  if:  40 ≤ Qif < 60
Zif = 4;  if:  60 ≤ Qif < 80
Zif = 5;  if:  80 ≤ Qif ≤ 100
The dominant FF for each ith cell of the grid would be the FF corresponding to the maximum quintile category (Zif) in that cell (Equation (6)):
C i = M a x Z i f f A ; A = { f 1 , f 2 , f 3 , f 4 }
If the quintile categories (Zif) were the same for two or more f forest functions, the ith cell is assigned a double, triple or even quadruple function, thus identifying multifunctional conditions, i.e., the simultaneous land suitability for several forest functions.

2.4. Forest Zoning through GIS Mapping

For each f-forest function and ith cell of the grid, the quintile categories (Zif) can be represented by different color gradations or shades (from the lightest to the darkest) to obtain a suitability map concerning a specific FF. In addition, the four FFs can be combined into a single map by representing in each ith cell only the dominant function F (that of the highest quintile category), according to a panel of different colors.

2.5. Remarks on GIS-AHP Integration

The selected criteria and, within each criterion, the attributes associated with them to characterize forest functions are all represented by spatially referenced variables. They are therefore appropriately managed using GIS software. For this purpose, we used Arc GIS 10.1 software. After defining the hierarchical structure of the AHP (by experts) and the weights (by stakeholders), the partial scores applied to each forest unit for the four different forest functions (FF) were processed in the GIS environment. These scores were transferred to an Excel spreadsheet in order to calculate the dominant forest function(s) using the previously reported formulas (Form. 1, Form. 3a, 3b, 3c, all implemented in Excel). At this point, the FF assignment for each forest unit was transferred back into the GIS environment to produce the forest zoning and the final result maps.

3. Results

3.1. Spatial Distribution of Forest Cover and Main Forest Features in the Area

The total forest surface in the study area is equal to 21.5 thousand hectares (Table 2), which represents about 10% of the total geographical area concerned. The most widespread forest type (W) is “deciduous oak” (16,615 ha), followed by the “coniferous reforestation” (2748 ha) and “riparian forest” (1419 ha). The other forest types are very poorly represented: “other deciduous forest” and “evergreen oak forest” are limited to 720 ha and 18 ha, respectively.
With regard to forest management (M), forest coppice is by large the most frequently applied management form (14,774 ha), while high forest management is applied much less frequently (5105 ha). A large number of coppices are currently in the process of being converted into full-grown forests, while natural evolution forests represent those forest forms that are gradually undergoing naturalization due to land abandonment, mostly agricultural land.
A slow process is taking place in the area: agriculture is gradually being deactivated, and the agricultural land is developing into a secondary natural vegetation cover; species still associated with agriculture are becoming increasingly marginal, while wild species (shrubs, bushes and, finally, trees) are taking the lead. In order to clarify whether the wooded area can be classified as “forest in natural evolution”, a definition is given below. It consists of low and closed vegetation, mainly composed of bushes, shrubs and herbaceous plants in natural evolution, often originating from former agricultural land or Mediterranean “maquis”, through plant recolonization from adjacent areas.
In terms of geomorphological zones (Table 2), MD1 contains the largest forest area (7064 ha), followed by MD3 (6783 ha) and MD2 (6527 ha), while the other zones (TV and OF) have much smaller forest areas. The three previous main representative zones (MD1, MD2 and MD3e), all of which are included in the Monti Dauni (MD) area, have a roughly equal share of the total forest area, corresponding to 32.8, 30.3 and 31.5%, respectively. The remaining 5.3% of the total forested area is found in the other considered zones (TV and OF), which are located at much lower altitudes, on flat and valley terrain.
MD1 had the highest relative incidence of forest area in its own territory (30.1%), followed by MD2 (22.8%) and MD3 (17.3%). On the other hand, in both Tavoliere (TV) and Ofanto (OF), the presence of forest is very limited, averaging less than 1% of the corresponding territory.

3.2. AHP Results

The total set of criteria considered in the analysis, their associated attributes, the scores assigned to each criterion attribute and the weights estimated for each criterion in influencing the total score of each forest function are presented in Table 3. This table reflects all the work done first by the “experts” and then by the “stakeholders” during the participatory process (as shown in Figure 3).
The scores assigned to attributes of the criteria ranged from 1 (low relevance) to 5 (high relevance) or from 0 (criterion not present) to 5 (criterion present). A total of eleven (11) criteria were identified. The criteria are the following: forest land use categories (W), forest management (M), terrain slope (TS), distance from the road (DR), geomorphological hazard (GH) and landslide risk (LR), protected natural areas (NP) and protected wild species (PS), presence of footpaths and hiking pathways (HP), road having landscape and panoramic value (PR) and presence of places of cultural interest and tourist–recreational facilities (CT). It should be noted (Table 3) that the influence of each redundant criterion is not the same for each forest function and that different relative scores were applied [67].

3.3. Assignment of the Dominant Forest Functions to Forest Units

The higher the Quintile (Zf) associated with a forest unit, considering a particular FF, the higher the suitability of that same unit for that particular function. The results showed that about 55% of the forest units had the highest Quintile (the 5th), while cumulatively, about 84% had the 5th or the 4th Quintile (Table 4).
In general, this indicates a high level of forest suitability in terms of functions for which the forest resources of the area can potentially be used. Regarding the assignment of the dominant FF to each forest unit and the resulting forest zoning (Table 4), the most representative FF is the naturalistic function (NAT ~ 23%), followed by the protective and productive function (PRT, PRD ~ 15%–17%) and, finally, the tourist function (TRS ~ 12%). The single FF attributions are largely predominant, ranging from 12 to 23%, while the double attributions range from approximately 2 to 6%. Cumulatively, 67% of the attributions considered only a single FF (i.e., functionally specialized units), while about 27% showed a double attribution; the remaining 6%, approximately, showed a forest multifunctional attitude, i.e., three or even four common functions (Table 4).
Considering the six geomorphological zones of the area (Table 5), MD1 and MD2 are particularly suitable for the naturalistic function (NTR), while in MD3, the protective function (PRT) prevails. TV1 and TV2 are more suitable for the productive function (PRD), and OF1 is more suitable for the naturalistic function (NTR).
A deeper insight into the suitability of the geomorphological zones for different and specific forest functions (or their combination) can be obtained from Table 6. Deviations of the percentage distribution of forest units from the average of the whole geographical area are shown in the table, considering the six geomorphological zones. In MD1, relevant positive deviations were observed considering the functions NTR and TRS, while negative deviations were related to PRT, both as a single function and in combination. In MD2, the NTR function showed the highest positive deviation, while the PRD function showed the lowest negative deviation. In MD3, the PRT function, also in combination with PRD, showed the highest positive deviations, while NRT showed the lowest negative deviation. TV1 is much more characterized by the very high negative deviation of NTR, rather than positive deviations that are more limited, such as PRT-TRS or TRS. Differently, TV2 stands out for the remarkable positive deviations in PRD and also in PRT, while NTR, similarly to TV1, showed a very low negative deviation. Finally, OF1 is marked by a high positive deviation matching NTR, together with NTR-PRT, while the PRD functions showed a quite low negative deviation.
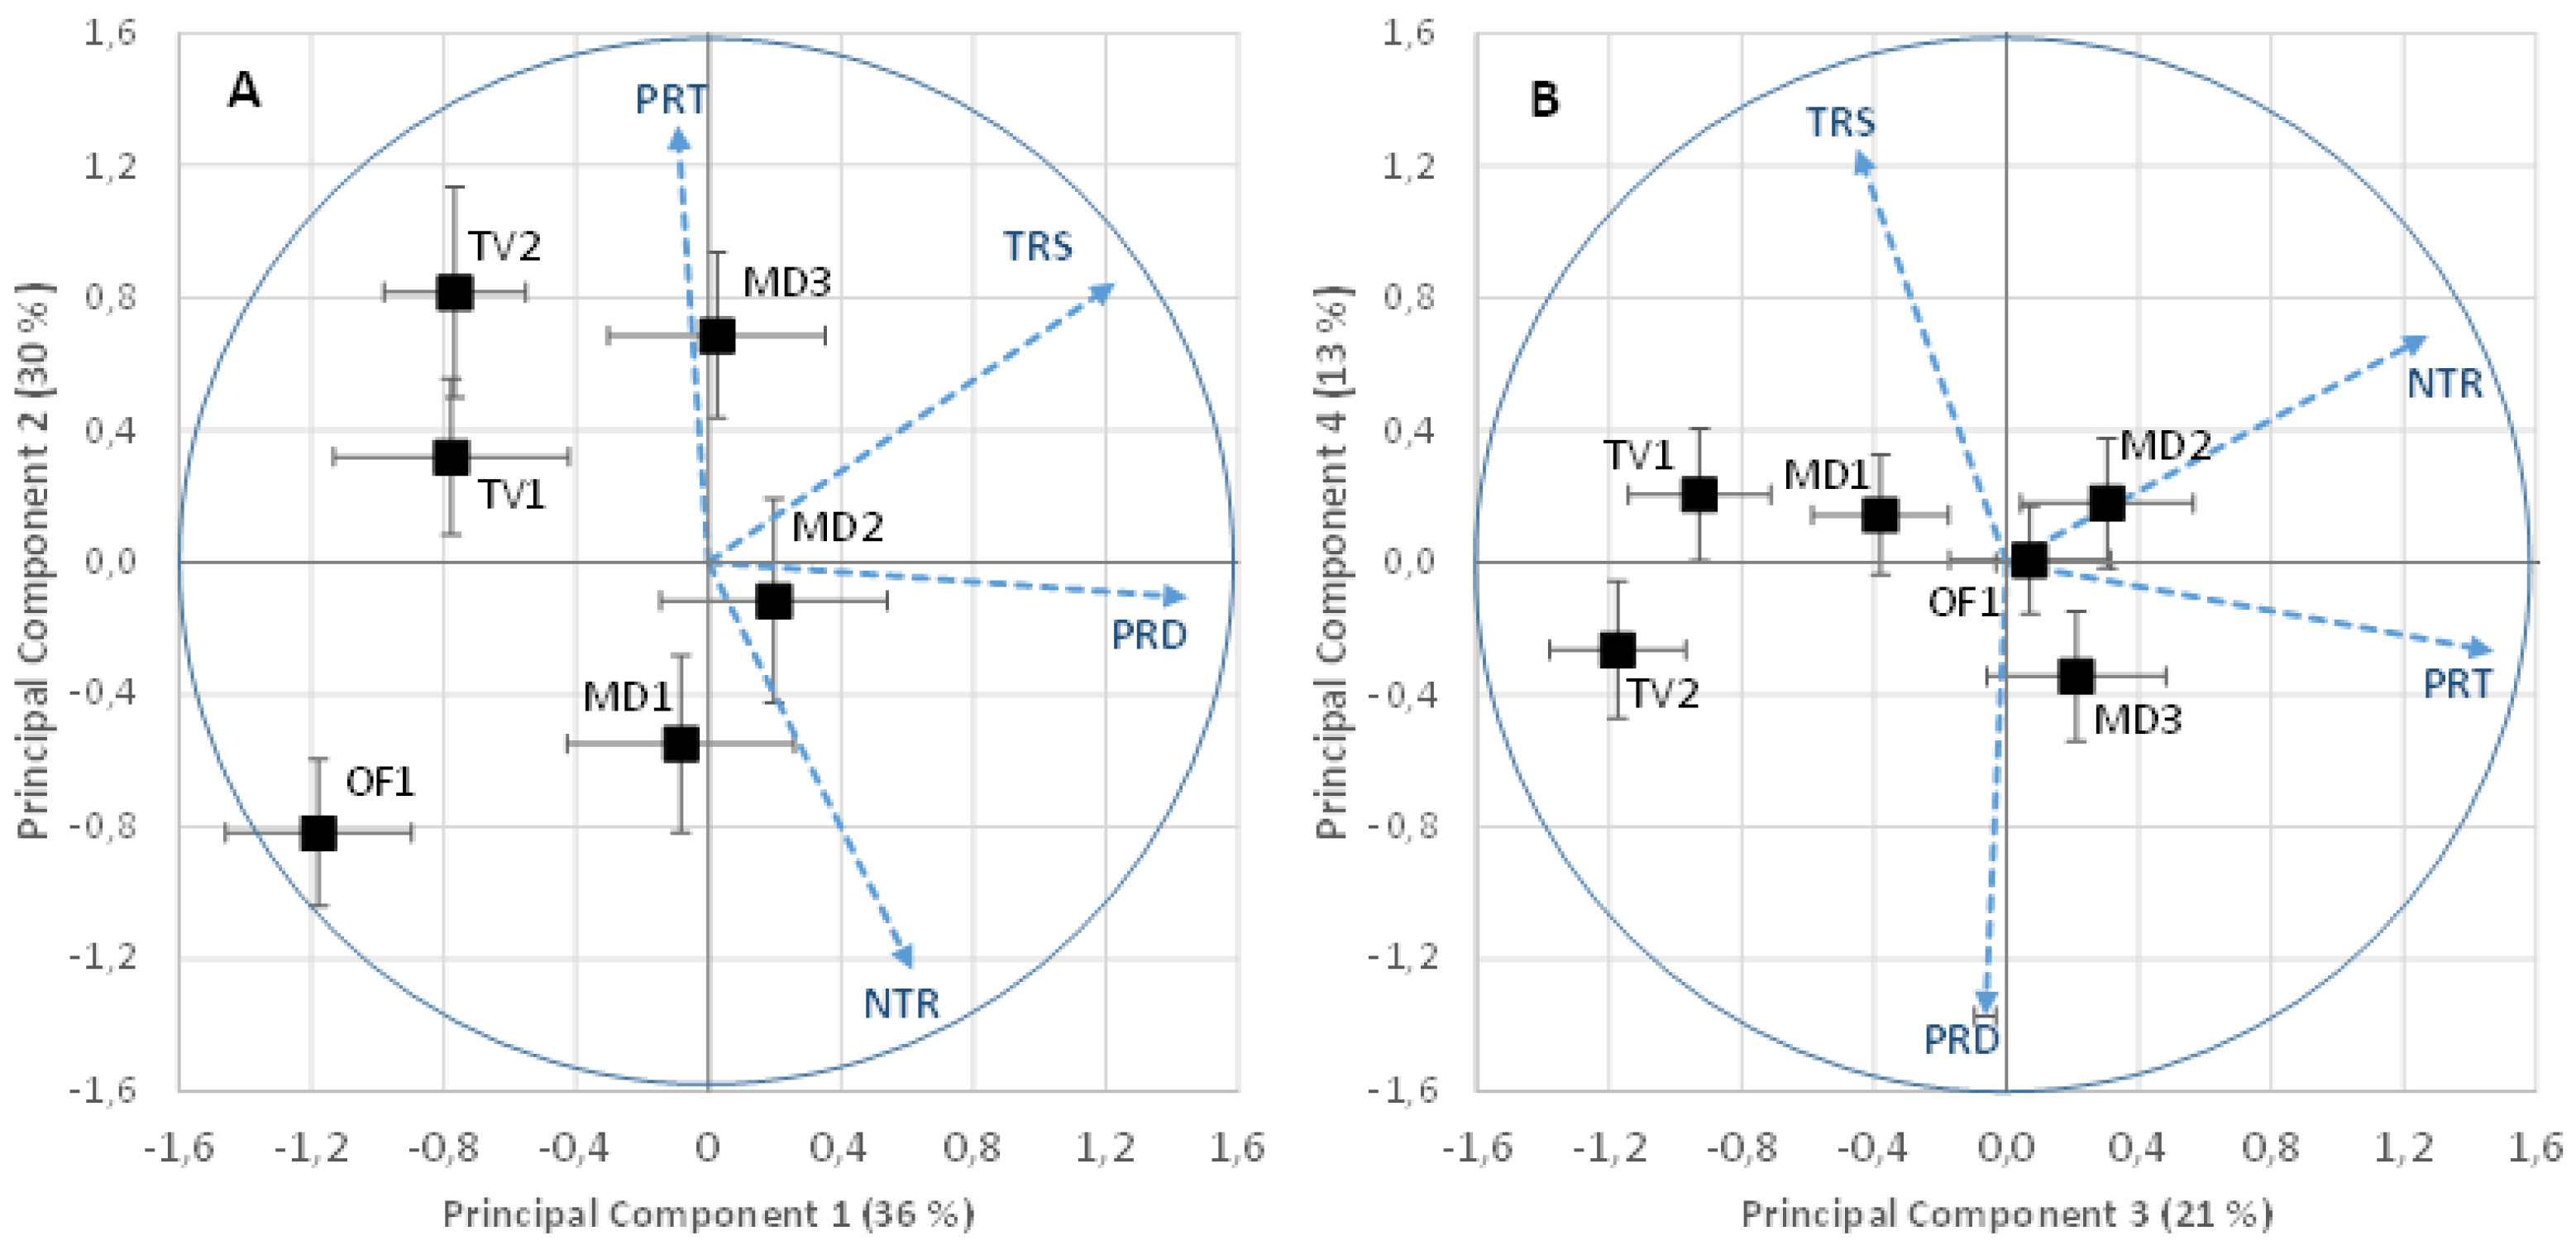
Similar considerations arise from the interpretation of the two “biplot” graphs (Figure 5) obtained by performing the Principal Component Analysis (PCA) on the score resulting from the AHP of the four forest functions converted into quantiles. The first two principal components (Figure 5A) accounted for 66% of the total variability of the data (i.e., SS: Sum of Square), while the other two components (Figure 5B) accounted for the remaining 34%. In Figure 5A, MD1, MD2 and OF1 have been distinguished by TV1, TV2 and MD3; a higher score in NTR and a lower score in PRT are the main common features in the first three zones, while the opposite was observed in the other three zones (hence NTR vs PRT). In Figure 5B, MD2, MD3 and OF1 have been distinguished by TV1, TV2 and MD1; lower scores in TRS and PRD are the main common features in the first three zones, while (almost) the opposite was observed in the other three zones (therefore, negative vs, positive TRS and PRD).

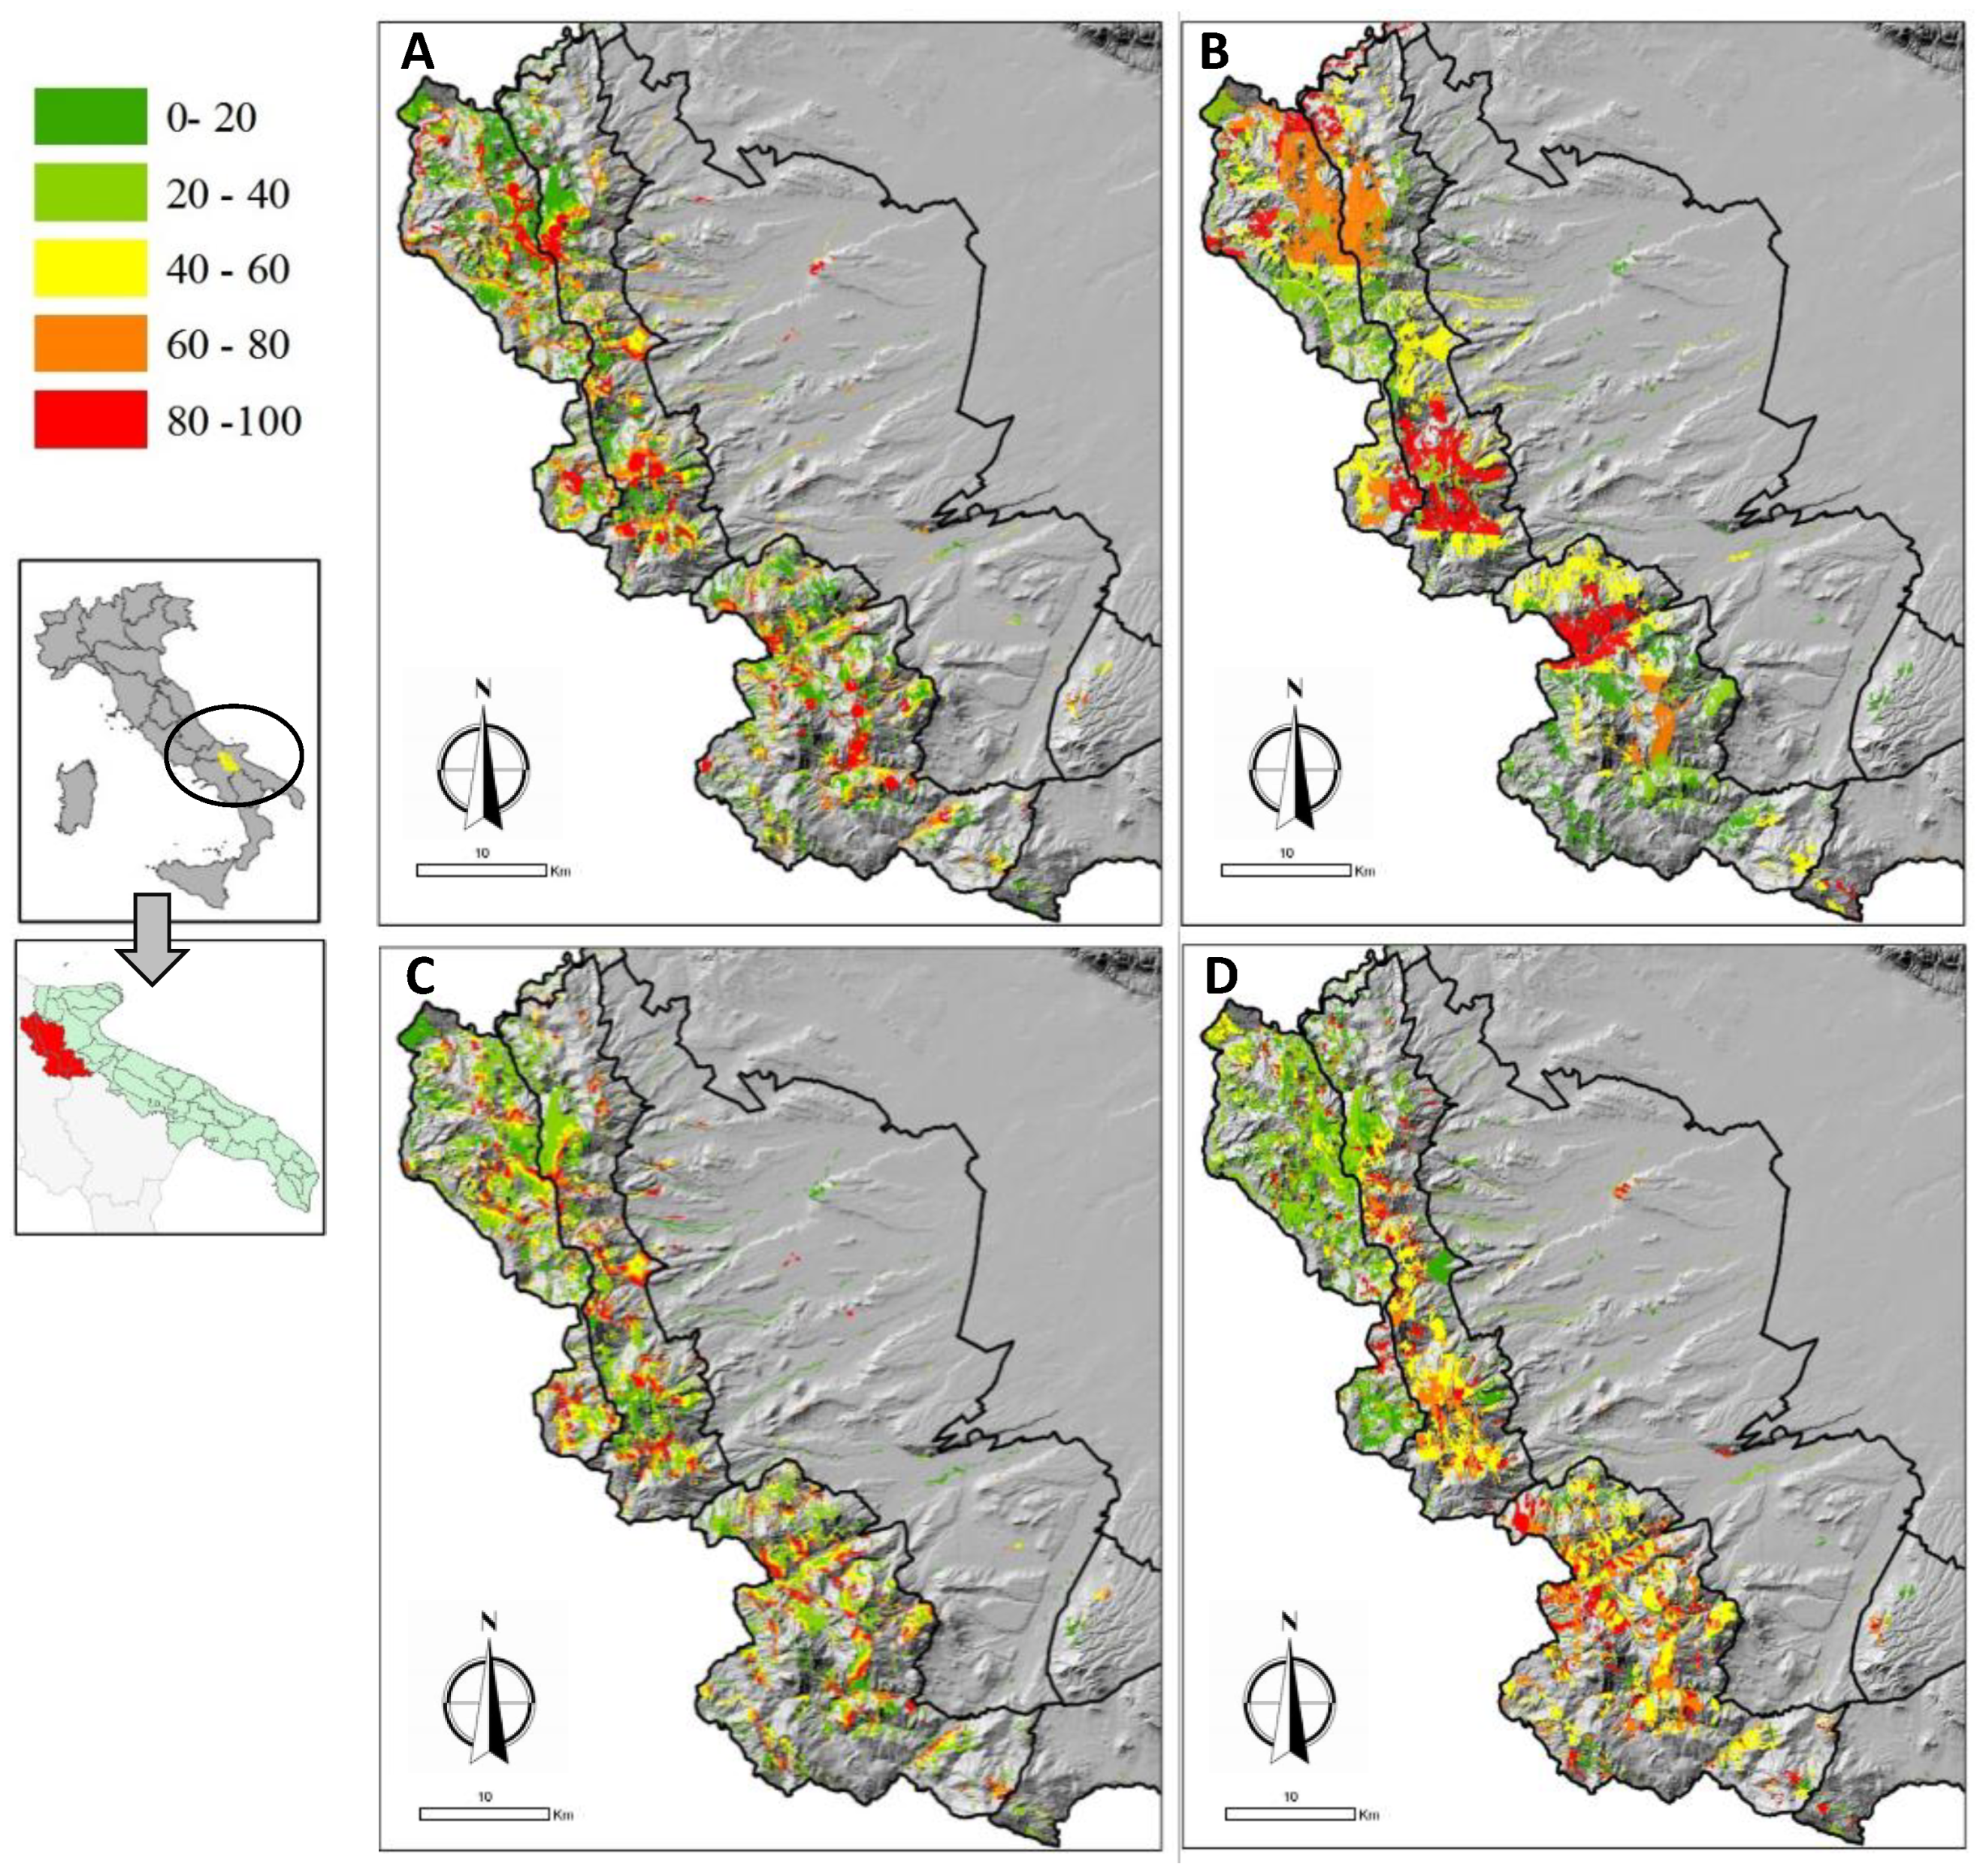
3.4. Mapping and Zoning of the Forest Functions

Figure 6 shows the maps corresponding to the four forest functions. The suitability for each function is represented by five successive ordinal levels, each corresponding to its quintile. The darkest green color indicates the lowest quintile (from 0 to 20% of the total ranking), i.e., the lowest suitability for the forestry function considered; on the other hand, the red color indicates the highest quintile (from 80 to 100% of the total ranking), i.e., the highest suitability for the forestry function considered. It can be seen that the dominant forest functions are not spatially aggregated but, on the contrary, are widely distributed over the whole geographical area, which does not allow for highlighting large and well-defined zones where one function prevails over the others. Figure 7 shows some detailed maps obtained by greatly magnifying the general map of forest functions at a much smaller scale. In this case, the forest polygons (or forest “patches”) in which one or two combined forest functions are dominant in relation to the score of the cells forming them are clearly highlighted as a result of the GIS-AHP procedure.

4. Discussion

4.1. The Local Forest Plan: A Mesoscale Planning Tool

Conventionally, forest planning in Italy has been based almost exclusively on the forest unit management plan. This planning tool is essential to managing a specific forest property, be it private or public or a productive or natural protected area. On the other hand, forest planning is also carried out at the broadest scale, i.e., considering all the forest resources of a territory, i.e., the administered land at the national or regional level. While the first detailed planning tool focuses on technical silvicultural issues and is mainly approached from a timber production perspective, the second broad-scale planning is a policy-oriented document aimed at governmental strategies within a legislative regulatory framework. Unfortunately, the single forest unit is too small to take into account all the physical and ecological processes that take place on a wider landscape dimension, specifically considering ecological connectivity, biodiversity and wildlife conservation, water run-off within the watershed, land cover changes and soil use dynamics and, to give just one example, forest expansion at the expense of pasture or agricultural soils or the range of forest functions that affects their use at the community level. Conversely, the national or regional planning dimension is too large to adequately improve forest management and to promote specific forest uses that properly combine the economic and ecological features of forest development [68,69,70,71].
In order for all landscape ecological processes to occur, there must be significant interactions between the various “tiles” of the ecological “mosaic”; this suggests a spatial dimension that encompasses the full potential diversity of the landscape and captures all possible interrelated occurrences. Moreover, the addition and integration of all the issues relating to the ecological, social and cultural characteristics of the area under consideration results in a considerable complexity which can only be dealt with on an appropriate scale, that of a relatively large terrain, albeit fairly homogeneous in terms of geomorphological and climatic characteristics, also taking into account human history, traditions and culture. As far as our experience in this case study is concerned, the Local Forest Plan (LFP) explores the most appropriate spatial dimension for capturing all the necessary information and placing it in a convenient decision-making perspective at the local community level. Therefore, this intermediate planning tool (operating at the mesoscale) can be considered very useful and appropriate for any forest area at a sub-regional scale.
The specific spatial dimension of local forest planning covers a not-too-large but multifaceted portion of land by taking into account the multifunctional forest dimensions to be included in the planning process, i.e., not only timber production but also different types of economic activities related to forest management. These components, together with nature conservation and recreational activities, can affect the social development of the community living in the area. For this reason, the definition of the objectives, tools and measures to be applied in forest planning must be based on a broad consensus, and the process should catalyze considerable agreement through an open participation of stakeholders, regardless of the specific interests that each of them may personally have. In addition, mountain communities are becoming fewer in number and are suffering from progressive demographic decline, so participation should be seen as a means of improving community aggregation and shared decision making. Figure 3 clearly identifies the sequential steps of the planning procedure and the people involved according to the goals of each process phase. Therefore, the validity of this operational scheme was confirmed.
The research staff guided and supervised the whole process, organizing the work in its successive phases and also processing the data and information. The support action of the experts in the preparatory phase is seen as a valuable option, while an essential condition is the involvement of a large number of community representatives, thus moving from analysis to decision making; the composition of stakeholders should include all possible roles that people play in the community. This could be a somewhat delicate operation, as biased or unbalanced representations should be carefully avoided.

4.2. Forest Planning as an Interface between Nature and Man

Forest planning establishes an operational link between the ecological processes that occur naturally in forests and the resulting forest functions that provide services for human benefit. In this respect, Haines-Young et al. [22] proposed the so-called “cascade” framework that can be schematized as the following:
Ecological Structure > Ecological Processes > Functions > Services > Goods and Benefits.
While “structure” and “processes” are still concepts belonging to the ecological domain, “services”, “goods” and “benefits” are instead concepts referring to a kind of “utility” perceivable only in the socio-economic domain. Through this “cascade”, there is a shift from natural systems to human organizations, following a pattern similar to a production chain [72]: the quality and integrity of the ecosystem organization (both structural and functional) enables the quality of human life, health and well-being. Therefore, the structural components of the forest ecosystem interact through the dynamic processes of the ecosystem functioning to provide direct or indirect services that embrace social welfare. Natural services are recognized to benefit the community living in the same forest area as well as human societies at large. While services are a flow resulting from the ecosystem functioning, a benefit can be identified as having a value in the social context and may be a tangible or even intangible good but still subject to a monetary quantification, at least conceptually. Of course, the reverse is also true: a modified ecosystem functioning because it is disturbed by human activities can lead to a failure in the provision of these services or even to “disservices” that cause direct or indirect damage to human society. In this respect, local forest planning should be the best participatory tool for consistently linking forest ecosystems with community needs, economic targets and social development expectations.

4.3. Forest Ecosystem Services as Commons

It is important to note that a wide range of forest ecosystem functions provide services that are not currently recognized by the market, because they are neither demanded nor provided by the market place, although they are absolutely necessary to ensure environmental quality and thus human existence. In fact, many services can be considered public goods, i.e., “commons”, whose management cannot be based on the functioning of the market as studied by economists. Since some important ecosystem services are not usually bought and sold in markets, market activity does not fully reflect the value provided by these services. These kinds of services are therefore at the greatest risk of degradation worldwide. The “tragedy of the commons” [73] describes the process by which “free” ecosystem services are typically overexploited and jeopardized, while conventional economic prescriptions fail to provide an effective governance to prevent their loss [74].
Against this background, a growing body of literature proposes the design of innovative payment schemes for forest ecosystem services as a general recognition of their intrinsic public value (similar in concept to CAP payments in agriculture for marginal farming conditions).
While the governance of ecosystem services is conventionally conceived of in terms of market mechanisms (in its private dimension) or public regulation (in its state-based perspective), there is a growing interest in the concept of ecosystem services from a “collective action” perspective [75]. In this regard, Elinor Ostrom, winner of the 2009 Nobel Prize in Economics, has already put forward a proposal in line with this concept, namely, a cooperative self-management of common natural resources and ecosystems. In Governing the Commons (1990) [76], she presents some examples of collective management from very different cultures that have found a community solution, i.e., an agreement based on precise rules of behavior that the members of the community know and respect or a consolidated institution, already known in the area, derived from customary law or traditions to which the community entrusts the management of the property [77]. Again, direct participation is an essential means of strengthening community ties and defining, collectively, alternative tools of governance.

4.4. The Multifunctional Role of Forests

There is a growing awareness and recognition of the multifunctional role of forests. For this reason, it was not the intention of this study to force the selection of only one dominant forest function. Rather, multiple functional preferences were valued, and co-functionality was encouraged where the results showed adequate scores for different functions. In our study, about 33% of the forest unit assignment showed an allocation of multiple forest functions, i.e., no single function identification.
The combination of two or more forest functions could lead to a problem of mutual compatibility between them. This issue should be considered and possibly evaluated on a case-by-case basis, i.e., by considering specific clusters of forest units, through more detailed analyses at a finer reference scale. In some circumstances, the naturalistic function (i.e., the protection of natural habitats) may be incompatible with the other forest function related to tourism use; therefore, stricter tourist restrictions should be applied to those areas with a higher fauna and flora value or to those areas whose ecological integrity is particularly fragile.

4.5. Forest Functions, Forest Professional Activities and New Potential Forest Jobs

Once the forest zoning has been carried out, it is advisable to identify the professional activities that could be of interest to forest enterprises and cooperatives, thus promoting new employment opportunities and offering innovative services alongside conventional ones. In this respect, the results of the “focus groups” carried out during the planning process (in which a large number of representatives of forest enterprises and cooperatives participated as stakeholders) made it possible to agree on a number of different work activities attributed to the forest functions identified in the zones of the entire area under consideration (Table 7). It is worth specifying that a “focus group” refers to a meeting of ten to twelve well-targeted stakeholders, brought together to discuss a specific set of issues under the guidance of a “facilitator”, who is properly trained to stimulate discussion. Three different “focus” meetings were held during the planning process, providing an almost complete representation of the forest companies operating in the area. The purpose of the meetings was to gain insights into the participants’ perceptions and opinions about their work and possible innovative development. Therefore, this was considered to be the right tool for inquiring about the forest companies and obtaining information about their work activities and, above all, about their attitude toward carrying out innovation. The economic and marketing development of forest products can be conceived through two complementary strategies: productive deepening and productive broadening, respectively [78]. Through “deepening”, the forest activities and the product value chains are internally extended, transformed and/or linked to other new potential customers. This strategy makes it possible to supply products with a higher added value per unit of product precisely because they are better suited to the needs expressed by certain social sectors or by society at large.

5. Conclusions

The methodological approach we have developed and the consequent analysis carried out on a case study clearly showed that “Local Forest Planning” (LFP) should be considered as a valuable and irreplaceable planning tool, capturing relevant features that other planning scales (both broader and finer) cannot conveniently perceive and manage. This mesoscale (or intermediate-scale) planning approach was found to be helpful and advisable; it seemed therefore appropriate and suitable to achieve the desired planning objectives. No fixed minimum or maximum size of the reference scale is required; the general condition is, of course, that the terrain or landscape under consideration is small enough to exhibit relatively homogeneous characteristics but large enough to take into account a sufficiently complete range of features; it can be applied, for example, at the level of a catchment area or considering Natura 2000 sites at the sub-regional scale.
Forest function was the strategic concept used in this work. It appeared as a kind of “interface” between the ecological domain (forest structure and processes) and the socio-economic dimension of human organizations (services, goods and benefits). A limited but exhaustive range of forest functions was identified and described in terms of a set of criteria (higher level) and attributes (lower level) according to a hierarchical organization structure. The “Analytic Hierarchical Process” (AHP), a methodology within a set of multi-criteria assessment procedures, was applied. AHP was carried out in combination with a “Geographical Information System” (GIS) to work on a spatially defined data input and produce maps as outputs, representing the dominant forest function of the area.
One of the main advantages of using the AHP was to facilitate the participation of the stakeholders invited to the meetings and to encourage their contribution to the decision-making process by sizing the weights to be assigned to the descriptive attributes linked to the forest functional criteria. The criteria were selected in advance by a team of experts involved in the same procedure but at a preliminary stage. The participatory planning process can be considered as divided into two successive steps: in the first one, the forest functions were assigned, and maps were produced; in the second one, several forest professional activities and jobs, both conventional and innovative, were proposed with the perspective of promoting the local socio-economic development and a general benefit for the entire resident community. Multiple forest functions (i.e., productive, protective, naturalistic and touristic) represent an appropriate concept for supporting sustainable forest management, also including sustainable local development.

Author Contributions

Conceptualization, A.R.B.C. and M.M.; methodology, A.R.B.C., M.M., M.I. and L.P.; validation, A.R.B.C., M.M., M.I. and L.P.; formal analysis, A.R.B.C. and M.M.; investigation, A.R.B.C., M.M., M.I. and L.P.; writing—original draft preparation, A.R.B.C.; writing—review and editing, M.M.; visualization, A.R.B.C. All authors have read and agreed to the published version of the manuscript.

Funding

This research received no external funding.

Data Availability Statement

Not applicable.

Conflicts of Interest

The authors declare no conflict of interest.

Abbreviations

FES: Forest Ecosystem Service; FMP: Forest Management Plan; FMU: Forest Management Unit; LFP: Local Forest Plan; RFP: Regional Forest Plan; FF: Forest Function; MCDA: Multi-Criteria Decision Analysis; AHP: Analytic Hierarchy Process; GIS: Geographic Information System.

References

  1. Miura, S.; Amacher, M.; Hofer, T.; San-Miguel-Ayanz, J.E.; Thackway, R. Protective functions and ecosystem services of global forests in the past quarter-century. For. Ecol. Manag. 2015, 352, 35–46. [Google Scholar] [CrossRef]
  2. Winkel, G. Towards a sustainable European forest-based bioeconomy- assessment and the way forward. In What Science Can Tell Us; European Forest Institute: Joensuu, Finland, 2017; Volume 8, Available online: https://www.efi.int/publications-bank (accessed on 1 November 2022).
  3. Lazdinis, M.; Angelstam, P.; Pülzl, H. Towards sustainable forest management in the European Union through polycentric forest governance and an integrated landscape approach. Landsc. Ecol. 2019, 34, 1737–1749. [Google Scholar] [CrossRef]
  4. Bullock, J.M.; Aronson, J.; Newton, A.C.; Pywell, R.F.; Rey-Benayas, J.M. Restoration of ecosystem services and biodiversity: Conflicts and opportunities. Trends Ecol. Evol. 2011, 26, 541–549. [Google Scholar] [CrossRef]
  5. Fisher, B.; Herrera, D.; Adams, D.; Fox, H.E.; Gallagher, L.; Gerkey, D.; Gill, D.; Golden, C.D.; Hole, D.; Johnson, K.; et al. Can nature deliver on the sustainable development goals? Lancet Planet. Health 2019, 3, 112–113. [Google Scholar] [CrossRef] [PubMed]
  6. Zhang, W.; Dulloo, E.; Kennedy, G.; Bailey, A.; Sandhu, H.; Nkonya, E. Biodiversity and Ecosystem Services. In Sustainable Food and Agriculture; Academic Press: Cambridge, MA, USA, 2019. [Google Scholar] [CrossRef]
  7. Brandon, K. Ecosystem Services from Tropical Forests: Review of Current Science; CGD Working Paper 380; Center for Global Development: Washington, DC, USA, 2014; Available online: http://www.cgdev.org/publication/ecosystem-services-tropical-forests-review-currentscience-working-paper-380 (accessed on 1 November 2022).
  8. Chazdon, R.L.; Brancalion, P.H.S.; Lamb, D.; Laestadius, L.; Calmon, M.; Kumar, C. A Policy-Driven Knowledge Agenda for Global Forest and Landscape Restoration. Conserv. Lett. 2017, 10, 125–132. [Google Scholar] [CrossRef]
  9. Holl, K.D. Restoring tropical forests from the bottom up. Science 2017, 355, 455–456. [Google Scholar] [CrossRef] [PubMed]
  10. Chazdon, R.L.; Lindenmayer, D.; Guariguata, M.R.; Crouzeilles, R.; Rey Benayas, J.M.; Lazos Chavero, E. Fostering natural forest regeneration on former agricultural land through economic and policy interventions. Environ. Res. Lett. 2020, 15, 043002. [Google Scholar] [CrossRef]
  11. Strassburg, B.B.N.; Beyer, H.L.; Crouzeilles, R.; Iribarrem, A.; Barros, F.; de Siqueira, M.F.; Sánchez-Tapia, A.; Balmford, A.; Sansevero, J.B.B.; Brancalion, P.H.S.; et al. Strategic approaches to restoring ecosystems can triple conservation gains and halve costs. Nat. Ecol. Evol. 2019, 3, 62–70. [Google Scholar] [CrossRef] [PubMed]
  12. FAO. Guidelines for Management of Tropical Forest 1; The production of wood (FAO Forestry paper 135); FAO: Rome, Italy, 1998. [Google Scholar]
  13. Cullotta, S.; Maetzke, F. Forest management planning at different geographic levels in Italy: Hierarchy, current tools and ongoing development. Int. For. Rev. 2009, 11, 475–489. [Google Scholar] [CrossRef]
  14. Cullotta, S.; Bončina, A.; Carvalho-Ribeiro, S.M.; Chauvin, C.; Farcy, C.; Kurttila, M.; Maetzke, F.G. Forest planning across Europe: The spatial scale, tools, and inter-sectoral integration in land-use planning. J. Environ. Plan. Manag. 2014, 58, 1384–1411. [Google Scholar] [CrossRef]
  15. Maetzke, F.G.; Cullotta, S. Environmental and Forest Planning in Italy: Conflicts and Opportunities. Agric. Agric. Sci. Procedia 2016, 8, 332–338. [Google Scholar] [CrossRef]
  16. Costanza, R.; d’Arge, R.; de Groot, R.; Farber, S.; Grasso, M.; Hannon, B.; Limburg, K.; Naeem, S.; O’Neill, R.V.; Paruelo, J. The value of the world’s ecosystem services and natural capital. Nature 1997, 387, 253–260. [Google Scholar] [CrossRef]
  17. Costanza, R.; de Groot, R.; Braat, L.; Kubiszewski, I.; Fioramonti, L.; Sutton, P.; Farber, S.; Grasso, M. Twenty years of ecosystem services: How far have we come and how far do we still need to go? Ecosyst. Serv. 2017, 28, 1–16. [Google Scholar] [CrossRef]
  18. Reid, W.V.; Mooney, H.A.; Cropper, A.; Capistrano, D.; Carpenter, S.R.; Chopra, K.; Dasgupta, P.; Dietz, T.; Duraiappah, A.K. Ecosystems and Human Well-Being-Synthesis: A Report of the Millennium Ecosystem Assessment; Island Press: Washington, DC, USA, 2005. [Google Scholar]
  19. Daily, G. Nature’s Services: Societal Dependence on Natural Ecosystems; Island Press: Washington, DC, USA, 1997. [Google Scholar]
  20. Baveye, P.C.; Baveye, J.; Gowdy, J. Soil “Ecosystem” Services and Natural Capital: Critical Appraisal of Research on Uncertain Ground. Front. Environ. Sci. 2016, 4, 41. [Google Scholar] [CrossRef]
  21. Haines-Young, R.; Potschin, M. Common International Classification of Ecosystem Services (CICES): 2011 Update; European Environment Agency, The University of Nottingham, CEM: Nottingham, UK, 2011; p. 17. Available online: http://test.matth.eu/content/uploads/sites/8/2009/11/CICES_Update_Nov2011.pdf (accessed on 1 November 2022).
  22. Haines-Young, R.; Potshin, M. The links between biodiversity, ecosystem services and human well-being. In Ecosystem Ecology: A New Synthesis; Raffaelli, D.G., Frid, C.L.J., Eds.; Cambridge University Press: Cambridge, UK, 2010. [Google Scholar]
  23. Power, A.G. Ecosystem services and agriculture: Tradeoffs and synergies. Philos. Trans. R. Soc. B Biol. Sci. 2010, 365, 2959–2971. [Google Scholar] [CrossRef] [PubMed]
  24. Cammerino, A.R.B.; Biscotti, S.; De Iulio, R.; Monteleone, M. The sheep tracks of transhumance in the Apulia region (South Italy): Steps to a strategy of agricultural landscape conservation. Appl. Ecol. Environ. Res. 2018, 16, 6977–7000. [Google Scholar]
  25. Pilli, R.; Pase, A. Forest functions and space: A geohistorical perspective of European forests. iForest-Biogeosci. For. 2018, 11, 79–89. [Google Scholar] [CrossRef]
  26. Millennium Ecosystem Assessment. Ecosystems and Human Well-Being: A Framework for Assessment; Island Press: Washington, DC, USA, 2003; p. 266. [Google Scholar]
  27. Millennium Ecosystem Assessment. Ecosystems and Human Well-Being: Current State and Trends; Findings of the Condition and Trends; Working Group; Island Press: Washington, DC, USA, 2005; p. 155. [Google Scholar]
  28. Kwatra, S.; Kumar, A.; Sharma, S.; Sharma, P. Stakeholder participation in prioritizing sustainability issues at regional level using Analytic Hierarchy Hrocess (AHP) technique: A case study of Goa, India. Environ. Sustain. Indic. 2021, 11, 100116. [Google Scholar] [CrossRef]
  29. Aukes, E.; Stegmaier, P.; Schleyer, C. Guiding the guides: Doing ‘Constructive Innovation Assessment’ as part of innovating forest ecosystem service governance. Ecosyst. Serv. 2022, 58, 101482. [Google Scholar] [CrossRef]
  30. UN. Non-Legally Binding Authoritative Statement of Principles for a Global Consensus on the Management, Conservation and Sustainable Development of all Types of Forests; United Nations: New York, NY, USA, 1992. [Google Scholar]
  31. Mermet, L.; Farcy, C. Contexts and concepts of forest planning in a diverse and contradictory world. For. Policy Econ. 2011, 13, 361–365. [Google Scholar] [CrossRef]
  32. Wikström, P.; Edenius, L.; Elfving, B.; Eriksson, L.O.; Lämås, T.; Sonesson, J.; Öhman, K.; Wallerman, J.; Waller, C.; Klintebäck, F. The heureka forestry decision support system: An overview. Math. Comput. For. Nat. Res. Sci. 2011, 3, 87–95. [Google Scholar]
  33. Belton, V.; Stewart, T.J. Multiple Criteria Decision Analysis—An Integrated Approach; Kluwer Academic Publishers: Dordrecht, The Netherlands, 2002; p. 372. [Google Scholar]
  34. Saaty, T.L. The Analytic Hierarchy Process: Planning, Priority Setting, Resource Allocation; RWS Publications: Pittsburgh, PA, USA, 1990. [Google Scholar]
  35. Kangas, J.; Kangas, A. Multiple criteria decision support in forest management—The approach, methods applied and experiences gained. For. Ecol. Manag. 2005, 207, 133–143. [Google Scholar] [CrossRef]
  36. Blagojević, B.; Jonsson, R.; Björheden, R.; Nordström, E.; Lindroos, O. Multi-Criteria Decision Analysis (MCDA) in Forest Operations—An Introductional Review. Croat. J. For. Eng. 2019, 40, 191–2015. [Google Scholar]
  37. Greco, S.; Ehrgott, M.; Figueira, J. Multiple Criteria Decision Analysis: State of the Art Surveys; Springer: New York, NY, USA, 2016. [Google Scholar] [CrossRef]
  38. Zardari, N.H.; Ahmed, K.; Shirazi, S.M.; Bin Yusop, Z. Weighting Methods and their Effects on Multi-Criteria Decision Making Model Outcomes in Water Resources Management; Springer: New York, NY, USA, 2015. [Google Scholar]
  39. Weistroffer, H.R.; Li, Y. Multiple criteria decision analysis software. Ch 29. In Multiple Criteria Decision Analysis: State of the Art Surveys Series; Greco, S., Ehrgott, M., Figueira, J., Eds.; Springer: New York, NY, USA, 2016. [Google Scholar]
  40. Dean, M. A Practical Guide to Multi-Criteria Analysis. Bartlett School of Planning, University College London. 2022. Available online: https://www.researchgate.net/publication/358131153_A_Practical_Guide_to_Multi-Criteria_Analysis (accessed on 1 November 2022).
  41. Von Winterfeldt, D.; Edwards, W. Decision Analysis and Behavioral Research; Cambridge University Press: Cambridge, UK, 1986. [Google Scholar]
  42. Edwards, W.; Barron, F. SMARTS and SMARTER: Improved Simple Methods for Multiattribute Utility Measurement. Organ. Behav. Hum. Decis. Process. 1994, 60, 306–325. [Google Scholar] [CrossRef]
  43. Bouyssou, D.; Marchant, T.; Pirlot, M.; Perny, P.; Tsoukias, A.; Vincke, P. Evaluation and Decision Models: A Critical Perspective; Kluwer Academic Publishers: Dordrecht, The Netherlands, 2000. [Google Scholar]
  44. Dyer, J.S. Remarks on the Analytic Hierarchy Process. Manag. Sci. 1990, 36, 249–258. [Google Scholar] [CrossRef]
  45. Ferrari, P. A method for choosing from among alternative transportation projects. Eur. J. Oper. Res. 2003, 150, 194–203. [Google Scholar] [CrossRef]
  46. Wang, Y.-M.; Elhag, T.M. An approach to avoiding rank reversal in AHP. Decis. Support Syst. 2006, 42, 1474–1480. [Google Scholar] [CrossRef]
  47. Rezaei, J. Best-worst multi-criteria decision-making method. Omega 2015, 53, 49–57. [Google Scholar] [CrossRef]
  48. Rezaei, J. Best-worst multi-criteria decision-making method: Some properties and a linear model. Omega 2016, 64, 126–130. [Google Scholar] [CrossRef]
  49. Chang, D.-Y. Applications of the extent analysis method on fuzzy AHP. Eur. J. Oper. Res. 1996, 95, 649–655. [Google Scholar] [CrossRef]
  50. Zhang, L.; Yu, J.; Sovacool, B.K.; Ren, J. Measuring energy security performance within China: Toward an inter-provincial prospective. Energy 2017, 125, 825–836. [Google Scholar] [CrossRef]
  51. Brans, J.P. L’Ingéniérie de la Décision. Elaboration d’Instruments d’Aide à la Décision. Méthode PROMETHEE. In Colloque d’Aide à la Décision; Université LAVAL: Quebec, QC, Canada, 1982; pp. 183–213. [Google Scholar]
  52. Behzadian, M.; Kazemzadeh, R.; Albadvi, A.; Aghdasi, M. PROMETHEE: A comprehensive literature review on methodologies and applications. Eur. J. Oper. Res. 2010, 200, 198–215. [Google Scholar] [CrossRef]
  53. Fattoruso, G.; Scognamiglio, S.; Violi, A. A New Dynamic and Perspective Parsimonious AHP Model for Improving Industrial Frameworks. Mathematics 2022, 10, 3138. [Google Scholar] [CrossRef]
  54. Dean, M. Including multiple perspectives in participatory multi-criteria analysis: A framework for investigation. Evaluation 2022, 28, 505–539. [Google Scholar] [CrossRef]
  55. Marčeta, D.; Petković, V.; Ljubojević, D.; Potočnik, I. Harvesting system suitability as decision support in selection cutting forest management in northwest Bosnia and Herzegovina. Croat. J. For. Eng. 2020, 41, 251–265. [Google Scholar] [CrossRef]
  56. Görgens, E.B.; Mund, J.-P.; Cremer, T.; De Conto, T.; Krause, S.; Valbuena, R.; Rodriguez, L.C.E. Automated operational logging plan considering multi-criteria optimization. Comput. Electron. Agric. 2020, 170, 105253. [Google Scholar] [CrossRef]
  57. Sari, F. Forest fire susceptibility mapping via multi-criteria decision analysis techniques for Mugla, Turkey: A comparative analysis of VIKOR and TOPSIS. For. Ecol. Manag. 2021, 480, 118644. [Google Scholar] [CrossRef]
  58. Orhan, O. Land suitability determination for citrus cultivation using a GIS-based multi-criteria analysis in Mersin, Turkey. Comput. Electron. Agric. 2021, 190, 106433. [Google Scholar] [CrossRef]
  59. Saha, S.; Sarkar, D.; Mondal, P.; Goswami, S. GIS and multi-criteria decision-making assessment of sites suitability for agriculture in an anabranching site of sooin river, India. Model. Earth Syst. Environ. 2020, 7, 571–588. [Google Scholar] [CrossRef]
  60. Saaty, T.L. Decision making with the Analytic Hierarchy Process. Int. J. Serv. Sci. 2008, 1, 83–98. [Google Scholar] [CrossRef]
  61. Hermans, F.L.P.; Haarmann, W.M.F.; Dagevos, J.F.L.M.M. Evaluation of stakeholder participation in monitoring regional sustainable development. Reg. Environ. Chang. 2011, 11, 805–815. [Google Scholar] [CrossRef]
  62. Goepel, K.D. Implementation of an Online Software Tool for the Analytic Hierarchy Process (AHP-OS). Int. J. Anal. Hierarchy Process 2018, 10, 469–487. [Google Scholar] [CrossRef]
  63. Goepel, K.D. Implementing the Analytic Hierarchy Process as a Standard Method for Multi-Criteria Decision Making in Corporate Enterprises—A New AHP Excel Template with Multiple Inputs. In Proceedings of the International Symposium on the Analytic Hierarchy Process, Kuala Lumpur, Malaysia, 23–36 June 2013. [Google Scholar] [CrossRef]
  64. Ying, X.; Guang-Ming, Z.; Gui-Qiu, C.; Lin, T.; Ke-Lin, W.; You, H.D. Combining AHP with GIS in synthetic evaluation of eco-environment quality. A case study of Hunan Province, China. Ecol. Model. 2007, 209, 97–109. [Google Scholar] [CrossRef]
  65. Akaa, O.; Abu, A.; Spearpoint, M.; Giovinazzi, S. A group-AHP decision analysis for the selection of applied fire protection to steel structures. Fire Saf. J. 2016, 86, 95–105. [Google Scholar] [CrossRef]
  66. Sultana, A.; Kumar, A. Optimal siting and size of bioenergy facilities using geographic information system. Appl. Energy 2012, 94, 192–201. [Google Scholar] [CrossRef]
  67. Monteleone, M.; Cammerino, A.R.B. Optimal plant size and feedstock supply radius: Minimize the production costs or maximize the profit? In Proceeding of the 20th European Biomass Conference and Exhibition, Milan, Italy, 18–22 June 2012; pp. 1–7. [Google Scholar]
  68. Santopuoli, G.; Requardt, A.; Marchetti, M. Application of indicators network analysis to support local forest management plan development: A case study in Molise, Italy. iForest–Biogeosci. For. 2012, 5, 31–37. [Google Scholar] [CrossRef]
  69. Pascual-Hortal, L.; Saura, S. Integrating landscape connectivity in broad-scale forest planning through a new graph-based habitat availability methodology: Application to capercaillie (Tetrao urogallus) in Catalonia (NE Spain). Eur. J. For. Res. 2008, 127, 23–31. [Google Scholar] [CrossRef]
  70. Saura, S.; Estreguil, C.; Mouton, C.; Rodríguez-Freire, M. Network analysis to assess landscape connectivity trends: Application to European forests (1990–2000). Ecol. Indic. 2011, 11, 407–416. [Google Scholar] [CrossRef]
  71. Smith, D.W.; Russell, J.S.; Burke, J.M.; E Prepas, E. Expanding the forest management framework in the province of Alberta to include landscape-based research. J. Environ. Eng. Sci. 2003, 2, S15–S22. [Google Scholar] [CrossRef]
  72. La Notte, A.; D’Amato, D.; Mäkinen, H.; Paracchini, M.R.; Liquete, C.; Egoh, B.; Geneletti, D.; Crossman, N.D. Ecosystem services classification: A systems ecology perspective of the cascade framework. Ecol. Indic. 2017, 74, 392–402. [Google Scholar] [CrossRef]
  73. Hardin, G. The Tragedy of the Commons. Sci. New Ser. 1968, 162, 1243–1248. [Google Scholar] [CrossRef] [PubMed]
  74. Kahui, V.; Cullinane, A. The ecosystem common. N. Z. J. Ecol. 2019, 43, 1–5. [Google Scholar] [CrossRef]
  75. Muradian, R.; Barnaud, C. Ecosystem Services and Collective Action: New Commons, New Governance Challenges. Special Issues Ecosystem Services. 2021. Available online: https://www.sciencedirect.com/journal/ecosystem-services/special-issue/10BGW1GRT5L (accessed on 1 November 2022).
  76. Ostrom, E. Governing the Commons; Cambridge University Press: New York, NY, USA, 1990. [Google Scholar]
  77. Ostrom, V.; Ostrom, E.E. Public Goods and Public Choices. In Alternatives for Delivering Public Services: Toward Improved Performances; Savas, E.S., Ed.; Westview Press: Boulder, CO, USA, 1977. [Google Scholar]
  78. van der Ploeg, J.D.; Roep, D. Multifunctionality and rural development: The actual situation in Europe. In Multifunctional Agriculture; A New Paradigm for European Agriculture and Rural Development; van Huylenbroeck, G., Durand, G., Eds.; Ashgate: Hampshire, UK, 2003; pp. 37–53. [Google Scholar]
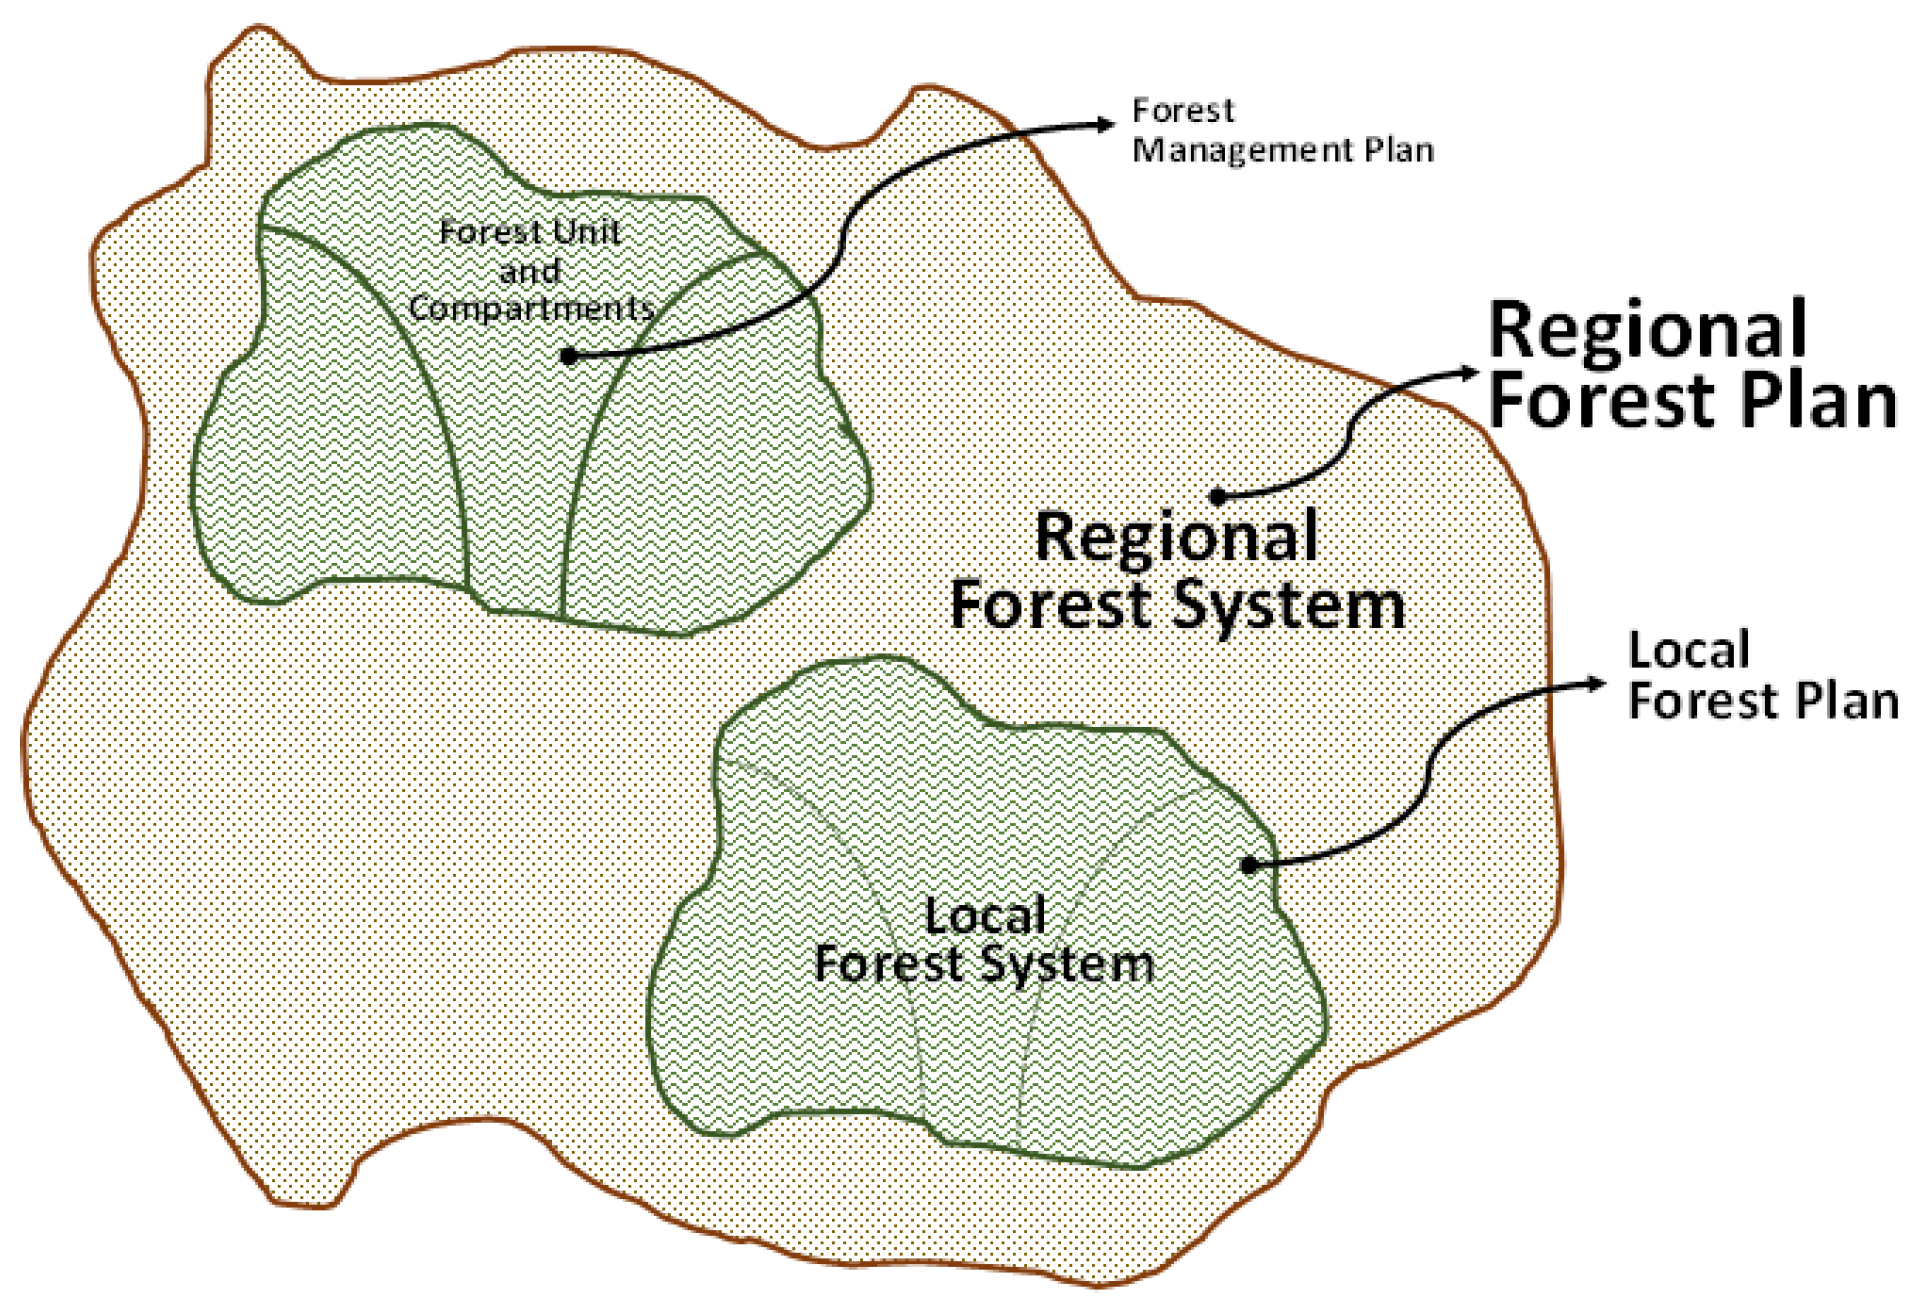
Figure 1. Different types of forest planning according to the spatial scale of reference. The Forest Management Plan is related to each forest unit and/or compartment, while the Local Forest Plan pertains to a forest system made of several forest units; finally, at a broader spatial scale, the Regional Forest Plan is associated with the whole administrative territory. In this case study, the interest was focused on the local dimension of forest planning, the one connected with the intermediate spatial scale between the regional forest system and the single forest compartment.
Forests 14 00934 g001
Figure 2. Geographical map of the study area, consisting of different zones and sub-zones according to specific geomorphological traits, as identified by the Apulian Landscape Plan. Italy is represented in the upper right frame, and the Puglia region is in the lower right frame.
Forests 14 00934 g002
Figure 3. Methodological approach used in the case study: rationale and sequential steps.
Forests 14 00934 g003
Figure 4. Structure of the Analytical Hierarchy Procedure (AHP. (A)) The hierarchy is defined by a set of forest functions, each described by several criteria and each, in turn, determined by several attributes. (B) The procedure aims to identify the dominant forest function or co-functions (first level) among the four different ones (second level) in terms of several functional criteria (third level), each described by several attributes. The whole set of criteria is the following: forest category (W); forest management (M); terrain slope (TS); distance from the road (DR); geomorphological hazard (GH); landslide risk (LR); nature protected reserve (NP); protected wild species (PS); footpaths and hiking pathways (PH); panoramic road (PR); places of cultural interest (CT).
Forests 14 00934 g004
Figure 5. Biplot graphs obtained from the Principal Component Analysis (PCA). (A) first and second principal components. (B) third and fourth principal components. PCA was performed on the quantile values of the four forest functions considered (PRT = Protective; PRD = Productive; NAT = naturalistic; TRS = Touristic). Geomorphological zones: MD1 = Fortore middle valley; MD2 = Northern Monti Dauni; MD3 = Southern Monti Dauni; TV1 = Lucera-Serra dei Monti Dauni; TV2 = Manare di Ascoli Satriano; OF1 = Ofanto middle valley.
Forests 14 00934 g005
Figure 6. Mapping and zoning of the forest functions considering the study case area. (A) Tourist function; (B) Naturalistic function; (C) Productive function; and (D) Protective function. Legend: quintile ordinal values assigned to the land forest units.
Forests 14 00934 g006
Figure 7. Mapping and zoning of the forest functions considering the study case area. (1) Forest patches were protective–naturalistic, and protective–tourist forest functions are dominant; (2) Forest patches were tourist–productive, and tourist–productive–naturalistic forest functions are dominant.
Forests 14 00934 g007
Table 1. Institutional source of spatially referenced data used in the preparation of the case study.
DatabaseSource (§)
Forest land use categoriesMapped by local experts based on aerial photographs (AGEA 2019 Regional Cartographic Website)
http://www.sit.puglia.it/portal/portale_cartografie_tecniche_tematiche/WMS
Forest managementLocal expert knowledge
Road networkRegional Cartographic Website
http://www.sit.puglia.it/portal/portale_cartografie_tecniche_tematiche/ViewMenuPortletWindow?action=2&idsezione=322&nomesezione=Cartografie%20Tecniche%20e%20Tematiche&paginacms=/contents/schede-html/carte.html
Digital Terrain Model Regional Cartographic Website
http://www.sit.puglia.it/portal/portale_cartografie_tecniche_tematiche/ViewMenuPortletWindow?action=2&idsezione=322&nomesezione=Cartografie%20Tecniche%20e%20Tematiche&paginacms=/contents/schede-html/carte.html.
Geomorphological hazardCatchment Authority of the Southern Apennine District:
Hydrological plan (landslide and flood risk)
https://www.distrettoappenninomeridionale.it/
Landslide riskRegional Cartographic Website
https://pugliacon.regione.puglia.it/services/pubblica/paesaggio-urbanistica/cartografia-ctr-dtm-ortofoto-uds-e-carte-idrogeomorfologiche
Hiking routes and pathwaysRegional Cartographic Website
https://pugliacon.regione.puglia.it/web/sit-puglia-sit/catasto-della-rete-escursionistica-pugliese
Road having landscape and panoramic valueRegional Cartographic Website
https://pugliacon.regione.puglia.it/web/sit-puglia-paesaggio/file-vettoriali#mains
Place of cultural interest and touristic–recreational facilitiesRegional Cartographic Website
https://pugliacon.regione.puglia.it/web/sit-puglia-paesaggio/file-vettoriali#mains
+ Local expert knowledge
Natural protected areasRegional Cartographic Website
https://pugliacon.regione.puglia.it/web/sit-puglia-paesaggio/file-vettoriali#mains
Wild protected speciesRegional Cartographic Website
https://pugliacon.regione.puglia.it/web/sit-puglia-sit/habitat-e-specie-animali-e-vegetali1
(§) Last accessed on 15 November 2022.
Table 2. Forest area (expressed in hectares) in relation to the geomorphological zones analyzed. The division of the forest area was made taking into account both the forest category (W) and the forest management practice (M) for each respective geomorphological zone.
W1W2W3W4W5Total
M1-305.8133.442.131214.271555.65
M2-5043.0143.293.3113.735103.34
M3-2.9728.60374.14-405.72
MD1-5351.79105.33379.591228.007064.71
M1-1384.27172.78-838.312395.37
M2-3808.3739.290.381.983850.02
M3-15.410.74265.43-281.58
MD2-5208.05212.81265.81840.296526.97
M1-374.619.74-562.30946.65
M218.395204.27221.331.57-5445.55
M3-6.98160.62222.83-390.44
MD318.395585.87391.69224.40562.306782.64
M1-79.298.27-59.28146.84
M2-134.161.01--135.17
M3-10.190.97430.92-442.08
TV1-223.6510.25430.9259.28724.10
M1----57.7857.78
M2-77.16---77.16
M3-----0.00
TV20.0077.160.000.0057.78134.93
M1-2.96---2.96
M2-162.51---162.51
M3-3.09-118.65-121.74
OF1-168.560.00118.650.00287.21
M10.002146.95224.232.132731.945105.25
M218.3914,429.48304.925.2515.7114,773.76
M30.0038.65190.931411.970.001641.55
Total18.3916,615.08720.091419.362747.6521,520.57
Legend: Geomorphological zones: MD1 = Fortore middle valley; MD2 = Northern Monti Dauni; MD3 = Southern Monti Dauni; TV1 = Lucera-Serra dei Monti Dauni; TV2 = Manare di Ascoli Satriano; OF1 = Ofanto middle valley. Forest category: W1 = evergreen oak forest; W2 = deciduous oak forest; W3 = other deciduous forest; W4 = riparian woods. Forest management: M1 = high-forest; M2 = forest coppice; M3 = forest in natural evolution.
Table 3. Selected criteria, associated attributes, scores and weights for each forest function.
Forest Functions Productive
(PRD)
Protective
(PRT)
Naturalistic
(NTR)
Tourist
(TRS)
WWeights →0.320.280.320.03
W1evergreen oak forest5545
W2deciduous oak forest5455
W3other deciduous forest4455
W4riparian woods1541
W5reforestation with conifers1513
MWeights 0.200.000.170.05
M1old-grown forest4-45
M2coppice5-33
M3forest in natural evolution1-51
TSWeights 0.230.250.000.08
S1>0–1053-5
S2>10–2044-3
S3>2035-1
DRWeights 0.250.000.000.15
DR1<1005--5
DR2100–2504--4
DR3250–5003--3
DR4500–10002--2
DR5>10001--1
GHWeights 0.000.230.000.00
GH1low-1--
GH2medium-3--
GH3high-5--
LRWeights 0.000.240.000.00
LR0not present-0--
LR1present-5--
NPWeights 0.000.000.240.00
NP0no protected area--1-
NP1IPA area--3-
NP2ZSC area--5-
PSWeights 0.000.000.270.00
PS120–23--1-
PS224–26--2-
PS327–31--3-
PS432–36--4-
PS537–43--5-
HPWeights 0.000.000.000.29
HP0not present---0
HP1present---5
PRWeights 0.000.000.000.12
PR0not present---0
PR1present---5
CTWeights 0.000.000.000.28
CT0not present---0
CT1present---5
Sum of Weights1.001.001.001.00
Legend—PRD: Productive; PRT: Protective; NTR: Naturalistic; TRS: Touristic; W: forest category; M: forest management; TS: terrain slope (%); DR: distance from road (m); GH: geomorphological hazard; LR: landslide risk; NP: natural protected; PS: wild protected species; HP: hiking pathways; PR: panoramic roads; CT: places of cultural interest.
Table 4. Percentage breakdown of forest units according to their dominant forest functions (single or combined), taking into account the Quintile category to which they belong.
Forest
Function
5th
Quint.
4th Quint.3rd Quint.2nd Quint.1st Quint.Total
NTR11.1510.491.070.000.0022.71
PRT9.913.792.800.000.0016.50
PRD7.735.032.780.270.0015.81
TRS8.332.800.200.270.0011.60
PRD-NTR1.781.701.760.330.005.57
PRD-TRS4.560.650.090.050.005.35
PRT-TRS3.140.471.710.000.005.32
PRT-PRD1.362.261.330.000.004.95
PRT-NTR2.120.441.220.000.003.78
TRS-NTR1.690.230.010.030.001.96
PRD-TRS-NTR1.480.390.680.010.002.56
PRT-PRD-NTR0.300.150.560.380.001.39
PRT-PRD-TRS0.660.120.110.000.000.89
PRT-TRS-NTR0.440.030.240.000.000.71
PRT-PRD-TRS-NTR0.220.010.000.000.700.93
Total54.8628.5614.551.330.70100.00
Legend—Forest functions: PRT = Protective; PRD = Productive; NAT = naturalistic; TRS = Touristic.
Table 5. Percentage distribution of forest units according to their predominant forest functions (single or combined), taking into account the six geomorphological zones of the areas under analysis.
Forest
Function
MD1MD2MD3TV1TV2OF1Total
NTR9.799.982.470.000.000.4622.70
PRT2.833.848.890.610.180.1416.49
PRD6.613.394.710.670.350.0715.80
TRS6.052.622.360.450.080.0411.60
Sub-Total25.2819.8318.431.730.610.7166.59
PRD-NTR3.021.461.010.040.000.045.57
PRD-TRS1.611.941.610.180.000.015.35
PRT-TRS1.371.661.900.380.010.005.32
PRT-PRD0.111.263.560.010.010.004.95
PRT-NTR0.180.882.030.290.000.403.78
TRS-NTR0.581.130.250.000.000.001.96
Sub-Total6.868.3410.350.900.020.4526.92
PRD-TRS-NTR0.321.760.460.020.000.002.56
PRT-PRD-NTR0.430.200.740.000.000.021.39
PRT-PRD-TRS0.030.190.670.000.000.000.89
PRT-TRS-NTR0.030.370.130.170.000.010.71
Sub-Total0.812.522.030.180.000.035.57
PRT-PRD-TRS-NTR0.250.250.360.060.010.000.93
Gran-Total33.2030.9431.172.870.641.19100.00
Legend: —Geomorphological zones: MD1 = Fortore middle valley; MD2 = Northern Monti Dauni; MD3 = Southern Monti Dauni; TV1 = Lucera-Serra dei Monti Dauni; TV2 = Manare di Ascoli Satriano; OF1 = Ofanto middle valley. Forest functions: PRT = Protective; PRD = Productive; NAT = naturalistic; TRS = Touristic.
Table 6. Deviation in the percentage distribution of forest units as compared to the average of the whole geographical area in terms of dominant forest functions (single or combined), taking into account the six geomorphological zones of the area (legend in Table 5).
MD1PRTPRDNTRTRSTV1PRTPRDNTRTRS
PRT−9.97 PRT2.73
PRD−2.53−1.77 PRD−2.391.48
NTR−8.445.4511.35 NTR1.04−2.40−17.99
TRS−0.990.940.717.27TRS8.052.47−1.034.85
MD2PRTPRDNTRTRSTV2PRTPRDNTRTRS
PRT−6.06 PRT10.02
PRD1.21−10.78 PRD−2.0733.67
NTR−6.121.1014.14 NTR−8.97−3.63−18.07
TRS0.252.392.61−2.49TRS−3.34−3.91−1.031.67
MD3PRTPRDNTRTRSOF1PRTPRDNTRTRS
PRT9.99 PRT−6.71
PRD8.63−6.62 PRD−2.85−15.98
NTR−2.52−0.40−10.13 NTR25.00−0.1120.69
TRS0.961.25−0.22−3.37TRS−4.93−3.14−1.03−7.93
Note—Percentages highlighted in red are below average, while percentages highlighted in green are above average, more than 2% in absolute terms.
Table 7. List of possible forestry work and professional activities to be associated with the different zoning of forestry functions.
TRSEcotourism and Natural Life Activities and Socio-Cultural Services Related to the ForestPRTSocial Services and Activities for the Public BenefitPRDForestry Production Activities
TRS.1Hiking and Trekking: maintenance of trails; installation and maintenance of signage; forestry guide along the trailsPRT.1Emergency firefighting activities; preparation and maintenance of firebreak buffers and other fire protective arrangementsPRD.1Local sale of properly selected and assorted firewood
TRS.2Agritourist activity and forest hospitalityPRT.2Emergency intervention to provide assistance to injured, missing or endangered people in the forestPRD.2Recovery of wood residues and activation of production processes to obtain wood chips, pellets, briquettes, etc.
TRS.3Outdoor sports and recreation (such as “adventure parks”); sensorial itineraries in the woods and in clearingsPRT.3Emergency intervention due to natural disasters in the forest: landslides, rock collapses, storms and floods, etc.PRD.3Activation of the forest–wood–energy supply chain with “energy” as the final product; direct management of the “heat service” (through thermal biomass plants for district heating or energy communities)
TRS.4Management of equipped areas for camping (tents, caravans and campers)PRT.4Management of vegetation on the side of the roads and along the margins through mowing operations and avoiding chemical weedingPRD.4Start-up of small sawmills, carpenters and woodcraft workshops (production of barrels, parquet, bird nests, etc.)
TRS.5Management of a spectrum of activities related to forest parkour and a healthy lifestyleNTREnvironmental and Ecosystem ServicesPRD.5Production of wood boards alternative to hardwood, such as chipboard, laminated board, plywood and similar products
TRS.6Management of healthcare activities such as “forest therapy”, “forest bathing”, “forest immersion”, gentle gymnastics, yoga, relaxation and meditation practices, parkour life, sensory paths, etc.NTR.1Afforestation and reforestation activities; agroforestry plants and ecological diversification systems at the landscape scalePRD.6Non-wood products: mushrooms, truffles, berries, jujubes, nuts (chestnuts, hazelnuts, etc.), beekeeping and derived products (honey, propolis, royal jelly), medicinal plants. Laboratory for the preparation and conservation of the aforementioned products.
TRS.7Educational forest activities: kindergartens and schools in the woodsNTR.2Naturalistic engineering activities (slope consolidation, anti-erosion systems, runoff regulation, etc.)PRD.7Assignment of pasture management; nomadic management of bee-hives
TRS.8Land art exhibitions in the forest or clearings close to the forestNTR.3Design, management and maintenance of the land ecological network, also considering the ancient sheep tracks and other forms of green-waysPRD.8Management of polycyclic, permanent and multi-purpose agroforestry plantations
TRS.9Equipped area for the observation of wild animals and birdwatchingNTR.4Reintegration/repopulation of wild animal speciesPRD.9Small handicraft industry of forest resins and derived products (pitch, mastic, turpentine, Chios oil, white spirit, etc.)
TRS.10Botanical itineraries and orienteering courses and competitions NTR.5Carbon capture and sequestration (both in the soil and in the wooden biomass)PRD.10Biobased products obtained through “green chemistry” extraction processes
TRS.11Routes for mountain bikers, horse riding or excursions with pack donkeys. NTR.6Agrienvironmental functions recognized by the CAP (Common Agricultural Policy) and subsidized through direct payments (eco-schemes, rural development measures, etc.)PRD.11Forest nursery of autochthonous species with a high endemism value
Disclaimer/Publisher’s Note: The statements, opinions and data contained in all publications are solely those of the individual author(s) and contributor(s) and not of MDPI and/or the editor(s). MDPI and/or the editor(s) disclaim responsibility for any injury to people or property resulting from any ideas, methods, instructions or products referred to in the content.