Article

Characterization and Comparison of Some Kraft Lignins Isolated from Different Sources

Department of Forest Industry Engineering, Kastamonu University, 37150 Kastamonu, Türkiye
*
Author to whom correspondence should be addressed.
Forests 2023, 14(5), 882; https://doi.org/10.3390/f14050882
Submission received: 23 February 2023 / Revised: 18 April 2023 / Accepted: 19 April 2023 / Published: 25 April 2023
(This article belongs to the Special Issue Lignin: The Hidden Forest Product)

Abstract

:
Lignin characteristics are significantly affected by kraft processing and isolation conditions. In the studies carried out in this context, commercial lignins or isolated lignins from industrial black solutions are generally preferred. In this study, in order to conduct more comprehensive research, three lignin samples were isolated from kraft black liquor obtained from laboratory cooking trials of pine, poplar, and wheat straw chips, representing softwoods, hardwoods, and annual plants, respectively, according to efficient pulping studies. In addition, another lignin-containing industrial waste was provided from a pulp mill (OBL). The acidification method was applied for isolating lignin from black liquor samples. After isolating the lignin samples from different sources, they were characterized and compared with the commercially available kraft lignin sample (Indulin AT). Total phenolic groups, carboxyl groups, purity, functional groups, nitrobenzene oxidation products, molecular weight, thermal stability, and element contents were analyzed. The isolated lignin samples (except wheat straw) were as pure as commercial lignin. Since the wheat straw was agricultural waste and an annual plant, inorganic elements such as P, K, and Si were more abundant than in the other samples. However, the polydispersity and molecular weight of all of the isolated lignin samples were higher than those of commercial lignin. Because the ash contents of the lignin samples for pine, poplar, OBL, and indulin AT were between 1 and 3%, they can be used for high-value applications. In particular, despite some disadvantages, wheat straw lignin has greater potential for use in extruders than softwood lignins due to their syringyl content.

1. Introduction

The primary purpose of chemical pulping is to liberate plant fibers by breaking down the bonds that hold them together while dissolving the lignin [1]. The kraft process, which is the most widely used chemical pulping method globally, is an important source of technical lignin today [2]. Lignin production comprises approximately 100 million tons/year globally, with an estimated value of roughly USD 733 million. It is expected to reach USD 913 million by 2025 [3]. Lignin represents the largest amount of waste polymer produced and is the most abundant renewable polymer in nature, after cellulose [4]. In addition, most kraft lignin is still burned to recover its inorganic components, while producing thermal energy during the process [5]. Although burning kraft lignin is important in terms of meeting the thermal energy needs of paper mills, approximately 90% of lignin is burned inefficiently, while only 2% is utilized effectively [6]. For this reason, the importance of studies on lignin isolation and characterization is growing, with research aiming to increase both the potential uses and the effective use of lignin.
There are many different isolation methods for kraft black liquor [7,8]. The most common isolation method is acidification. During the acidification method, lignin isolation is mainly performed by lowering the pH of the black liquor with acidic agents and precipitating lignin fragments [9]. Acidification treatment of alkaline black liquors is carried out at different pH levels, temperatures, times, and acid concentrations. Sulfuric acid and hydrochloric acid are widely used [10], and there are studies in the literature that combine different acidic compounds, such as phosphoric acid, nitric acid, acetic acid, carbon dioxide [8], sulfur dioxide [11], etc., for the acidification of black liquor. These variables affect lignin properties, and the lignin structure breaks down when the pH value is less than two [12]. Furthermore, variations in the number of functional groups obtained in lignin are also related to pH. As the pH of black liquor falls below 10.5, the phenolic -OH groups in lignin absorb a large number of protons. As a result, carboxylic acid groups indicating the presence of degraded hemicelluloses, which are absorbed onto lignin in pulping or covalently bonded lignin with esters bonds, are protonated at lower pH values (between three and four), [6,7]. In addition to the decrease in pH value during the isolation process, the lignin properties change with acid type [13].
Many studies have proven that lignin, a valuable polymer, can be used as a raw material for many different products such as resin [14], polyurethane [15], active carbon [16], lithium-ion electrodes [17,18], and carbon fiber [19]. However, despite lignin’s wide range of applications, the usability of lignin products is restricted in practice because the polymeric properties of lignin are affected by many factors, such as the type of lignocellulosic raw material, process conditions, and the variables in the method of extraction (temperature, pH, applied pressure, etc.) [7,20]. Essentially, the structural compounds and their contents vary with the lignocellulosic material, and this phenomenon directly affects the properties of the lignin [2,21]. Thus, lignin characterization is quite critical in determining where it can be used.
The world’s population and pulp and paper production increase year by year. Therefore, to reduce pressure on the environment, we should evaluate waste materials and produce environmentally friendly products from lignin. For this purpose, it is important to investigate the lignin properties of different raw material types to valorize lignin for use as environmentally friendly value-added products. Since kraft pulping conditions are a critical factor in lignin properties, commercial lignin samples or isolation of kraft lignin from industrial black solutions are generally used in comparison and characterization studies [10,11,13,22,23,24,25,26]. In particular, Indulin AT has been commercially produced with acidification systems for many years and is the most researched technical kraft lignin. Today, other technical lignins, such as BioChoice, LignoBoost, and Lignoforce, marketed by different companies, are also available and widely used in these studies. However, commercially available technical lignins show different properties from each other due to different production conditions [27]. Thus, although there are many of these types of studies, in our study, we produced lignin samples from pulping trials using the optimum conditions for the studied raw materials, selected based on the literature in relation to efficient pulping yields. We then characterized and compared the results for each sample. In addition, we compared and recommended different kinds of lignin samples obtained from laboratory trials using the optimum conditions for producing new lignin-based products.

2. Materials and Methods

2.1. Raw Materials

Lignocellulosic raw materials (softwood: Anatolian black pine (Pinus nigra), hardwood: poplar (Populus tremula), annual plant: wheat straw (Triticum aestivum)) were obtained from the Kastamonu province in Türkiye. In this study, industrial waste black liquor (OBL) was provided by OYKA Paper Packaging Industry and Trade Inc. (Zonguldak, Türkiye). To compare the properties of lignin samples after the isolation process, Indulin AT (MeadWestvaco®, North Charleston, SC, USA), sold commercially, was used as a control sample.

2.2. Kraft Pulping

Raw materials were chipped/cut (20 × 20 × 2 mm for woods and 4–5 cm for cereals) and air-dried. Kraft pulping parameters (Table 1), selected from the literature according to optimal pulping results, were applied in an electrically heated rotary digester with a 15 L capacity and high-pressure resistance as three replicates. The black liquors obtained as a pulp production waste were collected in black (opaque) glass bottles and kept at +4 °C in a refrigerator to prevent harmful chemical reactions.

2.3. Black Liquor Characterization

The pH value of the obtained black liquors was determined with a digital pH meter (Eutech® PC650, Singapore). Density was measured by calculating the weight of the black liquor in a previously weighed and known volume. The residual alkali amount was determined using potentiometric titration with 0.1 M hydrochloric acid (HCl) solution according to SCAN N 33:94 [31]. The total dissolved solids (TDS) content was determined based on dried weight according to Tappi T625 cm-85 as three replicates [32]. Inorganic matter content (IC%) was determined via combustion of the total dissolved solid residue at 525 °C according to T211 om-93 as three replicates [33], and the amount of organic matter (OC%) was calculated as the difference between the amount of inorganic matter and the total dissolved solids content residue.

2.4. Lignin Isolation

Isolation of lignin was carried out via acidification with heat treatment. For this purpose, Yang et al.’s method [11] was adapted to sulfuric acid, which is the most used acid for acidification and is less harmful to the lignin structure [10]. Black liquors were heated to 70 °C under continuous stirring. Sulfuric acid (1 N) was added to the acidification by the time the pH of the black liquors reached 2. Then, the solutions were continuously stirred and maintained at the same temperature for 2 h. Next, the solutions were centrifuged at 4500 rpm for 10 min. Finally, the centrifuged lignin samples were oven-dried at 50 °C.

2.5. Determination of Lignin Properties

2.5.1. Determination of Volatile Material (VM) and Ash Content

One gram of lignin sample was taken and kept in an ash furnace at 250 °C for 6 h, and the percentage of volatile material (VM) was determined in proportion to the initial substance amount [19]. A 0.5 g lignin sample was weighed and placed in porcelain crucibles in an ash furnace at approximately 525 ± 25 °C for 4 h to determine the amount of ash. Calculations were conducted according to standard methods [33]. Each experiment was performed in three replicates.

2.5.2. Klason Lignin Content (LC)

The Klason lignin content of samples was determined via the acid hydrolysis method according to Toledano et al., [34] adapted to TAPPI 222-om 88 [35]. Accordingly, 0.375 g of dried lignin sample was added to 3.75 mL of 72% H2SO4 solution placed in a 100 mL Erlenmeyer flask. The mixture was kept at room temperature with occasional stirring for 2 h. Then, it was diluted with 36.25 mL of distilled water for 4 h at 100 °C. Next, the insoluble material was filtered, washed with hot water, and then dried at 103 ± 2 °C. The process was carried out in three replicates in parallel. The amount of lignin was calculated by proportioning the first weight.

2.5.3. Element Content Analysis (EA)

For element content analysis, 0.25 g dried lignin samples were prepared via a microwave digestion procedure with concentrated HNO3, then diluted with distilled water to 100 mL, and the solution was filtered through 45 μm filter paper. Then, Al, Na, Mg, Ca, K, Fe, P, Si, and S analyses were performed on the filtrate in three replicates using an inductively coupled plasma optic emission spectrometer (ICP-OES) (Spectro Blue® Kleve, Germany) at Kastamonu University’s Central Research Laboratory. The results are reported as means and standard deviations.

2.5.4. Total Phenolic Content (TPC) of Lignins

According to the assay developed by García et al. [36] the total phenolic content (TPC) of the lignin samples was determined using Folin–Ciocalteu reagent with slight modifications. Firstly, lignin samples were dissolved in DMSO to a concentration of 2 g/L. Then, 2.5 mL of Folin–Ciocalteu reagent was added to 0.5 mL of the lignin solution. After 6 min, 5 mL of 20% Na2CO3 solution and 50 mL of distilled water were added to the mixture. Then, the solutions were maintained at 40 °C with occasional shaking for 30 min. The absorbances of the solutions were determined at 750 nm via three repeated measurements. TPC content was calculated as mg gallic acid equivalent/L (mg GAE/L) using the equation obtained from the standard gallic acid graph (R2 = 0.9952).

2.5.5. Carboxyl Group (CG) Content Determination

The aqueous alkaline solution titration method was used to determine the percentage of carboxyl groups in the lignin [34]. An amount of 2 g of lignin sample was dissolved in 100 mL of 0.05 M NaOH solution for 3 h with continuous stirring. The prepared alkaline lignin solution was titrated with 0.1 M HCl solution until the pH reached 7, and the consumption volume was used for calculation of CGs.

2.5.6. Ultraviolet–Visible (UV–Vis) Area and FT-IR Spectroscopy

Lignin samples (50 mg) were dissolved in a 100 mL 90:10 dioxane/water mixture. Then, 10 mL of this solution was diluted to 100 mL in a 200 mL beaker with a 50:50 dioxane/water mixture [22]. Ultraviolet–visible (UV–vis) spectroscopic analysis of the samples was performed using a Shimadzu UV spectrophotometer. Lignin samples were analyzed to determine the differences in the structure of the functional groups with Fourier transform infrared spectroscopy (FT-IR). FT-IR experiments were carried out on a Bruker® Alpha FT-IR spectrometer (Germany); this device does not have any specific sample preparation requirements.

2.5.7. Nitrobenzene Oxidation (NbOx)

The nitrobenzene oxidation of samples was performed according to Reyes-Rivera and Terrazas [37]. Approximately 100 mg of lignin was dissolved in aqueous sodium hydroxide (7 mL, 2 mol/L), and 0.5 mL of nitrobenzene was added to this solution in a stainless-steel reactor. The reactor was heated to 170 °C for 2.5 h in an oil bath. The oxidized material was filtered with a cellulose membrane (0.22 µm) and extracted three times with 30 mL of chloroform. The extracts were discarded to remove residual nitrobenzene from the oxidized products. Then, the aqueous phase was acidified with a 4 M HCl solution to a pH of 1 and extracted three times with 30 mL of chloroform. The last organic phases were evaporated at 40 °C. Next, the samples were dissolved in an acetonitrile/water solution (1:1 v/v) and filtered through a 0.45 µm cellulose membrane. HPLC analysis was performed at the Kastamonu University Central Research Laboratory using an LC20-A Prominence HPLC system (Shimadzu, Kyoto, Japan) equipped with an Inertsil ODS-3 5 μm column (GL Systems, Torrance, CA, USA). The column size was 25 mm × 4.6 mm. The mobile phase consisted of acetonitrile/water solution (1:6), and the pH was adjusted to 2.6 with trifluoroacetic acid buffer (TFA). The flow rate was 0.6 mL/min, and the monitoring wavelength was 280 nm. Vanillin (Merck Millipore®, Shanghai, China) and syringaldehyde standards (Acros organics®, Shanghai, China) were prepared, and the combination of spectral matching was used to determine the retention time and identify each compound.

2.5.8. Thermogravimetric Analysis (TGA)

Lignin samples (12–14 mg) were placed in standard porcelain crucibles and heated at a rate of 15 °C min−1 from room temperature to 600 °C in a Hitachi STA 7300® model TGA device (Tokyo, Japan), and the degradation behavior of the samples was investigated in the Kastamonu University Central Research Laboratory.

2.5.9. Gel Permeation Chromatography (GPC) Analysis

The number average molecular weight (Mn) and weight average molecular weight (Mw) of lignins are generally determined via GPC after modifying lignin with acetic anhydride to allow dissolution in THF [38]. However, the use of acetic anhydride in many countries is subject to special permission [39]. Additionally, the acetic anhydride reaction yields acetic acid, causing corrosion and an unpleasant odor [40]. For this purpose, lignin was modified with maleic anhydride in this study. Because maleic anhydride is a cyclic anhydride after binding to lignin, the ring structure opens, which reduces the risk of cross-linking [40]. In this study, the number average molecular weight (Mn) and weight average molecular weight (Mw) of lignin samples were determined via GPC after lignin was modified with maleic anhydride, according to a similar procedure by Wang et al. [41]. In brief, lignin (12 g) was dissolved in 100 mL of distilled water, then maleic anhydride (9.87 g) was added. Then, a sufficient amount of NaOH was added until the pH of the solution was approximately 10.5, and at the end of the continuous stirring process at 60 °C for 4 h, the lignins were acidified again to a pH of 2 with sulfuric acid. The esterified lignin was dried at 50 °C. As a result of the esterification, all samples became soluble in THF. The modified lignin samples were dissolved in THF at a concentration of approximately 2 mg/mL over 16 h and analyzed using the universal calibration method on OmniSEC (Malvern®, Malvern, UK) instrument columns. Mn, Mw, and polydispersity index (PDI) were automatically calculated according to Equations (1)–(3), respectively. GPC experiments were carried out in the Polymer Analysis Laboratory of the Middle East Technical University Central Laboratory.
Mn = N i M i N i
Mw = N i   M i 2 N i M i
PDI = Mw Mn
where i is the number of different molecular weights in the sample and Ni is the number of molecules of molecular weight Mi.

3. Results and Discussion

For the lignocellulosic raw materials used, i.e., poplar, pine, and wheat straw, the optimal pulping conditions suggested in the literature were selected and applied. The properties of the black liquors are given in Table 2. Based on these results, the densities and pH values were generally similar. Because it was provided from the evaporation stage of the recycling unit, the OYKA black liquor (OBL) was highly concentrated.
However, the inorganic matter content (IC) and organic matter content (OC) of black liquor samples were close to each other, and the highest OC was found in pine at 73.76%, while the highest amount of IC was found in the OBL at 33.49%. According to the OYKA Inc. production receipt, high-yield kraft cooking was applied for producing cardboard using un-barked softwood as raw material. These can cause high amounts of residual alkali and IC in the OBL [1]. Sharma et al. reported a concentrated black liquor IC of 37.10% and an OC of 62.89% [23]. In addition, Hubbe et al. reported that the inorganic materials of kraft black liquor were between 30 and 40% [7].
After isolation, lignin purity is more important than its yield. Because of the high numbers of contaminants present in the isolated lignin, such as ash, carbohydrates, and sulfur compounds, some process difficulties are encountered during the production of value-added lignin products, such as additives [42]. Therefore, the amount of ash and volatile material (VM) content and Klason lignin are accepted as basic parameters showing its purity [19]. The ash, volatile material, Klason lignin amounts, and mineral content analyses obtained from ICP-OES of the isolated lignin samples and the purchased Indulin AT are shown in Table 3.
Although Indulin AT lignin had the lowest amount of VM in all lignin samples at 12.43%, wheat straw lignin had the highest at 20.19%. The main reason for this is the delignification conditions, and as a result of these, the molecular weight of wheat straw lignin decreased compared with that of other lignin samples. During the VM analyses at 250 °C, lignin structures broke down while evaporating the small molecular weight structures [19]. For this reason, the volatile matter contents strongly affected the thermal behavior [6]. Thus, a high volatile material ratio may limit fiber spinning and result in deficiencies in the carbon fiber production [19]. Therefore, for carbon fibers made from poplar and wheat straw lignin, it is possible that there will be defects in the fibers during the thermal stabilization and carbonization phase.
The main significant indication of lignin purity is the amount of Klason lignin it contains [19]. It can be seen in Table 3 that the lignin samples had similar Klason lignin values, and all values were greater than 80%. Some of the lignin samples can dissolve in acid when the Klason lignin content is determined. This is because lignin changes significantly in acidic environments due to its oxygen-containing functional groups at benzylic locations. Therefore, during the Klason analysis, some lignin is eliminated with the acid solution. This fraction is called acid-soluble lignin [43]. In addition, Alekhina et al. reported that the acid-soluble lignin content of isolated lignins increased with decreasing final isolation pH [24]. Indulin AT Klason lignin content was calculated as 88.8% in a previous study [27]. Our Klason lignin results indicate that the applied isolation process could be considered satisfactory and improved for high-purity lignin isolation. The purity of the lignin samples obtained from this study was at a sufficient level as compared with the literature [4,18,25,44,45,46].
Inorganic materials, a significant part of the black liquor (Table 2), were eliminated during the isolation process, according to Table 3. The ash content of Indulin AT lignin was reported as 2.15% by Luo [19] and 2.01% by Hu et al. [27]. Our result was 2.02%, which is close to the literature results. When the lignin values were examined, it was noted that isolated lignins from pine, poplar, and OBL were purer than those of Indulin AT. The high ash content ratio of the wheat straw lignin can be evaluated as the rich natural silica content of the raw material [45].
From the ICP-OES analysis, the element contents of samples are given in Table 3, showing that wheat straw lignin contains the highest amount of phosphorus (P), sodium (Na), potassium (K), and silica (Si), at 238.06 ppm, 4214.68 ppm, 598.20 ppm, and 22.25 ppm, respectively. Further, all lignins were found to contain high amounts of sulfur, which comes from sodium sulfur (N2S) in kraft white liquor. The highest amounts of Al, Mg, Ca, and Fe minerals were found to be 87.82 ppm, 162.62 ppm, 12.55 ppm, and 68.98 ppm, respectively, in Indulin AT lignin. Metal impurities cause deformities during carbonization, weakening carbon fibers. In addition, cations present during the cationic-electrochemical film coating reduce the metal corrosion resistance. For this reason, for high-value applications, the ash content of lignin does not exceed 1–3% [47]. However, metals in the ash, such as P and Ca, can speed up the secondary cracking reactions during thermal degradation [6]. Further, the biofuel yields from wheat straw lignin are likely to be much lower than those from other lignins.
The results for TPC, CG, and lignin precursors obtained by nitrobenzene oxidation (vanillin and syringaldehyde) of lignin samples are shown in Table 4. Although degraded polysaccharide products in lignin samples prevent the operation of Folin–Ciocalteu reagent, it is a valuable method with which to compare different lignin samples [48]. While the highest amount of phenolic substance belonging to the black pine kraft lignin was found to be 826.91 mg GAE/L, the lowest amount of phenolic substance was determined in wheat straw as 439.41 mg GAE/L. Poplar lignin, OBL, and Indulin AT have similar contents of phenolic substances. Pine lignin may have significant potential in the pharmaceutical industry due to its high content of phenolic compounds [36].
The presence of a CG on the lignin structure means that lignin degradation occurred via oxidation during alkaline pulping. Therefore, this also indicates the presence of low-molecular-weight lignin molecules. However, the reactivity of lignin is also demonstrated [34]. Therefore, it can be inferred that the reactivity of Indulin AT lignin will be lower than that of other lignin samples. The highest CG was detected in wheat straw lignin as 10.68%. Therefore, the excess of CG indicates the formation of low-molecular-weight lignin molecules via oxidation reactions during kraft pulping, which can be attributed to the lowest amounts of phenolic substances because of the highest amount of volatile material in wheat straw.
The results for the alkaline NbOx of the lignin samples are shown in Figure 1 and summarized in Table 4. Vanillin and syringaldehyde, which come from guaiacyl (G) and syringyl (S) lignin subunits, were the main products found in the oxidized mixture. The presence of vanillin and the absence of syringaldehyde show that OBL and pine lignins are G-type lignins, which are typical for softwoods. The amount of syringaldehyde as a typical hardwood lignin was higher in poplar lignin, as is compatible with the common science. Wheat straw contained a slightly higher quantity of syringaldehyde than vanillin, but it can clearly be seen in Figure 1 that there are undefined peaks. These peaks probably represent other nitrobenzene oxidation products, such as p-hydroxybenzoic acid, vanillic acid, syringic acid, and p-hydroxybenzaldehyde [21,49]. The presence of the S-type in lignins is important in processing lignin by extrusion as a polymer. This is because syringyl lignin is more easily processed than the other structures [50]. Therefore, poplar, wheat straw, and Indulin AT will be processed more easily in extrusion processes (such as polymer composites, carbon fiber, etc.).
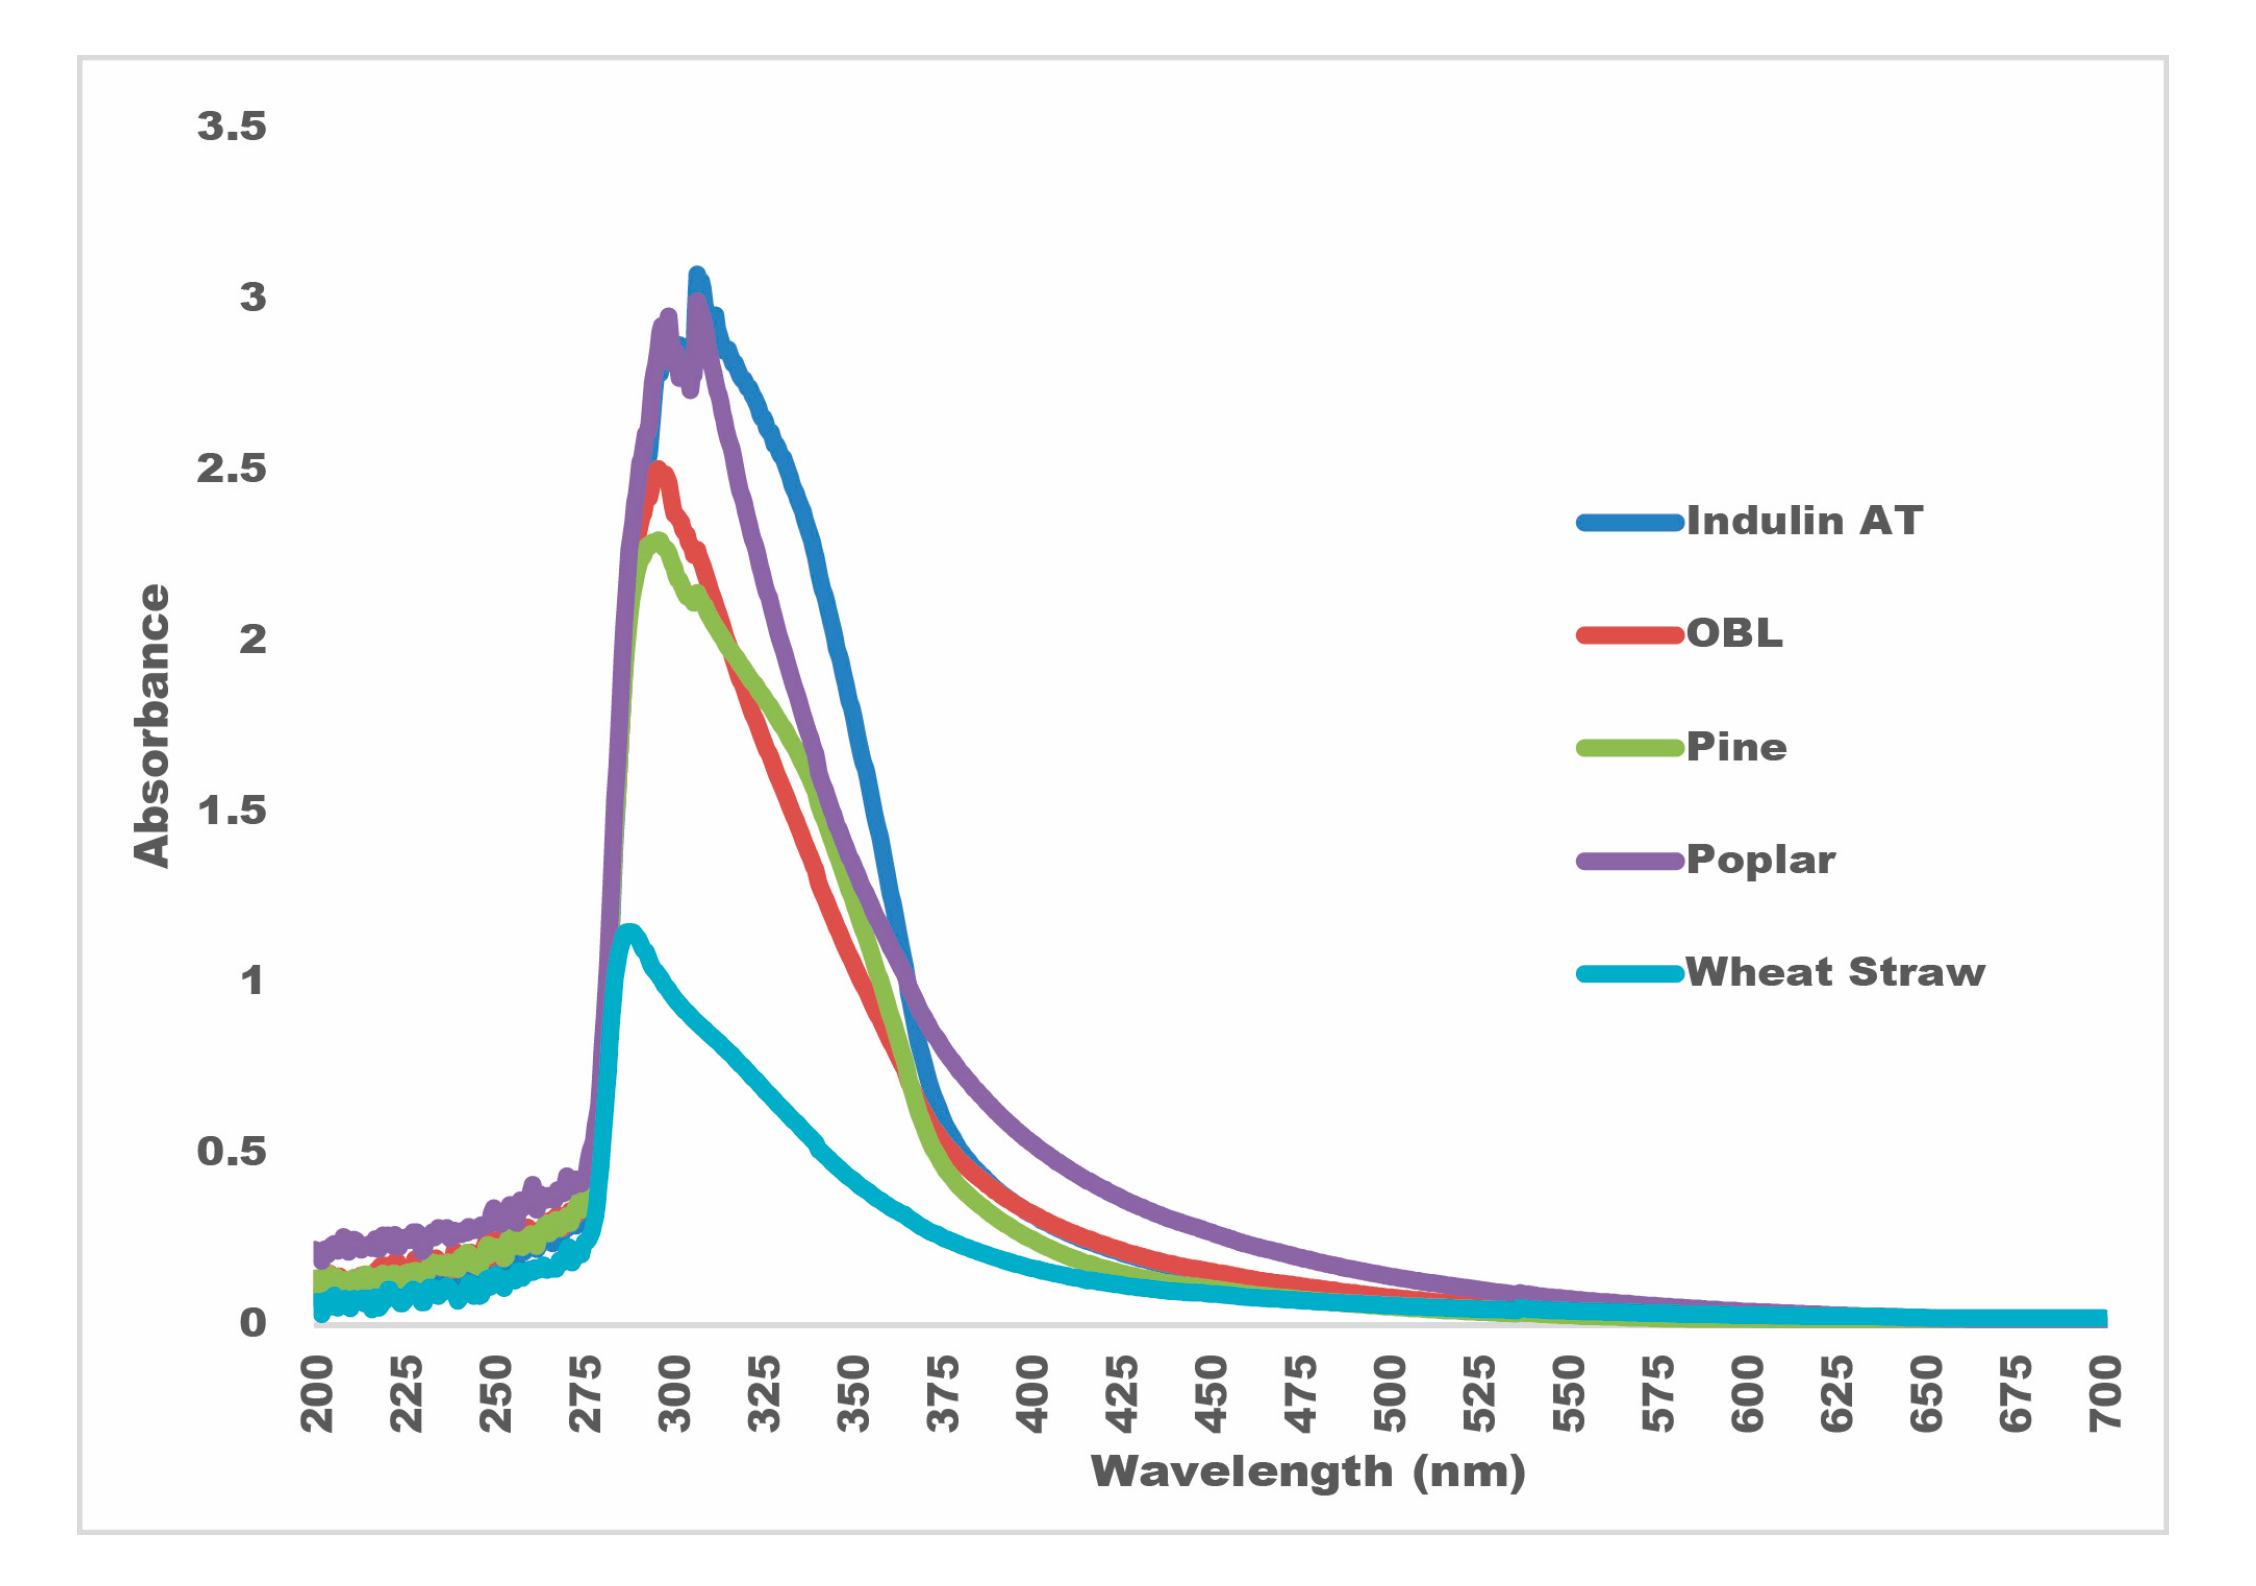
The UV–vis spectroscopy results for the isolated lignin samples are presented in Figure 2, and variations in absorbance can be observed according to the lignin type. On the basis of several techniques, the quantitative determination of lignins is performed at 280 nm, the maximum absorbance point [51]. However, as shown in Figure 2, the maximum absorbances of lignin samples were obtained at wavelengths higher than 280 nm. Structural variances, conjugated structures such as carbonyl groups, and stilbenes in lignin samples obtained from different origins were the primary reason for this, because these structures have the ability to shift the maximum absorbance of lignin samples [51]. In addition, there might be a shift in maximum absorbance to long wavelengths due to the effect of the functional group content, especially hydroxyl (-OH) and hydrosulfide ions (-SH) [52]. The maximum absorbance wavelengths of lignins were determined for Indulin AT lignin as 307 nm, OBL isolated lignin as 296 nm, pine lignin as 296 nm, poplar lignin as 307 nm, and wheat straw lignin as 288 nm. It was observed that the absorbance value was the lowest in the wheat straw lignin. The lack of phenolic compounds in this sample may have caused a decrease in absorbance intensity [52]. In addition, according to Figure 2, it can be noted that all lignin samples have the potential to be used as UV-protectant materials or sunlight blockers in terms of their UV radiation absorbance [53].
FT-IR spectra of the lignin samples are given in Figure 3. The significant peaks were determined and discussed according to previous studies to interpret the differences in the functional groups of lignin samples [22,45,54,55,56]. It can be noted from Figure 3 that there were significant differences in functional groups between lignin species. For example, the -OH group peak found in the FT-IR spectra of all samples between 3000 and 3400 cm−1 gave low wavelengths in poplar and Indulin AT lignin, while this was rather pronounced and broad in pine, wheat straw, and OBL.
Similarly, between 2917–2934 cm−1 and 2848–2854 cm−1 wave numbers, which represent C-H vibrations found in methyl and methylene groups, relative differences were observed for fewer or more intensities compared with their presence in lignin samples. Similarly, asymmetrical deformation of the C-H vibration in all samples was observed with relative differences, with an absorption band of around 1460 cm−1. In addition, vibrations of aromatic skeletal structures in lignin structures were observed in all samples with bands around 1595 cm−1, 1512 cm−1, and 1424 cm−1.
Accordingly, the functional group difference in Indulin AT compared with the other lignin samples was that no significant peak could be observed at the wavelength representing the unconjugated C=O group, where all other lignins had a distinct peak at 1700–1713 cm−1. Although the significant peak at 1324–1328 cm−1 for wheat straw and poplar lignin samples is attributable to the C–O group in the syringyl ring, no significant peak was observed at this interval in Indulin AT, pine, or OBL lignin. However, the observed peak at the 1264–1266 cm−1 wavelength, representing the C–O bond, resulted from the guaiacyl ring in Indulin AT, Pine, and OBL lignins.
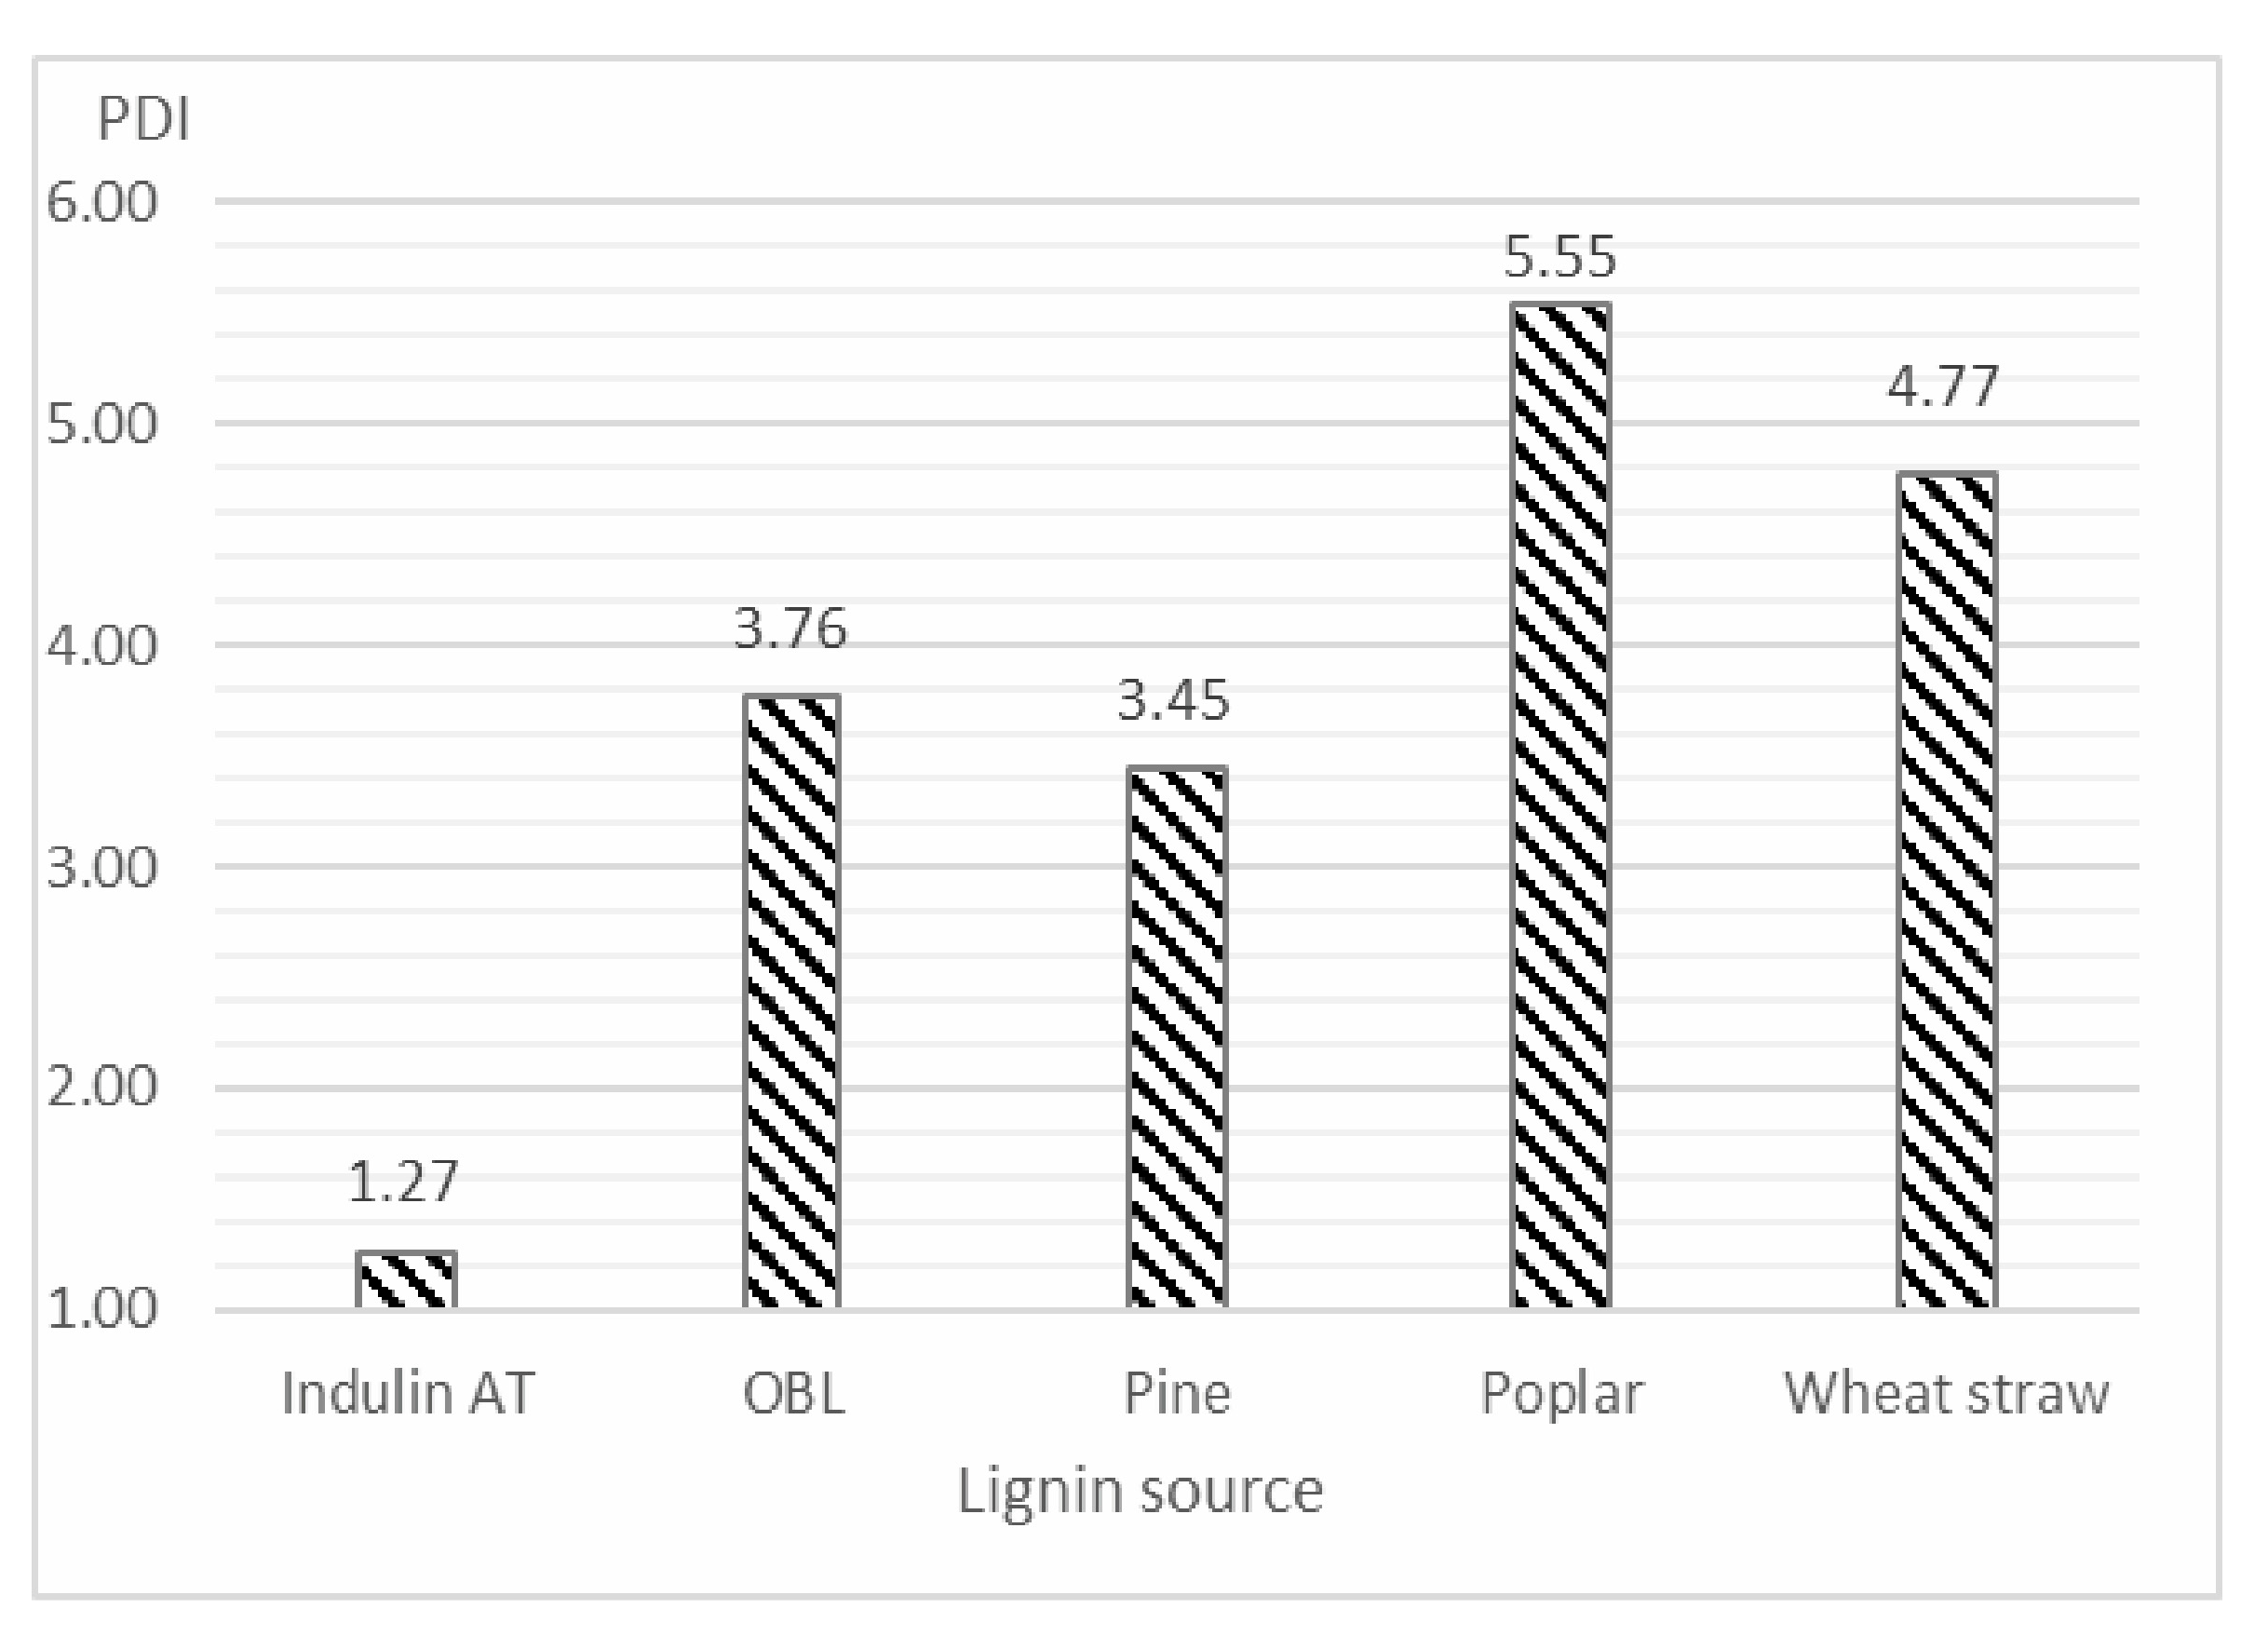
The molecular weights of the lignin samples were determined via the universal calibration method and the results can be seen in Table 5, with polydispersity indexes (PDI) shown in Figure 4. In terms of PDI, Indulin AT lignin gave the lowest PDI value at 1.266. This can be explained by the use of the acidification method to isolate the other lignin samples. Because no dimensional filtration process was performed in the acidification process, all dissolved molecules in the black liquors precipitated. It is known that the homogeneity of the lignin is indicated by a low polydispersity, which means it enhances the extrusion process for producing lignin end-products [50]. Brodin (2009) reported that the Mn value of coniferous wood lignins was 1000 Da, the Mw value was 4470 Da, and the polydispersity was 4.5. In addition, the lowest PDI value for coniferous lignin was found to be 3.5 after the filtration process [57]. Consequently, the filtration and acidification processes can increase the lignin homogeneity. The highest average molecular weight number (Mn) was calculated from pine lignin as 1854 Da. However, the pine lignin had the highest average molecular weight (Mw) and its polydispersity index (PDI) was found to be 3.449, which was also higher than that of Indulin AT (1.266). The molecular weight and PDI values of Indulin AT and pine lignin obtained in our study are similar to the values in the study conducted by Schmidl (1992) [58].
As can be seen in Figure 4, the PDI of the poplar lignin molecule had the highest value (5.547), which is compatible with the literature [57,58]. However, according to Table 3, the wheat straw VM content (20.19%) was the maximum and the highest polydispersity could not be measured. As compared with coniferous species, this may be due to the lower phenolic content of wheat straw and the VM content of poplar close to that of wheat straw (Table 4). Considering all the data, it can be concluded that the molecular weight difference between lignin fractions in poplar is relatively high compared with that of wheat straw. This indicates that poplar lignin will be more difficult to extrude than that of wheat straw.
Wheat straw lignin had the lowest MW of the isolated black liquor lignin samples. However, its polydispersity was relatively high compared with that of Indulin AT. Based on this, it would be difficult to achieve the desired properties for wheat straw lignin being used as a polymer. Nevertheless, the Mw values of wheat straw lignin are compatible with previous findings at around 2000 Da [59]. In addition, different pulping methods should be trialed if higher molecular weight lignin is desired. For example, Pan and Sano (2000) found that the Mn value of acetic acid lignin obtained from wheat straw was 2020 Da, the Mw value was 4440 Da, and the PDI value was 2.19, while for Soda-AQ lignin obtained from wheat straw, the Mn value was 1770 Da, the Mw value was 3270 Da, and the PDI value was 1.85 [60]. In the production of lignin-based carbon fiber, an environmentally friendly value-added product, it was reported that graphite-like structures are obtained from high-molecular-weight lignin. In contrast, amorphous carbon structures are obtained from low-molecular-weight lignins [61]. Based on this information, pine and OBL lignins may be preferred for carbon fiber production similar to that of graphite structures, while wheat straw and poplar lignins can be chosen for the production of amorphous carbon fiber used for more general purposes.
The TGA results for the lignin samples are given in Figure 5. It can be clearly observed that the samples go through a multi-stage physicochemical change. The first stage was between 0 °C and 54 °C, and 193 °C, resulting in a 5% mass loss, most likely caused by the removal of moisture and volatile components [10,45,62,63]. The second stage involved the decomposition temperatures at which the main mass loss was experienced, at around 340 °C, 349 °C for Indulin AT, 336 °C for OBL lignin, 318 °C for pine lignin, 343 °C for poplar lignin, and 314 °C for wheat straw lignin. This mass loss occurred at the temperature at which the actual degradation occurred by exceeding the thermal degradation heat of the lignin [62,63]. The last stage was at around 600 °C, where the experiment ended with Td (degradation temperature) values, and it can be seen that the total mass loss was between 38.75% and 54% by heating the samples to 600 °C. Indulin AT, OBL lignin, poplar, wheat straw, and pine lignin are the most resistant to extreme thermal effects. The Klason lignin contents of lignins are shown to be very similar in Table 3, but their thermal behavior is very different. Dominguez-Robles et al. (2017) stated that the main reason for this is that samples with the same amount of Klason lignin contain different amounts of carbohydrates [18].

4. Conclusions

According to the results obtained from lignin characterization studies, it was concluded that the properties of isolated lignin samples from kraft black solutions produced by acidification were comparable to those from the literature studies.
-
Some lignin samples obtained from agro-treated raw materials can contain higher amounts of elements, such as K, P, and Si.
-
When using the kraft method for pulping processes, the obtained lignin may contain too much sulfur and its compounds.
-
Due to the high phenolic contents of the conifer lignins, they can be evaluated for pharmaceutical and insecticidal applications.
-
Because the ash content of the lignin samples for pine, poplar, OBT, and Indulin AT are between 1 and 3%, they can be used for high-value applications.
-
Due to the UV-absorbance values between 288 and 307 nm, lignin samples have the potential to be used as UV-protectant materials or sunlight blockers.
-
Conifer lignin had the highest thermal degradation rate because of its lower ash and mineral composition and high moisture content. Indulin AT, OBL lignin, poplar, wheat straw, and pine lignin are the most resistant to extreme thermal conditions.
-
Despite its negative properties, such as high polydispersity, high volatile matter content, and high ash and sulfur content, wheat straw lignin was found to have significant potential in terms of extrusion processability, with a higher syringyl lignin content.
Consequently, the main component of black liquor, lignin, can be used to produce value-added products. These kinds of materials both reduce environmental pressures and provide economic value to pulping plants.

Author Contributions

Conceptualization, Ç.O. and S.A.; methodology, Ç.O. and S.A.; writing—original draft preparation, Ç.O. and S.A.; writing—review and editing, Ç.A. and S.A.; All authors have read and agreed to the published version of the manuscript.

Funding

This study was supported by Kastamonu University, Scientific Research Projects Coordination Department under grant Project Number: KÜBAP-01/2017-73.

Institutional Review Board Statement

Not applicable.

Informed Consent Statement

Not applicable.

Data Availability Statement

The data presented in this study are available on request from the corresponding author.

Acknowledgments

The authors would like to thank Associate Mahmut GÜR for his valuable support in this research.

Conflicts of Interest

The authors declare no conflict of interest.

References

  1. Bajpai, P. Biermann’s Handbook of Pulp and Paper: Volume 1: Raw Material and Pulp Making, 3rd ed.; Elsevier: Amsterdam, The Netherlands, 2018. [Google Scholar]
  2. Chio, C.; Sain, M.; Qin, W. Lignin utilization: A review of lignin depolymerization from various aspects. Renew. Sustain. Energy Rev. 2019, 107, 232–249. [Google Scholar] [CrossRef]
  3. Bajwa, D.S.; Pourhashem, G.; Ullah, A.H.; Bajwa, S.G. A concise review of current lignin production, applications, products and their environmental impact. Ind. Crops Prod. 2019, 139, 111526. [Google Scholar] [CrossRef]
  4. Zhou, X.-F.; Lu, X.-J. Structural characterization of kraft lignin for its green utilization. Wood Res. 2014, 59, 583–591. [Google Scholar]
  5. Setter, C.; Oliveira, T.J.P. Evaluation of the physical-mechanical and energy properties of coffee husk briquettes with kraft lignin during slow pyrolysis. Renew. Energy 2022, 189, 1007–1019. [Google Scholar] [CrossRef]
  6. Lu, X.; Gu, X. A review on lignin pyrolysis: Pyrolytic behavior, mechanism, and relevant upgrading for improving process efficiency. Biotechnol. Biofuels Bioprod. 2022, 15, 106. [Google Scholar] [CrossRef]
  7. Hubbe, M.A.; Alén, R.; Paleologou, M.; Kannangara, M.; Kihlman, J. Lignin recovery from spent alkaline pulping liquors using acidification, membrane separation, and related processing steps: A review. BioResources 2019, 14, 2300–2351. [Google Scholar] [CrossRef]
  8. Pola, L.; Collado, S.; Oulego, P.; Díaz, M. Kraft black liquor as a renewable source of value-added chemicals. Chem. Eng. J. 2022, 448, 137728. [Google Scholar] [CrossRef]
  9. Zhu, W.; Theliander, H. Precipitation of lignin from softwood black liquor: An investigation of the equilibrium and molecular properties of lignin. BioResources 2015, 10, 1696–1714. [Google Scholar] [CrossRef]
  10. Ammar, M.; Mechi, N.; Slimi, H.; Elaloui, E. Isolation and purification of alfa grass kraft lignin from industrial waste. Curr. Trends Biomed. Eng. Biosci 2017, 6, 31–35. [Google Scholar] [CrossRef]
  11. Yang, W.; Mu, H.; Huang, Y. Treatment of black liquor from the papermaking industry by acidification and reuse. J. Environ. Sci. 2003, 15, 697–700. [Google Scholar]
  12. García, A.; Toledano, A.; Serrano, L.; Egüés, I.; González, M.; Marín, F.; Labidi, J. Characterization of lignins obtained by selective precipitation. Sep. Purif. Technol. 2009, 68, 193–198. [Google Scholar] [CrossRef]
  13. Haz, A.; Strizincova, P.; Majova, V.; Sskulcova, A.; Surina, I.; Jablonsky, M. Content of phenolic hydroxyl groups in lignin: Characterisation of 23 isolated non-wood lignin with various acids. Int. J. Recent Sci. Res. 2016, 7, 11547–11551. [Google Scholar]
  14. Lubis, M.A.; Labib, A.; Sudarmanto; Akbar, F.; Nuryawan, A.; Antov, P.; Kristak, L.; Papadopoulos, A.N.; Pizzi, A. Influence of lignin content and pressing time on plywood properties bonded with cold-setting adhesive based on Poly (Vinyl Alcohol), lignin, and hexamine. Polymers 2022, 14, 2111. [Google Scholar] [CrossRef] [PubMed]
  15. Wang, J.; Seidi, F.; Huang, Y.; Xiao, H. Smart lignin-based polyurethane conjugated with corrosion inhibitor as bio-based anticorrosive sublayer coating. Ind. Crops Prod. 2022, 188, 115719. [Google Scholar] [CrossRef]
  16. Liao, Z.; Zhu, Y.H.; Sun, G.T.; Qiu, L.; Zhu, M.Q. Micromorphology control of the lignin-based activated carbon and the study on the pyrolysis and adsorption kinetics. Ind. Crops Prod. 2022, 175, 114266. [Google Scholar] [CrossRef]
  17. Liu, H.; Xu, T.; Liu, K.; Zhang, M.; Liu, W.; Li, H.; Du, H.; Si, C. Lignin-based electrodes for energy storage application. Ind. Crops Prod. 2021, 165, 113425. [Google Scholar] [CrossRef]
  18. Domínguez-Robles, J.; Sánchez, R.; Díaz-Carrasco, P.; Espinosa, E.; García-Domínguez, M.T.; Rodríguez, A. Isolation and characterization of lignins from wheat straw: Application as binder in lithium batteries. Int. J. Biol. Macromol. 2017, 104, 909–918. [Google Scholar] [CrossRef]
  19. Luo, J. Lignin-Based Carbon Fiber. Master’s Thesis, The University of Maine, Orono, ME, USA, 2010. [Google Scholar]
  20. Melro, E.; Alves, L.; Antunes, F.E.; Medronho, B. A brief overview on lignin dissolution. J. Mol. Liq. 2018, 265, 578–584. [Google Scholar] [CrossRef]
  21. Liao, J.J.; Latif, N.H.A.; Trache, D.; Brosse, N.; Hussin, M.H. Current advancement on the isolation, characterization and application of lignin. Int. J. Biol. Macromol. 2020, 162, 985–1024. [Google Scholar] [CrossRef]
  22. Özmen, N.; Çetin, N.S.; Karademir, A. Alkali sülfit ve organosolv ligninlerin karakterize edilmesi (Characterization of alkali sulfide and organosolv lignins). In Proceedings of the II. Ulusal Karadeniz Ormancılık Kongresi, Artvin, Turkey, 15–18 May 2002; pp. 1092–1101. [Google Scholar]
  23. Sharma, M.; Simões, A.; Alves, P.; Gando-Ferreira, L.M. Efficient recovery of lignin and hemicelluloses from kraft black liquor. KnE Mater. Sci. 2022, 7, 1–7. [Google Scholar] [CrossRef]
  24. Alekhina, M.; Ershova, O.; Ebert, A.; Heikkinen, S.; Sixta, H. Softwood kraft lignin for value-added applications: Fractionation and structural characterization. Ind. Crops Prod. 2015, 66, 220–228. [Google Scholar] [CrossRef]
  25. Li, H.; McDonald, A.G. Fractionation and characterization of industrial lignins. Ind. Crops Prod. 2014, 62, 67–76. [Google Scholar] [CrossRef]
  26. El Mansouri, N.E.; Salvadó, J. Structural characterization of technical lignins for the production of adhesives: Application to lignosulfonate, kraft, soda-anthraquinone, organosolv and ethanol process lignins. Ind. Crops Prod. 2006, 24, 8–16. [Google Scholar] [CrossRef]
  27. Hu, Z.; Du, X.; Liu, J.; Chang, H.M.; Jameel, H. Structural characterization of pine kraft lignin: BioChoice lignin vs. Indulin AT. J. Wood Chem. Technol. 2016, 36, 432–446. [Google Scholar] [CrossRef]
  28. Ateş, S.; Kırcı, H.; Tutus, A. Influence of cooking variables of Crimean Pine (Pinus nigra Arnold SBSP. Pallassiana) kraft pulp on the resulting paper sheets. Wood Res. 2008, 53, 81–90. [Google Scholar]
  29. İstek, A.; Özkan, İ. Effect of sodium borohydride on Populus tremula L. kraft pulping. Turk. J. Agric. For. 2008, 32, 131–136. [Google Scholar]
  30. Deniz, I.; Kirci, H.; Ates, S. Optimisation of wheat straw Triticum drum kraft pulping. Ind. Crops Prod. 2004, 19, 237–243. [Google Scholar] [CrossRef]
  31. SCAN Residual Alkali (Hydroxide Ion Content) SCAN N 33:94; Scandinavian Pulp, Paper and Board Testing Committee: Stockholm, Sweden, 1994.
  32. Technical Association of the Pulp and Paper Industry. Method T 625 cm-85. Analysis of Soda and Sulphate Black Liquor. In TAPPI Test Methods; TAPPI Press: Atlanta, GA, USA, 1985. [Google Scholar]
  33. Technical Association of the Pulp and Paper Industry. Method T 211 om-93. Ash in Wood, Pulp, Paper and Paperboard: Combustion at 525 °C. In TAPPI Test Methods; TAPPI Press: Atlanta, GA, USA, 1993. [Google Scholar]
  34. Toledano, A.; Erdocia, X.; Serrano, L.; Labidi, J. Influence of extraction treatment on olive tree (Olea europaea) pruning lignin structure. Environ. Prog. Sustain. Energy 2013, 32, 1187–1194. [Google Scholar] [CrossRef]
  35. Technical Association of the Pulp and Paper Industry. Method T 222 om-88, Acid-Insoluble Lignin in Wood and Pulp. In TAPPI Test Methods; TAPPI Press: Atlanta, GA, USA, 1988. [Google Scholar]
  36. García, A.; Toledano, A.; Andrés, M.Á.; Labidi, J. Study of the antioxidant capacity of Miscanthus sinensis lignins. Process Biochem. 2010, 45, 935–940. [Google Scholar] [CrossRef]
  37. Reyes-Rivera, J.; Terrazas, T. Lignin Analysis by HPLC and FTIR. In Methods in Molecular Biology; Humana Press: New York, NY, USA, 2017; Volume 1544, pp. 193–211. [Google Scholar]
  38. Asikkala, J.; Tamminen, T.; Argyropoulos, D.S. Accurate and reproducible determination of lignin molar mass by acetobromination. J. Agric. Food Chem. 2012, 60, 8968–8973. [Google Scholar] [CrossRef]
  39. Unodc the Global Afghan Opium Trade a Threat Assessment. Available online: https://www.unodc.org/documents/data-and-analysis/Studies/Global_Afghan_Opium_Trade_2011-web.pdf (accessed on 10 July 2021).
  40. Chen, Y.; Stark, N.M.; Cai, Z.; Frihart, C.R.; Lorenz, L.F.; Ibach, R.E. Chemical modification of kraft lignin: Effect on chemical and thermal properties. BioResources 2014, 9, 5488–5500. [Google Scholar] [CrossRef]
  41. Wang, F.; Yang, X.; Zou, Y. The esterification of sodium lignosulfonate with maleic anhydride in water solution. Int. J. Polym. Anal. 2015, 20, 69–81. [Google Scholar] [CrossRef]
  42. Koumba-Yoya, G.; Stevanovic, T. Study of organosolv lignins as adhesives in wood panel production. Polymers 2017, 9, 46. [Google Scholar] [CrossRef] [PubMed]
  43. Yasuda, S.; Fukushima, K.; Kakehi, A. Formation and chemical structures of acid-soluble lignin I: Sulfuric acid treatment time and acid-soluble lignin content of hardwood. J. Wood Sci. 2001, 47, 69–72. [Google Scholar] [CrossRef]
  44. Waltersson, J. The Metal Binding Properties of Kraft Lignin. In Degree Project Report; Innventia: Stockholm, Sweden, 2009. [Google Scholar]
  45. Domínguez-Robles, J.; Espinosa, E.; Savy, D.; Rosal, A.; Rodríguez Pascual, A. Biorefinery process combining Specel® process and selective lignin precipitation using mineral acids. BioResources 2016, 11, 7061–7077. [Google Scholar] [CrossRef]
  46. Mondal, A.K.; Qin, C.; Ragauskas, A.J.; Ni, Y.; Huang, F. Preparation and characterization of various kraft lignins and impact on Their Pyrolysis Behaviors. Ind. Eng. Chem. Res. 2020, 59, 3310–3320. [Google Scholar] [CrossRef]
  47. Klett, A.S.; Chappell, P.V.; Thies, M.C. Recovering ultraclean lignins of controlled molecular weight from Kraft black-liquor lignins. Chem. Commun. 2015, 51, 12855–12858. [Google Scholar] [CrossRef]
  48. Faustino, H.; Gil, N.; Baptista, C.; Duarte, A.P. Antioxidant activity of lignin phenolic compounds extracted from kraft and sulphite black liquors. Molecules 2010, 15, 9308–9322. [Google Scholar] [CrossRef]
  49. Ibrahim, M.N.M.; NorNadiah, M.Y.; Azian, H. Comparison studies between soda lignin and soda-anthraquinone lignin in terms of physico-chemical properties and structural features. J. Appl. Sci. 2006, 6, 292–296. [Google Scholar]
  50. Souto, F.; Calado, V.; Pereira, N. Lignin-based carbon fiber: A current overview. Mater. Res. Express 2018, 5, 072001. [Google Scholar] [CrossRef]
  51. Schmidt, J.A. Electronic spectroscopy of lignins. In Lignin and Lignans: Advances in Chemistry; Heitner, C., Dimmel, D., Schmidt, J., Eds.; CRC Press: Boca Raton, FL, USA, 2010; pp. 49–102. [Google Scholar]
  52. Pavia, D.L.; Lampman, G.M.; Kriz, G.S.; Vyvyan, J.A. Introduction to Spectroscopy, 5th ed.; Cengage Learning: Stamford, CT, USA, 2014. [Google Scholar]
  53. Sadeghifar, H.; Ragauskas, A. Lignin as a UV light blocker—A review. Polymers 2020, 12, 1134. [Google Scholar] [CrossRef] [PubMed]
  54. Faix, O. Classification of lignins from different botanical origins by FT-IR spectroscopy. Holzforschung 1991, 45, 21–28. [Google Scholar] [CrossRef]
  55. Sameni, J.; Krigstin, S.; Sain, M. Characterization of lignins isolated from industrial residues and their beneficial uses. BioResources 2016, 11, 8435–8456. [Google Scholar] [CrossRef]
  56. Fodil Cherif, M.; Trache, D.; Brosse, N.; Benaliouche, F.; Tarchoun, A.F. Comparison of the physicochemical properties and thermal stability of Organosolv and Kraft lignins from hardwood and softwood biomass for their potential valorization. Waste Biomass Valorization 2020, 11, 6541–6553. [Google Scholar] [CrossRef]
  57. Brodin, I.; Sjöholm, E.; Gellerstedt, G. Kraft lignin as feedstock for chemical products: The effects of membrane filtration. Holzforschung 2009, 63, 290–297. [Google Scholar] [CrossRef]
  58. Schmidl, G.W. Molecular Weight Characterization and Rheology of Lignin for Carbon Fibers. Ph.D. Thesis, University of Florida, Gainesville, FL, USA, 1992. [Google Scholar]
  59. Sun, R.; Lawther, J.M.; Banks, W.B.; Xiao, B. Effect of extraction procedure on the molecular weight of wheat straw lignins. Ind. Crops Prod. 1997, 6, 97–106. [Google Scholar] [CrossRef]
  60. Pan, X.J.; Sano, Y. Comparison of acetic acid lignin with milled wood and alkaline lignins from wheat straw. Holzforschung 2000, 54, 61–65. [Google Scholar] [CrossRef]
  61. Domínguez, J.C.; Santos, T.M.; Rigual, V.; Oliet, M.; Alonso, M.V.; Rodriguez, F. Thermal stability, degradation kinetics, and molecular weight of organosolv lignins from Pinus radiata. Ind. Crops Prod. 2018, 111, 889–898. [Google Scholar] [CrossRef]
  62. Hatakeyama, H.; Hatakeyama, T. Thermal properties of isolated and in situ lignin. In Lignin and Lignans: Advances in Chemistry; Heitner, C., Dimmel, D., Schmidt, J., Eds.; CRC Press: Boca Raton, FL, USA, 2010; pp. 301–320. [Google Scholar]
  63. Melro, E.; Filipe, A.; Sousa, D.; Valente, A.J.M.; Romano, A.; Antunes, F.E.; Medronho, B. Dissolution of kraft lignin in alkaline solutions. Int. J. Biol. Macromol. 2020, 148, 688–695. [Google Scholar] [CrossRef]
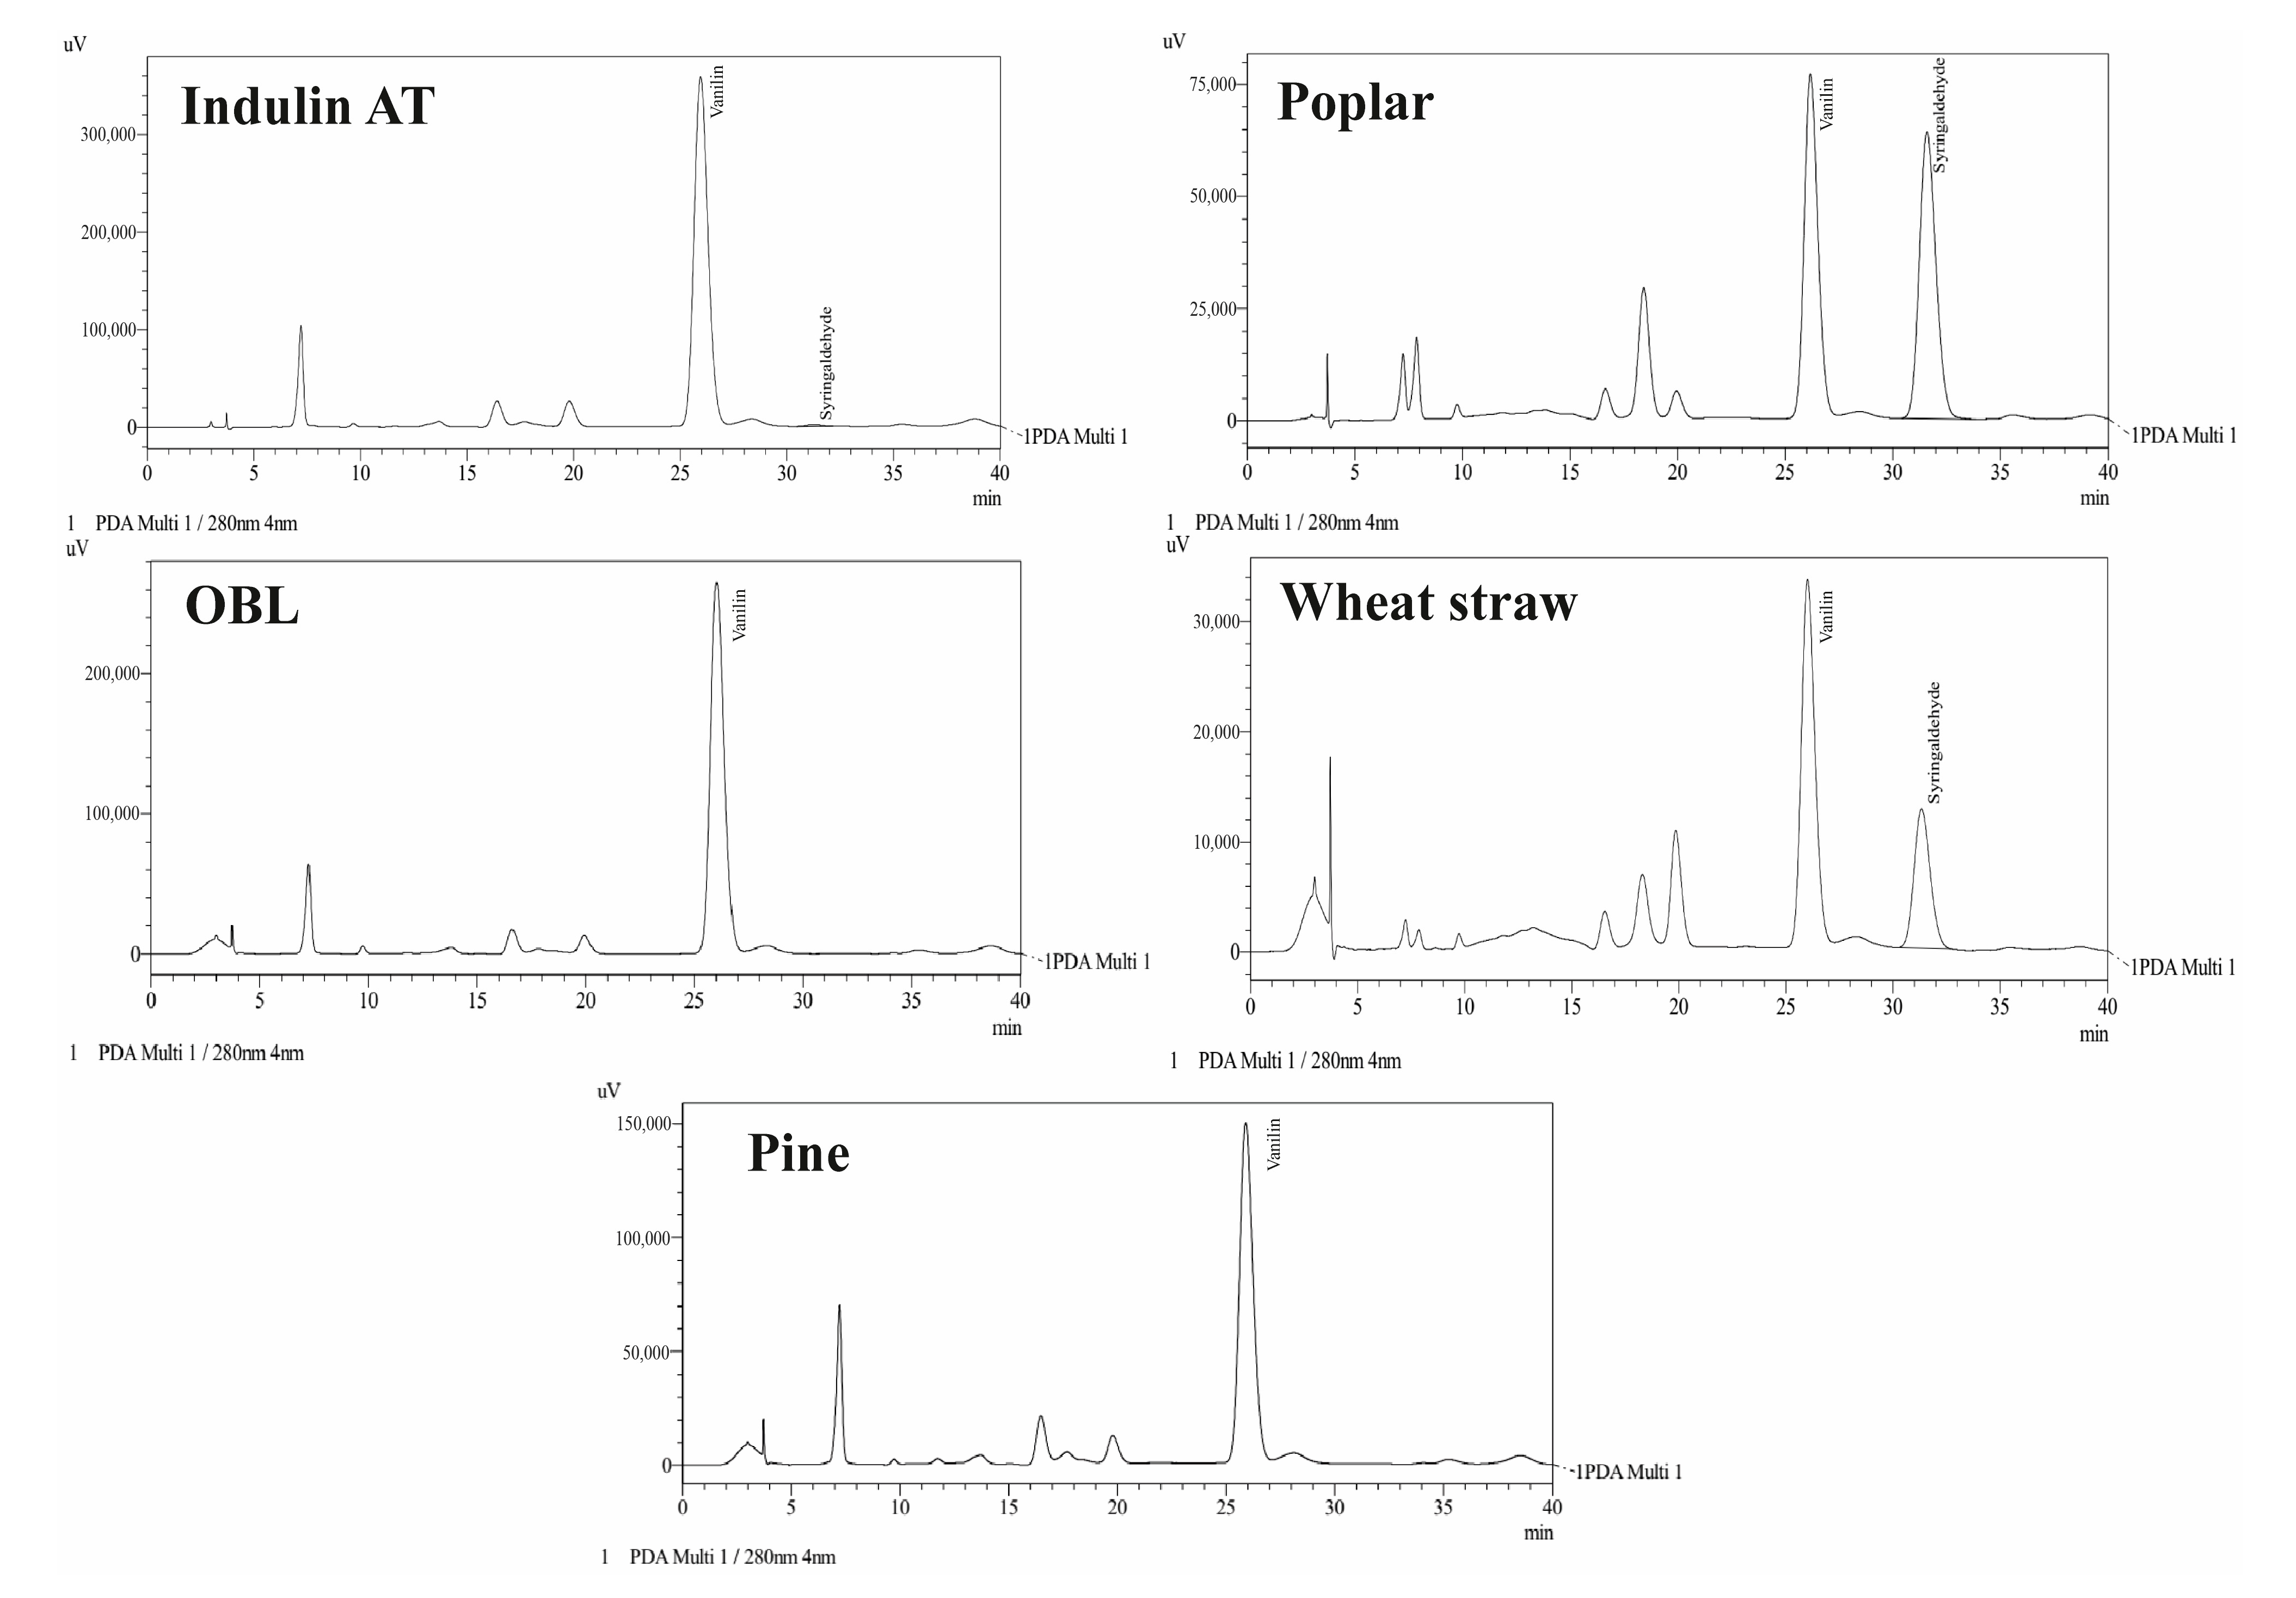
Figure 1. HPLC chromatograms of nitrobenzene oxidized lignins.
Forests 14 00882 g001
Figure 2. UV–vis spectra of lignin samples.
Forests 14 00882 g002
Figure 3. FT-IR spectra of lignin samples.
Forests 14 00882 g003
Figure 4. Polydispersity indexes of lignins.
Forests 14 00882 g004
Figure 5. TGA data of lignin samples.
Forests 14 00882 g005
Table 1. Kraft pulping parameters.
UnitPinePoplarWheat Straw
Active alkali%181614
Sulfidity%302620
Raw Material to Liquor Ratiokg/L1/41/41/4
Cooking Temperature°C170170160
Total Cooking Timemin18015095
Reference-[28][29][30]
Table 2. Black liquor properties.
UnitPinePoplarWheat StrawOBL
Densityg/mL1.111.081.081.17
Initial pH-13.1613.0513.0412.90
TDS%19.92
(0.44)
16.67
(0.51)
15.00
(0.22)
50.00
(2.71)
IC%26.24
(3.63)
29.04
(2.71)
27.48
(0.95)
33.49
(2.36)
OC%73.7670.9672.5266.51
Residual alkalig/L7.176.415.2713.25
TDS: total dissoluble content; IC: inorganic mater content; OC: organic matter content.
Table 3. Ash, volatile matter (VM), Klason lignin, and elements composition of lignin samples.
Lignin SourceIndulin ATOBLPinePoplarWheat Straw
Ash (%)2.02
(0.07)
1.53
(0.38)
1.90
(0.51)
1.78
(0.75)
3.41
(0.84)
VM (%)12.43
(1.26)
14.65
(2.53)
15.60
(4.00)
18.35
(3.85)
20.19
(3.74)
Klason lignin (%)85.60
(3.34)
88.11
(2.19)
88.11
(6.46)
82.57
(4.450)
85.88
(4.35)
Al (ppm)87.82
(0.80)
33.61
(0.18)
12.58
(0.05)
7.64
(0.35)
31.10
(0.27)
Na (ppm)1165.38
(1.04)
1551.58
(9.38)
578.67
(1.09)
1168.46
(6.65)
4214.68
(27.93)
Mg (ppm)162.62
(2.55)
20.53
(0.12)
11.36
(0.10)
26.89
(0.13)
38.25
(0.15)
Ca (ppm)12.55
(0.06)
5.03
(0.01)
3.18
(0.01)
5.20
(0.04)
12.29
(0.09)
K (ppm)137.66
(1.24)
134.13
(3.97)
16.01
(0.97)
27.39
(1.03)
598.20
(1.56)
Fe (ppm)68.98
(0.64)
52.68
(0.16)
8.88
(0.02)
13.67
(0.57)
55.89
(0.56)
P (ppm)29.03
(4.58)
12.16
(0.28)
8.37
(0.15)
9.49
(0.08)
238.06
(1.24)
Si (ppm)16.66
(0.40)
4.80
(0.16)
--22.25
(0.32)
S (ppm)12,297.28
(60.70)
20,397.88
(153.15)
9862.00
(97.37)
14,106.36
(81.05)
24,567.28
(39.14)
Table 4. Results for total phenolic content, carboxyl group content, and nitrobenzene oxidation.
Lignin SourcePhenolic
(mg GAE/L)
COOH
(%)
Vanillin
(mmol/L)
Syringaldehyde (mmol/L)
Indulin AT555.254.161.2500.108
OBL525.258.660.870-
Pine826.919.780.500-
Poplar541.919.110.2770.531
Wheat straw439.4110.680.1370.181
Table 5. GPC results for lignin samples.
Lignin SourceMn (Da)Mw (Da)
Indulin AT17182176
OBL13815196
Pine18546395
Poplar7324061
Wheat straw6072892
Disclaimer/Publisher’s Note: The statements, opinions and data contained in all publications are solely those of the individual author(s) and contributor(s) and not of MDPI and/or the editor(s). MDPI and/or the editor(s) disclaim responsibility for any injury to people or property resulting from any ideas, methods, instructions or products referred to in the content.