Article

Complete Chloroplast Genome of Bamboo Species Pleioblastus ovatoauritus and Comparative Analysis of Pleioblastus from China and Japan

Co-Innovation Center for Sustainable Forestry in Southern China, College of Forestry, Nanjing Forestry University, Nanjing 210037, China
*
Author to whom correspondence should be addressed.
Forests 2023, 14(5), 1051; https://doi.org/10.3390/f14051051
Submission received: 20 March 2023 / Revised: 10 May 2023 / Accepted: 17 May 2023 / Published: 19 May 2023
(This article belongs to the Topic Plant Chloroplast Genome and Evolution)

Abstract

:
Pleioblastus ovatoauritus T.H.Wen ex W.Y.Zhang is bamboo species published in 2018, originated from and existing in southeastern China. The chloroplast genome of Pl. ovatoauritus was obtained using a high-throughput sequencing platform. The chloroplast genome is up to 139,708 bp in length and displays a typical quadripartite structure with one large single-copy region, one small single-copy region, and two inverted repeat regions. There are 82 protein-coding genes, 8 rRNA genes, and 39 tRNA genes in the plastome genome. However, the interspecific relationship of Pleioblastus species originated from China and Japan has not been revealed explicitly. To understand their relationship, data from four Chinese species and four Japanese species were selected to investigate the distinctions between their genome structures, codon usage patterns, and SSR sites. We moved forward to examine the sequence divergence and polymorphic sites between the eight species. Phylogenetic trees were then plotted using the maximum likelihood method based on different parts of the sequences. Obvious difference found in the JLB boundary and a split in the phylograms contributed to our decision to split Pleioblastus species of China and Japan into different clades. Moreover, taxonomy using the subgenera concept in Flora Reipublicae Popularis Sinicae proved untenable. Nine SSR primers for Pleioblastus genus were then developed from cp genomes, aimed at facilitating identification and germplasm investigation.

1. Introduction

Bambusoideae is a subfamily of Poeace with over 139 accepted genera and 1700 species [1], leaving its imprint in all major continents in temperate and tropical or woody or herbaceous climates [2]. The traditional method of classifying bamboo species based on their reproductive organs has limitations due to their irregular blossoming and fruiting habits. Recent studies also suggested reticulation and hybridization phenomena in their origin [3,4]. DNA sequencing and molecular markers such as SSR and SNP markers have been employed to resolve the phylogeny, population origin, genetic evolution, diversity, and phylogenetic identification of Poaceae species [5].
Pleioblastus is a tough genus of woody bamboo found mainly in eastern Asia. It is used by locals for the handles of brushes and umbrellas, and some species are used for gardening due to their beauty. In the flora of China, Pleioblastus species are first divided into two groups according to their height and leaf blades [6]. Dwarf species with leaf blades variegated or closely distichous are grouped and described as native to Japan. Species of normal height, not variegated, separated, and not distichous are grouped and described as endemic to China. In Flora Reipublicae Popularis Sinicae (Volume 9, part 1), the genus is included in Subtribe Arundinariinae with two subgenera, namely, Subgen. Pleioblastus and Subgen. Nipponocalamus [7]. Subgen. Nipponocalamus is further divided into Sect. Nipponocalamus and Sect. Amari based on the dehiscence on the apical palea. Although both FOC and FRPS failed to include all Pleioblastus species, we were inspired by FOC to consider that the Pleioblastus classification may have strong connection with the origin places of species. According to Clark (2010) and Li (2012), Pleioblastus is a polyphyletic genus with its species separated in different clades, and the interspecific relationship remains to be reevaluated due to their mass distribution in different clades [8]. Meanwhile, the polyphyletic character of Pseudosasa, Sasa, and Pleioblastus posed challenges to developing molecular markers with a demand for higher resolution [8]. Pleioblastus ovatoauritus T.H. Wen ex W.Y. Zhang is a newly discovered species in China, found and originally named by Taihui Wen, which was then adopted and formally published by Yue Jin-jun [9]. With culm of 6–7 m, internodes of 30–45 cm, and culm sheaths of a greenish-yellow turning to yellowish-brown, the bamboo greatly resembles Pl. maculatus but without a setose ring in the base of the culm sheath (see Figure 1).
In plants, the chloroplast is a crucial organelle that performs photosynthesis and generates energy for the plant. It contains a circular DNA genome with a quadripartite structure consisting of one large single-copy (LSC) region, one small single-copy (SSC) region, and two inverted repeat (IR) regions [10]. The chloroplast genome spans 15,553 base pairs (bp) to 521 kbp [11], containing genes which function in photosynthesis or self-replication. The chloroplast genome is highly conserved, with no gene recombinations happening in the replication process of cells. Due to its high conservation, the chloroplast genome becomes a useful tool for studying phylogenetic relationships between different species [12,13,14,15].
In this study, we sequenced and annotated the chloroplast genome of Pl. ovatoauritus, the newly published species. Seven other Pleioblastus species’ chloroplast genomes were also downloaded from NCBI to investigate the interspecific relationships within the genus Pleioblastus. Species in the Japanese group are all dwarf bamboos for ornamental usage, while Chinese group’s bamboo grows to normal height. Codon usage pattern, IR boundary variation, polymorphic sites, and sequence divergence were examined with the aim of revealing the differences between these species. Phylogenetic trees were drawn at last, based on different parts of the genome. We aimed to figure out the phylogenetic relationship inside the Pleioblastus species and provide valid evidence for the pros or cons of the split view. Additionally, general SSR primers were developed for the eight species, which could be used in germplasm investigation and phylogenetic analysis of Pleioblastus.

2. Materials and Methods

2.1. DNA Sample and Data Collection

Fresh leaves sample of Pl. ovatoauritus were collected from living plants in the bamboo garden of Anji, Zhejiang province, China (30°38′ N, 119°41′ E), by Guo QR and Zhou Jie on 18 October 2018. Total DNA was extracted from 100 mg fresh leaves using Qiagen Plant Genomic DNA Prep Kit (Sangon Biotech, Shanghai, China) and, through agarose gel electrophoresis, we purified the DNA sample and sequenced it using Illumina Hiseq 2500 platform. A total of 37.8 gb original sequencing data were obtained. The voucher specimens are preserved in the Germplasm Gene Bank of the Co-Innovation Center for Sustainable Forestry in Southern China, Nanjing Forestry University.
Data of Pl. amarus (Keng) Keng f.; Pl. maculatus (McClure) C.D.Chu and C.S.Chao; Pl. triangulata (Hsueh and T.P.Yi) N.H.Xia, Y.H.Tong, and Z.Y.Niu; Pl. argenteostriatus (Regel) Nakai; Pl. fortunei (Van Houtte) Nakai; Pl. pygmaeus ‘Disticha’; Pl. pygmaeus (Miq.) Nakai; Phyllostachys reticulata (Ruprecht) K. Koch; Ph. edulis (Carriere) J. Houzeau; Ph. edulis ‘Yuanbao’; Ph. propinqua McClure; Ph. violascens (Carrière) Riviere and C. Rivière; Shibataea chiangshanensis T. W. Wen; and S. kumasaca (Zoll. ex Steud.) Makino ex Nakai were downloaded from NCBI (National Center for Biotechnology Information (nih.gov)). Details of their cp genomes are shown in Table 1. The scientific name of the material used in chloroplast genome accession MW874473, whose name was originally Phyllostachys edulis f. tubaeformis, was corrected to Phyllostachys edulis ‘Yuanbao’ according to the document and confirmation with the author, Yue Jin-Jun [16,17].
Pl. amarus, Pl. macualtus, and Pl. triangulata have the same origin as Pl. ovatoauritus, growing in mainland China. These species are of normal culm length and their leaf blades are not variegated, separated, and not distichous. Pl. argenteostriatus, Pl. fortunei, Pl. pygmaeus ‘Disticha’, and Pl. pygmaeus are all dwarf species that are native to Japan. Phyllostachys is a genus with plenty of well-known species and the relationship concerning Phyllostachys is clearer. Compared to some of Arundinarieae genera, such as Indosasa or Pseudosasa, Phyllostachys species tend not to mix with other genera when clustering, thus providing evident reflection in analysis. Shibataea also has advantages similar to Phyllostachys, but has a closer relationship with Phyllostachys.

2.2. Chloroplast Genome Assembly and Annotation

Raw data were assembled using GetOrganelle [18] with primitive parameter kmer = 85, and Pl. amarus was selected as the seed. The primary sequence was examined using Mauve [19] to find out if there were any errors in assembly. The cp genome was uploaded to the website application GeSeq (https://chlorobox.mpimp-golm.mpg.de (accessed on 15 August 2022)) for annotation assistance with manual correction by Genious (Version 8.0.1) [20]. Chloroplot [21] was employed to visualize the chloroplast genome. The annotated cp genome was uploaded to NCBI and was successfully adopted with the Genbank ID: OP239516.

2.3. Comparative Analysis of Complete Genomes

Before researching details of the genomes’ structures, Mauve was again used to investigate if there were any assembling errors and to find out if there were inversion or disorder regions on all the 8 species’ genomes. IRscope [22] was used for genome structure analysis, mainly on the extension or contraction of IRs of the genome.
We aligned 10 species by MAFFT v7.505 [23] in order to implement microstructural mutations and sequence polymorphism analysis using Dnasp 6.0 [24]. Total sequence, LSC, SSC, IR, and CDS sequences will be analyzed, respectively, by the sliding window method. For the better visualization of the DNA diversity, mVISTA [25] was then employed using the Shuffle-LAGAN model to produce cross-sectional comparison graph.
For the better understanding of the expression of chloroplast plastome genes and the internal phylogenic process of the 8 species in Pleioblastus genus, CodonW (Version 1.3) [26] was used for counting and analyzing the CUS and RSCU values of 82 genes that were common in all 8 species. CAI, CBI, and GC3 values were also involved to predict the usage bias of each genome.

2.4. Phylogenic Analysis

In order to obtain comprehensive and more accurate results, full sequences, LSC regions, SSC regions, single copy regions, and 78 CDS sequences of 15 species (8 Pleioblastus, 5 Phyllostachys, and 2 Shibataea) were selected for the phylogenic analysis. Ph. reticulata, Ph. violasens, Ph. propinqua, Phyllostachys edulis, Phyllostachys edulis ‘Yuanbao’, S. chiangshanensis and S. kumasaca were selected as outgroup. A total of 10 species’ Sequences were aligned by MAFFT. MEGA 11 was used for the final phylogenic and evolutionary history analyzing by the maximum likelihood method [27]. After 1000 repetitions, bootstrap consensus trees were inferred. Interactive Tree Of Life (iTOL) v5 was used for the polishing of trees [28].

2.5. Development of Primers for SSRs

We used the website, MISA, for the positioning of SSRs in 8 species [29]. The minimum repeating times of mono nucleotide repeats, dinucleotides repeat, trinucleotides, tetranucleotides repeats, and pentanuclotides repeats were required up to 9, 5, 4, 4, 4, respectively. Primer 3 Plus [30] was employed for the development of primers.

3. Results

3.1. Chloroplast Genome of Pl. ovatoauritus

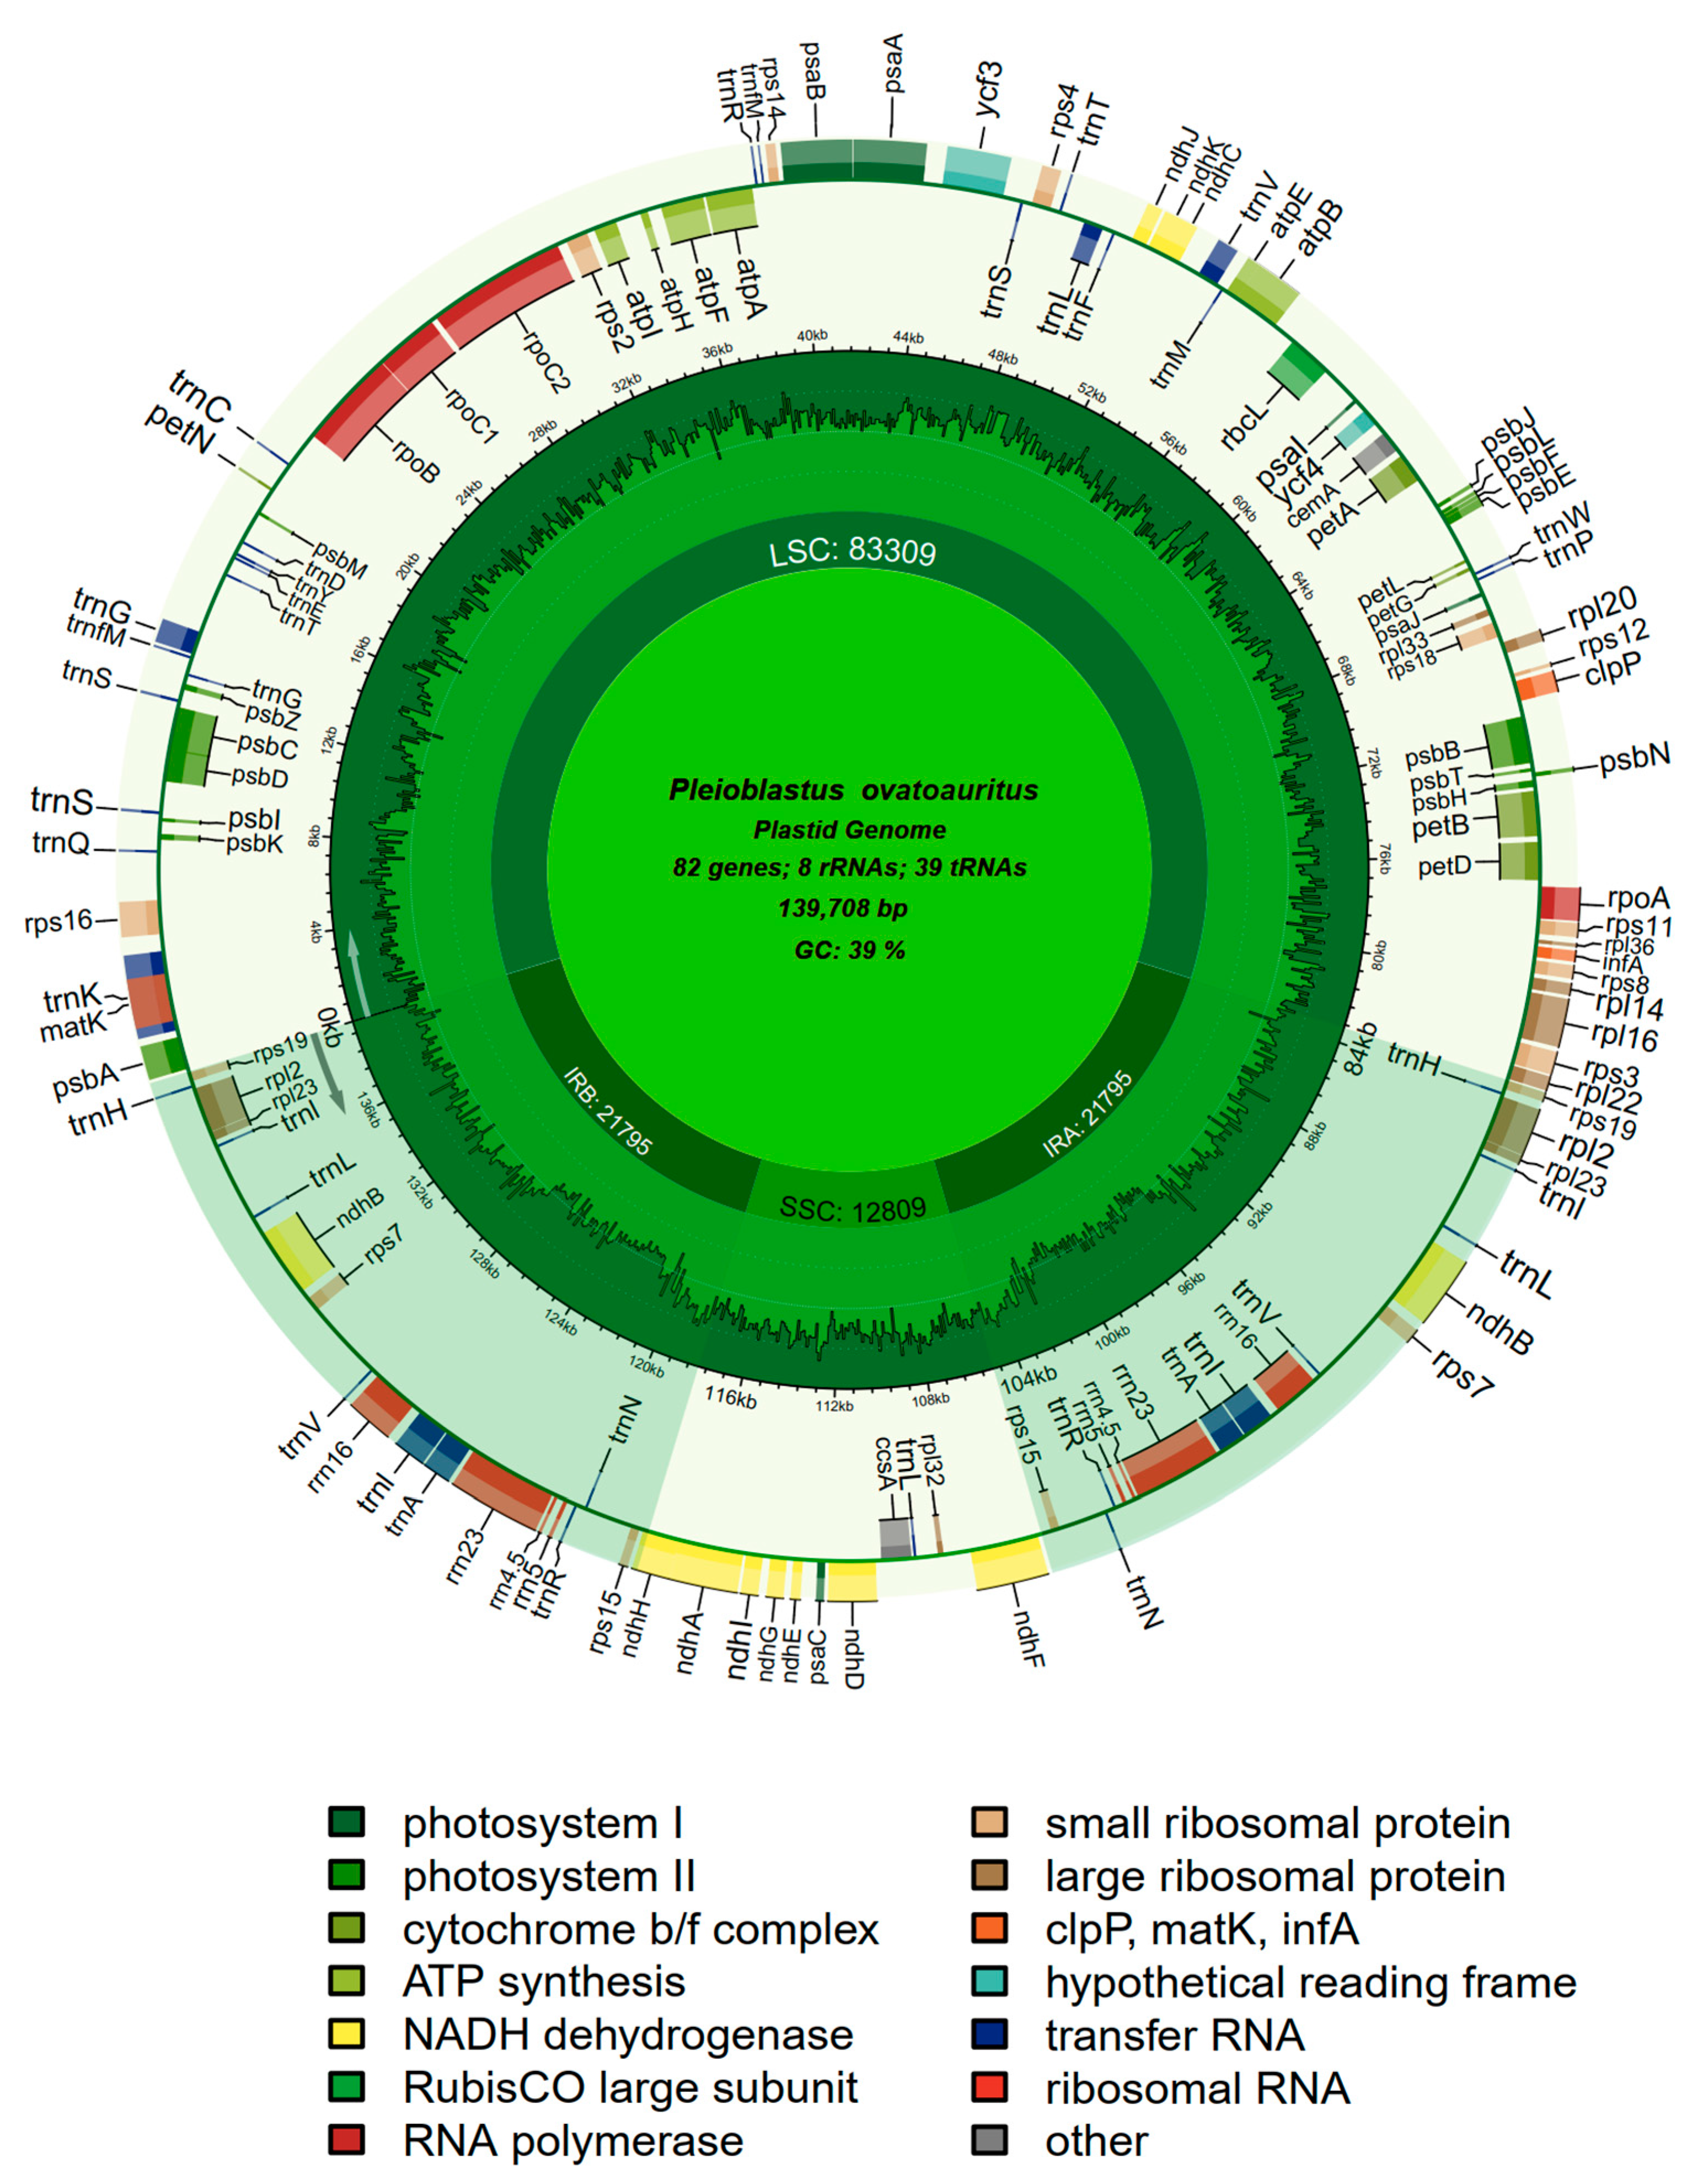
Based on the Illumina Hiseq 2500 platform, raw sequencing data of two directions obtained from Pl. ovatoauritus reach 3174–3209 MB and were loaded to GetOrganelle. Trimming and choosing reads was unnecessary because GetOrganelle would estimate and trim reads autonomously as well as the Kmer value decision and the word-size of the reads. Actually, 30,000,000 reads (15,000,000 + 15,000,000) were used with the word-size of 102 bp. After 10 rounds of extension, three Kmer values were chosen (21, 65 and 105) to estimate the length of cp genome. Additionally, Pl. amarus (Genbankid:NC043892) was selected to provide the seeds. The assembly result reaches 139,708 bp in length and was uploaded to website application Geseq (MPI-MP CHLOROBOX-GeSeq (mpg.de)) for annotation. After manually trimming in Geneious, wrong and extra annotations are corrected. The circular DNA was then visualized (Figure 2). The cp genome and its annotation were uploaded to NCBI. (Genbankid:OP235916).
The plastome genome of Pl. ovatoauritus shares a typical quadripartite structure with other bamboos (i.e., Phyllostachys, Bambusa) that contain one LSC, one SSC, and a pair of IRs (Table 2). The lengths of LSC, SSC, and single IR are 83,309 bp (59.6%), 12,809 bp (9.2%), and 21,795 bp (15.6%), respectively, while length of the gene coding sequences reaches 59,322 bp (42.5%). Furthermore, the GC content of each region comes to 37.0%, 33.4%, 44.2%, and 39.4%. The results above are in line with those found in other species of Pleioblastus [31].
There are 129 genes contained in the cp genome of Pl. ovatoauritus, including 82 protein coding genes, 39 tRNA genes, and 8 rRNA genes (Table 3). Among all the genes, 81 of them are located in LSC, 10 are located in SSC, and 36 are located in IRs. The remaining two genes are rps12 and ndhH; rps12 is a cross-border gene with one part in LSC and the other part in IR region, while ndhH crosses the boundary between the SSC region and the IR region. There are 15 photosystem II genes, 12 NADH dehydrogenase genes, 6 Cytochrome b/f complex genes, 6 ATP synthase genes, 5 photosystem I genes, 1 Rubisco large subunit gene, and 1 C-type cytochrome synthesis gene which participate in photosynthesis. A total of 15 ribosomal proteins genes, 11 ribosomal proteins genes, 4 RNA polymerase genes, 8 rRNA genes, 1 maturase gene, and 39 tRNA genes are involved in self-replication. Additionally, cemA gene encodes the chloroplast envelope membrane protein, clpP gene helps construct ATP-dependent protease, and infA gene is associated with the translational initiation factor. The remaining two genes are ycf3 and ycf4, whose functions are unknown. Notably, gene ycf68, which also belongs to hypothetical genes, appears with an advanced stop codon in its theoretical region in Pl. ovatoauritus, Pl. maculatus, and Pl. triangulate. The unexpected stop codon leads to a half cut of the gene compared to that of Pl. amarus, and we decided to label it as a pseudogene and remove it from the annotation.

3.2. Chloroplast Genome Structure Analysis of Genus Pleioblastus

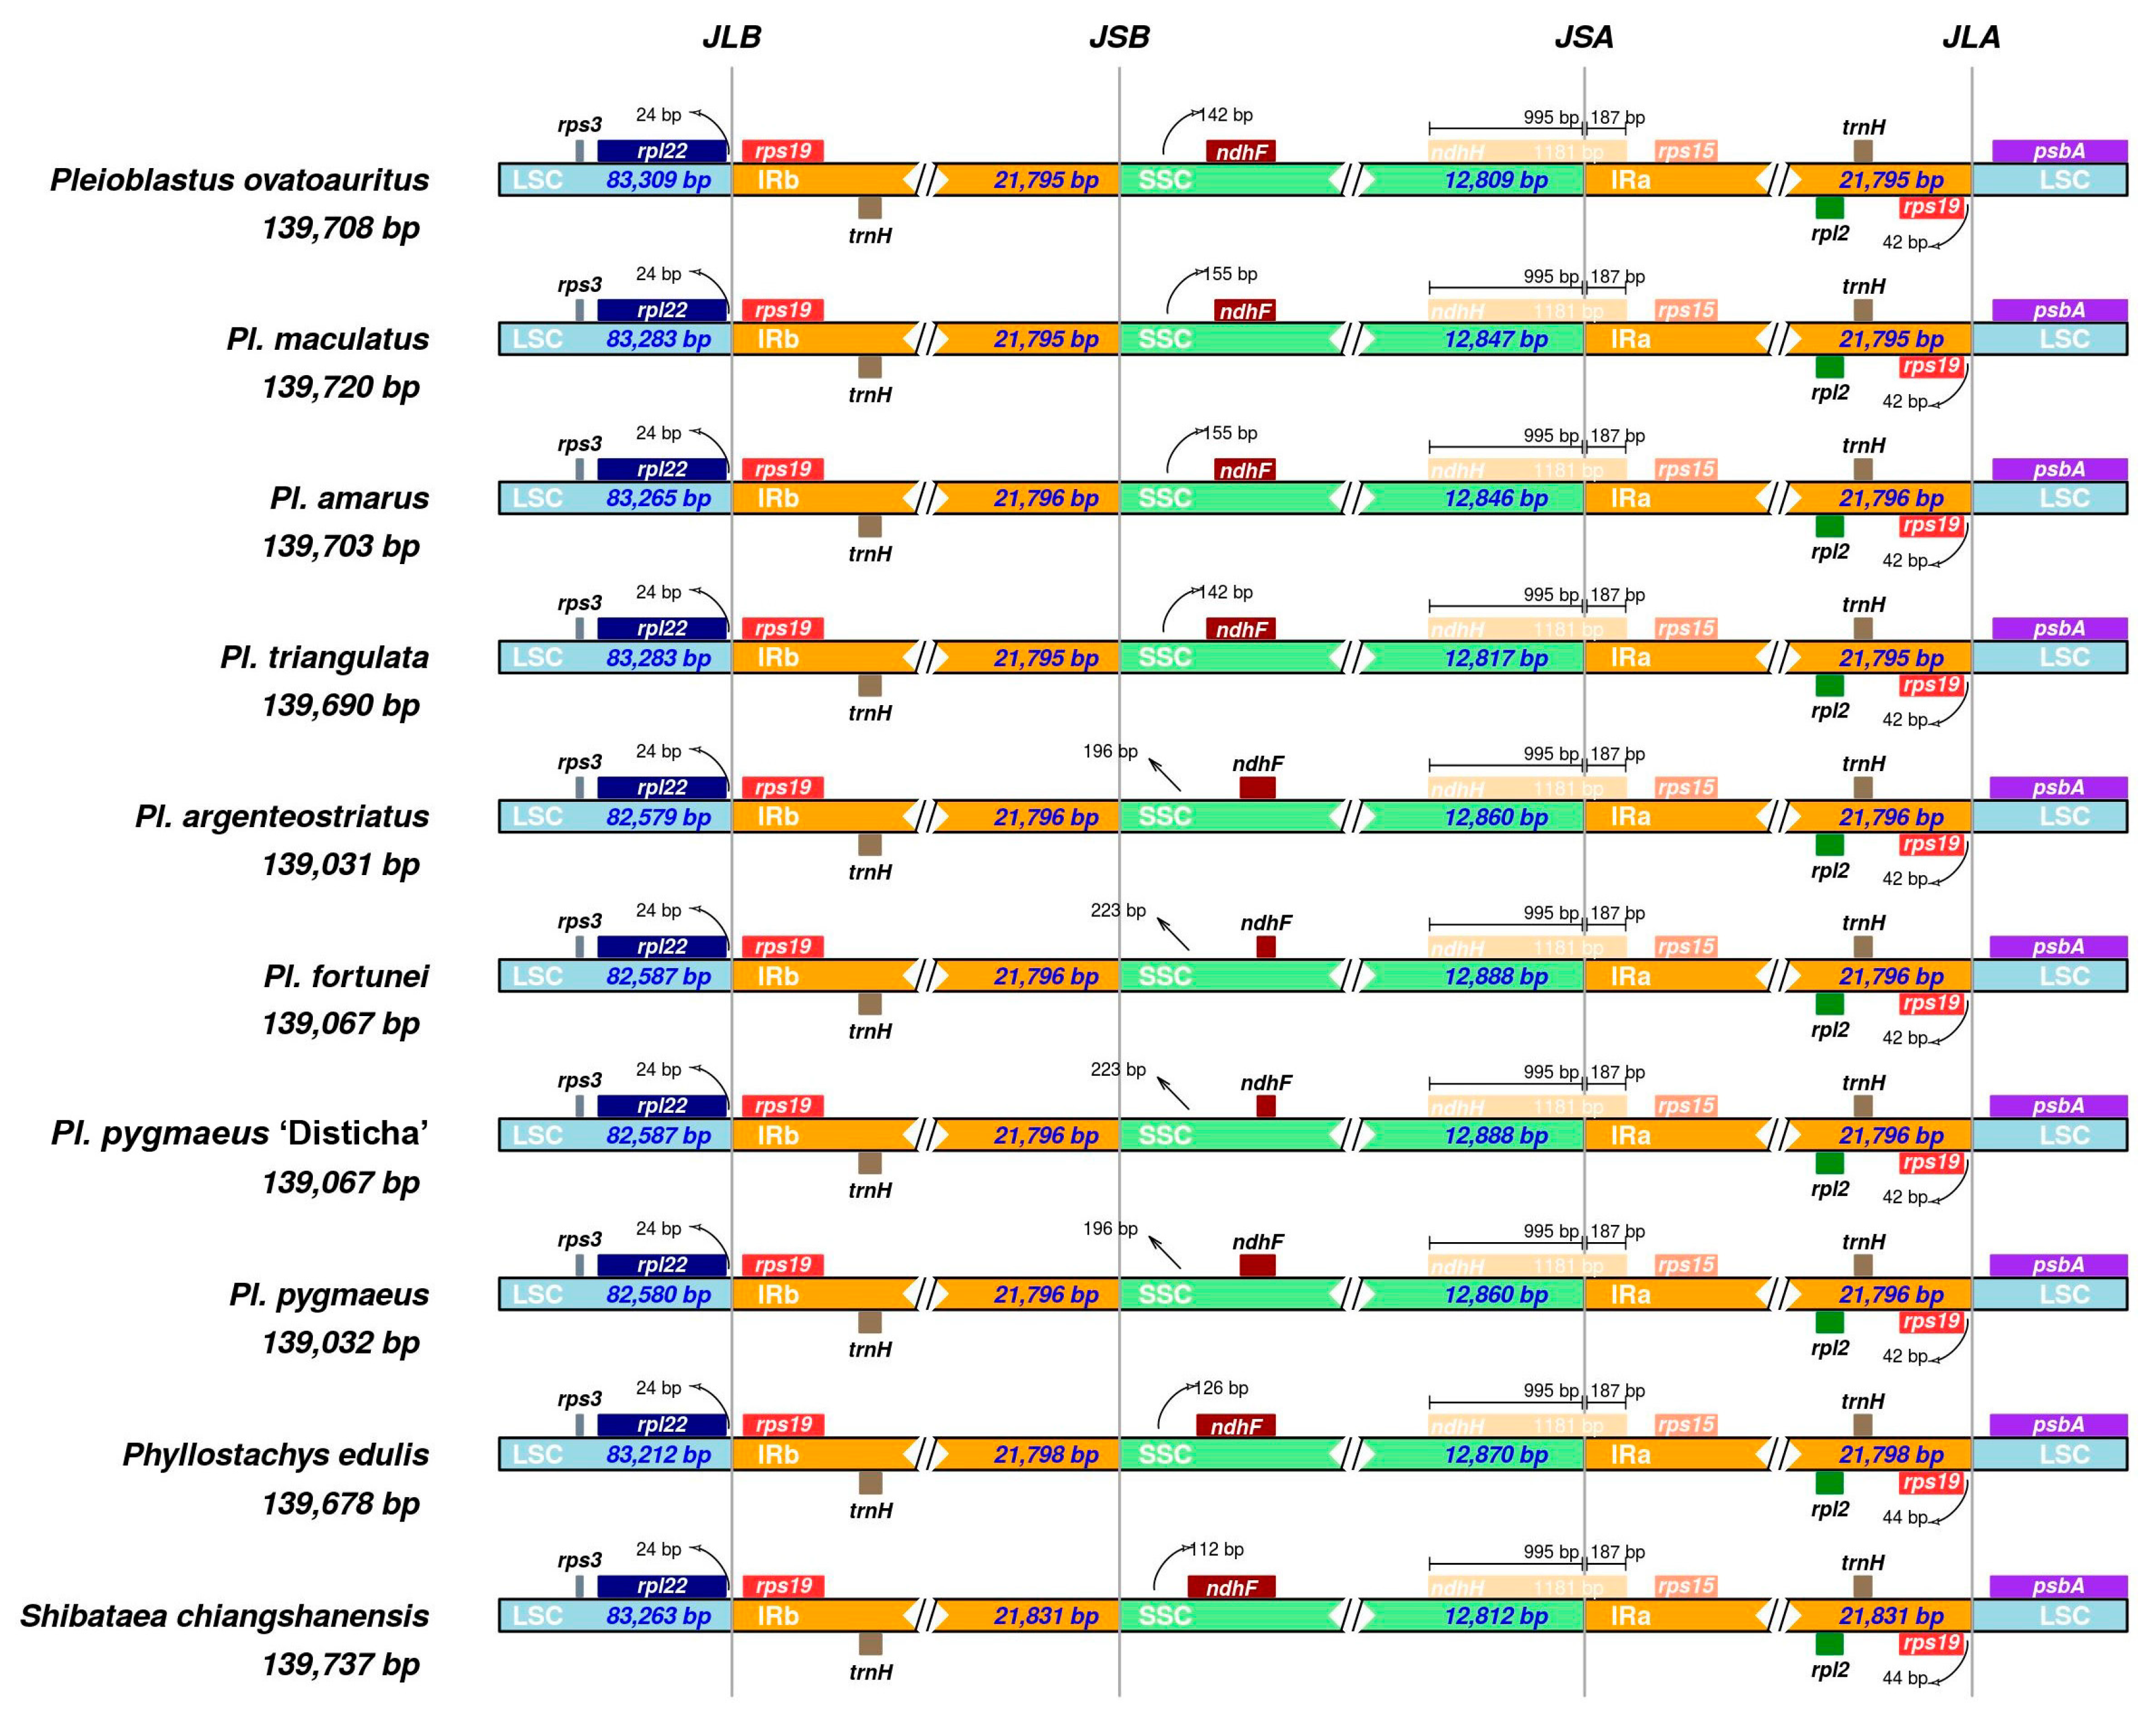
We use the Mavue plugin in Geneious to implement colinearity analysis for the eight species of Pleioblastus, and the result indicated that there is no inversion or reordering in the cp genome of Pl. ovatoauritus, as well as in other Pleioblastus genera. Then, we uploaded genome data to online application IRscope (https://irscope.shinyapps.io/irapp/ (accessed on 20 August 2022)) to compare and analyze the difference of junctions between repeat regions and single copy regions within the eight cp genomes (Figure 3). Though cp genomes have comparatively conversed structure, there were still some variations like extension or contraction in the junction of different sectors. Genes rpl22 in the LSC of eight species are close to the border between IRb and LSC, with the same distance of 24 bp. Gene rps19 in both IR regions have the gap of 42 bp towards the junction. Notably, all the IRa regions in Pleioblastus genus have extended to the gene ndhH at 187 bp. The most significant difference lies in the distance from the end of ndhF to the JLB, where populations from China have shorter distance than group from Japan. Pl. ovatoauritus and Pl. triangulata have a distance of 142 bp to the IRb; Pl. amarus and Pl. maculata have 155 bp. In the Japanese group, the distances increase to 196 bp in Pl. pygmaeus and Pl. argenteostriatus and 233 bp in Pl. fortunei and Pl. pygmaeus ‘Disticha’. Resultingly, the conspicuous difference in the distance between ndhF and JLB corroborates the divergence of two groups to some extent.

3.3. Codon Usage

A total of 82 genes’ coding sequences were involved in the analysis (accD, ycf1, ycf2, ycf15, and ycf68 of some species were excluded for uniformity). We first detected the start codons, which normally appear to be ‘AUG’ (coding Methionine). A total of 80 coding sequences start with the ‘M’ codon, while rp12 starts with ‘I’ codon or ‘T’ codon (AUA or ACG, coding l-isoleucine, or L-Threonine) and rps19 starts with ‘V’ codon (GUG, coding Valine). In the Chinese group, rp12 starts with ‘T’ codon while the Japanese group’s starts with ‘I’ codon. Then, RSCU values were obtained to compare the codon pattern of four genera. Together with RSCU, analysis of optimal codons with specific data are listed in Table 3, some basic statistics are also included. The statistics below indicate that eight Pleioblastus species possess similar codon usage patterns, with only delicate difference (Table 4). pleucine coding codons account for most of the codons up to 10.7% while cysteine coding codons are the least in eight bamboos, taking up only 1.1%. Additionally, the Chinese group tends to have higher GC content in CDS but less protein-coding codons. RSCU values would be important in evolutional analysis because they reflect the changes of the codon usage frequency. The third position of a codon tends to be the first position undergoing changes, and the changes will cause less alternation of the protein it codes. Therefore, we involved the starts of GC3, A3s, T3s, etc. Pl. maculatus and Pl. triangulata have 30 codons compared to others (29 codons). The cause of changes lies in the tiny increase of the number of the codon ‘UCA’ (coding Serine), from 1.00 to 1.01.

3.4. Sequence Divergence and Nucleotide Diversity

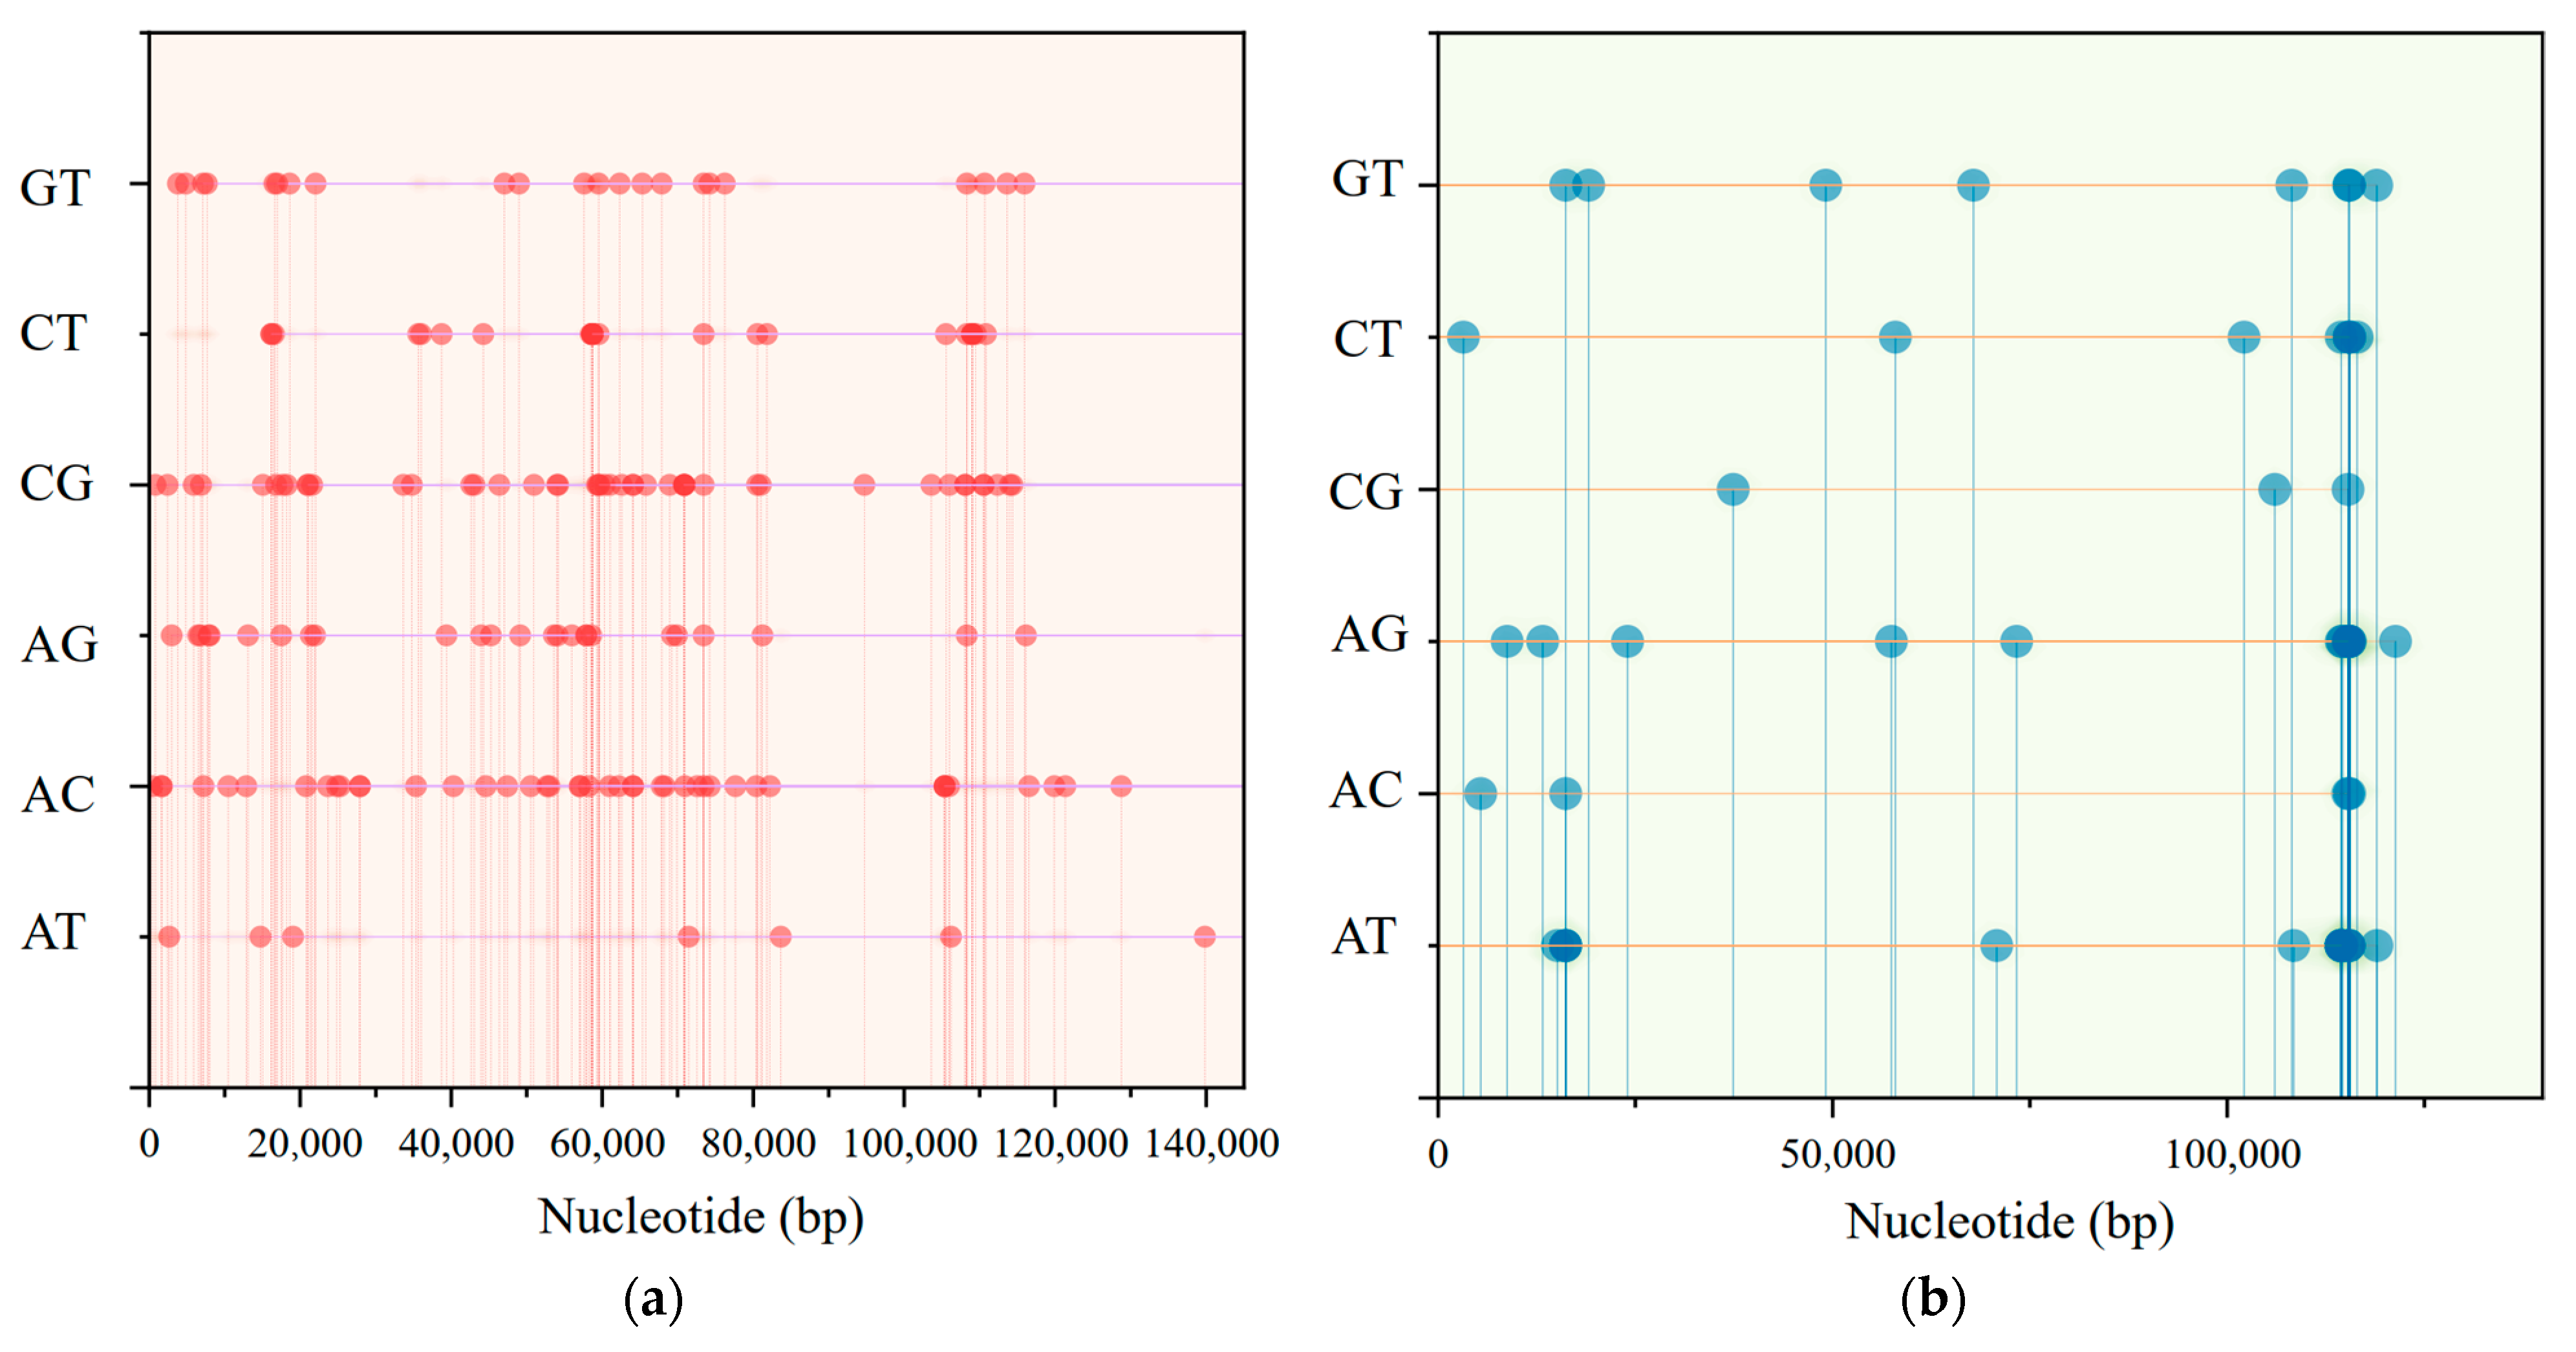
To better understand the sequence similarity among the eight species, we use mVista to visualize these differences (Figure 4a). Using Pl. ovatoauritus as a reference, we located several high variation regions. They are, regions around the start of the LSC, 21 k, 32 k, 54 k, 64 k, 105 k, region from 12 k to 16.5 k and region from 108 k to 114 k. We can easily infer that the majority of variation happens in two single copy regions while IR regions show a highly conserved characteristic. Some variations are shared commonly while some only exist in the Japanese group. Pi value shows the diversity of the sequence; by using the sliding window method (window length: 600 bp; step size: 200 bp), we obtained the Pi values of different regions (Figure 4b). The Pi values range from 0.00042 to 0.00857. A total of six regions’ values are higher than 0.005, and all are located in single copy regions; they are, trnG-trnT, rbcL, clpP-psbB, psbT-psbH, rpl32, and ndhI-ndhA. The ratio of synonymous to nonsynonymous substitutions was calculated to investigate the selecting pressure on nucleotides. We extracted all coding sequences and found that the value of dN/dS reaches 0.565. In the Chinese group, dN/dS reaches 0.613, while in Japanese group, that value decrease to 0.250. To pin down the explicit locations of these polymorphic sites, DNAsp 6.0 was employed. A total of 222 variable sites were detected, including 53 singleton variable sites and 169 parsimony informative sites. Of all singleton variable sites, 19 sites are located in LSC, 30 sites are located in SSC, 3 sites lie in Ira, and 1 in IRb. Parsimony sites appear predominantly in single copy regions, but LSC has many more sites than SSC (134 sites in LSC while 28 sites in SSC). IRa and IRb own four and three sites separately. The major transversion forms of singleton variable sites are A/T (30.2%) and A/G (26.4%), whereas in parsimony variable sites, A/G and C/T take the dominant place, accounting for 25.4% and 27.2%, respectively (Figure 5).

3.5. Phylogenetic Analysis of Genus Pleioblastus spp.

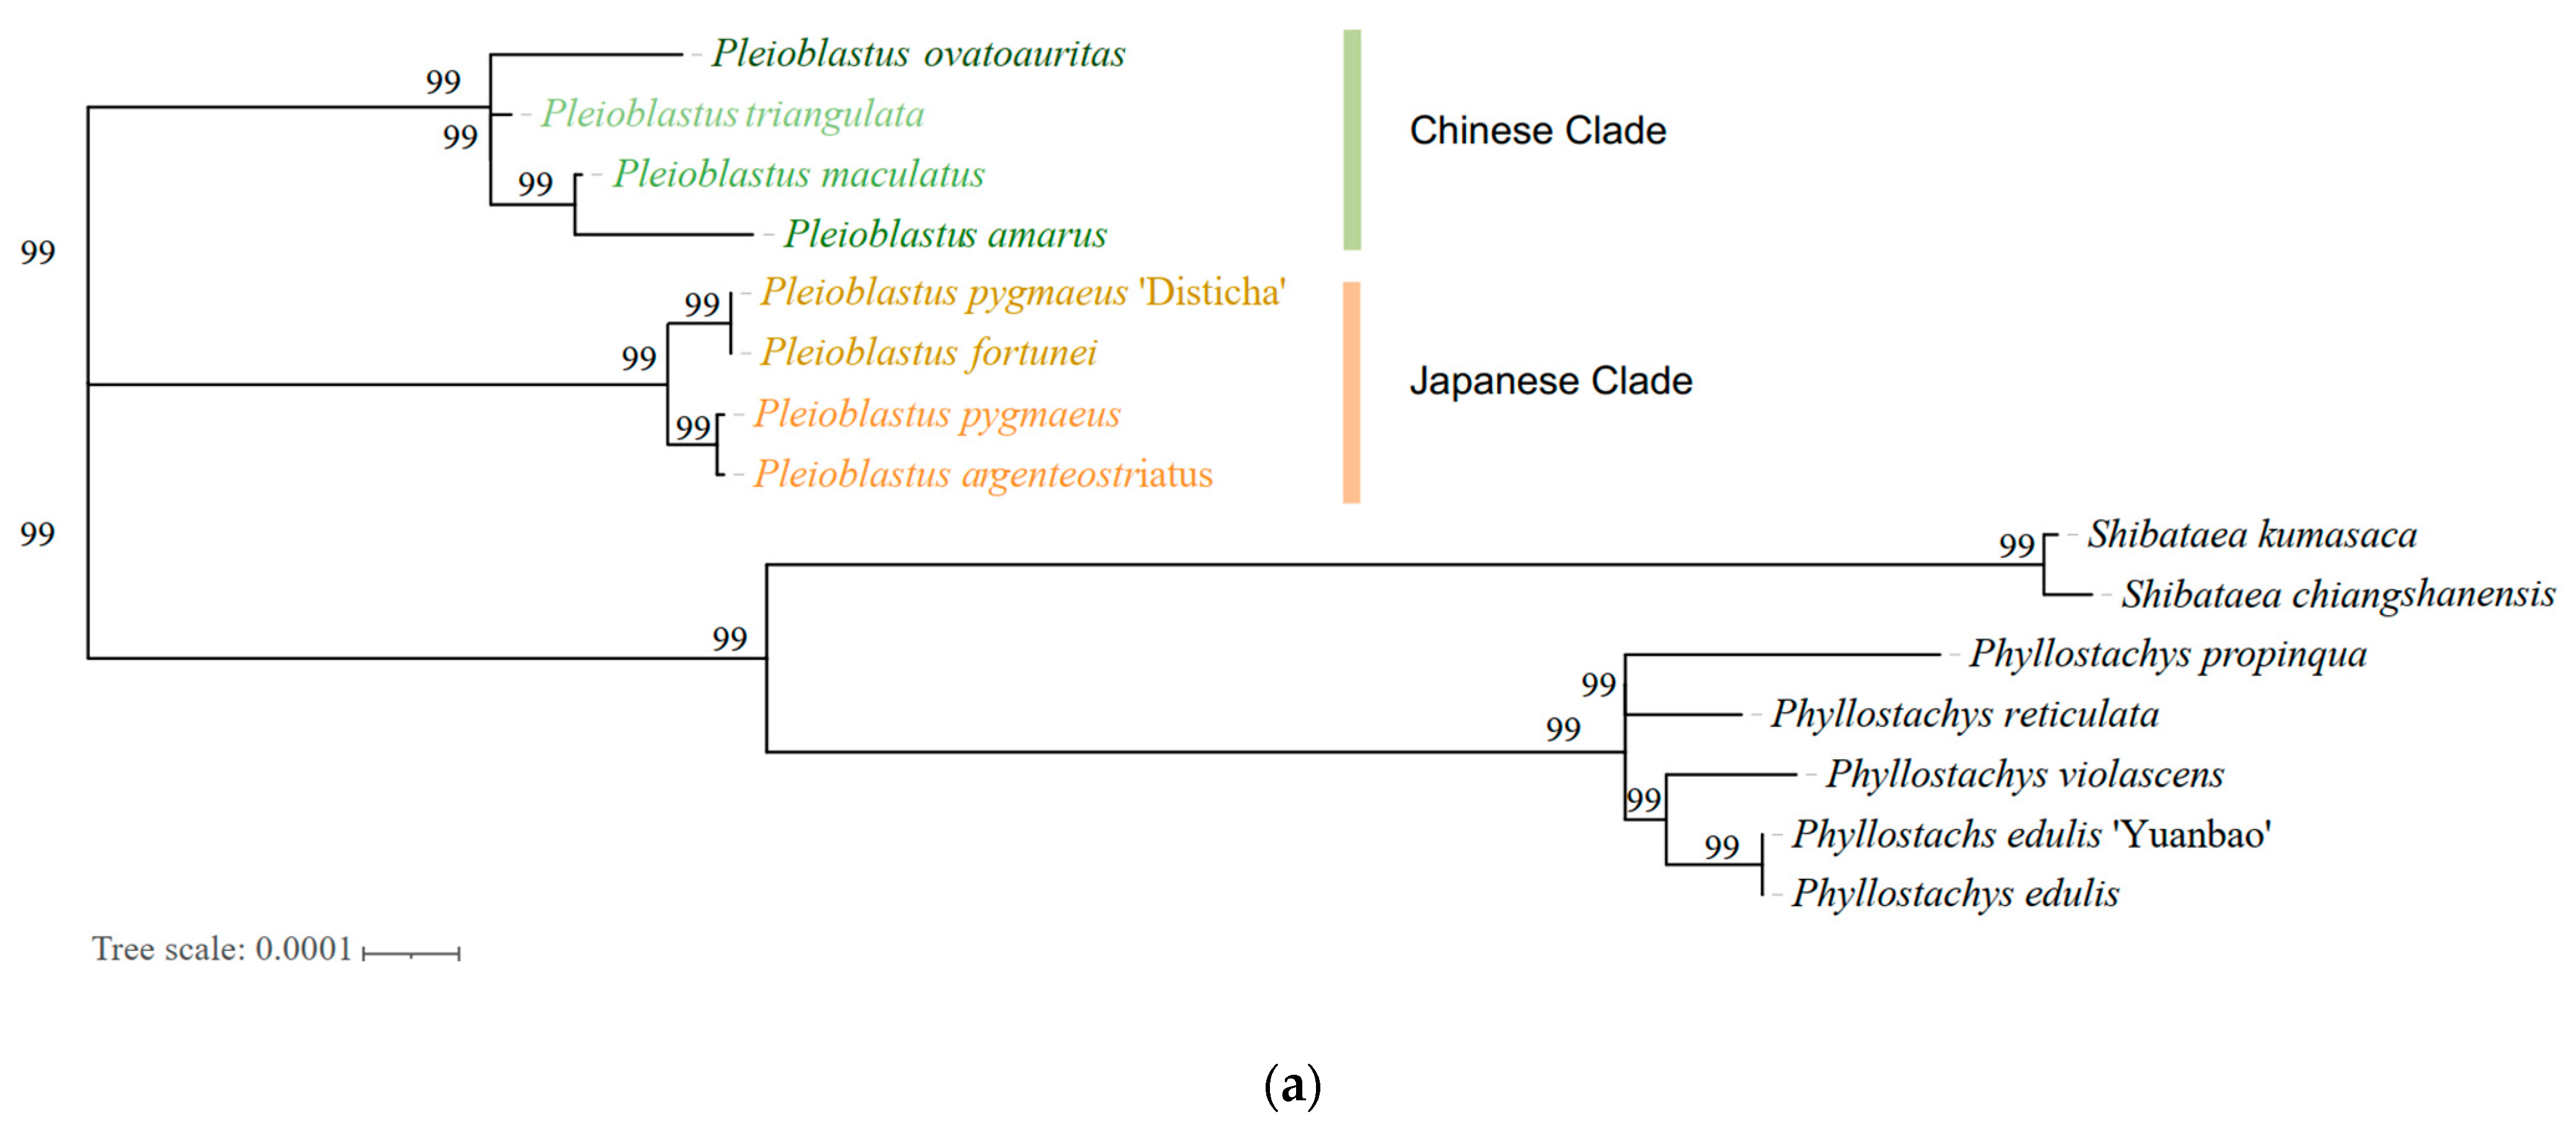
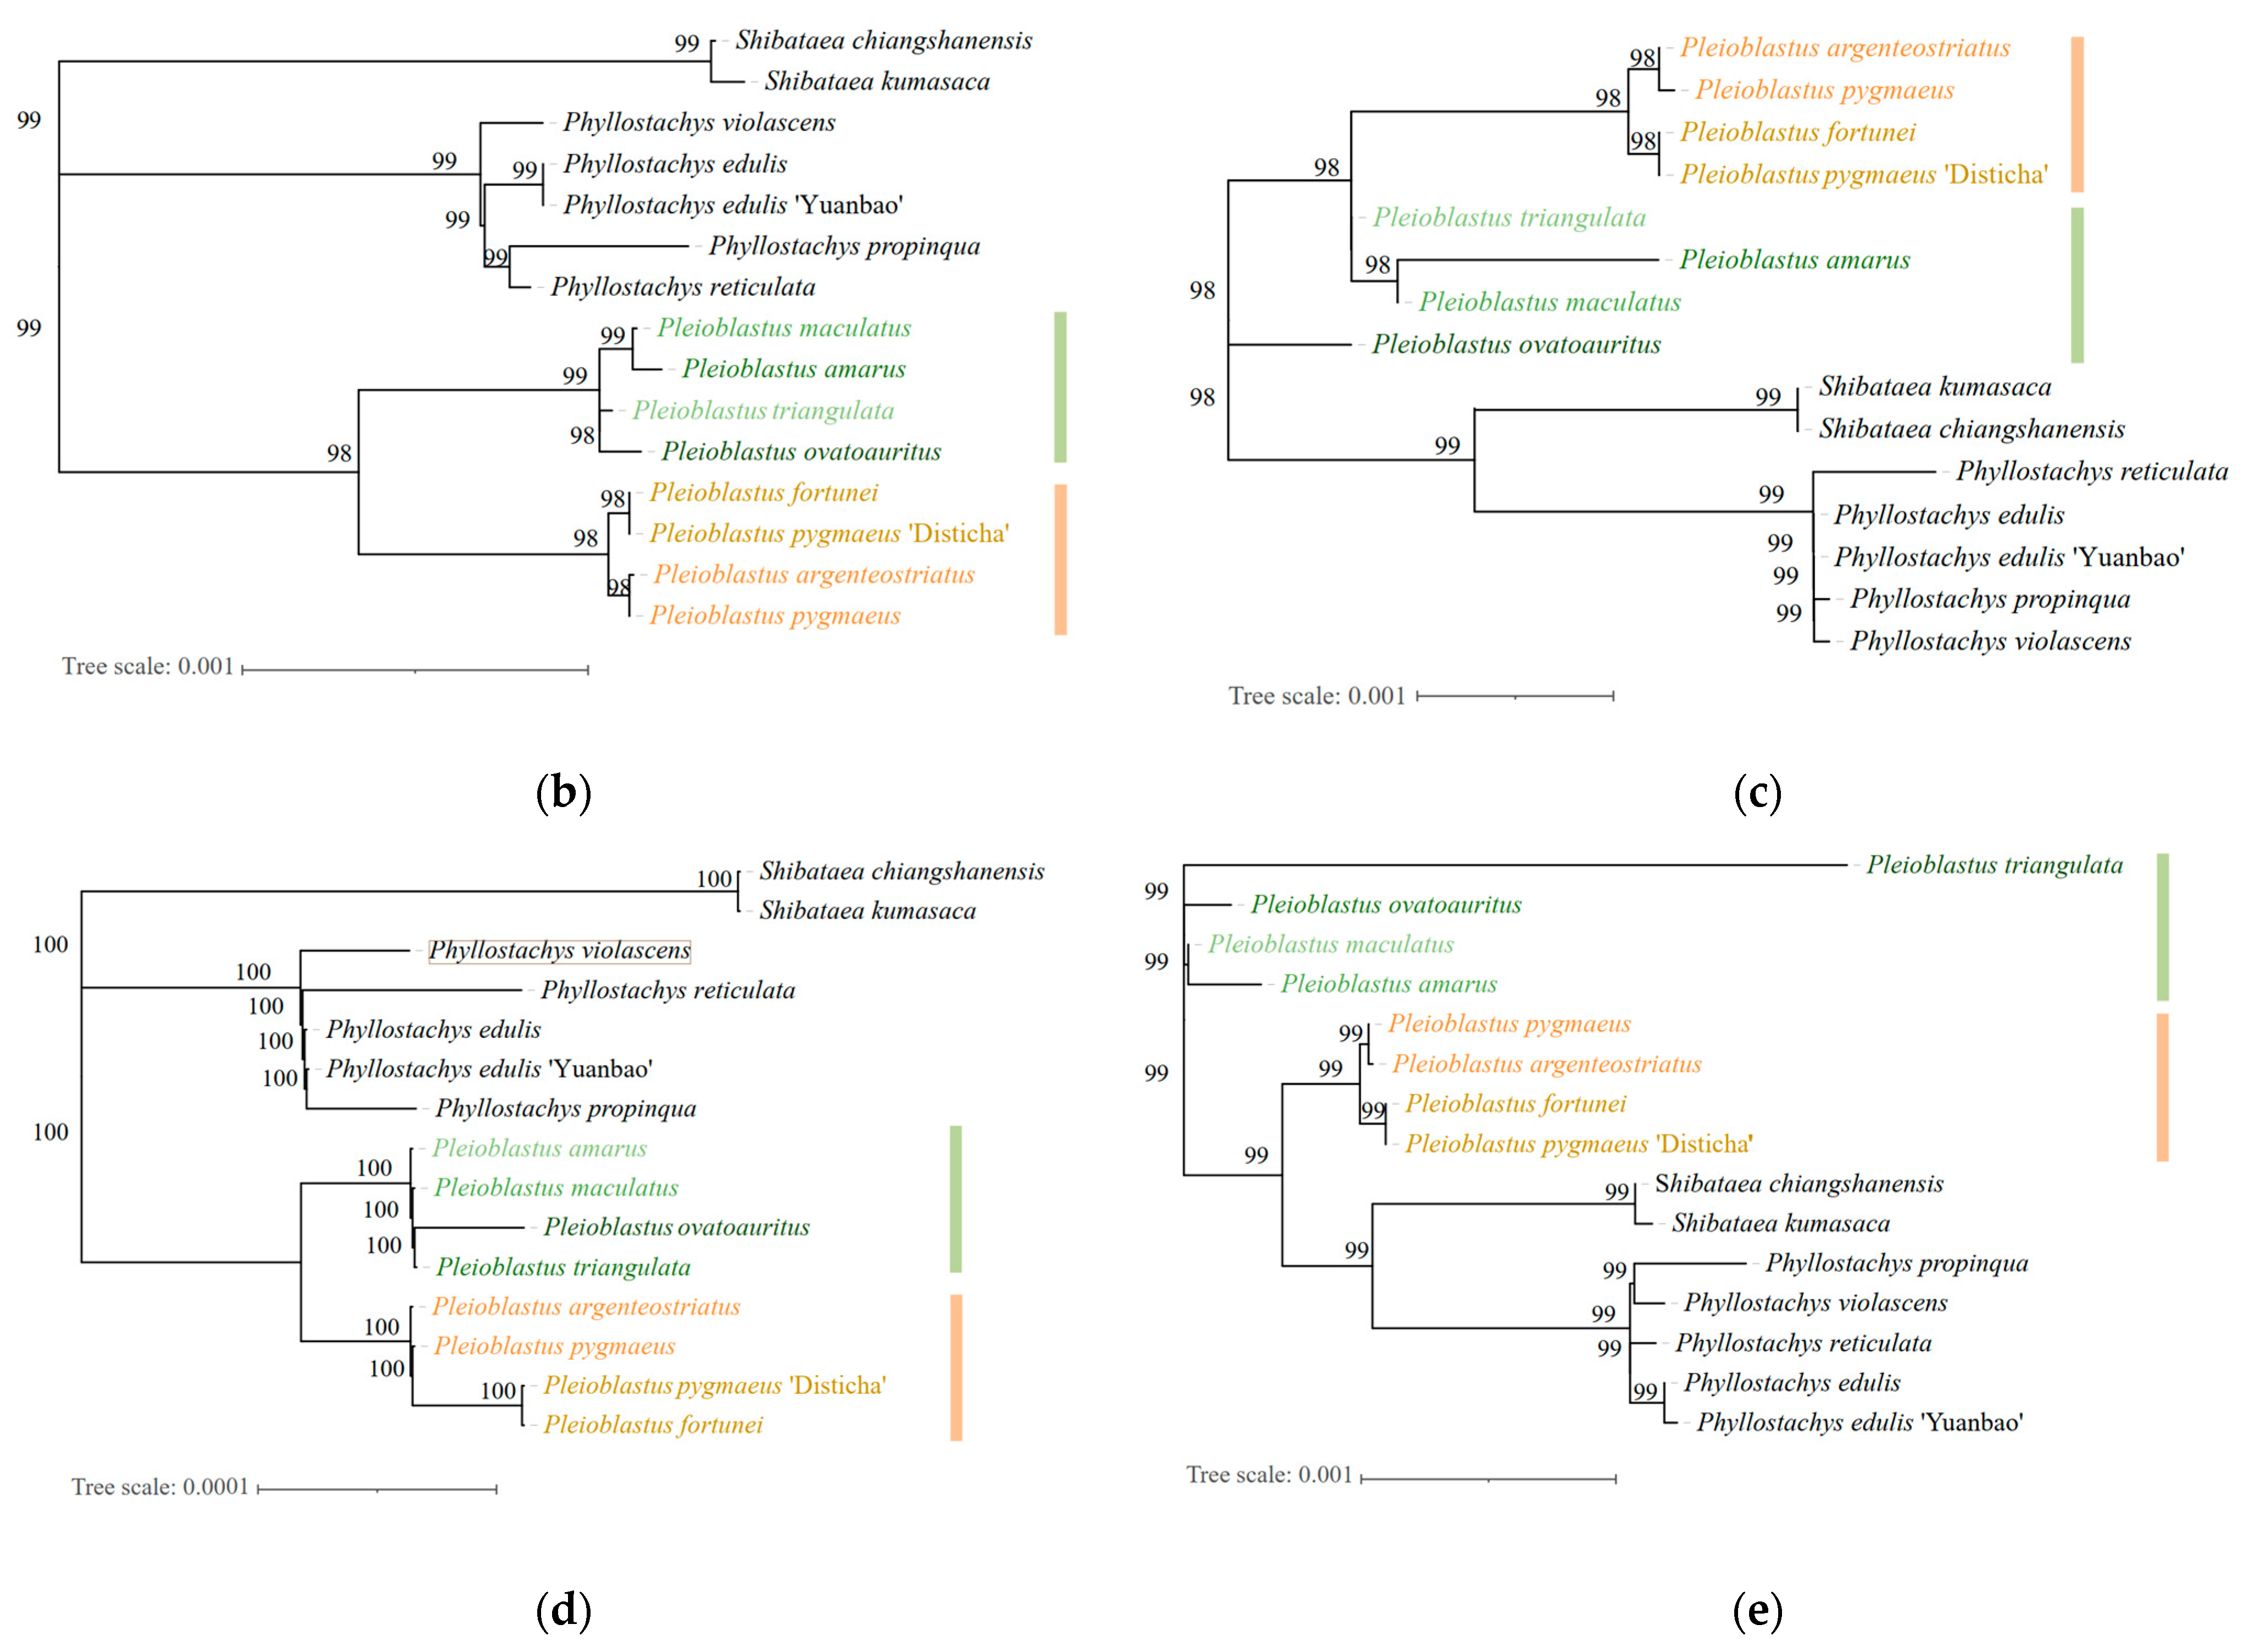
In this study, we use the maximum likelihood method to create the phylogenetic tree for 15 species, the result was obtained after 1000 bootstrap replications. When constructing trees, full sequences, protein coding sequences, LSC sequences, SSC sequences as well as IR sequences were used (Figure 6). The result shows high reliability with all confidence levels higher than 98%. According to the ML trees, Pl. ovatoauritus is clustered into the Chinese group but also separated from three other species. In most of the trees, Pl. ovatoauritus has a closer relationship to Pl. triangulate. Different trees showed similar clustering consequences that Chinese and Japanese group are divided, and that the evolutionary distance is shorter in Pleioblastus compared to other genera.

3.6. SSR Distribution and Primer Design of Genus Pleioblastus

The number and pattern of SSRs varies a lot in different settings. At first, we required the minimum repeat times, reaching 10 for mononucleotide repeats, 6 for dinucleotide repeats, and 5 for the rest. Mono-repeats accounted for all the SSRs in Pleioblastus, and the majority of bases are A/T. In the Japanese group, all four species possess 24 SSRs; 23 of them are composited by A/T bases, 1 is composited by G base, and all are located in the LSC region. In the Chinese group Pl. triangulata has 27 SSRs, while Pl. ovatoauritus, Pl. maculatus, and Pl. amarus have 25, locating in both LSC and SSC regions. In Pl. ovatoauritus, Pl. amarus, and Pl. maculatus, 23 SSRs are contained in LSC and 2 SSRs are contained in SSC. In Pl. triangulate, 26 SSRs are located in LSC and 1 is located in SSC.
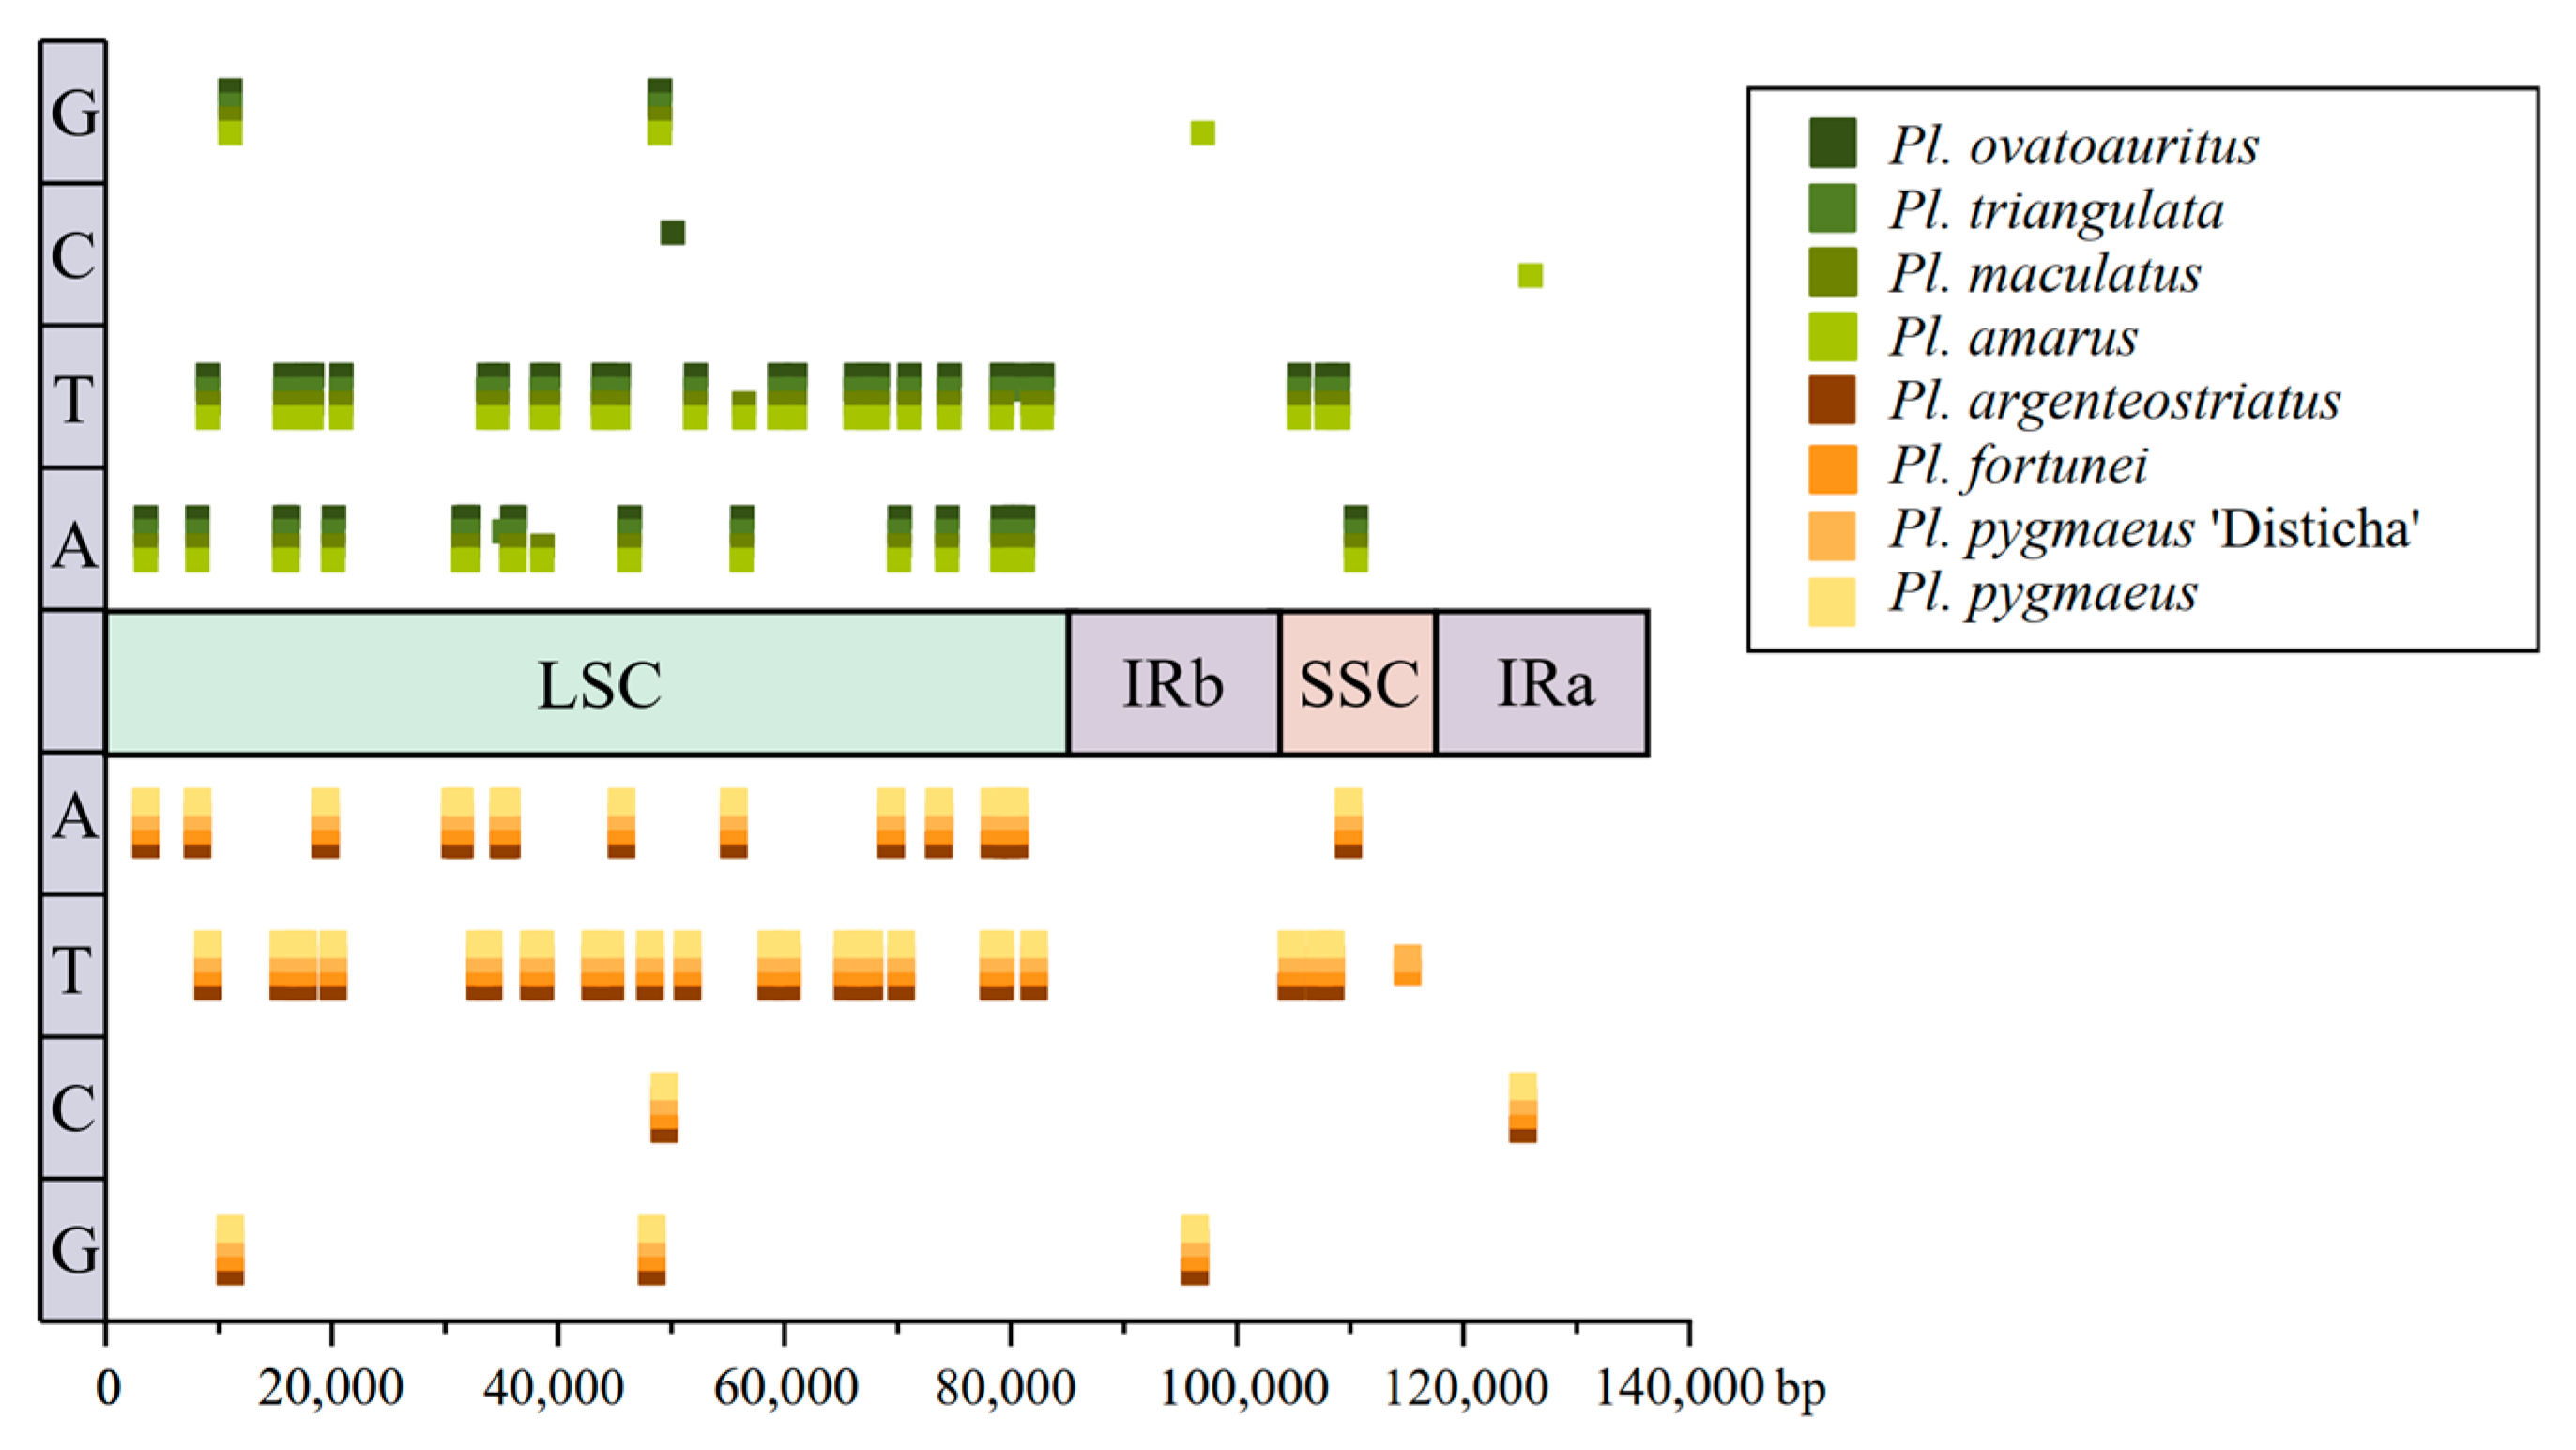
When we changed the parameter with lower repeat requirements (nine for mono-, five for di-, and four for the rest), the number boomed and showed an even distribution (Table 5). A/T bases mono-repeats were still the majority, but more G/C bases mono-repeats appeared. With few variants, most repeats have their counterparts located in eight species (Figure 7). Six species had di-repeats, except for Pl.amarus and Pl.maculatus. All species possessed four trinucleotides repeats in the same location of cp genomes. We designed and developed primers for each SSR and selected nine pairs of high quality (Table A1).

4. Discussion

The chloroplast genome of Pl. ovatoauritus was sequenced in this study, yielding a circular genome of 139,708 base pairs with a quadripartite structure similar to that of other bamboo species, such as Phyllostachys [32]. Comparative analysis of genome structure, codon usage, sequence divergence, and nucleotide polymorphism were implemented together with its Pleioblastus relatives, the results prove that only tiny differences exist among these eight species. This suggests a high level of consistency within the Pleioblastus genus compared to other genera. While some annotations of hypothetical genes vary among authors, genes performing basic functions such as photosynthesis, translation, and transcription show a high level of uniformity in number and length. However, differences between the Chinese group and the Japanese group were observed, primarily involving contractions of the boundary in JLB and variations in the distribution and number of SSRs. Further investigation of specific genome regions and individual nucleotides is needed to better understand these differences.
The invasion of the IRa to the ndhH gene in the SSC region appears to be a widespread phenomenon in bamboo, with a consistent distance of 187 bp. However, the Chinese group’s IRb has invaded more than the Japanese group, with only 142 bp from the JLB to rps19 gene. Although the number of SSRs differs between species, their locations are consistent within their respective groups, with the Chinese group located in SSC and the Japanese group located in LSC. This distinct distribution provides us with an opportunity to design primers to differentiate these species. While we cannot speculate on which group has a higher evolutionary level or separate these two groups based on these small differences, these simple clues illustrate that the two groups have undergone explicitly different evolutionary processes. This makes us confident that we can find more solid evidence at the nucleotide level to distinguish the Chinese and Japanese groups.
Using the application mVista, we were able to visualize the divergence and similarity among the eight species and locate several highly variable regions. The most obvious variance is in the region between trnG-UCC to trnT-GGU, which also showed a high Pi value (over 0.0058). However, this considerable difference is only shared by the Japanese Pleioblastus species. Upon examining the aligned sequence, we found a long gap measuring 192 bp, which accounts for this difference. Another notable variance shared by the Japanese group but not caused by long gaps lies in the region of ndhI-ndhA. This variable region contributes to the second peak of the Pi value, reaching 0.00708, and the region appears with high single nucleotide polymorphism in both singleton variable sites and parsimony sites, as shown in Figure 4. The summit of Pi comes to 0.00857 in the sector around the rbcL gene, while parsimony sites also show great density in this region. However, we could not find any conspicuous variations on the mVista graph. Although some small valleys appear in each species, huge variances together with high Pi values all appear in the four species from Japan. These variances appear with regularity either among the two groups or shared by all eight species, which makes it reasonable to divide the Pleioblastus species into two areas.
The phylogenetic results revealed a close relationship among all the Pleioblastus species used in comparison to other genera. The newly discovered Pl. ovatoauritus is classified in the Chinese group but has a closer evolutionary relationship to Pl. triangulata compared to its morphological relative, Pl. maculatus. More significantly, among all the maximum likelihood trees, the separation between the Chinese group and the Japanese group is conspicuous. Therefore, as more species are reclassified into the genus Pleioblastus, the traditional classification of subgenus or section lacks feasibility. The in-group topological structures of the two clades show high uniformity in all trees. In the Chinese group, Pl. amarus and Pl. maculatus have a closer relationship, while Pl. ovatoauritus is more distant. In the Japanese group, Pl. argenteostriatus and Pl. pygmaeus, and Pl. fortunei and Pl. pygmaeus ‘Disticha’ are clustered, respectively.
In previous studies, based on a four-region cpDNA dataset, Triplett classified Pl. maculatus into the Sinicae subclade, while other Japanese Pleioblastus species (Pl. gramineus, Pl. pygmaeus, Pl. chino, etc.) were classified into the Medake subclade [33]. Zeng added more data for Chinese species (Pl. intermedius, Pl. juxianensis, Pl. amarus, etc.), but these extra Chinese species did not group with either Pl. maculatus or the Japanese species; instead, they were classified into the Phyllostachys clade [8]. Zhang concluded that these Chinese species belong to the East China subclade and found them branched into three groups [34]. There seem to be tough problems in resolving the relationships of Pleioblastus due to the lack of cp or nuclear genome datasets, both in China and in Japan. At the time of writing this article, we were able to access a total of eight complete cp genomes of Pleioblastus, which enabled us to analyze the relationships from a more complex perspective. Researchers working on the phylogeny and genomes of Arundinarieae had found that Pleioblastus was not a monophyletic genus, and its distribution in phylograms failed to display the concept of subgenera as depicted in Flora Reipublicae Popularis Sinicae [35]. Our results provided evident genomic proof of the accuracy of the dichotomy made for the flora of China.

5. Conclusions

The chloroplast genome of Pl. ovatoauritus contains 129 genes, including 82 protein-coding genes, 8 rRNAs genes, and 39 tRNAs genes. The codon usage patterns and SSRs sites are highly similar among Pleioblastus species. Single nucleotide polymorphism and sequence divergence was found to appear frequently in the single copy region. Six high variable regions (trnG-trnT, rbcL, clpP-psbB, psbT-psbH, rpl32, and ndhI-ndhA) were located. The cluster results indicated that Pl. ovatoauritus has a closer relationship to Pl. triangulata and could be classified in the Chinese group. What is more, the explicit split of the Chinese and Japanese group of trees supported the theory that Chinese and Japanese Pleioblastus species should be divided into different branches and that the subgenera concept in Pleioblastus should be corrected. In the end, we designed nine generic primers of SSRs for Pleioblastus with the hope of promoting the germplasm investigation and interspecific relationship analysis of the Pleioblastus genus.

Author Contributions

Q.G. designed and conducted the research; W.P. conducted data analysis and manuscript writing; B.W. and Z.S. conducted experiments and data analysis. All authors have read and agreed to the published version of the manuscript.

Funding

This research was funded by the National Natural Science Foundation of China (31971648) and the Talent Introduction Project Study of Nanjing Forestry University on Ginkgo biloba and other important tree germplasm resources (GXL2018001).

Data Availability Statement

Data presented in this study are available in the article.

Acknowledgments

The authors acknowledge Hu Yaping and Jing Wenxuan from Nanjing Forestry University for software aids, critical reading, and editing of the manuscript.

Conflicts of Interest

The authors declare no conflict of interest.

Appendix A

Table A1. Primer designed for Pleioblastus based on 8 species.
PrimerUnitForward 5′ → 3′Reverse 5′ → 3′
PP1(T) 9ACCGGTCATGTTTCTTGGATAGTCTATTCTCTCTCCTACAACTCT
PP2(T) 9GGCGAACGAATAATCATTAAGTCCTAGATCCGAACACTTGCCTCG
PP3(T) 9TTCTACGACTCTTTTCCACACTATCCAACTGATCCCCACGTC
PP4TAAGAAATCGCAACTCCTTTCCGTCCATGACTCCTATTTCAAAGCCT
PP5TTCTCCCCAATAGAGCTTAGAAGTTCTGGCTGTCTCGCAATACC
PP6ACGTGGCTCTAGTATGAATCTAAGGTTGGCTCATCTGTCTTTCTTTCTT
PP7ATTGTGCGTAGAAGAGATTGTGGTGCTCGAAATGGTTGTGCTCG
PP8TACCCGATCCGATAGTACCCGTCGTCTTTTGTCATTCTTTGCTCCT
PP9TACGTCTTTTGTCATTCTTTGCTCCTCCCGATCCGATAGTACCCGT

References

  1. Zhong, Y.P.; Wu, C.M.; Hu, Y.P.; Mi, Y.Y.; Yu, Z.Y.; Cao, F.L. Updating for the World Checklist of Bamboos. Subtrop. Plant Sci. 2019, 48, 176–180. [Google Scholar]
  2. Vorontsova, M.S.; Clark, L.G.; Dransfield, J.; Govaerts, R.; Baker, W.J. World Checklist of Bamboos and Rattans; Royal Botanic Gardens: Kew, UK, 2016; ISBN 978-92-95098-99-2. [Google Scholar]
  3. Triplett, J.K. Phylogenetic Relationships among the Temperate Bamboos (Poaceae: Bambusoideae) with an Emphasis on Arundinaria and Allies. Ph.D. Thesis, Iowa State University, Iowa, IA, USA, 2008. [Google Scholar]
  4. Guo, C.; Ma, P.F.; Yang, G.Q.; Ye, X.Y.; Guo, Y.; Liu, J.X.; Liu, Y.L.; Eaton, D.A.R.; Guo, Z.H.; Li, D.Z. Parallel DdRAD and Genome Skimming Analyses Reveal a Radiative and Reticulate Evolutionary History of the Temperate Bamboos. Syst. Biol. 2021, 70, 756–773. [Google Scholar] [CrossRef] [PubMed]
  5. Jones, E.; Chu, W.C.; Ayele, M.; Ho, J.; Bruggeman, E.; Yourstone, K.; Rafalski, A.; Smith, O.S.; McMullen, M.D.; Bezawada, C.; et al. Development of Single Nucleotide Polymorphism (SNP) Markers for Use in Commercial Maize (Zea Mays L.) Germplasm. Mol. Breed. 2009, 24, 165–176. [Google Scholar] [CrossRef]
  6. Li, D.Z.; Wang, Z.P.; Zhu, Z.D.; Xia, N.H.; Jia, L.Z.; Guo, Z.H.; Yang, G.Y.; Stapleton, C.M.A. Bambuseae (Poaceae). In Flora of China; Wu, Z.Y., Raven, P.H., Hong, D.Y., Eds.; Science Press: Beijing, China, 2006; Volume 22, p. 7. [Google Scholar]
  7. Keng, P.C.; Wang, Z.P. Gramineae-Subfam Bambusoideae. In Flora Reipublicae Popularis Sinicae; Science Press: Beijing, China, 1996; Volume 9, p. 1. [Google Scholar]
  8. Zeng, C.-X.; Zhang, Y.-X.; Triplett, J.K.; Yang, J.-B.; Li, D.-Z. Large Multi-Locus Plastid Phylogeny of the Tribe Arundinarieae (Poaceae: Bambusoideae) Reveals Ten Major Lineages and Low Rate of Molecular Divergence. Mol. Phylogenet. Evol. 2010, 56, 821–839. [Google Scholar] [CrossRef] [PubMed]
  9. Yue, J.-J.; Zhang, W.-Y.; Yuan, J.-L. New Taxa and New Records of Bambusoideae (Poaceae) in Zhejiang Province, China. J. Bamboo Res. 2018, 37, 71–74. [Google Scholar]
  10. Sugiura, M. The Chloroplast Genome; Springer: Berlin/Heidelberg, Germany; Dordrecht, The Netherlands, 1992. [Google Scholar]
  11. Dobrogojski, J.; Adamiec, M.; Luciński, R. The chloroplast genome: A review. Acta Physiol. Plant. 2020, 42, 98. [Google Scholar] [CrossRef]
  12. Niu, Z.Y.; Cai, Z.Y.; Liao, C.L.; Xia, N.H. Chimonobambusa Sangzhiensis (Poaceae, Bambusoideae), a New Combination Supported by Morphological and Molecular Evidence. Phytokeys 2022, 195, 127–141. [Google Scholar] [CrossRef]
  13. Ma, P.F.; Zhang, Y.X.; Zeng, C.X.; Guo, Z.H.; Li, D.Z. Chloroplast Phylogenomic Analyses Resolve Deep-Level Relationships of an Intractable Bamboo Tribe Arundinarieae (Poaceae). Syst. Biol. 2014, 63, 933–950. [Google Scholar] [CrossRef]
  14. Ouyang, F.; Hu, J.; Wang, J.; Ling, J.; Wang, Z.; Wang, N.; Ma, J.; Zhang, H.; Mao, J.F.; Wang, J. Complete Plastome Sequences of Picea asperata and P. crassifolia and Comparative Analyses with P. abies and P. morrisonicola. Genome 2019, 62, 317–328. [Google Scholar] [CrossRef]
  15. Pei, J.; Wang, Y.; Zhuo, J.; Gao, H.; Vasupalli, N.; Hou, D.; Lin, X. Complete Chloroplast Genome Features of Dendrocalamusfarinosus and Its Comparison and Evolutionary Analysis with Other Bambusoideae Species. Genes 2022, 13, 1519. [Google Scholar] [CrossRef]
  16. Liu, X.; Liu, L.; Li, L.; Yue, J. The Complete Chloroplast Genome of Phyllostachys Edulis f. Tubiformis (Bambusoideae): A Highly Appreciated Type of Ornamental Bamboo in China. Mitochondrial DNA Part B 2022, 7, 185–187. [Google Scholar] [CrossRef] [PubMed]
  17. Yue, J.J.; Ma, J.X.; Yuan, J.L. Phyllostachys edulis ‘YuanBao’—A Bamboo Cultivar. J. Bamboo Res. 2022, 41, 1–4. [Google Scholar]
  18. Jin, J.J.; Yu, W.B.; Yang, J.B.; Song, Y.; de Pamphilis, C.W.; Yi, T.S.; Li, D.Z. GetOrganelle: A Fast and Versatile Toolkit for Accurate de Novo Assembly of Organelle Genomes. Genome Biol. 2020, 21, 241. [Google Scholar] [CrossRef]
  19. Darling, A.C.E.; Mau, B.; Blattner, F.R.; Perna, N.T. Mauve: Multiple Alignment of Conserved Genomic Sequence with Rearrangements. Genome Res. 2004, 14, 1394–1403. [Google Scholar] [CrossRef] [PubMed]
  20. Kearse, M.; Moir, R.; Wilson, A.; Stones-Havas, S.; Cheung, M.; Sturrock, S.; Buxton, S.; Cooper, A.; Markowitz, S.; Duran, C.; et al. Geneious Basic: An integrated and extendable desktop software platform for the organization and analysis of sequence data. Bioinformatics 2012, 28, 1647–1649. [Google Scholar] [CrossRef]
  21. Zheng, S.; Poczai, P.; Hyvönen, J.; Tang, J.; Amiryousefi, A. Chloroplot: An Online Program for the Versatile Plotting of Organelle Genomes. Front. Genet. 2020, 11, 576124. [Google Scholar] [CrossRef]
  22. Amiryousefi, A.; Hyvönen, J.; Poczai, P. IRscope: An Online Program to Visualize the Junction Sites of Chloroplast Genomes. Bioinformatics 2018, 34, 3030–3031. [Google Scholar] [CrossRef] [PubMed]
  23. Katoh, K.; Standley, D.M. MAFFT Multiple Sequence Alignment Software Version 7: Improvements in Performance and Usability. Mol. Biol. Evol. 2013, 30, 772–780. [Google Scholar] [CrossRef]
  24. Rozas, J.; Ferrer-Mata, A.; Sánchez-DelBarrio, J.C.; Guirao-Rico, S.; Librado, P.; Ramos-Onsins, S.E.; Sánchez-Gracia, A. DnaSP 6: DNA Sequence Polymorphism Analysis of Large Data Sets. Mol. Biol. Evol. 2017, 34, 3299–3302. [Google Scholar] [CrossRef]
  25. Frazer, K.A.; Pachter, L.; Poliakov, A.; Rubin, E.M.; Dubchak, I. VISTA: Computational Tools for Comparative Genomics. Nucleic Acids Res. 2004, 32, W273–W279. [Google Scholar] [CrossRef]
  26. Peden, J.F. Analysis of Codon Usage. Ph.D. Thesis, University of Nottingham, Nottingham, UK, 2000; pp. 73–74. [Google Scholar]
  27. Tamura, K.; Stecher, G.; Kumar, S. MEGA11: Molecular Evolutionary Genetics Analysis Version 11. Mol. Biol. Evol. 2021, 38, 3022–3027. [Google Scholar] [CrossRef] [PubMed]
  28. Letunic, I.; Peer, B. Interactive Tree Of Life (iTOL) v5: An online tool for phylogenetic tree display and annotation. Nucleic Acids Res. 2021, 49, W293–W296. [Google Scholar] [CrossRef] [PubMed]
  29. Beier, S.; Thiel, T.; Münch, T.; Scholz, U.; Mascher, M. MISA-Web: A Web Server for Microsatellite Prediction. Bioinformatics 2017, 33, 2583–2585. [Google Scholar] [CrossRef] [PubMed]
  30. Untergasser, A.; Cutcutache, I.; Koressaar, T.; Ye, J.; Faircloth, B.C.; Remm, M.; Rozen, S.G. Primer3—New Capabilities and Interfaces. Nucleic Acids Res. 2012, 40, e115. [Google Scholar] [CrossRef] [PubMed]
  31. Zhou, B.; Yao, W.; Guo, C.; Bian, L.; Ding, Y.; Lin, S. Chloroplast Genome Variation and Phylogenetic Analyses of Seven Dwarf Ornamental Bamboo Species. Forests 2022, 13, 1671. [Google Scholar] [CrossRef]
  32. Hu, Y.P.; Zhou, J.; Yu, Z.Y.; Li, J.J.; Xu, M.Y.; Guo, Q.R. The Complete Chloroplast Genome of Phyllostachys Heteroclada f. Solida (Poaceae). Mitochondrial DNA Part B 2021, 6, 566–567. [Google Scholar] [CrossRef]
  33. Triplett, J.K.; Clark, L.G. Phylogeny of the Temperate Bamboos (Poaceae: Bambusoideae: Bambuseae) with an Emphasis on Arundinaria and Allies. Syst. Bot. 2010, 35, 102–120. [Google Scholar] [CrossRef]
  34. Zhang, Y.X.; Zeng, C.X.; Li, D.Z. Complex Evolution in Arundinarieae (Poaceae: Bambusoideae): Incongruence between Plastid and Nuclear GBSSI Gene Phylogenies. Mol. Phylogenet. Evol. 2012, 63, 777–797. [Google Scholar] [CrossRef]
  35. Guo, C. Phylogenomics of Arundinareae (Poaceae: Bambusoideae). Ph.D. Thesis, Unversity of Chinese Academy of Sciences, Kunming Institute of Botany, Kunming, China, 2019. [Google Scholar]
Figure 1. Base of culm sheaths on Pl. ovatoauritus and Pl. maculatus. (a) Naked base of the culm sheath on Pl. ovatoauritus. (b) Setose ring in the base of culm sheath on Pl. maculatus.
Forests 14 01051 g001
Figure 2. Gene map of Pl. ovatoauritus. The outer circle shows positions of genes and the blocks with different colors represent different kinds of gene. The inner circle shows the tetrad structure of the genome; the dark green shadow bar shows the GC content.
Forests 14 01051 g002
Figure 3. Chloroplast genome boundary comparative analysis of eight species by IRscope. JLB/JLA means the junction between LSC and IRb/Ira, and JSB/JSA means the junction between SSC and IRb/IRa.
Forests 14 01051 g003
Figure 4. (a) Sequence divergence analysis using mVista, choosing the Shuffle-LAGAN mode. Blocks in indigo represent exons; red blocks represent none-coding sectors; valleys represent divergences and similarity ranges from 50% to 100%. (b) Nucleotide diversity (Pi value) of Pleioblastus genus.
Forests 14 01051 g004
Figure 5. Distribution of transversion and transition sites of Pleioblastus genus. Horizontal lines represent the base components (i.e., A/T means at a single SNP site, the bases in different species are A or T). (a) Red points show the distribution of singleton variable sites; (b) blue points show the distribution of parsimony variable sites.
Forests 14 01051 g005
Figure 6. The trees with the highest log likelihood are shown based on full-sequence (a), LSC sequences (b), SSC sequences (c), IR sequences (d), and protein coding sequences (e). The percentage of trees in which the associated taxa clustered together is shown before the branches. Species in the warm color represent the Japanese group, while species in the cold color represent the Chinese group.
Forests 14 01051 g006aForests 14 01051 g006b
Figure 7. Illustration and comparation of mono-SSRs sites in the Chinese group (green) and the Japanese group (orange).
Forests 14 01051 g007
Table 1. The genera used in comparative analysis or phylogenetic analysis.
GenusTaxonAccession
Ingroup
PleioblastusPleioblastus ovatoauritus T.H.WenOP235916
Pl. maculatus (McClure) C.D.Chu and C.S.ChaoJX513424
Pl. amarus (Keng) Keng f.NC043892
Pl. ortuneate (Hsueh and T.P.Yi) N.H.Xia, Y.H.Tong and Z.Y.NiuOK323193
Pl. argenteostriatus (Regel) NakaiOP036432
Pl. ortune (Van Houtte) NakaiOP036433
Pl. pygmaeus ‘Disticha’OP036434
Pl. pygmaeus (Miq.) NakaiOP036435
Outgroup
PhyllostachysPhyllostachys edulis (Carriere) J. HouzeauMW007170
Ph. Edulis ‘Yuanbao’MW874473
Ph. Reticulata (Ruprecht) K. KochMN537808
Ph. Propinqua McClureJN415113
Ph. Violascens (Carrière) Riviere and C. RivièreOP612331
ShibataeaShibataea chiangshanensis T. W. WenNC036826
S. kumasaca (Zoll. Ex Steud.) Makino ex NakaiKU523578
Table 2. Chloroplast genome information of eight Pleioblastus species.
TaxonPl. ovatoauritusPl. maculataPl. amarusPl. triangulataPl. argenteostriatusPl. fortuneiPl. pygmaeus
‘Disticha’
Pl. pygmaeus
Accession No.OP235916JX513424NC043892OK323193OP036432OP036433OP036434OP036435
Plastome legnth139,708139,720139,703139,690139,031139,067139,067139,032
LSC83,30983,28383,26583,28382,57982,58782,58782,580
SSC12,80912,84712,84612,81712,86012,88812,88812,860
IR (single)21,79521,79521,79621,79521,79621,79621,79621,796
GC content %38.938.938.938.938.938.938.938.9
No. of CDS8282828282828282
No. of tRNAs3939393630303030
No. of rRNAs88888888
Table 3. All genes in different groups and systems in Pl. ovatoauritus.
SystemGroupName
PhotosynthesisSubunits of ATP synthaseatpA, atpB, atpE, atpF, atpH, atpI
Subunits of NADH-dehydrogenasendhA, ndhBa, ndhC, ndhD, ndhE, ndhF, ndhG, ndhH, ndhI, ndhJ, ndhK
Subunits of cytochrome b/f complexpetA, petB, petD, petG, petL, petN
Subunits of photosystem IpsaA, psaB, psaC, psaI, psaJ
Subunits of photosystem IIpsbA, psbB, psbC, psbD, psbE, psbF, psbH, psbI, psbJ, psbK, psbL, psbM, psbN, psbT, psbZ
Subunit of rubiscorbcL
Transcription and translationLarge subunit of ribosomerpl2 a,rpl14, rpl16,rpl20, rpl22, rpl23 a, rpl32, rpl33, rpl36
DNA dependent RNA polymeraserpoA, rpoB, rpoC1, rpoC2
Small subunit of ribosomal proteinsrps2, rps3, rps4, rps7 a, rps8, rps11, rps12, rps14, rps15 a, rps16, rps18, rps19 a
rRNA genesrrn4.5 a, rrn5 a, rrn16 a, rrn23 a
tRNA genestrnA-UGC a, trnC-GCA, trnD-GUC, trnE-UUC, trnF-GAA, trnfM-CAU a, trnG-GCC, trnG-UCC, trnH-GUG a,trnI-CAU a, trnIGAU a, trnK-UUU, trnL-CAA a, trnL-UAA, trnL-UAG, trnM-CAU, trnN-GUU a, trnP-GGG, trnQ-UUG,trnR-ACG a, trnR-UCU, trnS-GCU, trnS-GGA, trnS-UGA, trnT-GGU, trnT-UGU, trnV-GAC a, trnV-UAC, trnW-CCA, trnY-GUA
Other genesc-type cytochrome synthesis geneccsA
Envelope membrane protein cemA
ATP-dependent proteaseclpP
Maturase matK
Hypothetical chloroplast reading frames ycf3, ycf4
Translational initiation factorinfA
a”——gene with two copies.
Table 4. Codon usage situation, preferred codons, and optimal codons of Pleioblastus genus.
GenusPl. ovatoauritusPl. amarusPl. maculataPl. triangulataPl. argenteostriatusPl. fortuneiPl. pygmaeus ‘Disticha’Pl. pygmaeus
GC content of CDS (%)39.539.539.539.539.439.439.439.4
Codon preference at 3rd positionT (45.3%)T (45.3%)T (45.3%)T (45.3%)T (45.3%)T (45.3%)T (45.3%)T (45.3%)
Total AA19,69519,69519,69519,69519,70519,70519,70519,705
Most preferred stop codonUAAUAAUAAUAAUAAUAAUAAUAA
Most frequent AALeuLeuLeuLeuLeuLeuLeuLeu
Least frequent AACysCysCysCysCysCysCysCys
Parameter3rd BaseNumber of Codon (TER excluded)
RSCU > 1A/U/C/G2929303029292929
A/U 2727282827272727
G/C22222222
A1111121211111111
U1616161616161616
G11111111
C11111111
OptimalA/U/C/G2020202020202020
A/U 1818181818181818
G/C22222222
A77777777
U1111111111111111
G22222222
C00000000
Table 5. Number of different types in SSRs 8 Pleioblastus spp.
Motif LengthBasePl. ovatoauritusPl. triangulataPl. maculataPl. amarusPl. argenteostriatusPl. fortuneiPl. pygmaeus ‘Disticha’Pl. pygmaeus
Mono-repeatsA2020202018181818
T2929292928292928
G32233333
C10012222
Total5351515351525251
Di-repeats5 TA22002222
5 AT11001111
5 TC11001111
Total44004444
Tri-repeats4 AAT11111111
4 TAT11111111
4 TCT11111111
Total33333333
Tetra-repeats4 GTAG11111111
Disclaimer/Publisher’s Note: The statements, opinions and data contained in all publications are solely those of the individual author(s) and contributor(s) and not of MDPI and/or the editor(s). MDPI and/or the editor(s) disclaim responsibility for any injury to people or property resulting from any ideas, methods, instructions or products referred to in the content.