Article

Identification, Classification and Expression Analysis of the CesA Gene Family from Pinus massoniana

State Key Laboratory of Tree Genetics and Breeding, Key Laboratory of Forestry Genetics & Biotechnology of Ministry of Education, Co-Innovation Center for Sustainable Forestry in Southern China, Nanjing Forestry University, Nanjing 210037, China
*
Author to whom correspondence should be addressed.
Forests 2023, 14(5), 1035; https://doi.org/10.3390/f14051035
Submission received: 28 March 2023 / Revised: 12 May 2023 / Accepted: 15 May 2023 / Published: 17 May 2023
(This article belongs to the Section Genetics and Molecular Biology)

Abstract

:
Cellulose synthase (CESA) is a key enzyme in the synthesis of cellulose, which plays an important role in cell wall construction and plant growth and development. In this study, seven CesA genes of P. massoniana were identified by searching the transcriptome data. Bioinformatics analysis showed that the putative CESA proteins were composed of 984–1101 amino acids, each containing the typical motifs of CESA proteins. Phylogenetic analysis showed that Transcript4609, Tran-script2643 and Transcript1263 were clustered into three groups with proteins related to regulating secondary wall synthesis, while Transcript691, Transcript1283, Transcript418 and Transcript556 were categorized into three clades with those associated with the formation of the primary cell walls. RT-qPCR analysis showed that the CesA genes were differentially expressed in different tissues, and most of the genes were induced by different abiotic stress and hormones. Transcript4609, Tran-script2643 and Transcript1263 were mainly expressed in the xylem and could respond to drought and salt stress induced by ABA, MeJA, ETH and SA hormones, indicating that these three CesA genes may play an important role in the response to abiotic stress in P. massoniana. This study revealed the possible biochemical and physiological functions of the CesA gene in P. massoniana, which can provide a basis for further exploration of the function of the CesA gene in cell wall formation and the response to external stress.

1. Introduction

Cellulose is the most widely distributed and abundant polysaccharide in nature, accounting for more than 50% of the carbon content of plants [1]. As the main component of the plant cell wall, the synthesis and directional deposition of cellulose play an important role in plant growth, development and stress resistance. Cellulose is a linear glucan consisting of D-glucopyranose linked by β-1,4 glycosidic bonds [2]. In higher plants, cellulose is a biomolecule synthesized by the cellulose synthase complex (CSC) in the plasma membrane [3]. The CSC is a rosette-like complex composed of at least 18 cellulose synthase subunits, which are assembled in the Golgi apparatus and then transported to the plasma membrane through vesicles to catalyze the synthesis of cellulose [1]. In higher plants, the cellulose synthase superfamily includes cellulose synthase (CesA) and cellulose synthase-like (Csl) gene families, both belonging to the glycosyl transferase-2 (GT2) family [4]. The first CesA was identified from cotton fiber in 1996 [5]. In recent years, many CesA genes have been identified in higher plant species, for example, Arabidopsis thaliana [6], Oryza sativa [7], Zea mays [8] and Populus trichocharpa [9].
Structurally, the CESA proteins contain the following common characteristics, the RING-type zinc finger domain, transmembrane domains, class-specific regions (CSRs) and conserved regions (CRs) [10]. The zinc finger structure participates in the interaction between different CESA subunits and its homodimerization plays a crucial role in determining the functional properties of the CesA genes [10,11]. The sequences of CSRs are highly variable among the members of the CesA genes family, whereas they are highly conserved among CesA homologous genes in different species [12]. In A. thaliana, the conserved structures of the C-terminus of CESA proteins include three conserved aspartic acid (D) residues, a highly conserved QXXRW sequence and six transmembrane regions (Q: glutamic acid, R: arginine, W: tryptophan) [13]. The three D residues are near each other and are close to the conserved QXXRW structure to thus form a functional domain with catalytic glycosyl transfer activity [13]. The first two D residues are coordinated to the uridine diphosphate (UDP) of glucose, while the third D residue might act as the catalytic base. The QXXRW motif is responsible for interacting with cellulose acceptor substrates [14].
The CesA genes are divided into two groups in higher plants, one group participates in primary cell wall biosynthesis and the other in secondary cell wall biosynthesis. In A. thaliana, AtCesA10 is probably a pseudogene, and AtCesA1, AtCesA3 and AtCesA6 form CSCs that are associated with the synthesis of the primary cell wall. The AtCesA2, AtCesA5 and AtCesA9 are the homologs of AtCesA6, and these genes are functionally redundant with each other. However, AtCesA4, AtCesA7 and AtCesA8 are the important parts of the CSCs when secondary cell walls are deposited [15,16]. Furthermore, when plants are exposed to external stress, the cell wall is the first line of defense, and cellulose, as its major part, plays an important role in maintaining the shape of cells and resisting different stresses [14,17]. An earlier study has shown that mutant plants lacking CesA6 or CSI1 exhibit a higher sensitivity to salt stress [18]. In mutants of the AtCesA8 gene, the contents of abscisic acid, proline and soluble sugar increased, which enhanced the tolerance to drought and osmotic stress of plants [19].
Pinus massoniana is an important rapid-growth timber species in southern China, with wide distribution, strong adaptability, high productivity and high comprehensive utilization [20]. The wood of P. massoniana is not only widely used as a building and bridge material for its good coefficient, but is also considered a high-quality raw material for the paper and fiber industry, owing to its high cellulose content and slender fiber cells [21]. However, very little has been reported on cellulose synthesis and cellulose synthase in this important coniferous species. In this study, we identified seven CesA genes based on transcriptomics data and performed phylogenetic and bioinformatics analyses to classify the CesA genes and clarified their structural characteristics. Then, quantitative real-time polymerase chain reaction (RT-qPCR) analysis was used to investigate the expression patterns of CesA genes in different tissues of P. massoniana. Due to the influence of the Greenhouse Effect around the world, the average surface temperature will continue to increase. Although P. massoniana itself has high drought resistance, its growth is threatened by drought and other stresses [22]. Therefore, we also compared and analyzed the expression patterns of -CesA genes under drought stress, salt stress and four hormone treatments (ABA, ETH, MeJA and SA) to better understand the biological function of CesA genes in the abiotic stress response of P. massoniana.

2. Materials and Methods

2.1. Plant Materials

The two-year-old P. massoniana seedlings were cultured in nutritious soil (peat: perlite: vermiculite, 3:1:1 (v/v)) under conditions of 25 °C and 16 h/8 h light and dark cycle. The eight representative tissues or organs included shoot-tip (T), young needle (YN), mature needle (MN), young stem (YS), mature stem (MS), phloem (P), xylem (X) and roots (R). Materials were collected for tissue-specific expression analysis. Hormone treatments were carried out by spraying the needles of selected seedlings independently with 100 μM abscisic acid (ABA), 50 μM ethionine (ETH), 10 mM jasmonic acid (MeJA) and 1 mM salicylic acid (SA). The 200 mM NaCl solution and 15% polyethylene glycol (PEG6000) solution were watered into the soil to induce osmotic stress to the plants [23,24]. The needle samples were collected from each treated seedling at 0 h, 3 h, 6 h, 12 h and 24 h after stimulation, and untreated needle samples at 0 h as a control group. The collected samples were immediately frozen in liquid nitrogen and stored at −80 °C for subsequent RNA extraction. All treatments were carried out in three biological replicates and three technical replicates. The seeds of Nicotiana benthamiana stored at 4 °C for two weeks were sown in nutritious soil under the condition of 25 °C and a 14 h light/10 h dark photoperiod, and the seedlings can be used for transient transformation after about five weeks.

2.2. Identification of CesA Genes in P. massoniana

To identify members of the CesA gene family in P. massoniana, PF03552 (Cellulose_synt) and PF14569 (zf-UDP) of the Hidden Markov Model were downloaded from Pfam (http://pfam.xfam.org/, accessed on 27 July 2022). Transcriptome data for P. massoniana were derived from the determined CO2 stress transcriptome [25], young branch transcriptome (SRA accession: PRJNA655997), drought stress transcriptome (SRA accession: PRJNA595650) and pine wood nematode inoculation transcriptome (SRA accession: PRJNA660087) [20]. The HMMER was used to search for the CESA protein of P. massoniana from four transcriptomes with a threshold E-value < 10−5. After using SMART (http://smart.embl-heidelberg.de/, accessed on 29 November 2022) and CD Search in NCBI (https://www.ncbi.nlm.nih.gov/Structure/cdd/wrpsb.cgi, accessed on 29 November 2022) to predict domains of candidate CESA proteins, we removed the sequences that did not contain two typical domains (Cellulose_synt and zf-UDP) of the CESA proteins. Finally, protein sequences with complete domains were selected as PmCESA proteins after eliminating the repetitive sequences with more than 97% similarity.

2.3. Total RNA Extraction and Cloning ORF Sequences of -CesA Genes in P. massoniana

According to the manufacturer’s protocol, the total RNA samples were extracted from needles of two-year-old P. massoniana by using the Polysaccharides and Polyphenolics-rich Plant Total RNA Isolation Kit (Vazmy Biotechnology, Nanjing, China). The concentration and purity of total RNA were measured using a Nano-Drop 2000 (Thermo Fisher Scientific, Waltham, MA, USA), and its integrity was confirmed by 1.2% agarose gel electrophoresis. The cDNA was synthesized from 1 µg of total RNA taking advantage of the 1st Strand cDNA Synthesis Kit (Yeasen Biotechnology, Shanghai, China). Based on the previous transcriptome sequencing (SRA accession: PRJNA660087), we designed the specific primers (Table S1) for cloning the ORFs of CesA genes from the cDNA of P. massoniana. The Polymerization Chain Reaction (PCR) was performed according to the manufacturer’s instructions of 2×ApexHF FS PCR Master Mix (Accurate Biotechnology, Changsha, China).

2.4. Sequence and Phylogenetic Analyses

The peptide length, isoelectric point and molecular mass of the putative CESA protein sequences were obtained by ExPASy (https://web.expasy.org/protparam/, accessed on 15 October 2022). The ORFs of putative CesA genes were predicted using the online ORF finder website (https://www.ncbi.nlm.nih.gov/orffinder/, accessed on 23 March 2022). The numbers of TMHs for each putative peptide were detected by TMHMM v. 2.0 (https://services.healthtech.dtu.dk/service.php?TMHMM-2.0, accessed on 27 November 2022). The online website MEME (https://meme-suite.org/meme/, accessed on 25 September 2022) was employed to analyze motifs of CESA proteins. The BioXM 2.7.1 [26] was used to align the amino acid sequences. The CESA protein sequences of A. thaliana [6], O. sativa [27], Z. mays [8], Camellia sinensis [28], Populus trichocarpa [9], Eucalyptus grandis [29], Betula luminifera [30], Gossypium raimondii [31] and Phaseolus vulgaris [32] were downloaded from supplemental information in related articles. The online Protein BLAST (https://blast.ncbi.nlm.nih.gov/Blast.cgi, accessed on 11 December 2022) was used to evaluate the percent identity between pairwise sequences. The MEGA-X [33] was used to construct a phylogenetic tree with neighbor-joining and 1000 bootstrap replicates. Then, the phylogenetic tree was edited for visualization purposes with the Evol View (http://evolgenius.info/#/, accessed on 29 November 2022).

2.5. Subcellular Localization

The subcellular localization of CESA proteins was performed by WoLF PSORT (https://wolfpsort.hgc.jp/, accessed on 15 October 2022). To confirm the predicted results, the Transcript4609 was selected for instantaneous transformation. After the pJIT166, plasmids were double digested using HindIII and BamHI. The ORF of Transcript4609 was inserted into the pJIT166-GFP expression vector by using the ClonExpress II One Step Cloning Kit (Vazmy Biotechnology, Nanjing, China). The constructed recombinant plasmid was transformed into the Agrobacterium rhizogenes strain GV3101. The strain was cultured in LB medium, concentrated to an OD600 of about 0.8, and then suspended in an infiltration media (10 mM MgCl2, 10 mM 2-(N-morpholino) ethanesulfonic acid (MES), 150 µM acetosyringone) for 3 h in dark. The suspension containing the p19 (a protein encoded by tomato bushy stunt virus) expression vector was prepared in the same way. Leaves at peak growth (about one month, before flowering) of N. benthamiana plants were injected with a 1:1 mixture of two suspensions for transient transformation. The injected N. benthheamiana plants were cultured in the dark at 25 °C for 48 h. The green fluorescent protein (GFP) signals were evaluated by employing an LSM710 confocal laser scanning microscope (Zeiss, Jena, Germany).

2.6. Real-Time Quantitative PCR

The total RNA from needles of P. massoniana after different treatments were extracted by applying the same method mentioned above (as shown in Section 2.3). After removing genomic DNA contaminants, the cDNA of 20 µL was synthesized from 1 µg total RNA. The α-tubulin (TUA, GeneBank: KM496535.1) gene of P. massoniana was selected as an internal control for normalization [34]. The specific primers of the TUA gene coupled with CesA genes were designed by Primer Premier 5.0 [35]. The primer sequences are shown in Table S1.
The qPCR was carried out via a StepOne Plus Real-Time PCR System (Applied Biosystems, Foster City, CA, USA). The reaction mixture was as follows: 1 µL of cDNA after 10-fold dilution, 0.4 µL of each forward and reverse primer (10 µM), 10 µL of SYBR Green Master Mix (Yeasen Biotechnology, Shanghai, China) and 6.4 µL ddH2O to supply the volume to 20 µL. The amplification was set as pre-denaturation at 95 °C for 2 min, 40 cycles including denaturation at 95 °C for 10 s, and extension at 60 °C for 30 s. The melting procedure is the default of the instrument. The relative expression levels of genes were analyzed by 2−∆∆CT. A one-way ANOVA was used to determine the significance of differences, p < 0.05. Tukey’s multiple comparison tests were performed to check the statistical significance between columns. The results were marked with lowercase letters. Those with the same marked letters have no significant difference, while those with different marked letters have significant differences.

3. Results

3.1. Identification of CesA Genes and Cloning of Their ORF Sequences in P. massoniana

By searching the HMM of CESA proteins in four transcriptomes, and deleting repetitive sequences and sequences without complete domains, we finally obtained seven CESA from P. massoniana. These genes encode proteins ranging from 984 to 1101 aa in length and from 110.81 to 123.78 kDa in molecular mass. The isoelectric point (pI) values of predicted CESA proteins were between 5.96 and 8.27, with six proteins having pI values less than seven. The number of predicted transmembrane helical segments (TMHs) ranged from six to eight. The subcellular localization of seven CESA proteins was predicted to be located in the plasma membrane (Table 1).
The full-length cDNA of PmCesA1 (KR817898.1, corresponding to Transcript4609) and PmCesA2 (KR817899.1, corresponding to Transcript2643) and the ORF of PmCesA2 have been cloned [36,37,38]. Based on transcript annotation information, the open reading frame (ORF) of the remaining six CesA genes was successfully cloned from P. massoniana. The sequencing results further confirmed the length and the nucleotide sequences of ORF of CesA genes in P. massoniana (Table S2). All the ORFs are longer than 2900 bp, with Transcript418 being the longest at 3306 bp (Table 1).

3.2. Structure Analysis of CESA Proteins in P. massoniana

To analyze the conservation of predicted CESA proteins, the amino acid sequences of seven CESA proteins were aligned using BioXM 2.7.1. As shown in Figure S1, we found that CESA proteins have four conserved cysteine residues (CXXC, C represents a cysteine residue, and X represents any amino acid) at the N-terminal to form the zinc finger domain. The class-specific region I (CSR I) follows the zinc finger domain, containing 104–194 aa with only 30%–54% similarity to each other. Another class-specific region, CSR II, lies between two highly conserved domains. There are two CRs that follow CSR II. The conserved region I (CR I) contains 393 amino acids, with 95.77%–97.34% similarity to each other. The second highly conserved region (CR II) is near the C-terminus and comprises 316 or 317 amino acids. These two conserved regions contain the triple conserved aspartic acids D, D, D, and a QVLRW motif mentioned above (V: valine, L: leucine). The first two D residues are within CR I, and the third D residue and QVLRW motif are within CR II.
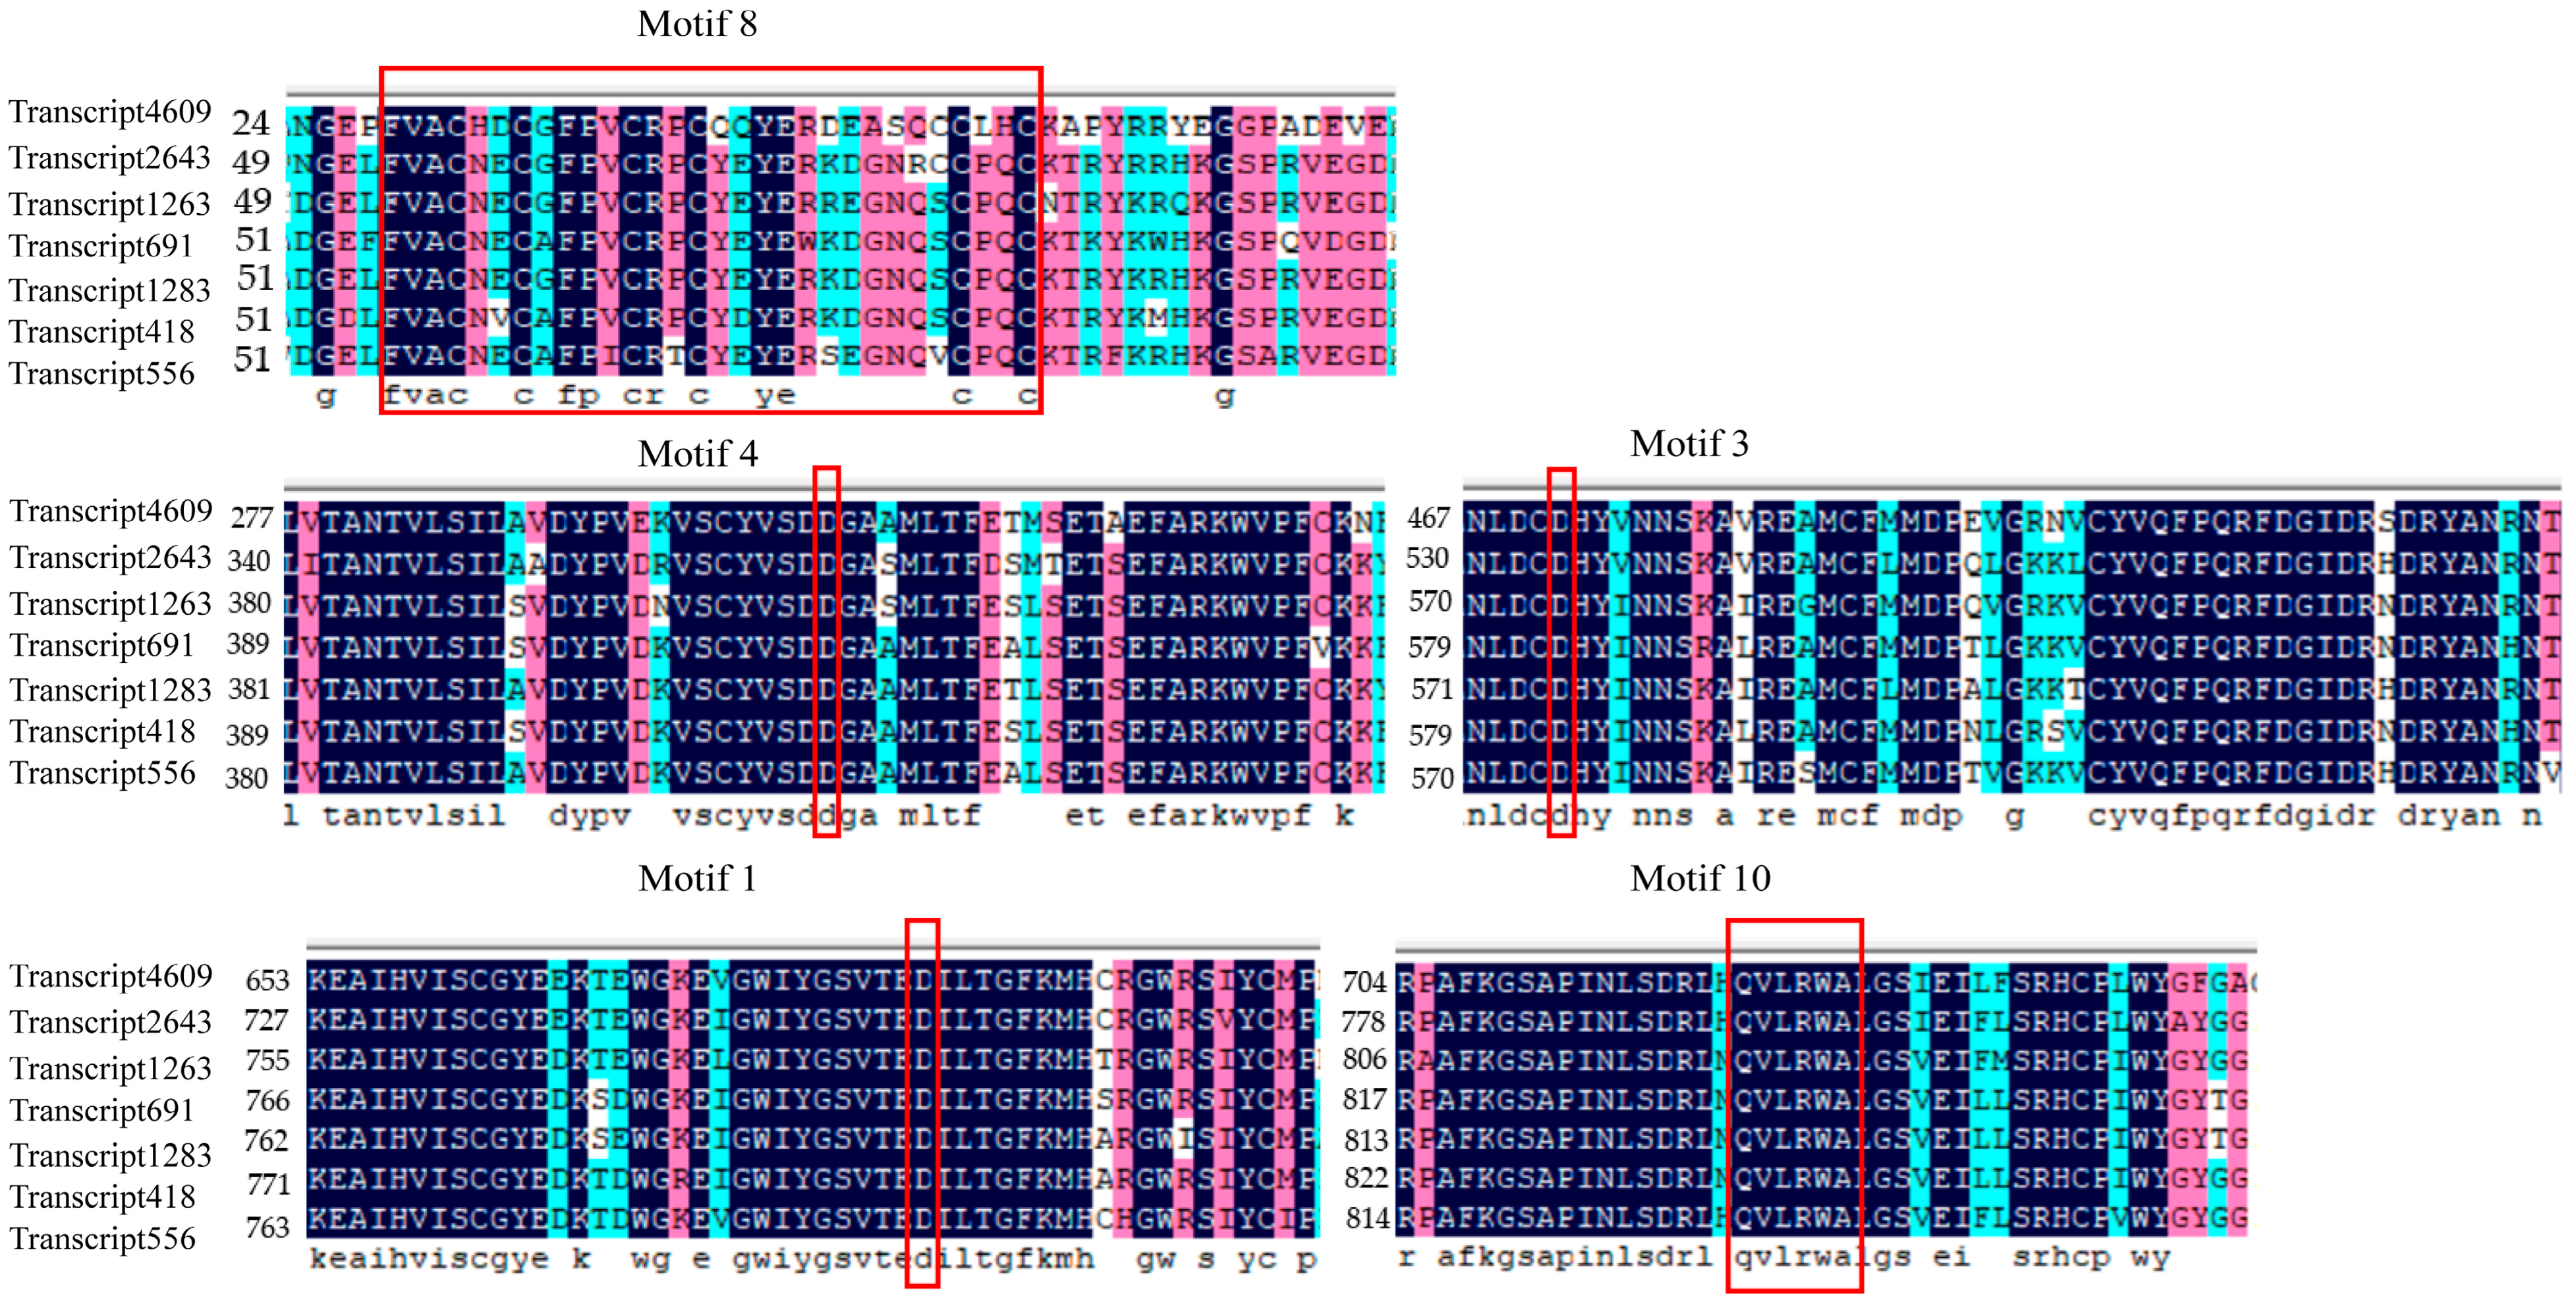
To further determine the specific regions of CESA proteins, we used the online program MEME to predict conserved motifs of putative CESA proteins (Figure 1). We found that all seven proteins contain 15 motifs, with motif lengths ranging from 29 to 50 amino acids. Eleven of the motifs are 50 amino acids in length, while Motif 15 is the shortest at 29 amino acids (Table S3). We aligned the motifs and found that Motif 8 of all the CESA proteins contains a conserved functional domain, whose sequence is FVACX2CX2PXCX2CX2YEX7CX2C (X represents any amino acid) [39]. Moreover, aligning the sequences of Motif 1, Motif 3, Motif 4 and Motif 10 of CESA proteins, we found that they include the conserved functional domains of CESA proteins with the residues of D, D, D, and QXXRW (Figure 2). This result is consistent with the description of CRs above. Motif 3 and Motif 4 are contained in CRI, while Motif 1 and Motif 10 are contained in CR II. The similar distribution pattern of these motifs in CESA proteins suggests that CesA was highly conserved during evolution.

3.3. Sequence and Phylogenetic Analyses of CesA Proteins in P. massoniana

Analyzing the similarity between the seven CESAs and their similarity to the corresponding homologous protein sequences, we found that the seven CESA proteins show 63.6%–81.2% similarity to each other. The similarity between Transcript691 and Transcript418 was highest at 81.2%. Meanwhile, the specific CESA proteins from A. thaliana, P. trichocarpa and B. luminifera share similarities with the seven CESA proteins in P. massoniana 70.1%–76.4%, 73.2%–80.6% and 72.8%–83.3%, respectively. Compared with A. thaliana from the herbaceous plant, the seven proteins of P. massoniana exhibit higher homology with P. trichocarpa and B. luminifera from woody plants (Table S4).
To investigate the phylogenetic relationships of the CESA proteins in different plants, we constructed a phylogenetic tree including four herbaceous plants (A. thaliana, O. sativa, Z. mays and P. vulgaris) and six woody plants (P. massoniana, Camellia sinensis, P. trichocharpa, E. grandis, B. luminifera and G. raimondii). A total of 130 CESA proteins were divided into six evolutionary branches (except for three proteins), which were named in order Group I, Group II, Group III, Group IV, Group V and Group VI (Figure 3). Among them, Group VI includes the most CESA proteins at 35, accounting for about 27%. The seven CESA proteins were grouped into six different groups, while Transcript691 and Transcript418 were grouped in Group I for having the highest similarity. In addition, Transcript4609, Transcript2643 and Transcript1263 were clustered, respectively, into three groups with AtCESA8, AtCESA4 and AtCESA7 that were mainly associated with secondary cell-wall synthesis [40]. Likewise, Transcript691, Transcript1283, Transcript418 and Transcript556 were clustered, respectively, into other three groups with the corresponding orthologous proteins from A. thaliana (AtCESA1, AtCESA3, AtCESA2, AtCESA5, AtCESA6 and AtCESA9), which are related to the formation of primary cell walls. Moreover, in each group, most CESA proteins seem to be divided into different subgroups of gymnosperms, monocotyledons and dicotyledons. Genes clustered into the same evolutionary branch may have similar functions due to the functional conservation of homologous genes. The result above suggests that the CesA in P. massoniana might have a similar function in cell wall synthesis to that of A. thaliana.

3.4. Subcellular Localization of CesA Protein

Proteins must be localized to the appropriate region to perform their function. The result of subcellular localization prediction showed that the putative PmCESA proteins are located in the plasma membranes. To verify this result, Transcript4609 was selected to construct PJIT166-GFP fusion vectors by inserting GFP at the C-terminus. The transient transformation experiments were performed by transforming the fusions into the leaves of N. benthamiana. The results showed that the green fluorescence signal of Transcript4609 recombinant with GFP was observed in the plasma membrane (Figure 4). CESA proteins in A. thaliana were found gathering on the Golgi apparatus to form CSCs. After the assembly of CSCs, they were transferred to the plasma membrane to synthesize cellulose as the catalysts [41]. The results of subcellular localization further confirmed that the CESA protein belongs to membrane protein, which participates in the synthesis of cellulose in the plasma membrane.

3.5. Expression Levels of CesA Genes in Different Tissues or Organs

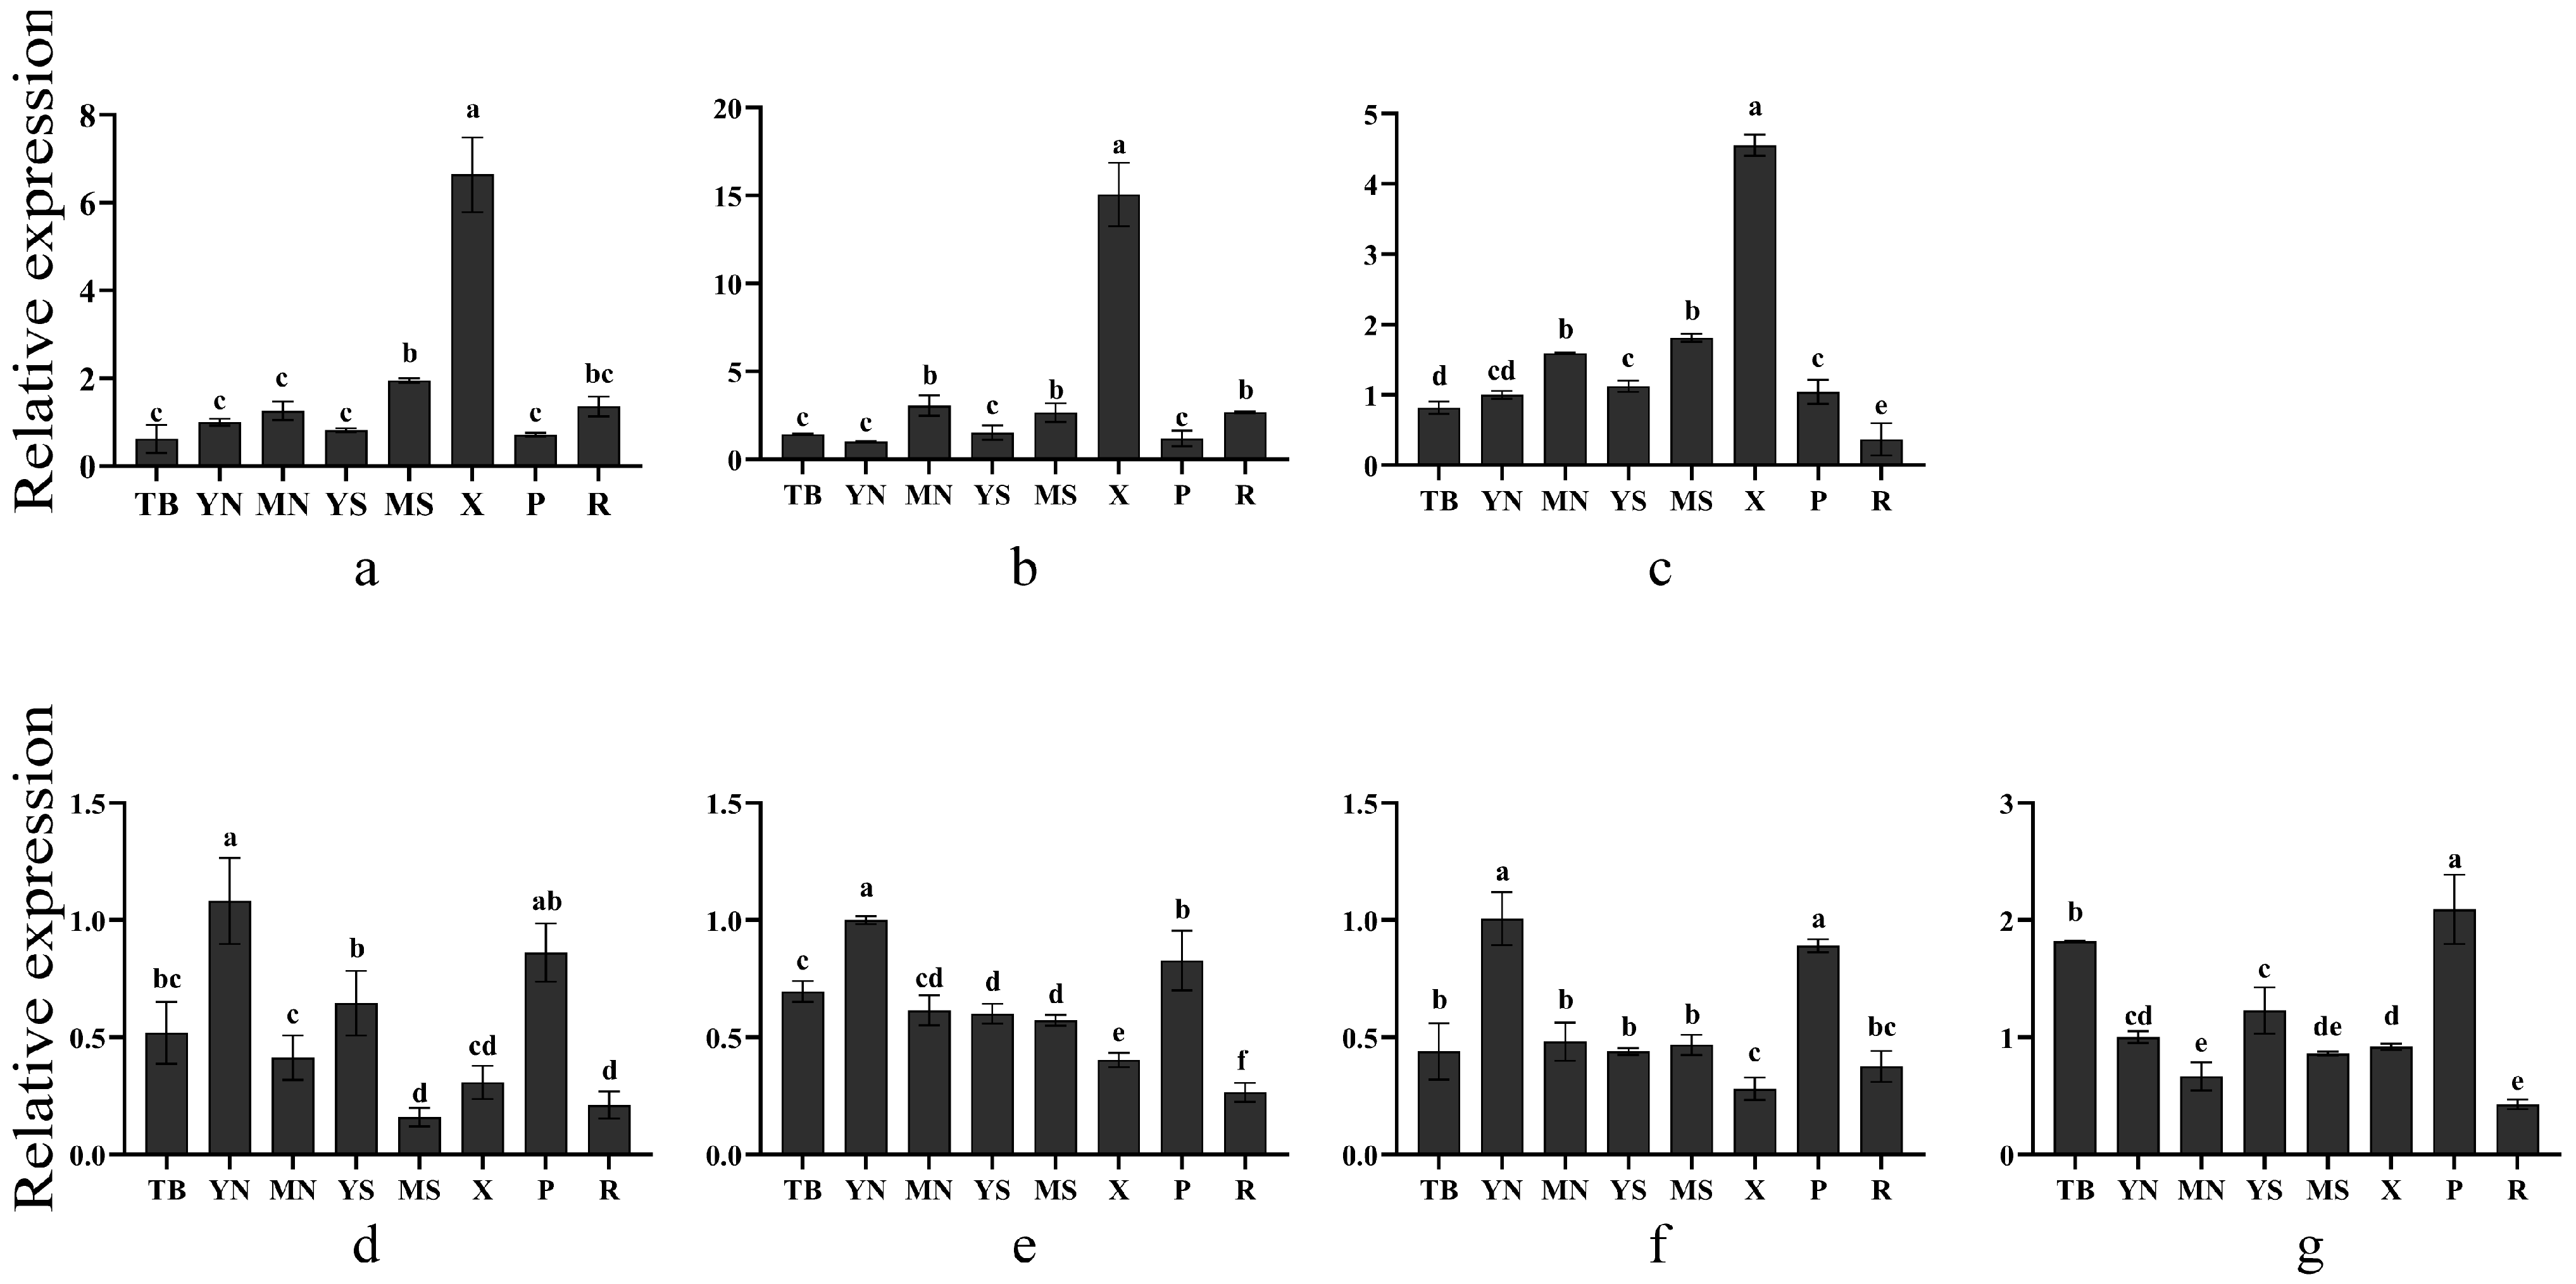
Phylogenetic analysis and subcellular localization of CesA genes suggest that they may be involved in cellulose synthesis in the different types of cell walls of plants. To further explore gene function, the RT-qPCR technique was used to analyze the expression patterns of CesA genes in eight different tissues or organs of P. massoniana. As shown in Figure 5, Transcript4609, Transcript2643 and Transcript1263 exhibited a similar expression pattern. The highest expression of these three genes showed in the xylem of lignified stems, which were 6.6 times, 15.1 times and 4.5 times as much as the expression in the young needle, respectively. Furthermore, the three genes were more expressed in mature stems than in young stems. The above result suggested that Transcript4609, Transcript2643 and Transcript1263 may participate in the formation of secondary walls, which are enriched in the secondary xylem. Compared with the first three genes, Transcript691, Transcript1283, Transcript418 and Transcript556 presented a different expression pattern. Transcript691, Transcript1283 and Transcript418 were mainly expressed in young needles and phloem, showing a significant difference from that found in the remaining tissues or organs. The Transcript556 was primarily expressed in the phloem and shoot-tip. Its expression levels in young needles and young stems were higher than in mature ones.

3.6. Expression Levels of CesA Genes under Different Treatments

In addition to the expression analysis in different tissues, we also analyzed the expression pattern of CesA genes under different abiotic stresses. Plant hormones, such as ABA, ET (ethylene), JA (jasmonates) and SA, play a vital role in regulating abiotic stress responses in plants [42]. To understand the response of the CesA genes to different stresses, we analyzed the expression of the CesA genes after 0 h, 3 h, 6 h, 12 h and 24 h of treatment with PEG6000, NaCl, ABA, MeJA, ETH and SA by RT-qPCR. (Figure 6).
After PEG6000 simulated drought treatment, the expression of Transcript4609, Transcript2643 and Transcript1263 was sharply upregulated, peaking at 3 h (2.5 times, 3.7 times and 4.4 times change, respectively), and then gradually downregulated. The expression of Transcript691, Transcript1283, Transcript418 and Transcript556 was upregulated at 12 h and 24 h, especially at 24 h (3.4 times, 2.8 times, 2.4 times and 2.1 times change, respectively).
The expression of four genes was induced under salt stress (NaCl treatment). The expression of Transcript4609 and Transcript2643 was significantly upregulated at 6 h and the Transcript1263 at 6 h and 12 h, while that of Transcript418 was significantly upregulated at 3 h, 6 h, 12 h and 24 h, especially 12 h. However, the expression of Transcript556 was significantly downregulated after the stimulation of NaCl.
The expression of four CesA genes in the needles was induced by ABA treatment. Although the expression of Transcript4609, Transcript2643, Transcript1263 and Transcript556 was downregulated slightly at 3 h, all of them upregulated significantly at 6 h, 12 h and 24 h, with the corresponding highest expression levels increasing by 14.5 times, 12.0 times, 12.2 times and 3.8 times of the control, respectively.
When exposed to the MeJA treatment, the expression of six PmCesA genes in the needles was induced except for Transcript691. The expression of Transcript4609 and Transcript2643 was increased at 6 h and 12 h, while that of Transcript1263 was increased at 12 h. The expression of Transcript1283 and Transcript418 was increased significantly at 3 h, 6 h, 12 h and 24 h, and Transcript556 at 3 h and 12 h.
Six genes showed different levels of response to ETH treatment. The expression of Transcript4609 and Transcript2643 was significantly upregulated at 3 h and 6 h, while that of Transcript1263 and Transcript691 was significantly upregulated at 6 h. The expression of Transcript1283 was significantly upregulated at 12 h, while that of Transcript556 was upregulated at 3 h, 6 h and 12 h. The Transcript418 gene was not sensitive to ETH.
Under SA treatment, the expression of Transcript4609, Transcript2643, Transcript1263, Transcript1283 and Transcript418 first increased and then decreased, while the expression of Transcript691 and Transcript556 did not change significantly.
Under six different stress treatments, Transcript4609, Transcript2643 and Transcript1263 presented a similar expression pattern under the same treatment. However, Transcript691, Transcript1283, Transcript418 and Transcript556 showed variable expression patterns. The expression patterns between Transcript691 and Transcript418 are also different, although they have the highest sequence similarity.

4. Discussion

The CESA proteins encoded by the CesA genes can catalyze the formation of cellulose by forming CSCs in the plasma membrane. Cellulose is a major component of the cell wall, which is not only involved in the construction of cell morphology but also the signaling network of various biotic or abiotic stresses, playing an important role in plant growth and development [23]. Due to the lack of complete genomic data for P. massoniana, we identified seven CesA genes from transcriptome and performed classification and expression analysis, which can lay a foundation for further analysis of CesA gene function and a reference for the classification of the CesA gene family in other pine species.
All seven CESA protein sequences of P. massoniana contain zinc finger structures, two CSRs, two CRs and 6–8 transmembrane domains. All the CRs contain DDDQXXRW amino acid residues. These results are consistent with the known features of CESA proteins in higher plants [27,43,44], suggesting that these conserved amino acid residue sequences may be necessary for CESA proteins to perform the function. Phylogenetic analysis revealed that the seven CESA proteins were grouped into six different groups. Interestingly, each group of CESA protein seems to be divided into different subgroups including gymnosperm, monocotyledon or dicotyledon. This implies that CESA proteins evolved and diverged from each other before the divergence of gymnosperms and angiosperms or monocots and dicots. This result is consistent with Francesco et al., who described the evolution of CesA genes [45]. In addition, in Group VI with the greatest amount of CESA protein, there was only one P. massoniana CESA protein (Transcript556), and this protein belongs to a different subgroup from AtCESA2, AtCESA5, AtCESA6 and AtCESA9 in Arabidopsis. Therefore, it is speculated that other CesA genes with high similarity to Transcript556 may exist in the P. massoniana genome.
Primary walls, formed during cell division and elongation, are abundant in young tissues such as terminal buds, young leaves, young stems and young roots, while secondary walls are deposited after the cells have stopped elongating. They are generally present in mature tissues such as leaf veins, mature stems and mature roots [46]. In previous studies, AtCesA4, AtCesA7 and AtCesA8 in Arabidopsis, OsCesA4, OsCesA7 and OsCesA9 in rice, PtiCesA4, PtiCesA7-A, PtiCesA7-B, PtiCesA8-A and PtiCesA8-B in P. trichocarpa and BlCesA1, BlCesA3 and BlCesA4 in B. luminifera were found to be mainly involved in secondary wall formation [30,47,48,49,50], whose proteins are grouped with Transcript4609, Transcript2643 and Transcript1263 in the phylogenetic tree, respectively. On the other hand, Transcript691, Transcript1283, Transcript418 and Transcript556 were clustered with the corresponding homologs from A. thaliana, O. sativa, B. luminifera and P. trichocarpa, respectively. These homologous proteins are associated with primary plant cell wall formation [27,30,40,51,52]. Furthermore, Transcript4609, Transcript2643 and Transcript1263 were highly expressed in the xylem rich in secondary walls, and Transcript691, Transcript1283, Transcript418 and Transcript556 were mainly expressed in tissues that were rich in primary walls, such as shoot-tip, young needle and phloem. These results are consistent with studies of related homologous proteins in A. thaliana and B. luminifera [30,47] as well as with the analysis of Transcript2643 by Maleki et al. [38]. Therefore, this suggests that Transcript4609, Transcript2643 and Transcript1263 are important genes involved in cellulose synthesis of secondary cell walls, whereas Transcript691, Transcript1283, Transcript418 and Transcript556 are mainly associated with the formation of primary walls in P. massoniana.
Plant endogenous hormones, such as salicylic acid (SA), jasmonic acid (JA), abscisic acid (ABA) and ethylene (ET), are out of balance when plants are subjected to abiotic stresses such as drought or salt [53]. As sessile organisms, plants have to maintain growth by altering the content of endogenous hormones and regulating physiological changes and gene expression of hormone signal pathways [54]. In this study, we found that CesAs in P. massoniana were induced by different abiotic stresses and hormones to a certain extent, indicating that the CesA, as one of the stress response genes, is involved in signal transduction pathways. These pathways are involved in stress perception, signal transduction and gene expression, resulting in adaptive changes in P. massoniana. This finding has important reference value for further exploring the expression regulation of CesA under abiotic stress. The change in cellulose content will cause the response of plants to abiotic or biotic stress. Previous studies have shown that mutations in AtCesA3 or AtCesA8 can lead to changes in drought tolerance in A. thaliana [19,55]. The composition of the cell wall in AtCSLD5 mutant changed, which affected the salt tolerance of the plant. It is suggested that plants may activate the expression of related genes through the signal transduction pathways to regulate the synthesis of cellulose and cell wall, which changes the tolerance of plants to external stress [56]. In this experiment, Transcript4609, Transcript2643 and Transcript1263 can respond to abiotic stress (including drought and salt stress) and plant hormones (ABA, MeJA, ETH and SA), indicating that they are potential key factors in the abiotic stress response.

5. Conclusions

Based on the transcriptome data, we identified seven CesA genes from P. massoniana. The proteins encoded by these genes are consistent with the structural characteristics of cellulose synthase The CESA proteins can be divided into two types: primary wall and secondary wall cellulose synthase, which may have functions in the plasma membrane. The CesA genes are differentially expressed in different tissues, and most genes have different responses induced by different abiotic stresses and hormones. In this study, we analyzed the expression patterns of CesA in different tissues and under different abiotic stress and hormone treatments, which is helpful to further explore the role of the CesA genes in the formation of cell walls and the response of P. massoniana to abiotic stress. In the next experiment, Transcript4609, Transcript2643 and Transcript1263 can be used as candidate genes to explore their biological function and molecular mechanism of responding to abiotic stress, to reduce the effect of abiotic stress during the growth of P. massoniana.

Supplementary Materials

The following supporting information can be downloaded at: https://www.mdpi.com/article/10.3390/f14051035/s1, Figure S1. Sequence alignment of CESA proteins of P. massoniana. Table S1. The sequences of primers used in the study. Table S2. The ORF nucleotide sequences of CesA genes in P. massoniana. Table S3. Details of conserved motifs from CESA proteins of P. massoniana. Table S4. The amino acid similarity of CESA proteins of P. massoniana compared with each other and other CESA proteins. Table S5. The amino acid sequences of the 130 CESA proteins in the phylogenetic tree.

Author Contributions

Conceptualization, Y.H. and K.J.; methodology, Y.H.; software, Y.H. and D.W.; validation, Y.H.; formal analysis, Y.H.; investigation, Y.H.; resources, Y.H.; data curation, Y.H.; writing—original draft preparation, Y.H.; writing—review and editing, Y.H., D.W., R.H.A., C.Z., X.L., M.Z., Z.H., P.Z. and K.J.; visualization, Y.H. All authors have read and agreed to the published version of the manuscript.

Funding

The research was financially supported by the National Key R&D Program of China (2022YFD2200202) and the Priority Academic Program Development of Jiangsu Higher Education Institutions (PAPD).

Data Availability Statement

The data presented in this study are available in Supplementary Materials.

Conflicts of Interest

The authors declare no conflict of interest.

References

  1. Que, F.; Zha, R.; Wei, Q. Advance research of cellulose synthase genes in plants. J. Nanjing For. Univ. (Nat. Sci. Ed.) 2022, 46, 207–214. [Google Scholar]
  2. Tian, A.; Xu, L.; Tao, G.; Yu, H.; Su, L.; Cao, J. Cellulose synthase in higher plants. Chin. J. Cell Biol. 2017, 39, 356–363. [Google Scholar]
  3. Lerouxel, O.; Cavalier, D.M.; Liepman, A.H.; Keegstra, K. Biosynthesis of plant cell wall polysaccharides—A complex process. Curr. Opin. Plant Biol. 2006, 9, 621–630. [Google Scholar] [CrossRef]
  4. Richmond, T.A.; Somerville, C.R. The cellulose synthase superfamily. Plant Physiol. 2000, 124, 495–498. [Google Scholar] [CrossRef] [PubMed]
  5. Pear, J.R.; Kawagoe, Y.; Schreckengost, W.E.; Delmer, D.P.; Stalker, D.M. Higher plants contain homologs of the bacterial celA genes encoding the catalytic subunit of cellulose synthase. Proc. Natl. Acad. Sci. USA 1996, 93, 12637–12642. [Google Scholar] [CrossRef]
  6. Arioli, T.; Peng, L.; Betzner, A.S.; Burn, J.; Wittke, W.; Herth, W.; Camilleri, C.; Hofte, H.; Plazinski, J.; Birch, R.; et al. Molecular analysis of cellulose biosynthesis in Arabidopsis. Science 1998, 279, 717–720. [Google Scholar] [CrossRef] [PubMed]
  7. Yin, Y.; Huang, J.; Xu, Y. The cellulose synthase superfamily in fully sequenced plants and algae. BMC Plant Biol. 2009, 9, 99. [Google Scholar] [CrossRef] [PubMed]
  8. Appenzeller, L.; Doblin, M.; Barreiro, R.; Wang, H.Y.; Niu, X.M.; Kollipara, K.; Carrigan, L.; Tomes, D.; Chapman, M.; Dhugga, K.S. Cellulose synthesis in maize: Isolation and expression analysis of the cellulose synthase (CesA) gene family. Cellulose 2004, 11, 287–299. [Google Scholar] [CrossRef]
  9. Suzuki, S.; Li, L.; Sun, Y.-H.; Chiang, V.L. The cellulose synthase gene superfamily and biochemical functions of xylem-specific cellulose synthase-like genes in Populus trichocarpa. Plant Physiol. 2006, 142, 1233–1245. [Google Scholar] [CrossRef]
  10. Purushotham, P.; Ho, R.; Zimmer, J. Architecture of a catalytically active homotrimeric plant cellulose synthase complex. Science 2020, 369, 1089–1094. [Google Scholar] [CrossRef]
  11. Park, S.; Ding, S.-Y. The N-terminal zinc finger of CELLULOSE SYNTHASE6 is critical in defining its functional properties by determining the level of homodimerization in Arabidopsis. Plant J. 2020, 103, 1826–1838. [Google Scholar] [CrossRef] [PubMed]
  12. Daras, G.; Templalexis, D.; Avgeri, F.; Tsitsekian, D.; Karamanou, K.; Rigas, S. Updating insights into the catalytic domain properties of plant cellulose synthase (CesA) and cellulose synthase-like (Csl) proteins. Molecules 2021, 26, 4335. [Google Scholar] [CrossRef]
  13. Richmond, T. Higher plant cellulose synthases. Genome Biol. 2000, 1, reviews3001. [Google Scholar] [PubMed]
  14. McFarlane, H.E.; Doering, A.; Persson, S. The cell biology of cellulose synthesis. In Annual Review of Plant Biology; Merchant, S.S., Ed.; Annual Reviews: San Mateo, CA, USA, 2014; Volume 65, pp. 69–94. [Google Scholar]
  15. Li, S.; Lei, L.; Gu, Y. Functional analysis of complexes with mixed primary and secondary cellulose synthases. Plant Signal. Behav. 2013, 8, e23179. [Google Scholar] [CrossRef]
  16. Persson, S.; Paredez, A.; Carroll, A.; Palsdottir, H.; Doblin, M.; Poindexter, P.; Khitrov, N.; Auer, M.; Somerville, C.R. Genetic evidence for three unique components in primary cell-wall cellulose synthase complexes in Arabidopsis. Proc. Natl. Acad. Sci. USA 2007, 104, 15566–15571. [Google Scholar] [CrossRef]
  17. Speicher, T.L.; Li, P.Z.; Wallace, I.S. Phosphoregulation of the plant cellulose synthase complex and cellulose synthase-like proteins. Plants 2018, 7, 52. [Google Scholar] [CrossRef]
  18. Zhang, S.-S.; Sun, L.; Dong, X.; Lu, S.-J.; Tian, W.; Liu, J.-X. Cellulose synthesis genes CESA6 and CSI1 are important for salt stress tolerance in Arabidopsis. J. Integr. Plant Biol. 2016, 58, 623–626. [Google Scholar] [CrossRef]
  19. Chen, Z.Z.; Hong, X.H.; Zhang, H.R.; Wang, Y.Q.; Li, X.; Zhu, J.K.; Gong, Z.Z. Disruption of the cellulose synthase gene, AtCesA8/IRX1, enhances drought and osmotic stress tolerance in Arabidopsis. Plant J. 2005, 43, 273–283. [Google Scholar] [CrossRef] [PubMed]
  20. Zhu, P.; Chen, Y.; Zhang, J.; Wu, F.; Wang, X.; Pan, T.; Wei, Q.; Hao, Y.; Chen, X.; Jiang, C.; et al. Identification, classification, and characterization of AP2/ERF superfamily genes in Masson pine (Pinus massoniana Lamb.). Sci. Rep. 2021, 11, 1–11. [Google Scholar] [CrossRef]
  21. Liu, X.; Yang, Z.; Chen, S.; Hu, L.; Wang, L.; Chen, G.; Yufen, L. Research status of Pinus massoniana modification. Guangxi For. Sci. 2022, 51, 285–289. [Google Scholar]
  22. Tan, J.; Tang, S.; Chen, H. Advances of drought resistance in Pinus massoniana. Guangxi For. Sci. 2017, 46, 1–7. [Google Scholar]
  23. Kang, C.; Zhao, X.; Wang, P.; Li, Y.; Tian, Z.; Wu, Z. Identification of the CesA gene family and analysis of response to abiotic stress in Cucumis sativus L. China Veg. 2022, 1, 29–41. [Google Scholar]
  24. Li, R.; Chen, P.; Zhu, L.; Wu, F.; Chen, Y.; Zhu, P.; Ji, K. Characterization and function of the 1-Deoxy-D-xylose-5-Phosphate Synthase (DXS) gene related to terpenoid synthesis in Pinus massoniana. Int. J. Mol. Sci. 2021, 22, 848. [Google Scholar] [CrossRef]
  25. Wu, F.; Sun, X.; Zou, B.; Zhu, P.; Lin, N.; Lin, J.; Ji, K. Transcriptional analysis of Masson pine (Pinus massoniana) under high CO2 stress. Genes 2019, 10, 804. [Google Scholar] [CrossRef] [PubMed]
  26. Huang, J.; Zhang, H. Development of nucleotide sequence analysis software based on Windows. Chin. J. Bioinform. 2004, 2, 13–17. [Google Scholar]
  27. Wang, L.; Guo, K.; Li, Y.; Tu, Y.; Hu, H.; Wang, B.; Cui, X.; Peng, L. Expression profiling and integrative analysis of the CESA/CSL superfamily in rice. BMC Plant Biol. 2010, 10, 282. [Google Scholar] [CrossRef]
  28. Li, Q.; Zhao, Q.; Yao, X.; Zhang, B.; Lu, L. Genome-wide characterization of the cellulose synthase gene superfamily in tea plants (Camellia sinensis). Phyton-Int. J. Exp. Bot. 2022, 91, 2163–2189. [Google Scholar] [CrossRef]
  29. Xu, S.; Zeng, B.; Fan, C.; Liu, Y.; Li, X.; Qiu, Z. Bioinformatics analyses of the Ces gene family in Eucalyptus grandis. Guangdong For. Sci. Technol. 2014, 30, 15–22. [Google Scholar]
  30. Huang, H.; Jiang, C.; Tong, Z.; Cheng, L.; Zhu, M.; Lin, E. Eight distinct cellulose synthase catalytic subunit genes from Betula luminifera are associated with primary and secondary cell wall biosynthesis. Cellulose 2014, 21, 2183–2198. [Google Scholar] [CrossRef]
  31. Wang, K.; Wang, Z.; Li, F.; Ye, W.; Wang, J.; Song, G.; Yue, Z.; Cong, L.; Shang, H.; Zhu, S.; et al. The draft genome of a diploid cotton Gossypium raimondii. Nat. Genet. 2012, 44, 1098–1103. [Google Scholar] [CrossRef] [PubMed]
  32. Liu, X.; Zhang, H.; Zhang, W.; Xu, W.; Li, S.; Chen, X.; Chen, H. Genome-wide bioinformatics analysis of cellulose synthase gene family in common bean (Phaseolus vulgaris L.) and the expression in the pod development. BMC Genom. Data 2022, 23, 9. [Google Scholar] [CrossRef] [PubMed]
  33. Kumar, S.; Stecher, G.; Li, M.; Knyaz, C.; Tamura, K. MEGA X: Molecular evolutionary genetics analysis across computing platforms. Mol. Biol. Evol. 2018, 35, 1547–1549. [Google Scholar] [CrossRef]
  34. Zhu, P.; Ma, Y.; Zhu, L.; Chen, Y.; Li, R.; Ji, K. Selection of suitable reference genes in Pinus massoniana Lamb. under different abiotic stresses for qPCR normalization. Forests 2019, 10, 632. [Google Scholar] [CrossRef]
  35. Zhai, Z.; Chen, X.N.; Wang, J. Primer disign with Primer Premier 5.0. Med. Educ. Res. Pract. 2008, 16, 695–698. [Google Scholar]
  36. Nguyen, D.T.; Guo, T.; Su, J.; Ji, K. Cloning on gene PmCesA2 encoding Pinus massoniana cellulose synthase and its plant expression vector construction. J. For. Eng. 2015, 29, 11–16. [Google Scholar]
  37. Nguyen, D.T.; Pan, T.; Ji, K. Cloning and analysis on PmCesA1 gene encoding Pinus massoniana cellulose synthase. Mol. Plant Breed. 2015, 13, 861–870. [Google Scholar]
  38. Maleki, S.S.; Mohammadi, K.; Movahedi, A.; Wu, F.; Ji, K.S. Increase in cell wall thickening and biomass production by overexpression of PmCesA2 in poplar. Front. Plant Sci. 2020, 11, 110. [Google Scholar] [CrossRef] [PubMed]
  39. Somerville, C. Cellulose synthesis in higher plants. Annu. Rev. Cell Dev. Biol. 2006, 22, 53–78. [Google Scholar] [CrossRef]
  40. Endler, A.; Persson, S. Cellulose synthases and synthesis in Arabidopsis. Mol. Plant 2011, 4, 199–211. [Google Scholar] [CrossRef]
  41. Paredez, A.R.; Somerville, C.R.; Ehrhardt, D.W. Visualization of cellulose synthase demonstrates functional association with microtubules. Science 2006, 312, 1491–1495. [Google Scholar] [CrossRef]
  42. Verma, V.; Ravindran, P.; Kumar, P.P. Plant hormone-mediated regulation of stress responses. BMC Plant Biol. 2016, 16, 86. [Google Scholar] [CrossRef]
  43. Xu, Z.-C.; Kong, Y. Genome-wide identification, subcellular localization and gene expression analysis of the members of CESA gene family in common tobacco (Nicotiana tabacum L.). Hereditas 2017, 39, 512–524. [Google Scholar]
  44. Delmer, D.P. Cellulose biosynthesis: Exciting times for a difficult field of study. Annu. Rev. Plant Physiol. Plant Mol. Biol. 1999, 50, 245–276. [Google Scholar] [CrossRef]
  45. Pancaldi, F.; van Loo, E.N.; Schranz, M.E.; Trindade, L.M. Genomic architecture and evolution of the cellulose synthase gene superfamily as revealed by phylogenomic analysis. Front. Plant Sci. 2022, 13, 870818. [Google Scholar] [CrossRef]
  46. Cosgrove, D.J. Growth of the plant cell wall. Nat. Rev. Mol. Cell Biol. 2005, 6, 850–861. [Google Scholar] [CrossRef] [PubMed]
  47. Taylor, N.G.; Howells, R.M.; Huttly, A.K.; Vickers, K.; Turner, S.R. Interactions among three distinct CesA proteins essential for cellulose synthesis. Proc. Natl. Acad. Sci. USA 2003, 100, 1450–1455. [Google Scholar] [CrossRef] [PubMed]
  48. Abbas, M.; Peszlen, I.; Shi, R.; Kim, H.; Katahira, R.; Kafle, K.; Xiang, Z.; Huang, X.; Min, D.; Mohamadamin, M.; et al. Involvement of CesA4, CesA7-A/B and CesA8-A/B in secondary wall formation in Populus trichocarpa wood. Tree Physiol. 2020, 40, 73–89. [Google Scholar] [CrossRef] [PubMed]
  49. Xu, W.; Cheng, H.; Zhu, S.; Cheng, J.; Ji, H.; Zhang, B.; Cao, S.; Wang, C.; Tong, G.; Zhen, C.; et al. Functional understanding of secondary cell wall cellulose synthases in Populus trichocarpa via the Cas9/gRNA-induced gene knockouts. New Phytol. 2021, 231, 1478–1495. [Google Scholar] [CrossRef] [PubMed]
  50. Tanaka, K.; Murata, K.; Yamazaki, M.; Onosato, K.; Miyao, A.; Hirochika, H. Three distinct rice cellulose synthase catalytic subunit genes required for cellulose synthesis in the secondary wall. Plant Physiol. 2003, 133, 73–83. [Google Scholar] [CrossRef] [PubMed]
  51. Djerbi, S.; Lindskog, M.; Arvestad, L.; Sterky, F.; Teeri, T.T. The genome sequence of black cottonwood (Populus trichocarpa) reveals 18 conserved cellulose synthase (CesA) genes. Planta 2005, 221, 739–746. [Google Scholar] [CrossRef]
  52. Mutwil, M.; Debolt, S.; Persson, S. Cellulose synthesis: A complex complex. Curr. Opin. Plant Biol. 2008, 11, 252–257. [Google Scholar] [CrossRef] [PubMed]
  53. Ling, L.; Xiaolong, W.; Qiang, Z. Research progress of abiotic stress responsive signal pathway in plant. Mol. Plant Breed. 2018, 16, 614–625. [Google Scholar]
  54. Zhao, S.; Zhang, Q.; Liu, M.; Zhou, H.; Ma, C.; Wang, P. Regulation of plant responses to salt stress. Int. J. Mol. Sci. 2021, 22, 4609. [Google Scholar] [CrossRef]
  55. Ellis, C.; Karafyllidis, I.; Wasternack, C.; Turner, J.G. The Arabidopsis mutant cev1 links cell wall signaling to jasmonate and ethylene responses. Plant Cell 2002, 14, 1981. [Google Scholar] [CrossRef] [PubMed]
  56. Zhu, J.; Lee, B.-H.; Dellinger, M.; Cui, X.; Zhang, C.; Wu, S.; Nothnagel, E.A.; Zhu, J.-K. A cellulose synthase-like protein is required for osmotic stress tolerance in Arabidopsis. Plant J. 2010, 63, 128–140. [Google Scholar] [CrossRef]
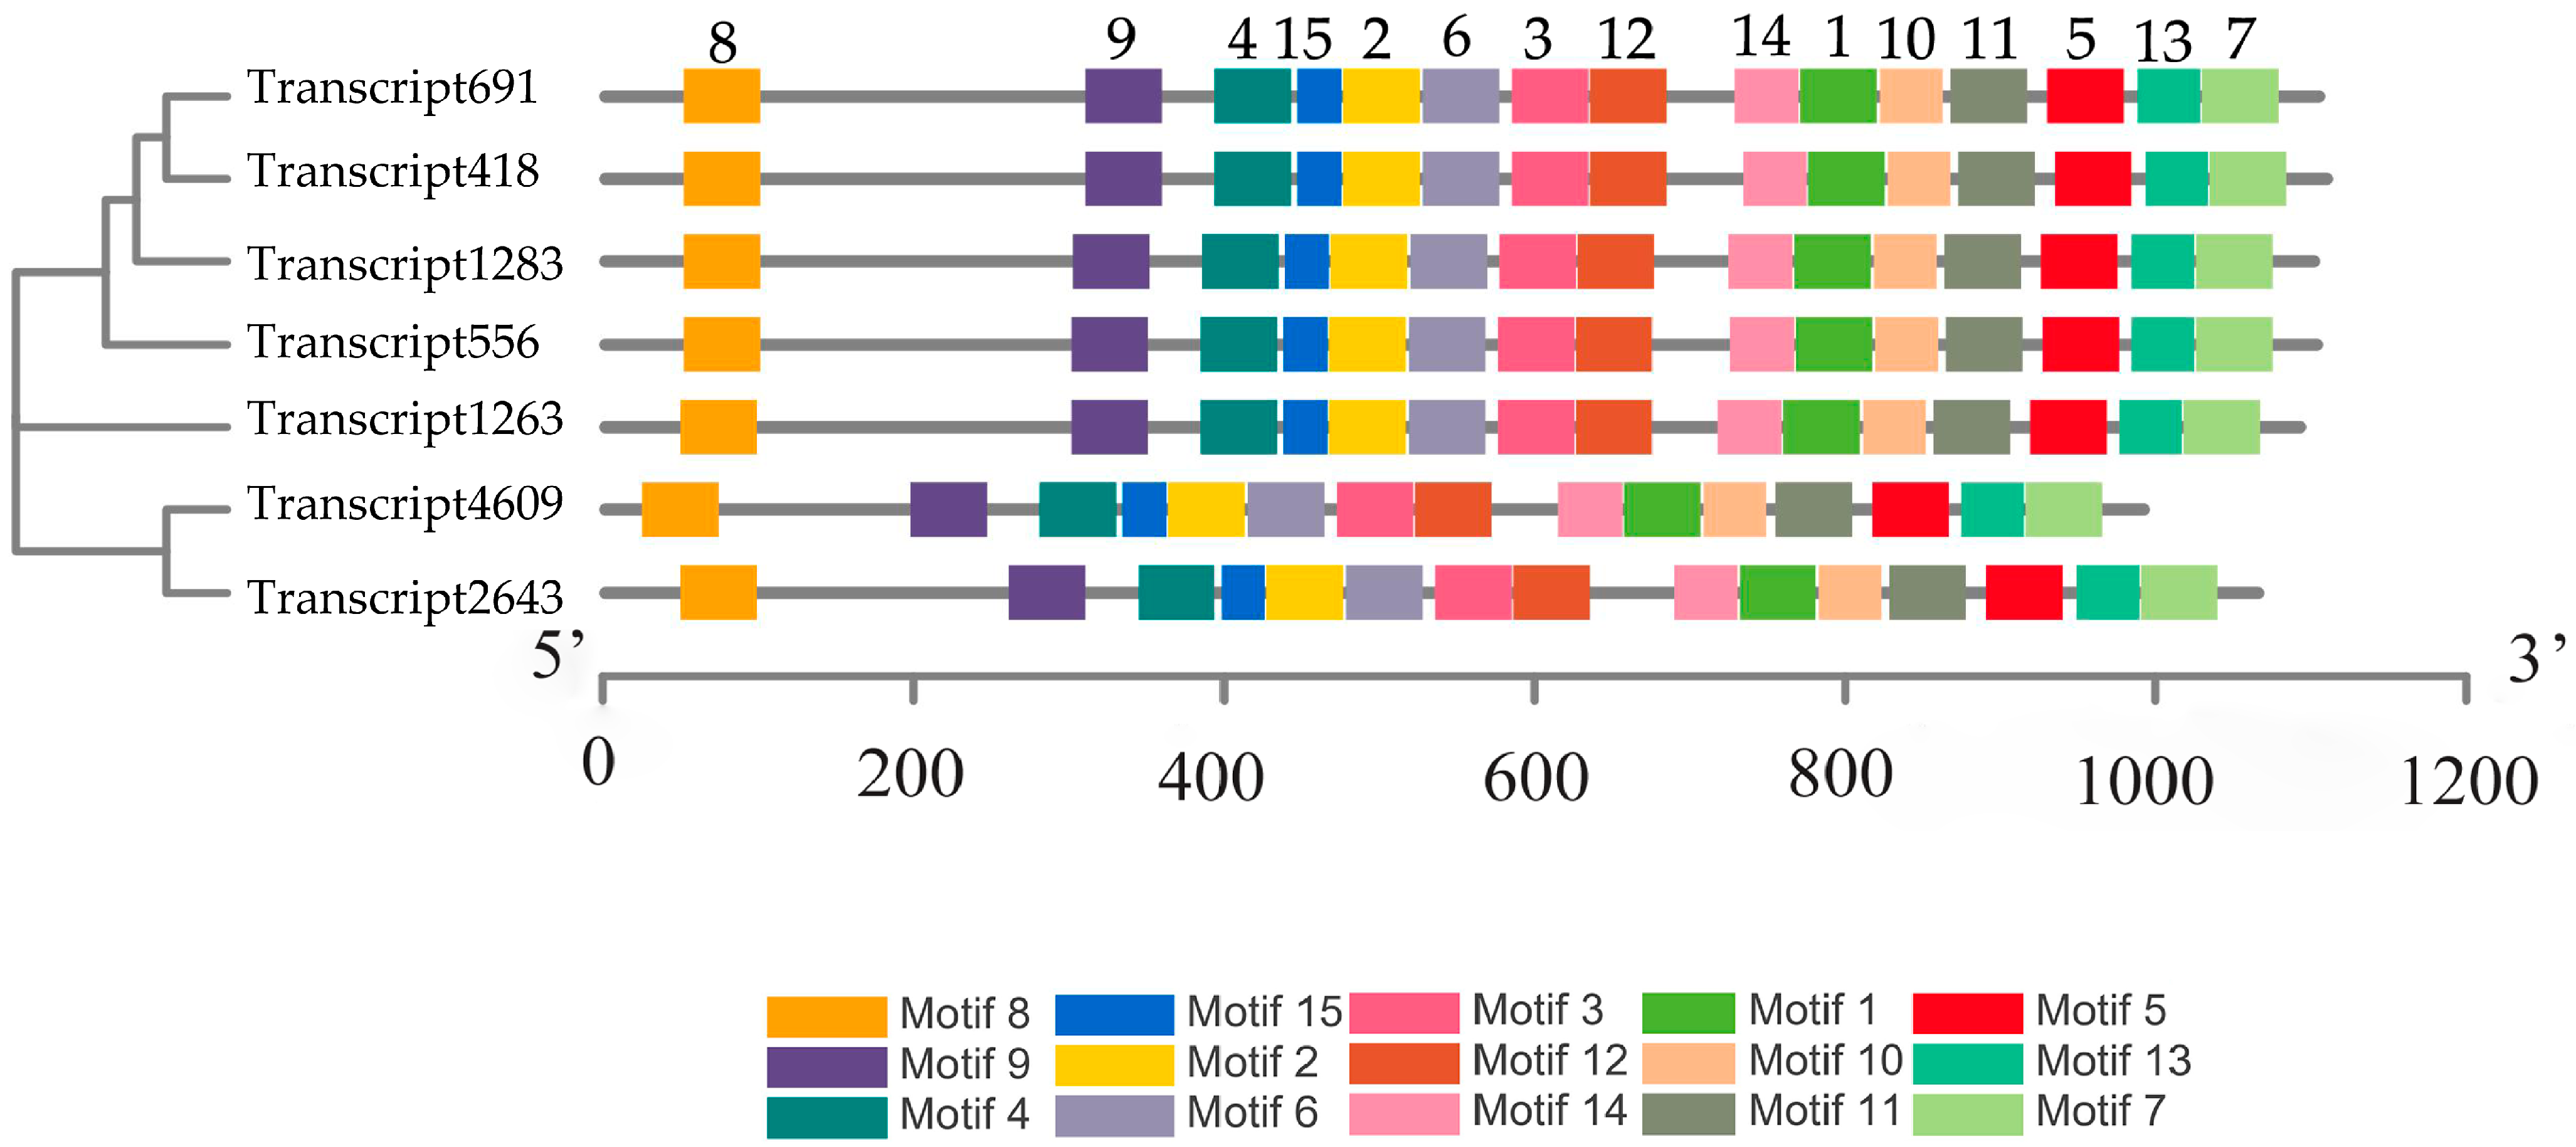
Figure 1. Analysis of the conserved motifs of putative CESA proteins in P. massoniana. Boxes with different colors represent different motifs. The number above the box represents the motif number. A detailed description of the 15 motifs is provided in Table S3.
Forests 14 01035 g001
Figure 2. The N-terminal conserved zinc finger domain and the conserved functional domain of D, D, D, and QXXRW of CESA protein of P. massoniana. The conserved sequence or residue circled by a red rectangle represents the conserved domain of CESA proteins. Blue indicates highly conserved amino acid sequence, pink indicates high similarity amino acid sequence, light blue indicates low similarity amino acid sequence, and white represents completely different amino acid sequence.
Forests 14 01035 g002
Figure 3. Phylogenetic tree derived from the 130 CESA protein sequences. The triangles denote the seven CESA proteins from P. massoniana. The colors of gene names corresponde to the same color groups in the outer circle. Bootstrap values are shown inside the branches. The full names of species are as follows: Pm = Pinus massoniana; At = Arabidopsis thaliana; Os = Oryza sativa; Zm = Zea mays; CSS = Camellia sinensis; Potri = Populus trichocharpa; Eucgr = Eucalyptus grandis; Bl = Betula luminifera; Gorai = Gossypium raimondii; Phvul = Phaseolus vulgaris. The amino acid sequences of the 130 CESA proteins are provided in Table S5.
Forests 14 01035 g003
Figure 4. Subcellular localization of Transcript4609 in leaves of N. benthamiana. The four channels from left to right are the GFP channel, chloroplast autofluorescence channel, bright field channel, and merge channel, respectively. Scale bar 50 µm.
Forests 14 01035 g004
Figure 5. Expression analysis of CesA genes in eight tissues or organs of P. massoniana. (a) Transcript4609, (b) Transcript2643, (c) Transcript1263, (d) Transcript691, (e) Transcript1283, (f) Transcript418, (g) Transcript556. To visualize the relative expression levels data, the expression levels of “YN” were normalized as “1”. T: Shoot-tip; YN: young needle; MN: mature needle; YS: young stem; MS: mature stem; X: xylem; P: phloem; R: root. A one-way ANOVA was used to determine the significance of differences, p < 0.05. Tukey’s multiple comparison tests were performed to check the statistical significance between columns. The same lowercase letter between two different columns indicates no significant difference, while two entirely different lowercase letters among columns indicate a significant difference. Two lowercase letters in the same column represent no significant difference between this column and the other columns that contain one of the two lowercase letters. The data are means ± SD calculated from three biological replicates.
Forests 14 01035 g005
Figure 6. Expression analysis of CesA genes under six treatments in needles of P. massoniana. (a) Transcript4609, (b) Transcript2643, (c) Transcript1263, (d) Transcript691, (e) Transcript1283, (f) Transcript418, (g) Transcript556.To visualize the relative expression levels, the expression levels of “0 h” was normalized as “1”. A one-way ANOVA was used to determine the significance of differences, p < 0.05. Tukey’s multiple comparison tests were performed to check the statistical significance between columns. The same lowercase letter between two different columns indicates no significant difference, while two entirely different lowercase letters among columns indicate a significant difference. Two lowercase letters in the same column represent no significant difference between this column and the other columns which contain one of the two lowercase letters. The data are means ± SD calculated from three biological replicates.
Forests 14 01035 g006
Table 1. Characterization of the putative CesA genes in P. massoniana.
Gene
ID
ORF
(bp)
Amino
Acid
No.
Molecular
Mass
(Da)
Isoelectric
Points
Predicted
TMHs 1
No.
Subcellular
Localization
Transcript46092955984110807.395.966Plasma
membrane
Transcript264331741057119729.908.278Plasma
membrane
Transcript126332551084122204.096.708Plasma
membrane
Transcript69132911096123411.086.428Plasma
membrane
Transcript128332821093123212.846.216Plasma
membrane
Transcript41833061101123447.256.608Plasma
membrane
Transcript55632881095123780.266.578Plasma
membrane
1 TMHs: Transmembrane helical segments.
Disclaimer/Publisher’s Note: The statements, opinions and data contained in all publications are solely those of the individual author(s) and contributor(s) and not of MDPI and/or the editor(s). MDPI and/or the editor(s) disclaim responsibility for any injury to people or property resulting from any ideas, methods, instructions or products referred to in the content.