Article

Land Use and Land Cover Change Effects on the Value of Ecosystem Services in the Konqi River Basin, China, under Ecological Water Conveyance Conditions

1
College of Geography and Remote Sensing Sciences, Xinjiang University, Urumqi 830046, China
2
Xinjiang Key Laboratory of Oasis Ecology, Xinjiang University, Urumqi 830046, China
3
MNR Technology Innovation Center for Central Asia Geo-Information Exploitation and Utilization, Urumqi 830046, China
4
Xinjiang Key Laboratory the Sustainable Development of Xinjiang’s Historical and Cultural Tourism, Xinjiang University, Urumqi 830046, China
5
College of Tourism, Xinjiang University, Urumqi 830046, China
*
Author to whom correspondence should be addressed.
Forests 2023, 14(5), 1028; https://doi.org/10.3390/f14051028
Submission received: 31 March 2023 / Revised: 11 May 2023 / Accepted: 15 May 2023 / Published: 17 May 2023
(This article belongs to the Section Forest Ecology and Management)

Abstract

:
Basin ecosystems are vulnerable to natural resource depletion, ecological damage, and environmental pollution due to their fragile natural environment. Assessing the value of basin ecosystem services (ES) can facilitate informed decision making by policy makers and stakeholders in the context of competing resource use. The Konqi River Basin in China, an arid inland river basin, has suffered from degraded ecosystems due to overexploitation of soil and water resources. In response, the local government launched an ecological water conveyance (EWC) project in 2016 to enhance ecological restoration efforts. This paper analyzes and evaluates the value of ES in the Konqi River Basin based on land use and land cover (LULC) change characteristics before and after EWC in 2013 and 2020, respectively. Remote sensing data and related socioeconomic statistics data are used to assess a typical river basin from three unique locations in the Konqi River Basin, divided into upper and lower reaches. The results show that cropland and unused land are the most important land use types in the upper and lower reaches. The characteristics of ecosystem service value (ESV) changes in the study area are consistent with land use structure changes. The total ESV shows a decreasing trend in the upper reaches from 2013 to 2020, while the lower reaches show an increasing trend. The total ESV increases in the typical river reaches of the Konqi River Basin. Spatially, low-ESV areas are mainly located in ecologically fragile areas that are difficult to develop and use. The sensitivity indexes of the study area are all less than 1, making the results of this study credible. The Moran index shows a significant spatial correlation in the study area, indicating that the distribution characteristics of high-ESV areas are agglomerative. Hot spot areas in the upper reaches show an overall increasing trend, while in the lower reaches, former sub-hot spot areas transform into hot spot areas. Due to data limitations, this study is limited to demonstrating that the value of ES in the area changes due to a combination of EWC policies and other factors. Nevertheless, the analysis shows that EWC policies actively change the ESV of a typical river basin in Konqi. This study can provide a reference for evaluating ESV in inland river basins in the northwest arid region and a scientific basis for the rational development and utilization of water and soil resources in the study area, located in an arid and ecologically fragile area.

1. Introduction

Human production and survival rely heavily on the structures, functions, and processes of ecosystems [1]. These ecosystems provide vital ecological processes that ensure people can live well and produce ecological products essential for human survival [2,3]. Consequently, ecosystems are critical for promoting healthy growth and ensuring human well-being [4,5]. Land use plays a crucial role in shaping how environmental benefits are produced, distributed, and utilized, and changes in land use can have significant impacts on ecosystem products, services, and their availability. Thus, land use changes can directly affect ecosystems’ capacity to provide essential services to support human life [6,7,8].
To evaluate the functions of ecosystems in a systematic way, Costanza proposed an approach based on the relationship between ecosystem services and functions, which was further developed with Kellert’s loss–benefit method for a standardized quantitative evaluation of biosphere materials in 1984. Building upon this foundation, Costanza and others developed a transfer-of-interests approach and evaluated 17 ecosystem services in the global biosphere, which identified the world’s first ESV coefficient [9,10]. Currency units were used to calculate the changes in ESV caused by changes in land use [11]. These studies have been conducted on regional and global scales and have used various accounting methods, such as the unit value approach summarized by Xie et al. [12,13,14,15]. Scholars have used different approaches to estimate ESV, including the ESV proposed by Biratu et al. and land use/cover change (LUCC)-based ES assessments recommended by Fontaine et al. [16,17]. It is essential to recognize that different land use and management patterns can change the original structure and layout and recharge patterns of ecosystems, which can affect their service function [18]. Bojie et al. have analyzed the limitations of previous ES valuation studies and broadened research ideas for future generations to carry out related studies [19,20]. As human production and life continue to promote land use change, analyzing and evaluating the value of ES based on this foundation can help optimize land planning [21]. This is crucial for socially, economically, and ecologically coordinated sustainable development.
Basin ecosystems play a crucial role in providing a wide range of products and services to the public, such as water resources, sand and windbreak preservation, wildlife protection, and recreation opportunities [22,23]. However, human activities have significantly impacted most of the river basins in the world, particularly in China’s arid and semi-arid areas, which face a double dilemma of climate change and the lagging economic development of a fragile ecological environment. To address this, EWC has been implemented since 2000 in several inland river basins in northwest China, such as the Tarim River Basin, the Heihe River Basin, and the Shiyang River Basin, as an effective tool to redistribute water resources and achieve sustainable development [24]. However, EWC projects have a significant impact on hydrological regimes, local ecosystems, and socioeconomic structures, particularly in water-scarce areas [25]. As a result, there has been a significant focus on assessing the value of ES in basin ecosystems of northwest China [26,27,28,29,30,31].
The Konqi River is a crucial tributary of the Tarim River, forming an integral part of the four rivers and playing a strategic role in maintaining the ecological security of the Silk Road Economic Belt. Riparian forests in the middle and lower reaches of the river are particularly important in ensuring the river’s stability [32]. The Konqi River also serves as a critical water source for the Korla-Lopnur Oasis, providing water for agricultural irrigation, industrial use, ecological maintenance, and transfer to the Tarim River, which has important strategic value [33]. However, with the rapid increase in population and economic activities in the Konqi River Basin, the demand for water has surged, leading to a sharp decline in ecological water and resulting in the drying up of the river and severe degradation of the desert riverbank forests [34]. To address this issue, the state launched the Tarim River Basin Comprehensive Management Project in 2000. As part of the project, 21 EWC projects were initiated to release a total of 84.45 × 10⁸ m3 of ecological water from the Daxihaizi Reservoir to the lower reaches of the Tarim River. However, to restore the ecological environment on both sides of the Konqi River, the Xinjiang Tarim River Basin Administration launched the Konqi River Ecological Emergency Water Replenishment Project on 26 August 2016. This project involved the transfer of water from Bosten Lake to the Konqi River due to its high water level [33]. The continuous water transfer has effectively mitigated the severe ecological degradation downstream, raised the groundwater level in the receiving area, improved groundwater quality, and increased the number of plant and animal species, leading to an overall improvement in the environment.
To achieve sustainable socioeconomic development and maintain a healthy ecosystem in the typical Konqi River Basin, it is necessary to conduct a comprehensive study on the value of ES from both a theoretical and practical standpoint. This undertaking requires a clear understanding of the spatial and temporal changes in LULC within the region. To obtain a representative sample, we have carefully selected three distinct locations, including the direct-flow formation zone, the last person’s water hub site, and the dispersal zone, to establish typical river reaches within the basin. The main objective of this study is to perform a quantitative analysis of the typical river reaches within the basin and evaluate how LULC and ESV have changed over time and space, specifically after the implementation of the EWC project. Through this analysis, we aim to establish a scientific foundation for the sustainable use of water and soil resources in the research area, which is situated within an arid and fragile ecological zone. This will contribute to ensuring national agricultural ecological security and promoting sustainable land use and ecological environment construction.

2. Materials and Methods

2.1. Study Area

The Konqi River Basin (85°12′–92°19′ E, 39°40′–42°11′ N) is situated in the Bayingoleng Mongolian Autonomous Prefecture, south of the Central Tianshan Mountains in Xinjiang, and spans a total length of 942 km [34]. Its terrain gradually declines from northwest to southeast, extending from the southern foot of the Quruqtagh Mountains to the northeastern edge of the Tarim Basin (refer to Figure 1). The basin experiences a typical arid continental climate characterized by low rainfall, intense evaporation, and abundant sunshine and light. The annual average precipitation is 62.7 mm, with rainfall concentrated between June and August. Additionally, the annual average evaporation is 2773 mm [35]. In this paper, we divide the typical reach of the Konqi River into upper and lower reaches at coordinates 86°24′ E and 41°14′ N in the basin due to the final artificial diversion intersection. The upper reaches (87°48′–86°24′ E, 40°53′–41°14′ N) are influenced by human activities. Our field trip results showed that the main natural vegetation types and species established within 0–2 km of the river channel are Populus euphratica Oliv, Phragmites australis (Cav.) Trin. ex Steudel, and Salsula ruthrenica. Conversely, human activities are infrequent in the lower reaches (86°24′–85°52′ E, 41°14′–41°43′ N), which is the farthest distance reachable by the year-round river volume. The primary natural vegetation types and established species are Phragmites australis (Cav.) Trin. ex Steudel, Tamarix ramosissima Ldb, Salsula nitraria, and Kalidium foliatum (Figure 2).
The study area, a representative artificial oasis, is situated downstream of Bosten Lake where the only river is largely managed by human interventions [36]. Encompassing Korla City and Lopnur County, the primary crop grown in the region is cotton. The rivers flowing through the area play a critical role in supporting diverse activities, including industrial, agricultural, and economic pursuits, as well as sustaining daily living and ecological balance.

2.2. Data Resources and Pre-Processing

The land use data utilized in this study comprised Landsat thematic mapper (TM) data from 2013 and combined data from Sentinel-2 remote sensing satellite images acquired in July, August, and September of 2019 and 2020, which were obtained from https://scihub.copernicus.eu/ (accessed on 22 June 2020) at a spatial resolution of 4 m. These merged data were obtained through supervised classification, with an accuracy exceeding 85% and an overall Kappa statistic of 0.87. The land use types within the study area were classified as forest, cropland, settlement, water, shrubland, artificial forest land, unused land, and grassland, based on national land use classifications and considering the actual situation and purpose of the study area. Statistical analysis of the land use data was conducted using ArcGIS. The Digital Elevation Model (DEM) was obtained from the Geospatial Data Cloud, Computer Network Information Center, Chinese Academy of Sciences, which was accessed on 10 April 2022 through http://www.gscloud.cn. The economic and social data used to evaluate the ecosystem services value (ESV) were derived from the Xinjiang Statistical Yearbook, the China Agricultural Statistical Yearbook for the period of 1990–2020, and the National Agricultural Cost–Benefit Information Synthesis.

2.3. Analysis of Land Use Change Characteristics

The land use transfer matrix is a useful tool for studying patterns of land use transfer. By quantifying the interaction between different land use types at the beginning and end of the study period, and the land use structure of the region at a given point in time, it provides a numerical description of land use changes. The dynamic process of land transformation over time can be illustrated by the direction of changes in different land use categories [37]. The singular land use dynamic degree (K) is a metric that can be used to quantify the degree of change in a specific land use category over time. A higher value indicates a greater degree of change in the land use. Equation (1) can be used to calculate the singular land use dynamic degree [38].
K = U a U b U b × 1 T × 100 %
where  U a , U b , T , and K represent the area after the land use period, at the start of the land use period, study period, and K is the single land use dynamic degree, respectively.

2.4. ESV Assessment Model Construction

The enhanced Costanza evaluation model, as developed by Xie et al. and suitable for ecosystem types and the service values they provide in China, was utilized in this study [39]. To adjust the ESV coefficients, the yield and value of crops per unit area were calculated for the administrative subdivision where the research region is situated. Based on the output of each food crop, the area of land sown, and the typical price for each food crop in the region, adjustments were made. The annual crop value (Ea) per hectare of cropland was calculated using the following formula:
E a = 1 7 i = 1 n m i p i q i M i = 1 , , n
where i, mi, pi, qi, and M represent the crop variety, the crop yield (kg/ha), price (Yuan/kg), area of land sown for the crop (ha), and the total area of land (ha), respectively. The main food crops in the study area were wheat and maize, and the ESV per unit area was determined as 1/7 of the production value per unit area of the best food crops in a given area and year [40].
To determine the ESV equivalent factor, the average price, output, and sown region of cereal products in Xinjiang from 2013 to 2020 were examined, resulting in a value of 526.12 Yuan/ha. The ESV coefficients of the Konqi River Basin during the study period were obtained by combining the research results of Xie and other scholars, as shown in Table 1.
The ESV in the typical Konqi River Basin was estimated based on the difference between the estimated values for the various LULC classes.
E S V = ( A k × V C k )
E S V f = ( A f k × V C f k )
where ESVf is the service value of ecosystem type F (yuan/a); Afk is the area of land use type K in ecosystem type F in the study region (ha); VCfk is the ESV coefficient of land use type K in ecosystem type F (yuan/(ha2·a)); and where ESV is the service value of the ecosystem of the land use type in the study area (yuan/a) and Ak is the area of land use type K in the study.

2.5. Sensitivity and Elasticity of ESV

The evaluation of the sensitivity coefficient (CS) of the elastic coefficient in economics is presented in this study to verify the accuracy of the ESV coefficient (VC) on the ESV results. CS index (Equation (5)) used to determine the extent to which the ESV depends on the VC over a given time period.
C S = ( E S V j E S V i ) / E S V i ( V C i k V C i k ) / V C i k
where ESVj and ESVi denote the magnitude of ESV before and after adjustment, respectively, and VCjk and VCik denote the magnitude of ESV coefficients before and after adjustment, respectively.

2.6. Characterization of Changes in the Value of ES

The local Moran’s index in the Geoda model was used to explore the clustering and anomalies of the ESV distribution patterns in the upper reaches and lower reaches of the typical Konqi River Basin. Combined with hot spot analysis ( G i * index), the index reflects the distribution pattern of the cold spots and hot spots of the ESV and determines the locations of the high- and low-value areas where spatial clustering occurs, effectively revealing the spatial differences in the ES provisioning capacity [41].
I i = ( x i x a ) j = 1 n W i j × ( x j x a ) j = 1 n ( x i x a ) 2 / n
where Ii is Moran’s local spatial autocorrelation index; xi, xj are the ESV observations of the i and j evaluation units, respectively, xa is the mean of the observations. In the study scale, n represents the total number of ESV assessments, and Wij is the spatial weight matrix between the evaluation units i and j.
G i * = j = 1 n w i j x j X j = 1 n w i j [ n j = 1 n w i j 2 ( j = 1 n w i j ) 2 ] / ( n 1 ) s
X = 1 n i = 1 n x i
S = 1 n i = 1 n x i 2 X 2

3. Results

3.1. Analysis of Land Use Change in the Konqi Typical River Basin

3.1.1. Land Use Structure Evolution Characteristics

The accuracy of the base data used in this study for both periods was achieved and validated, with an overall Kappa coefficient of 0.87.
Figure 3 and Figure 4 and Table 2 analyze the dynamics of land use types in a typical Konqi River Basin from 2013 to 2020. The major land use type in the upper reaches of the Konqi River Basin was cropland, accounting for 68.33% and 57.61% in 2013 and 2020, respectively, and exhibited an overall decreasing trend. The proportion of forest was small, only 0.31% and 1.44% in 2013 and 2020, respectively, but showed an increasing trend. In the lower reaches, the main land use type was unused land, accounting for 73.42% and 70.46%. The proportion of forest in the lower reaches was only 0.05% in 2013, while the proportion of settlement in 2020 was 0.06%.
The single land use dynamic degree analysis (Table 2 and Table 3) shows that the single dynamic degree and rates of land use change in the typical upper and lower Konqi River Basin from 2013 to 2020 are consistent. In the upper reaches, roads, forest, artificial forestland, shrubland, and unused land increased, with roads and forest exhibiting tremendous change. The area of grassland, road, forest, and shrubland increased, while unused land showed a decreasing trend. The water area had less variability (3.09% to 2.35%), and there was no artificial forest area (based on field research and satellite image interpretation, it is known that there are no artificial forestlands in this area). Under relevant policy initiatives to promote the regional economy, the urban area expanded, increasing the areas of roads and other construction land. The areas of crop land and water decreased due to farmland returning to forest and high-intensity human land and water development. In the upper reaches, the area of settlement decreased on both sides of the river due to river management and ecological construction policies. The change in grassland was more stable due to natural factors. To implement the ecological development goal, ecological restoration and treatment policies were implemented on both sides of the river, resulting in a decreasing trend of unused land in the lower reaches.
Overall, the analysis indicates that land use changes have affected the value of ecosystem services in the Konqi River Basin. The results suggest that there is a need for continued monitoring of land use changes and their impact on the value of ecosystem services to support the development of effective policies for sustainable land use in the region.

3.1.2. Land Use Transfer Characteristics

The land use transfer matrix depicted in Figure 5 was employed to investigate the dynamics of land use change in the upper and lower reaches of the Konqi River Basin. The functional structure of land use exhibited a discernible shift in the study region. In the upper reaches, a majority of the cropland was transformed into other land use types. Specifically, cropland was predominantly converted into unused land (2572.03 hm2) and roads (1935.40 hm2). Additionally, unused land was converted to cropland (1167.58 hm2) and shrubland (478.46 hm2). Forest areas underwent various types of land use changes, except for water areas that primarily transformed into grassland and shrubland.
In the lower reaches, the largest land use change was the conversion of unused land to other land types. Of the total converted area, 4976.13 hm2 and 2623.34 hm2 of unused land changed to shrubland and grassland, respectively. Subsequently, shrubland areas were converted to unused land (3807.16 hm2) and grassland (798.19 hm2). Water areas were primarily converted to grassland and shrubland.

3.2. Analysis of Spatial and Temporal Variations in ESV

3.2.1. Dynamic Changes in ESV

The total and single values of ecosystem services (ESV) for the years 2013 and 2020 were obtained using Formulas (3) and (4) (refer to Table 4). The basin service function comprises nine components, namely food production and raw materials, gas regulation, climate regulation, hydrology regulation, waste treatment, soil conservation, biodiversity maintenance, and aesthetic landscape provision. Higher values for each ecosystem service were observed in the upper and lower reaches of the basin, with climate regulation, hydrology regulation, waste treatment, soil conservation, and biodiversity maintenance showing particularly high values. However, in the upper reaches, the single ecosystem service of providing aesthetic landscapes exhibited a relatively low value. Conversely, the lower reaches had a relatively low functional value for food production.

3.2.2. Analysis of Spatial Changes in ESV

Table 5 demonstrates that the ESV in the study area changed from 2013 to 2020, with spatial distribution variations across the typical Konqi River Basin. The differences in land use structures resulted in varying ES values between the upper and lower reaches of the typical river basin. The upper reaches had a higher proportion of ESV contributed by cropland and forest, and the largest changes occurred in cropland and grassland, while forest experienced the smallest changes. ESV was more variable in the typical basin and less variable in forest, with the service values of other land use types remaining relatively stable.
To highlight the spatial variation in ESV in the typical Konqi River Basin, a 1 km × 1 km grid was constructed using the fishnet tool in ArcGIS 10.2. The 1 km grid was used as the main study unit to estimate and evaluate the value of ES separately in the upper and lower reaches of the river basin in two periods [42].
Figure 6 shows that in the upper reaches, ESV was high in the northwest and middle areas and low in the southeast and peripheral areas in 2013. By 2020, high-value areas were scattered in the middle area, and low-value areas were scattered in the suburban area. The largest low-ESV area consisted of unused land and other ecosystems with fragile ecological environments, which also made it the most difficult area to develop and use.
As shown in Figure 7, the ESV in the lower reaches of the study area was characterized by a mosaic of high-, higher-, and middle-value areas on a predominantly low-value background. This was due to the distribution of forest, shrubland, and grassland ecosystems on a large background area of unused natural ecosystem far from the riverbanks. From 2013 to 2020, high-value regions showed an increase in value, low-value areas gradually became high-value regions, and ESV showed an overall increase in the typical Konqi River Basin. The enhancement of vegetation growth conditions along the two sides of the river was mainly the result of the implementation of the EWC and ecological restoration policies.

3.2.3. Sensitivity Analysis of ES

The sensitivity index was calculated by adjusting 50% of the cost coefficients of every land use kind for the ES value in the typical Konqi River Basin from 2013 to 2020, as shown in Table 6. The relevance CS of these analyses was less than one in all cases, with the highest CS being 0.536–0.430 for cropland in the upper reaches areas. The maximum CS was 0.437–0.536 for the lower reaches forest, due to having the highest service value coefficient and relatively larger cover area. Overall, it seems that the estimate of total ESV for the study region is relatively inelastic, which also suggests that our estimate of ESV is reasonable.

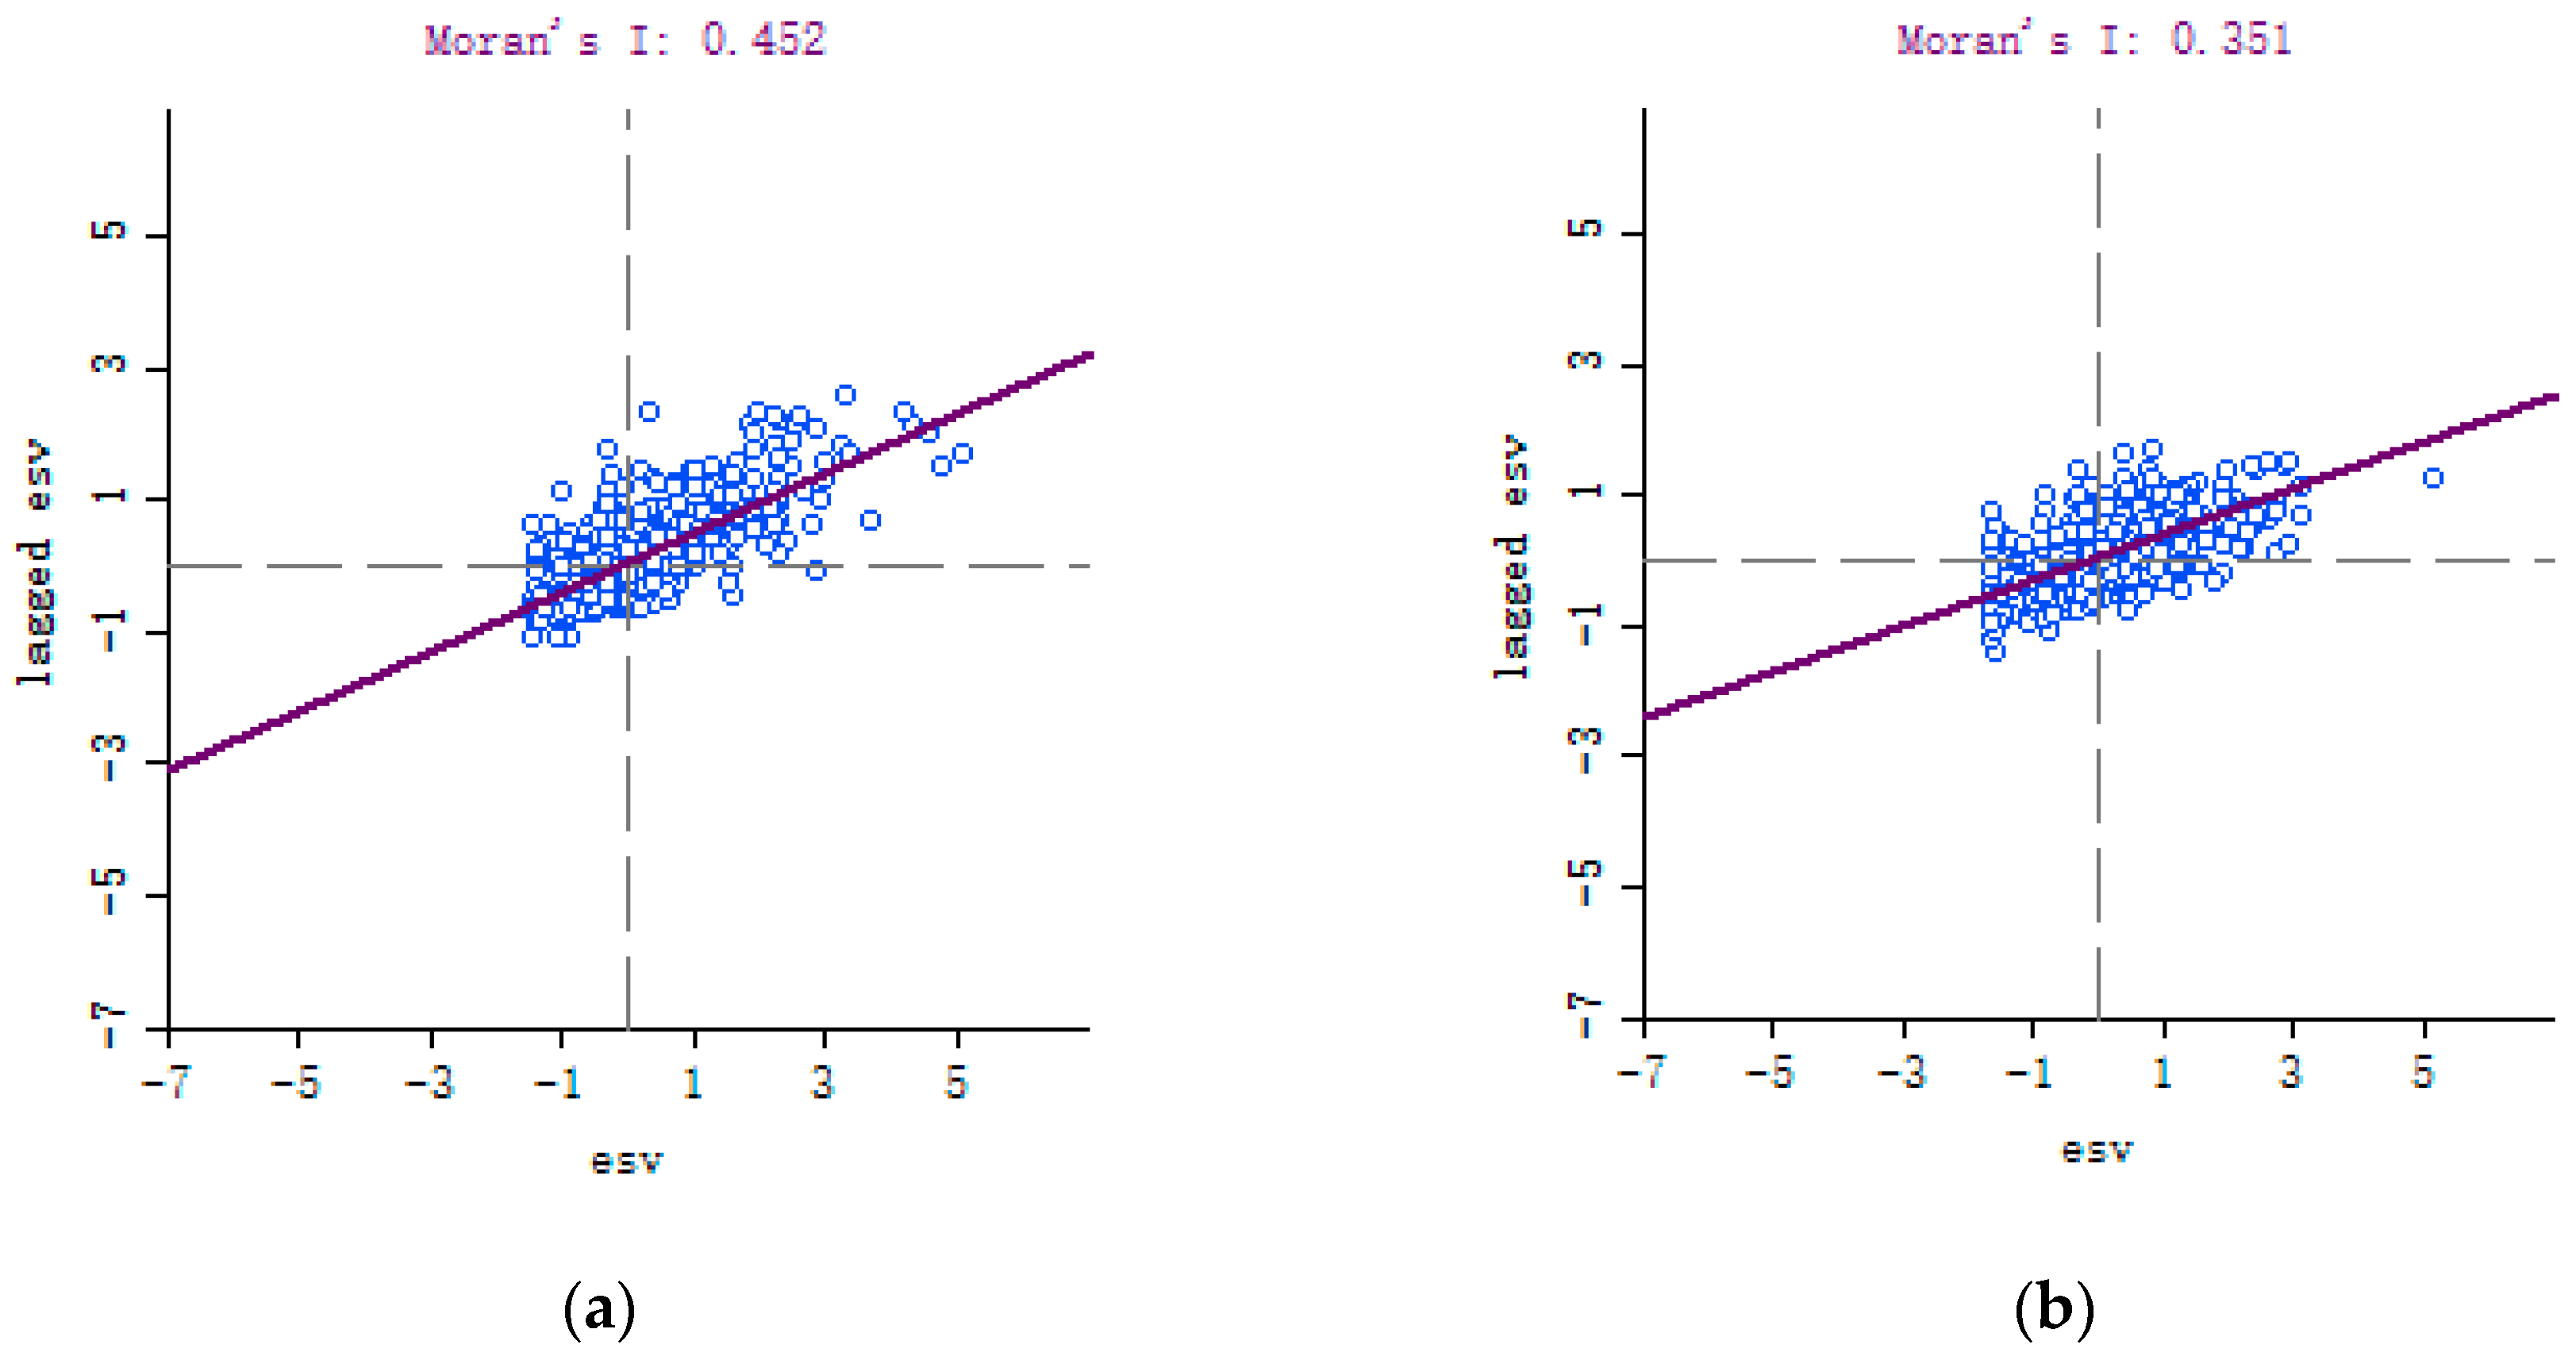
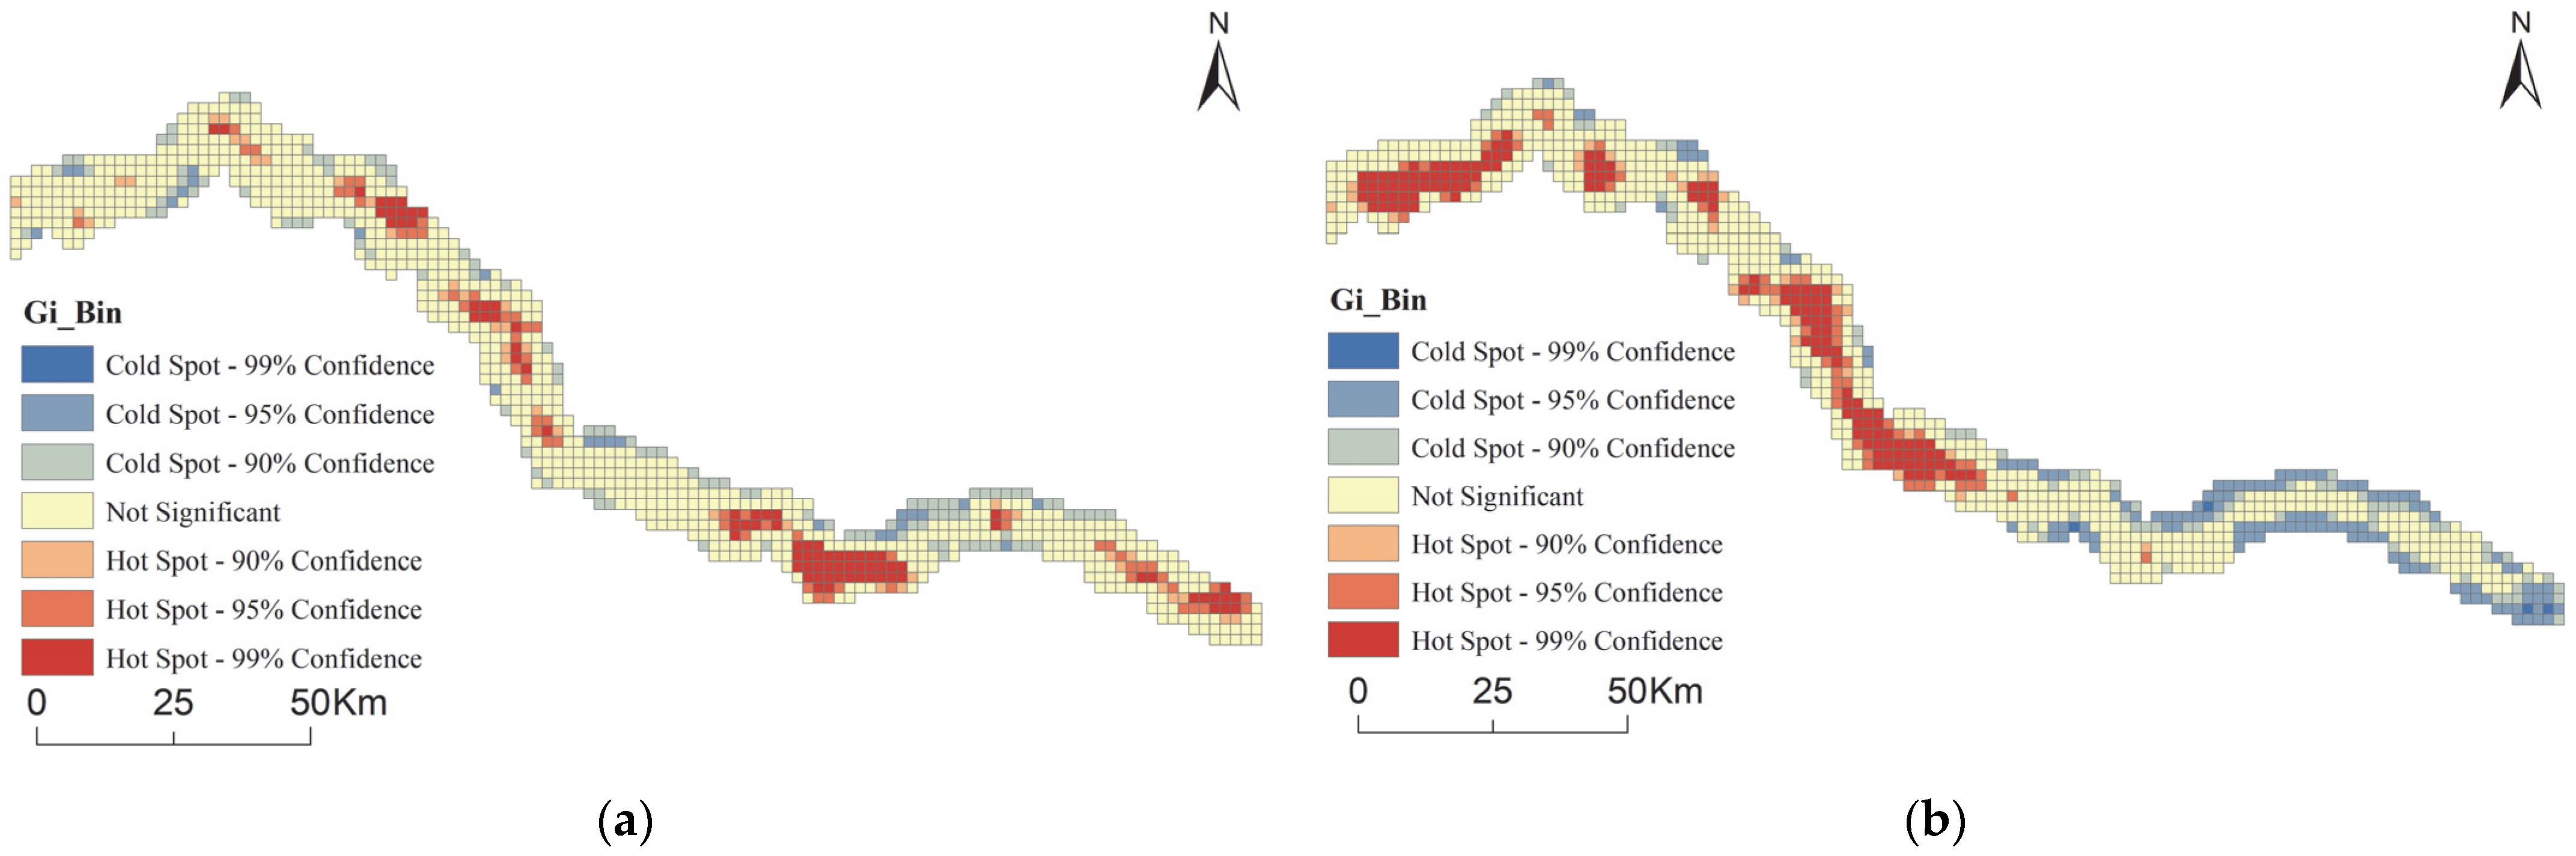
3.3. Spatial Autocorrelation Analysis

This study employed the Geoda model, in combination with Local Moran’s I, to investigate the clustering and anomalies of ESV distribution patterns in the upper and lower reaches of the typical Konqi River Basin. The spatial characteristics of ESV in the upper reaches of the typical river basins in Konqi for 2013 and 2020 were computed using Equation (6).
Figure 8 and Figure 9 reveal a clear spatial correlation between the upper and lower reaches of the study area, indicating that the distribution of high-ESV areas was characterized by agglomeration while the converse was true for low-ESV areas. Between 2013 and 2020, the Moran’s index exhibited a decreasing trend in the upper reaches, decreasing from 0.452 in 2013 to 0.351 in 2020. Notably, in 2020, the ESV was relatively low in the apparent upper reaches compared to 2013, corroborating prior calculations. In the lower reaches, however, the Moran’s index demonstrated an increasing trend, rising from 0.390 in 2013 to 0.524 in 2020. While these results confirm the existence of a similar aggregation phenomenon in the study area, the aggregation structure remains unclear [42]. Consequently, this study analyzed the study region by computing the local Moran’s index, generating a hot spot analysis map of the study area.
Figure 10 and Figure 11 depict how the ESV hot spots in the upper reaches of the typical Konqi River reduced to insignificance between 2013 and 2020. In some cases, insignificant areas in the southeast were converted to hot spots. The secondary cold spots and cold spots were also converted to insignificant areas, with the hot spots exhibiting an increasing trend. In the lower reaches, the initial sporadically distributed hot spots transformed into a larger area of clustering, and insignificant, sub-cold, and cold spots were converted to hot spots. This transformation resulted from efforts to convert cropland back into grassland and forest, thereby reducing the cropland area. By optimizing the land use structure, this study helped to balance the contradiction between agricultural water and ecological water, thus interconverting the natural ecosystems into unused land, cropland, and shrub land. Consequently, green spaces were expanded. In the central part of the lower reaches, EWC increased the recharge of water resources and the water area, converting the insignificant sub-cold spot into a hot spot.

4. Discussion

4.1. Analysis of Land Use Dynamic

Land use modifications are highly dynamic and non-linear, resulting from a complex interplay of natural and anthropogenic factors, including changes in policy, population growth, and land use decline [43]. Our analysis of LULC in the Konqi River Basin indicates a general downward trend in cropland, which is the dominant land use type in the upper reaches. In contrast, the forest area, which is the smallest land category in the upper reaches, increased from 0.31% to 1.44% between 2013 and 2020, likely due to the national policy of returning farmland to forest.
In the lower reaches, unused land accounts for over 70% of the area, with forest covering only 0.05% in 2013 and increasing to 1.55% in 2020. The extensive destruction of coastal poplar forests resulted from the overexploitation of water resources in the Konqi River Basin during the late 20th century, leading to the drying up of the lower reaches and a decline in the water table. The central government’s Strategic Water Resources Management Plan (SWMP) in 2011 No.1 has strict control “red lines” concerning the use of water by the nation, water use efficiency, and water pollution [44]. In 2016, an artificial EWC was conducted by the Xinjiang Tarim River Basin Administration to the Konqi River, which brought river water to the downstream forest area through ecological gates and water transfer channels to increase the intermittent flood surface between forest areas and promote the ecosystem recovery of poplar forests [45]. In recent years, the local government has strengthened ecological protection efforts and launched a special action for the ecological protection of poplar forests in the Tarim River Basin [46,47]. These factors may have indirectly or directly contributed to the expansion of the area occupied by forest land in the lower reaches. The governments of the basin areas implemented a series of policies to promote economic development during the “12th Five-Year Plan Period” (2011–2015), including a high rate of urbanization, increased government investment in infrastructure, the expansion of construction areas, the return of cropland to forest, and the development of soil and water resources. These policies led to a decrease in the area of unused land, cropland, and water occupation in the upper reaches, while the areas of grassland, forest, shrubland, and other green areas increased. Management strategies have been implemented on both sides of the lower reaches to achieve ecological development goals such as “Lucid waters and lush mountains are invaluable assets”, resulting in a decrease in the area of unused land in the lower reaches.

4.2. Analysis of ESV

The structure of land use has a direct impact on the value of ecosystem services (ES) [48]. Our analysis indicates that the upper and lower reaches of the typical Konqi River Basin exhibit the highest value for ES functions such as climate regulation, hydrology regulation, waste treatment, soil conservation, and biodiversity maintenance. The land use structure of the region shows a strong correlation with these findings. The expansion of forest and green areas in the basin enhances its overall ES value. However, large areas of unused land result in a relatively low value of providing aesthetic landscapes. Moreover, the small area of cropland in the lower reaches leads to a low functional value of food production. These findings are consistent with other studies conducted elsewhere [49,50,51,52]. The low-value areas are predominantly located in environmentally vulnerable regions that are challenging to develop and utilize. Our analysis of the area sensitivity index indicates that the ES value is inelastic to its value factor, which implies that the results of our study can be considered reliable.
From 2013 to 2020, we analyzed the changes in the value of ES based on land use before and after the implementation of the EWC policy. Due to data limitations, our study was confined to demonstrating that the value of ES in the region changes as a result of a combination of EWC policies and other factors. However, it is worth noting that the ecological environment in the lower Konqi River, where human activities are not prominent, has improved to a certain extent after the implementation of the policy, with the expansion of green areas and replenishment of water resources. As a result, low-value land types are being transformed into high-value land types. The EWC policy has altered the groundwater level and improved the vegetation growth trend, thereby exerting a positive impact on ESV in the typical Konqi River Basin. Our study can serve as a reference for ESV assessment of inland river basins in the arid zone of northwest China.

5. Conclusions

The typical Konqi River Basin provides vital ecosystem services to its administrative region. EWC, as an essential measure to mitigate ecosystem degradation in China’s northwest arid inland river basins, has a significant impact on changes in ESV in the study area. This paper aimed to analyze the land use change characteristics under EWC conditions from 2013 to 2020 and investigate the impact of EWC on ESV in the Konqi River Basin. Based on the analysis, the typical river reaches of the Konqi River were divided into the upper reaches, strongly influenced by human activities, and the lower reaches, with almost zero human activities. The value of local ES was affected by EWC under different conditions of human activity intensity after land use change. The following conclusions were drawn: (1) The dominant land use type in the upper reaches, cropland, showed a decreasing trend in area share by 2020, mainly converting to unused land (2572.03 hm2) and roads (1935.40 hm2). There was a decrease in the share of unused land area in the lower reaches, mainly converting to shrubland (4976.13 hm2) and grassland (2623.34 hm2). (2) The analysis of ESV revealed that climate regulation, hydrology regulation, and waste treatment were the three main contributors to ESV in the study area. High-value areas increased in value, low-value areas gradually became high-value areas, and ESV increased overall in the lower reaches of the typical Konqi River Basin. (3) Forest was the land type with the highest ESV in the typical river section of the Konqi River (19,194.25 and 27,532.10 per ten thousand Yuan (CNY) in 2013 and 2020), and its area share change had a significant impact on the overall ESV in the study area. (4) The ESV in the study area showed significant spatial correlations in both the upper and lower reaches according to the Moran index. Hot spot analysis revealed that the hot spot areas in the upper and lower reaches of the study area showed an overall increase and aggregated distribution from 2013 to 2020. Based on these findings, we can infer that oasis towns and surrounding cropland areas in the upper reaches of the study region are not only the areas with the most frequent human activities but also the main source of ecological benefits and the source of human influence on environmental changes. The lower reaches’ ecological benefits are mainly derived from green space. Therefore, to enhance the ecological environment in the typical Konqi River Basin, proper land use planning schemes must be formulated, and each land type area should be strictly protected and monitored. Moreover, pollution prevention and control should be improved, comprehensive environmental management strengthened, relevant laws and regulations improved, and sound management systems implemented. Lastly, public awareness of the development of an ecological civilization should be strengthened to achieve long-term sustainable development in the region.

Author Contributions

Investigation, T.Y., J.J. and B.O.; Supervision, A.A. (Abdugheni Abliz) and A.A. (Abdulla Abliz); Writing—original draft, A.A. (Adila Akbar); Writing—review and editing, A.A. (Adila Akbar) and A.A. (Abudukeyimu Abulizi). All authors have read and agreed to the published version of the manuscript.

Funding

This research was funded by the Key Project of Joint Funds of the National Natural Science Foundation of China, “The coal resources of protective exploitation and environmental effects in Xinjiang” (Grant No. U1903209) and the National Natural Science Foundation of China, “Assessment and source identification of heavy metal exposures of wild animals in Xinjiang Kalamaili Mountain Nature Reserve” (No. 42167058); Seven river lakes, including the Kerya River, have been interpreted by satellite remote sensing images (2020670006); which the University of Xinjiang and the Institute of Hydroelectric and Hydraulic Sciences of Xinjiang have jointly completed; Dry Zone Oasis Urban Expansion Studies (201905120001).

Institutional Review Board Statement

Not applicable.

Informed Consent Statement

Not applicable.

Data Availability Statement

Data are contained within the article.

Acknowledgments

This research we thank Yusuyunjiang Mamitimin, School of Geography and Remote Sensing Sciences, Xinjiang University, and we thank Abdusalam, School of Geography, Nanjing Normal University, and we thank Anwar Eziz, XinJiang Institute of Ecology and Geography, Chinese Academy of sciences.

Conflicts of Interest

The authors declare that there are no conflicts of interest.

References

  1. Ge, Q.; Xu, W.; Fu, M.; Han, Y.; An, G.; Xu, Y. Ecosystem service values of gardens in the Yellow River Basin, China. J. Arid Land 2022, 14, 284–296. [Google Scholar] [CrossRef]
  2. Xie, G.D.; Xiao, Y.; Lu, C.X. Study on Ecosystem Services: Progress, Limitation and Basic Paradigm. J. Plant Ecol. 2006, 20, 191–199. [Google Scholar]
  3. Zulpiya, M.; Umut, H.; Tayierjiang, A.; Ayinuer, A. Correction: Ecological effect of the riparian ecosystem in the lower reaches of the Tarim River in northwest China. PLoS ONE 2019, 14, e0214007. [Google Scholar] [CrossRef]
  4. Hu, S.; Yang, Y.; Li, A.; Liu, K.; Mi, C.; Shi, R. Integrating Ecosystem Services Into Assessments of Sustainable Development Goals: A Case Study of the Beijing-Tianjin-Hebei Region, China. Front. Environ. Sci. 2022, 10, 897792. [Google Scholar] [CrossRef]
  5. Yang, R.; Ren, F.; Xu, W.; Ma, X.; Zhang, H.; He, W. China’s ecosystem service value in 1992-2018: Pattern and anthropogenic driving factors detection using Bayesian spatiotemporal hierarchy model. J Env. Manag. 2022, 302, 114089. [Google Scholar] [CrossRef] [PubMed]
  6. Fu, B.J.; Zhang, L.W. Land-use change and ecosystem services: Concepts, methods and progress. Prog. Geogr. 2014, 33, 441–446. [Google Scholar]
  7. Shifaw, E.; Sha, J.; Li, X.; Bao, Z.; Zhou, Z. An insight into land-cover changes and their impacts on ecosystem services before and after the implementation of a comprehensive experimental zone plan in Pingtan island, China. Land Use Policy 2019, 82, 631–642. [Google Scholar] [CrossRef]
  8. Li, S.; Wang, J.; Zhu, W.; Zhang, J.; Liu, Y.; Gao, Y.; Wang, Y.; Li, Y. Research framework of ecosystem services geography from spatial and regional perspectives. Acta Geogr. Sin. 2014, 69, 1628–1639. [Google Scholar]
  9. Costanza, R.; d’Arge, R.; de Groot, R.; Farber, S.; Grasso, M.; Hannon, B.; Limburg, K.; Naeem, S.; O’Neill, R.V.; Paruelo, J.; et al. The value of the world’s ecosystem services and natural capital. Ecol. Econ. 1998, 25, 3–15. [Google Scholar] [CrossRef]
  10. Kellert, S.R. Assessing Wildlife and Environmental Values in Cost-Benefit Analysis. J. Environ. Manag. 1984, 18, 4. [Google Scholar]
  11. Limburg, K.E.; O’Neill, R.V.; Costanza, R.; Farber, S. Complex systems and valuation. Ecol. Econ. 2002, 41, 409–420. [Google Scholar] [CrossRef]
  12. Tolessa, T.; Senbeta, F.; Abebe, T. Land use/land cover analysis and ecosystem services valuation in the central highlands of Ethiopia. For. Trees Livelihoods 2017, 26, 111–123. [Google Scholar] [CrossRef]
  13. Groot, R.d.; Brander, L.; Ploeg, S.v.d.; Costanza, R.; Bernard, F.; Braat, L.; Christie, M.; Crossman, N.; Ghermandi, A.; Hein, L.; et al. Global estimates of the value of ecosystems and their services in monetary units. Ecosyst. Serv. 2012, 1, 50–61. [Google Scholar] [CrossRef]
  14. Costanza, R.; de Groot, R.; Sutton, P.; van der Ploeg, S.; Anderson, S.J.; Kubiszewski, I.; Farber, S.; Turner, R.K. Changes in the global value of ecosystem services. Glob. Environ. Chang. 2014, 26, 152–158. [Google Scholar] [CrossRef]
  15. Xie, G.D.; Zhang, C.X.; Zhang, L.M.; Chen, W.H.; Li, S.M. Improvement of the Evaluation Method for Ecosystem Service Value Based on Per Unit Area. J. Nat. Resour. 2015, 30, 1243–1254. [Google Scholar]
  16. Biratu, A.A.; Bedadi, B.; Gebrehiwot, S.G.; Melesse, A.M.; Nebi, T.H.; Abera, W.; Tamene, L.; Egeru, A. Ecosystem Service Valuation along Landscape Transformation in Central Ethiopia. Land 2022, 11, 500. [Google Scholar] [CrossRef]
  17. Fontaine, C.M.; Dendoncker, N.; De Vreese, R.; Jacquemin, I.; Marek, A.; Van Herzele, A.; Devillet, G.; Mortelmans, D.; François, L. Towards participatory integrated valuation and modelling of ecosystem services under land-use change. J. Land Use Sci. 2014, 9, 278–303. [Google Scholar] [CrossRef]
  18. Carpenter, S.R.; Mooney, H.A.; Agard, J.; Capistrano, D.; DeFries, R.S.; Diaz, S.; Dietz, T.; Duraiappah, A.K.; Oteng-Yeboah, A.; Pereira, H.M.; et al. Science for managing ecosystem services: Beyond the Millennium Ecosystem Assessment. Proc. Natl. Acad. Sci. USA 2009, 106, 1305–1312. [Google Scholar] [CrossRef]
  19. Bojie, F.; Dandan, Y. Trade-off analyses and synthetic integrated method of multiple ecosystem services. Resour. Sci. 2016, 38, 1–9. [Google Scholar] [CrossRef]
  20. Jiang, W.; Wu, T.; Fu, B. The value of ecosystem services in China: A systematic review for twenty years. Ecosyst. Serv. 2021, 52, 101365. [Google Scholar] [CrossRef]
  21. Chen, Y.; Li, Z.; Li, P.; Zhang, Y.; Liu, H.; Pan, J. Impacts and Projections of Land Use and Demographic Changes on Ecosystem Services: A Case Study in the Guanzhong Region, China. Sustainability 2022, 14, 3003. [Google Scholar] [CrossRef]
  22. Yan, Y.; Yao, L.Y.; Lang, L.M.; Zhao, M.J. Revaluation of ecosystem services in inland river basins of China:Based on meta-regression analysis. Acta Geogr. Sin. 2019, 74, 1040–1057. [Google Scholar]
  23. Huang, L.; He, C.; Wang, B. Study on the spatial changes concerning ecosystem services value in Lhasa River Basin, China. Environ. Sci. Pollut. Res. 2022, 29, 7827–7843. [Google Scholar] [CrossRef]
  24. Hu, S.; Ma, R.; Sun, Z.; Ge, M.; Zeng, L.; Huang, F.; Bu, J.; Wang, Z. Determination of the optimal ecological water conveyance volume for vegetation restoration in an arid inland river basin, northwestern China. Sci. Total Environ. 2021, 788, 147775. [Google Scholar] [CrossRef]
  25. Huang, F.; Chunyu, X.; Zhang, D.; Chen, X.; Ochoa, C.G. A framework to assess the impact of ecological water conveyance on groundwater-dependent terrestrial ecosystems in arid inland river basins. Sci. Total Environ. 2020, 709, 136155. [Google Scholar] [CrossRef]
  26. Shi, H.; Wang, F.; Bai, Y.; Sun, H.; Ai, J.; Hu, Q.; Zhao, Y.; Yang, E. Evaluation of the Ecosystem Service’s Function in the Lower Reaches of the Shiyang River, Gansu. J. Glaciol. Geocryol. 2009, 31, 1195–1200. [Google Scholar]
  27. Mamat, Z.; Halik, Ü.; Keyimu, M.; Keram, A.; Nurmamat, K. Variation of the floodplain forest ecosystem service value in the lower reaches of Tarim River, China. Land Degrad. Dev. 2018, 29, 47–57. [Google Scholar] [CrossRef]
  28. Li, Q.; Xue, Z.; Chen, H.; Xu, C. Cognitive ecology and payment decision-making behavior based on the theory of CVM in the Tarim River Basin. Resour. Sci. 2016, 38, 1075–1087. [Google Scholar]
  29. Su, X.L.; Kang, S.Z.; Tong, L. A dynamic evaluation method and its application for the ecosystem service value of an inland river basin: A case study on the Shiyanghe River Basin in Hexi Corridor of Gansu Province. Acta Ecol. Sin. 2006, 26, 2011–2019. [Google Scholar]
  30. Wang, Y.; Ding, J.; Li, X.; Zhang, J.; Ma, G. Impact of LUCC on ecosystem services values in the Yili River Basin based on an intensity analysis model. Acta Ecol. Sin. 2022, 42, 3106–3118. [Google Scholar]
  31. Zhang, Z.; Xu, Z.; Cheng, G.; Su, Z. Contingent Valuation of the Economic Benefits of Restoring Ecosystem Services of Zhangye Prefecture of Heihe River Basin. Acta Ecol. Sin. 2002, 22, 885–893. [Google Scholar]
  32. Li, W.; Wumairjiang, W.; Ma, Y.; He, Y.; Wang, J.; Zhu, C. Ecological Water Conveyance Project Based on River-Lake-Reservoir Connected System in the Kongque River. Desert Oasis Meteorol. 2019, 13, 130–135. [Google Scholar] [CrossRef]
  33. Lu, L.; Chen, Y.; Li, X. Effect of ecological water conveyance on groundwater depth and vegetation in the Kongque River. Arid Zone Res. 2021, 38, 901–909. [Google Scholar] [CrossRef]
  34. Fu, A.; Li, W.; Chen, Y.; Liu, Y. Suitable oasis scales under a government plan in the Kaidu-Konqi River Basin of northwest arid region, China. PeerJ 2018, 6, e4943. [Google Scholar] [CrossRef]
  35. Yang, Q.; Xu, C.; Zhang, J.; Luo, Y.; Chen, L. Phenological characteristics of vegetation and its response to climatic change in the Kaidu-Kongqi River basin, Xinjiang, during 2001–2017. Arid Zone Res. 2020, 37, 729–738. [Google Scholar] [CrossRef]
  36. Zhang, J.; Meng, F.; Bao, A.; Li, C.; Qi, X.; Liu, T.; Zhang, P. LUCC Analysis of the Upstream of the Kongqi River, Xinjiang, China. J. Desert Res. 2018, 38, 664–672. [Google Scholar]
  37. Liu, H.; Sun, L.; Lv, W.; Shu, C.; Zhang, H. Evaluation and Change Analysis of Ecosystem Service Value in Erhai Lake Basin Based on Land Use Change. Ecol. Econ. 2022, 38, 147–152. [Google Scholar]
  38. Su, Y.; Zhang, E.; Liu, Y.; Liu, G.; Lin, F. Land-use change and ecological environment effects on Fenhe River Basin. Arid Zone Res. 2022, 39, 968–977. [Google Scholar] [CrossRef]
  39. Xie, G.D.; Zhen, L.; Lu, C.X.; Xiao, Y.; Chen, C. Expert Knowledge Based Valuation Method of Ecosystem Services in China. J. Nat. Resour. 2008, 23, 911–919. [Google Scholar]
  40. Zhang, X.; He, S.; Yang, Y. Evaluation of wetland ecosystem services value of the yellow river delta. Environ. Monit. Assess. 2021, 193, 353. [Google Scholar] [CrossRef]
  41. Fa, Z.; Rusuli, Y.; Tuersun, A. Spatio-temporal change of ecosystem service value in Bosten Lake Watershed based on land use. Acta Ecol. Sin. 2021, 41, 5254–5265. [Google Scholar]
  42. Zhang, S.; Wang, Y.; Xia, T.; Chang, X.; Li, Z. Effects of land use/cover change on ecosystem service value under the ecological water conveyance of Tarim River. Arid Land Geogr. 2021, 44, 739–749. [Google Scholar]
  43. Tolessa, T.; Senbeta, F.; Kidane, M. The impact of land use/land cover change on ecosystem services in the central highlands of Ethiopia. Ecosyst. Serv. 2017, 23, 47–54. [Google Scholar] [CrossRef]
  44. Junguo, L.; Chuanfu, Z.; Shiying, T.; Jianguo, L.; Hong, Y.; Shaofeng, J.; Liangzhi, Y.; Bo, L.; Miao, Z. Water conservancy projects in China: Achievements, challenges and way forward Glob. Environ. Chang. 2013, 23, 633–643. [Google Scholar] [CrossRef]
  45. Zhang, J.; Li, J.; Bao, A.; Bai, J.; Liu, T.; Huang, Y. Effectiveness assessment of ecological restoration of Populus euphratica forest in the Tarim River Basin during 2013–2020. Arid Land Geogr. 2022, 45, 1824–1835. [Google Scholar]
  46. Zhou, H.; Chen, Y.; Yang, Y.; Zhu, C. Effects of ecological water conveyance on the growth characteristics of Populus euphtatica in the lower reaches of Tarim River based on tree-rings. Arid Land Geogr. 2021, 44, 643–650. [Google Scholar]
  47. Guo, H. Analysis of the Impact of the Ecological Water Delivery Project on the Change of Groundwater Level in the Lower Reaches of the Tarim River. Northwest Hydropower 2020, 185, 29–32. [Google Scholar]
  48. Li, N.; Wang, J.; Wang, H.; Fu, B.; Chen, J.; He, W. Impacts of land use change on ecosystem service value in Lijiang River Basin, China. Environ. Sci. Pollut. Res. 2021, 28, 46100–46115. [Google Scholar] [CrossRef]
  49. Abulizi, A.; Yang, Y.; Mamat, Z.; Luo, J.; Abdulslam, D.; Xu, Z.; Zayiti, A.; Ahat, A.; Halik, W. Land-Use Change and its Effects in Charchan Oasis, Xinjiang, China. Land Degrad. Dev. 2016, 28, 106–115. [Google Scholar] [CrossRef]
  50. Zhu, W.; Gao, Q.; Duan, M.; Guo, Y.; Li, Y.; Wan, Y.; Bian, D.; Wei, L. Ecological Capital Assessment for the Alpine Grassland Ecosystem in the Northwest Alpine Pastoral Area of Tibet. J. Nat. Resour. 2011, 26, 419–428. [Google Scholar]
  51. Ma, X.; Zhang, H. Land-Use/Land-Cover Change and Ecosystem Service Provision in Qinghai Province, China: From the Perspective of Five Ecological Function Zones. Land 2023, 12, 656. [Google Scholar] [CrossRef]
  52. Zhao, J.; Liu, S.; Wang, Z.; Gao, H.; Feng, S.; Wei, B.; Hou, Z.; Xiao, F.; Jing, L.; Liao, X. The Impact of Land Use and Landscape Pattern on Ecosystem Services in the Dongting Lake Region, China. Remote Sens. 2023, 15, 2228. [Google Scholar] [CrossRef]
Figure 1. Schematic diagram of the study.
Forests 14 01028 g001
Figure 2. Vegetation on both sides of the Konqi River channel.
Forests 14 01028 g002
Figure 3. Map of land use types in the upper reaches of the typical Konqi River Basin in (a) 2013 and (b) 2020.
Forests 14 01028 g003
Figure 4. Map of land use types in the lower reaches of the typical Konqi River Basin in (a) 2013 and (b) 2020.
Forests 14 01028 g004
Figure 5. Typical Konqi River Basin land use transfer matrix map: (a) upper reaches and (b) lower reaches.
Forests 14 01028 g005
Figure 6. Spatial distribution of ESV in the upper reaches of the typical Konqi River Basin in (a) 2013 and (b) 2020.
Forests 14 01028 g006
Figure 7. Spatial distribution of ESV in the lower reaches of the typical Konqi River Basin in (a) 2013 and (b) 2020.
Forests 14 01028 g007
Figure 8. Scatterplot of local Moran’s index in the upper reaches of the typical Konqi River Basin in (a) 2013 and (b) 2020.
Forests 14 01028 g008
Figure 9. Scatterplot of local Moran’s index in the lower reaches of the typical Konqi River Basin in (a) 2013 and (b) 2020.
Forests 14 01028 g009
Figure 10. Analysis of hot spots in the upper reaches of the typical Konqi River Basin in (a) 2013 and (b) 2020.
Forests 14 01028 g010
Figure 11. Analysis of hot spots in the lower reaches of the typical Konqi River Basin in (a) 2013 and (b) 2020.
Forests 14 01028 g011
Table 1. Table of ecosystem value coefficients of each land use type in the study area (Yuan/(hm2-a)).
Land Use TypeEcosystem TypeEcosystem Service Value Coefficient
FPRMGRCRHRWTSCBMALP
CroplandFarmland526.12205.19378.81510.34405.11731.31773.40536.6489.44
ForestForest173.621567.842272.842141.312151.83904.932115.002372.801094.33
GrasslandGrassland226.23189.40789.18820.75799.70694.481178.51983.84457.72
WaterWater body 278.84184.14268.321083.819875.267812.88215.711804.592335.97
Unused landDesert10.5221.0431.5768.4036.83136.7989.44210.45126.27
SettlementTown000000000
Note: FP (food production); RM (raw materials); GR (gas regulation); CR (climate regulation); HR (hydrology regulation); WT (waste treatment); SC (soil conservation); BM (biodiversity maintenance); ALP (aesthetic landscape provision).
Table 2. Percentage of the land use area and dynamic degree in the typical Konqi River Basin upper reaches.
River BasinUpper Reaches
Area Percentage (2013)Area Percentage (2020)Rate of ChangeSingle Land Use Dynamic Degree
Grassland8.49%2.84%−66.61%−0.1
Roads0.87%6.08%594.94%0.85
Cropland68.33%57.61%−15.69%−0.02
Shrub land5.08%8.86%74.54%0.11
Settlement3.52%1.78%−49.30%−0.07
Unused land8.01%13.51%68.81%0.1
Forest0.31%1.44%371.38%0.53
Artificial forestland2.31%5.52%138.81%0.2
Water3.09%2.35%−23.83%−0.03
Table 3. Percentage of the land use area and dynamic degree in the typical Konqi River Basin lower reaches.
River BasinLower Reaches
Area Percentage (2013)Area Percentage (2020)Rate of ChangeSingle Land Use Dynamic Degree
Grassland3.77%7.73%105.15%0.15
Roads0.08%0.35%323.72%0.46
Cropland8.63%6.89%−20.10%−0.03
Shrub land9.48%11.37%19.92%0.03
Settlement0.15%0.06%−59.27%−0.08
Unused land73.42%70.46%−4.04%−0.01
Forest0.05%1.55%2841.20%4.06
Artificial forestland————————
Water4.42%1.58%−64.29%−0.09
Table 4. Value of each ecosystem service from 2013 to 2020 in typical Konqi River Basin (per ten thousand Yuan (CNY)).
BasinYearEcosystem Service Value
FP RM GR CR HR
Upper reaches20132218.74 1570.97 2826.75 3437.85 4522.96
20201906.26 2093.44 3375.37 3817.63 4608.81
Variation value312.48 −522.47 −548.62 −379.78 −85.85
Lower reaches2013716.17 1737.26 2726.55 3189.02 5910.55
2020672.00 1902.03 3109.84 3364.27 4195.77
Variation value44.17 −164.77 −383.29 −175.25 1714.78
Typical Konqi River Basin20132934.91 3308.23 5553.29 6626.87 10,433.51
20202578.25 3995.47 6485.21 7181.90 8804.57
Variation value356.65 −687.24 −931.91 −555.03 1628.93
BasinYearEcosystem Service Value
WTSCBMALPTotal
Upper reaches20134866.96 4448.81 3898.10 1472.67 29,263.80
20204346.78 4590.88 4329.20 1711.53 30,779.89
Variation value520.18 −142.07 −431.10 −238.86 −1516.09
Lower reaches20134872.48 3267.58 4494.61 2640.76 29,554.97
20203364.54 3696.70 4553.77 2357.56 27,216.48
Variation value1507.94 −429.12 −59.16 283.20 2338.50
Typical Konqi River Basin20139739.45 7716.38 8392.71 4113.43 58,818.77
20207711.33 8287.58 8882.97 4069.09 57,996.36
Variation value2028.12 −571.19 −490.26 44.34 822.41
Note: FP (food production); RM (raw materials); GR (gas regulation); CR (climate regulation); HR (hydrology regulation); WT (waste treatment); SC (soil conservation); BM (biodiversity maintenance); ALP (aesthetic landscape provision).
Table 5. Total ecosystem service values for each land use and land cover type and changes from 2013 to 2020 in the typical Konqi River Basin (per ten thousand Yuan (CNY)).
BasinYearEcosystem Service Value
CroplandForestGrasslandWaterUnused LandSettlementTotal
Upper reaches201315,693.08 6290.23 2881.25 4075.72 323.53 029,263.80
202013,231.42 12,936.10 961.96 3104.27 546.14 030,779.89
Variation value2461.67 −6645.87 1919.29 971.44 −222.61 0−1516.09
Lower reaches20132738.17 12,904.02 1767.11 8046.01 4099.67 029,554.97
20202187.87 14,596.00 3625.21 2873.37 3934.02 027,216.48
Variation value550.29 −1691.98 −1858.11 5172.64 165.65 02338.50
Typical Konqi River Basin201318,431.25 19,194.25 4648.35 12,121.72 4423.20 058,818.77
202015,419.29 27,532.10 4587.18 5977.64 4480.16 057,996.36
Variation value3011.96 −8337.85 61.18 6144.08 −56.96 0822.41
Table 6. Ecosystem services (ES) and coefficient of sensitivity (CS) after adjusting ES valuation coefficients (VC) in the typical Konqi River Basin.
BasinYearSensitivity Index of Ecosystem Service Value
CroplandForestGrasslandWaterUnused LandSettlement
Upper reaches20130.536 0.215 0.098 0.139 0.011 0.000
20200.430 0.420 0.031 0.101 0.018 0.000
Lower reaches20130.093 0.437 0.060 0.272 0.139 0.000
20200.080 0.536 0.133 0.106 0.145 0.000
Typical Konqi River Basin20130.313 0.326 0.079 0.206 0.075 0.000
20200.266 0.044 0.079 0.103 0.077 0.000
Disclaimer/Publisher’s Note: The statements, opinions and data contained in all publications are solely those of the individual author(s) and contributor(s) and not of MDPI and/or the editor(s). MDPI and/or the editor(s) disclaim responsibility for any injury to people or property resulting from any ideas, methods, instructions or products referred to in the content.

