Article

Should Government Play a Strict or Lenient Role? An Evolutionary Game Analysis of Implementing the Forest Ecological Bank Policy

1
School of Public Administration, Guangxi University, No 100, Da Xue Road, Nanning 530004, China
2
China Center for Agricultural Policy (CCAP), School of Advanced Agricultural Sciences, Peking University, No 5, Yi He Yuan Road, Beijing 100871, China
3
Department of City and Regional Planning, University of North Carolina at Chapel Hill, Chapel Hill, NC 27599, USA
*
Author to whom correspondence should be addressed.
Forests 2023, 14(5), 1002; https://doi.org/10.3390/f14051002
Submission received: 21 March 2023 / Revised: 4 May 2023 / Accepted: 9 May 2023 / Published: 12 May 2023
(This article belongs to the Section Forest Economics, Policy, and Social Science)

Abstract

:
As one of the specific practices of natural resource index trading, the forest ecological bank policy (FEB) is essentially a market-based tool. With the deepening of ecological governance, the FEB policy has also become the main method chosen to solve the economic development problems in ecologically rich “low-lying” areas. However, in the process of implementing the FEB policy, the differences in the demands of various stakeholders were found to have led to a complex game phenomenon, resulting in deviations in policy implementation. This study constructs a multiplayer evolutionary game model between local governments and enterprises of different scales and analyzes the evolutionary stabilization strategy (ESS) in the implementation of the FEB policy. The results show that, under different conditions, there are three stabilization strategies in the evolutionary game system, these correspond to F1 (0, 0, 0), F4 (0, 1, 1), and F5 (1, 0, 0), respectively, the implications are that the strict government role with an active regulatory strategy leads to companies of different sizes refusing to participate (i.e., F5) and the lax government role with a negative regulatory strategy leads to companies of different sizes refusing to participate (i.e., F1) or choosing to participate (i.e., F4). Among them, the strict government role stimulates the companies to participate in the FEB policy through the high intensity of government regulation. In addition, as the policy continues to be implemented, the influence of the strict regulation on the “participation” behavior of the companies decreases. Conversely, the lax government role allows the companies to give full play to their autonomy and obtain higher ecological and environmental benefits.

1. Introduction

As a concrete form of natural resource index trading, the forest ecological banking (FEB) policy plays an important role in achieving ecological transformation and promoting the realization of ecological product value. Such policies are increasingly favored by governments around the world. However, in the process of policy implementation, governments and enterprises (as the core subjects) make strategic choices based on maximizing their own interests. This causes the direction of the policy to deviate from its original implementation purpose [1,2,3]. The extent to which the government resolves the deviations is the key to measuring the success of the policy. Natural resource index trading provides new ideas for limiting the ecological losses caused by project development and for improving resource allocation efficiency. This is achieved by transforming ecological resources into advantages and thus obtaining development opportunities and achieving an ecological and economic win-win situation [4]. Similar to the FEB, indicator trading includes land development rights trading. Specifically, the transfer of development rights is obtained from farmers engaged in conservation farming; the rights are shifted to key development zones [5,6,7]. Examples include water abstraction rights trading, where some or all water rights are shifted from economically inefficient but water-rich regions to highly efficient but relatively water-poor regions, depending on the extent of water flows [8,9]. There are also carbon trading mechanisms, such as emissions reduction and the sale of emission right indicators by environmental protection enterprises to heavy-polluting industrial enterprises with excessive carbon emissions [10,11,12]. The “forest bank” centralizes the management and use rights of fragmented forests to the demand side for centralized development [13,14]. However, the above are also all property rights trading, in which case the government controls and sets limits to create market demand [15]. The rights trading transactions are essentially property transactions in which the government controls and sets limits to create market demand [15]. Therefore, as representatives of the public interest [16,17], the government’s role is to guide the operation of the policy and promote the policy to make it effective [17]. The role of government, therefore, as a representative of the public interest [16,17], is to guide the operation of policies and to promote their effective implementation [17]. Determining the role the government plays to effectively promote the smooth implementation of policies becomes the key to research. In the process of implementing the policy, the government will adjust the composition of its role according to the different stages of the policy development, so as to mobilize the participation of other subjects related to the implementation of the policy and ensure that the forest ecological bank policy continues to operate and function, providing a practical guide for the government to dynamically manage the policy implementation process.
The FEB policy realization process is multidimensional, complex, and interactive [2,18]. Among the parties to this process, the government and companies, as the direct policy implementation subjects, have obvious conflicts of interest due to the difference in their respective objectives. In order to facilitate the implementation of the FEB policy, the game relationship must be coordinated between multiple parties [19]. Due to the asymmetry of information, the participants are finite rational in the government and in each company in the interaction of interests. Therefore, an evolutionary game is a suitable theoretical tool that can be used to study the dynamic game process based on finite rationality. At present, evolutionary game theory is usually used to study how the government’s decisions and regulatory behavior cause the behavior changes in other participants. The aim is to finally reach a stable strategy to maximize the benefits for both parties. For example, a differential game model is used to study the optimal strategy of maximizing an enterprise’s revenue under government intervention. Dynamic game theory is used to analyze different government policies and how enterprises should respond [20]. For example, Shan et al. constructed a three-party evolutionary game model that included the government, fishermen, and consumers. The model was used to explore the impact of the strength of government subsidies for carbon sink fisheries on the game stabilization system, so as to optimize the government subsidy policy [21]. Yong et al. built a tripartite game model that included local government, tourism enterprises, and residents. This model was used to investigate how changes in the government’s disciplinary and incentive measures with regard to the participation behavior of enterprises and residents in the policy would affect the achievement of the steady state of the game [3]. Jun et al. explored how government incentives facilitate the realization of a dynamic pricing mechanism in the electricity retailing industry. The study used a dynamic game model with regulators, electricity retailers, and consumers [22]. The above studies discuss the positive as well as negative effects of the government’s regulatory scale (as the dominant party of policy) on the influence of the behavior of firms and other related agents. All the studies urge the government to make effective policy improvements and incentivize firms to act innovatively.
Exploring the impact of government regulatory behavior on the steady-state strategy of policy implementation has been the focus of numerous scholars’ research on policy effects. However, few scholars have studied policies related to trading natural resource indicators that have been constructed based on market mechanisms. In order to fill this gap, this study focuses on the forest eco-silver policy, innovatively constructed internal and external trading mechanisms, reasonable assumptions are made about the actual operation mechanism of indicator trading and the realistic implementation situation, and a tripartite evolutionary game model is established between the government and Enterprises A and B. This study also addresses how the choice of the government’s role affects the participation of companies and how interesting cooperation and competition exist between enterprises of different scales. The effective implementation of the forest ecological bank policy has provided the forestry sector with a new way of thinking about using market-based instruments to develop the value of forest resources in a sustainable manner, while at the same time using the combination of government administrative controls and market instruments, to achieve value-added forest ecological products based on the restoration of the forest ecological landscape and the restoration of forest ecological functions. As a result, the forest ecological bank policy has become an important practical approach to sustainable forest management. The rest of the paper is structured as follows: Section 2 presents the operational mechanism of forest eco-banking and the construction of the evolutionary game model. Section 3 presents the stability analysis of the evolutionary game model. Section 4 gives numerical simulations of the evolutionary game model. The effects of different initial probabilities on the evolutionary stabilization strategy (i.e., ESS) are explored, as well as the effects of key behavioral factors on ESS under different government roles. Section 5 contains the discussion; conclusions and policy recommendations are presented in Section 6.

2. Evolutionary Game Analysis of the FEB Policy

2.1. The Operating Mechanism of the FEB

Similar to commercial banks, the FEB uses a decentralized input and centralized output model to integrate loose ecological resources into high-quality assets. Under this core concept, the government sets the stage and the enterprises participate. The goal is to establish a sustainable ecological bank “platform” that serves as a link to external markets (see Figure 1).
The local government, as the leading party, has established a mostly government-owned ecological bank “platform” around the idea of trading natural resource indicators. This is the core component of the internal trading market involving relevant enterprises. The internal market consists of two types of supply and demand transactions. First, the “platform” acts as the demand side, acquiring the management and use rights of forest resources according to the national standard price. Meanwhile, the farmers sell the management and use rights of forest resources through redemption, lease, trusteeship, and shareholding to obtain economic benefits. Second, enterprises of different scales trade the forest resources that are difficult to develop or those that are unexplored. In the whole process, the government, as the controlling party of the “platform”, performs a supervisory function, incentivizes enterprises to participate in the FEB “platform” by giving subsidies and penalties, and expands that “platform”.
The development of the external trading market relies on the establishment and development of the internal trading market. With the expansion of the scale of internal trading, an external trading market (with forestry carbon sink products as the trading content) is gradually formed [23]. Emission-controlling enterprises, as the main demand side, purchase forestry carbon sink products from the supply side (the eco-banking “platform”) to achieve carbon emission quota standards. Individuals gradually become an important component of the demand side, seeking to achieve their carbon-neutral goals. The sale of forestry carbon sink products is now becoming the main business of the “platform”.
The establishment and improvement of the internal and external trading markets will lead to the formation of an intra-regional cycle and an extra-regional cycle. The FEB “platform” serves as an important hub of the cycle, stimulating the high-quality development of the local green economy. Green financial products, forestry carbon sink products, and forest ecological products all become an important source of income for local finance.

2.2. Model Description

The effectiveness of the FEB policy implementation is influenced by factors such as collective or individual information asymmetry and an irrational understanding of the policy [24,25]. It is also difficult to conduct a relatively accurate study via traditional static game theory. Compared to traditional game theory, which is based on the assumption of the participants’ complete rationality, evolutionary game theory assumes that people have a limited ability to perceive, cognize, and communicate information about things, i.e., they have finite rationality [26,27,28,29]. In other words, subjects play repeatedly around maximizing the benefits of the final strategy.
Therefore, this study applies the evolutionary game approach to mimic the game among subjects. This study also argues that the realization of the final evolutionary stable strategy by individuals through imitation, trial, and error is the result of those individuals’ repeated imitation, trial, and error. Therefore, this paper illustrates the game relationship between local governments and two companies of different sizes; importantly, both have forest resource development as their main business. The game relationship is used to study the impact of government strategies on the promotion of FEB policies, and the game relationship is as follows in Figure 2.
(1)
The dynamic game between government and companies
Companies that mainly develop forest resources form an important link to the successful implementation of the FEB policy. These companies’ choice of forest resource development model is a prerequisite for achieving win-win ecological and economic benefits. However, as the development costs increase after participating in the FEB policy, it is difficult for the companies to achieve economic growth in the short term, and thus, they show an instinctive resistance to the policy. Faced with high R&D and labor costs, companies are less willing to participate in the policy. Therefore, the government should play a pioneering role in policy implementation and adopt regulatory strategies (including penalties and subsidies) to supervise the relevant forestry companies and encourage them to actively participate in the policy.
When the relevant company chooses to participate in the policy, carbon sink revenue (S) (with emission control companies as the main demand side) will become one of the main revenue streams. At the same time, the company gains additional benefits (V) from policy participation, i.e., increased business cooperation opportunities and social influence. The government will also receive corresponding environmental and social benefits (E). Conversely, under active government supervision, companies that refuse to participate in the policy are required to pay a fine to the government (P). The cost of active government monitoring is CG1, and the cost of negative government monitoring and the cost of rewarding the media for truthful reporting is CG2 (CG1 > CG2). The expected benefits to the government and to the firm are related to the probability (θ) of media monitoring of the firm’s participation.
(2)
The dynamic game between forestry enterprises
Cooperation among forest companies effectively reduces the growing costs of R&D and conservation that would typically result from participation in the policy. However, if some companies refuse to participate in the policy, their lack of participation will lead to higher costs just for the participating companies alone, even though the non-participating companies also benefit from the increased ecological benefits of the improved forest resource development model. Therefore, companies that refuse to participate in the FEB need to subsidize the participating companies.
Thus, the three subjects involved in the game are the local government, firm A, and firm B. The government, as the regulator, has two regulatory strategies: active regulation and negative regulation. Companies A and B are in the same industry and have two behavioral strategies: participating or refusing to participate in the FEB policy. Here, a circular diagram is used to represent the eight scenarios of the whole game system. Each of the eight closed loops represents a different combination of the three subjects’ strategies, i.e., the set of eight strategies, as shown in Figure 3.

2.3. Base Assumptions and Parameter Settings

Combining the investigation into the current status of FEB policy implementation, this study proposes the following hypotheses, based on the theory of limited rationality combined with cost-benefit analysis:
(1)
In the evolutionary game system, the three stakeholders are finite and rational, and all start with the goal of maximizing their own benefits. With limited policy knowledge and limited decision-making information, each player continuously adjusts its strategic choices around the actions of other stakeholders. When the government implements regulatory strategies with a negative attitude, media reports become an important channel for companies to understand the progress of ecological bank policy implementation.
(2)
First, the probability that the local government will choose a positive regulatory strategy is x, and the probability that it will choose a negative regulation strategy is 1 − x. Second, the probability that company A will choose to participate in the FEB policy is y, and the probability that it will choose to refuse to join is 1 − y. Third, the probability that company B will choose to participate in the policy is z, and the probability that it will choose to refuse to participate is 1 − z. It is worth noting that 0 ≤ x ≤ 1, 0 ≤ y ≤ 1, and 0 ≤ z ≤ 1.
(3)
Cooperation mechanisms exist between companies, where companies in the same industry reduce the additional costs of joining the FEB policy by establishing cooperation. Meanwhile, the revenue and costs of each company are proportional to that company’s size.
In conjunction with the proposed hypotheses, see Appendix A for the specific parameter settings.

2.4. Evolutionary Game Analysis That Replicates Dynamic Equations

By calculation, this study derives the revenue matrix of the evolutionary game with three subjects of active and negative government regulation. The expected revenues of the local government, firm A, and firm B are represented by the functions in Table 1.
Here, Ubs is used to denote the payoffs of stakeholder (b) in the evolutionary game under different strategies (s), where b = G, A, B represent the local government, firm A, and firm B participating in the FEB policy, respectively, and s = C, D represent positive and negative regulation, respectively. For example, UGC represents the expected benefits obtained by the local government after choosing the positive regulation strategy. Conversely, UGD represents the expected benefits of the government after choosing the negative regulation strategy.
The replication dynamic equation expresses the dynamic process of the group selection of dominant strategies using dynamic differential equations. In combination with the payment matrix, this study developed replication dynamic equations for strategy selection by three parties in combination with expected returns.
(1)
The equations for the replication dynamics of “active regulation” (C) and “negative regulation” (D) of local governments are as follows:
U G C = y ( E G A P A ) + z ( E G B P B ) + P A + P B C G 1
U G D = ( y θ θ + 1 ) E G A + ( z θ θ + 1 ) E G B + θ ( 1 y ) P A + θ ( 1 z ) P B + θ ( y + z 2 ) C G 2 .
U G C = y ( E G A P A ) + z ( E G B P B ) + P A + P B C G 1
The replication dynamic equation for the government’s choice of an active regulatory strategy is obtained as:
G ( x ) = d x d t = x ( U 11 U 1 ¯ ) = x ( 1 x ) [ ( y 1 ) ( 1 θ ) E G A + ( z 1 ) ( 1 θ ) E G B + ( 1 y ) ( 1 θ ) P A + ( 1 z ) ( 1 θ ) P B C G 1 + θ ( 2 y z ) C G 2 ]
Of these, the U G ¯ is the average expected return of local governments implementing positive and negative regulatory strategies,   d x d t ; that is, the rate of change over time in the strategic probability of local governments choosing positive regulation. When G ( x ) = 0 , three solutions exist that are replicating the dynamic equation in a steady state: x = 0, 1; see the equation given in Box 1.
Box 1. Solution of the equation. 
y = ( θ 1 ) E G A + ( 1 θ ) P A + z 1 ( 1 θ ) E G B + ( 1 z ) ( 1 θ ) P B C G 1 + θ ( 2 z ) C G 2 ( θ 1 ) E G A + ( 1 θ ) P A + θ C G 2 z = ( θ 1 ) E G B + ( 1 θ ) P B + y 1 ( 1 θ ) E G A + ( 1 y ) ( 1 θ ) P A C G 1 + θ ( 2 y ) C G 2 ( θ 1 ) E G B + ( 1 θ ) P B + θ C G 2
(2)
The equations for the replication dynamics of “participation policy” (P) and “refusal to participate” (R) for company A are as follows:
U A P = T A + S A + V A Q A + ( 1 z ) n .
U A R = T A + ( θ x θ x ) P A m z .
U A ¯ = y U A P + 1 y U A R
The replication dynamic equation for firm A’s choice to participate in the ecological bank policy is obtained:
A ( y ) = d y d t = y ( U 21 U 2 ¯ ) = y ( 1 y ) [ S A + V A Q A + ( θ + x θ x ) P A + ( 1 z ) n + m z ] .
where U A ¯ is the average expected return of whether firm A participates in the forest eco-banking policy, the d y d t , i.e., the rate of change over time in the probability of firm A choosing to participate in the policy strategy. When A ( y ) = 0 , three solutions exist that are replicating the dynamic equation in a steady state, y = 0, 1. x = S A + V A Q A + θ P A + 1 z n + m z ( θ 1 ) P A .
U B P = ( 1 y ) m + T B + S B + V B Q B
(3)
The equations for the replication dynamics of “participation policy” (P) and “refusal to participate” (R) for firm B are as follows:
U B R = ( x θ x θ ) P B n y + T B
U B ¯ = z U B P + ( 1 z ) U B R
The replication dynamic equation for firm B’s choice to participate in the FEB policy is obtained:
B ( z ) = d z d t = z ( U 31 U 3 ¯ ) = z ( 1 z ) [ S B + V B Q B + ( θ + x θ x ) P B + ( 1 y ) m + n y .
where U B ¯ is the average expected return for firm B’s two strategic choices, the d z d t ; that is, the rate of change over time in the probability of firm B’s choice of participation policy strategy. When B ( z ) = 0 , three solutions exist that keep the replication dynamic equation in a steady state: z = 0, 1. x = S B + V B Q B + θ P B + 1 y n + m y ( θ 1 ) P B .

3. Evolutionary Game Stability Analysis

In this paper, the stability of the equilibrium point is investigated by constructing a Jacobi matrix to derive the eigenvalues. The Jacobi matrix of the above replicated dynamic system is J, the values in the Jacobian matrix are shown in Appendix B.
J = [ G ( x ) x G ( x ) y G ( x ) z   x A ( y ) y A ( y ) z B ( z ) x B ( z ) y B ( z ) z ]
To expand this point, the stability of the equilibrium point is determined by judging the positive and negative eigenvalues (λ) of the Jacobi matrix. Thus, the following cases exist: when all eigenvalues are positive, the equilibrium point is unstable, and vice versa. When some eigenvalues are positive and some eigenvalues are negative, the equilibrium point is a saddle point. Eight local equilibrium points were obtained by setting the replication kinetic equations of each subject to 0: E1 (0, 0, 0), E2 (0, 0, 1), E3 (0, 1, 0), E4 (0, 1, l), E5 (1, 0, 0), E6 (1, 0, 1), E7 (1, 1, 0), and E8 (1, l, 1), and substituting each point into the Jacobi matrix in the above equations. Based on these assumptions, the positive and negative characteristics of the eigenvalues at the local equilibrium points were determined, as shown in Table 2.
As shown in Table 3, the conditions for reaching local stability at the equilibrium point have been analyzed, and the following findings have been made: if government fines, subsidies, and additional benefits are greater than the cost of implementing the FEB policy, local companies will not participate in the FEB. Conversely, companies will participate in the FEB policy when the sum of the costs and social benefits of negative government regulation avoidance exceeds the sum of fines borne by the two companies without implementation. In this case, the government chooses negative regulation. Otherwise, the government will actively regulate. Under the government’s negative regulation, companies A and B will still participate in the implementation of the FEB policy. At this time, the government obtains the maximum expected benefit. In order to achieve the optimal equilibrium state of policy evolution, the participating subjects will choose and change their strategies according to the actual situation.
Based on the nature of ESS and the stability theorem of differential equations, the ESS point is robust to small perturbations. In other words, the game system is in an evolutionary stable strategy (ESS) when it satisfies the condition that F(x) = 0 and F′(x) < 0. Based on this theory, this paper first analyzes the stability of the governmental behavior strategy and puts forward the following propositions:
Proposition 1
(1) 
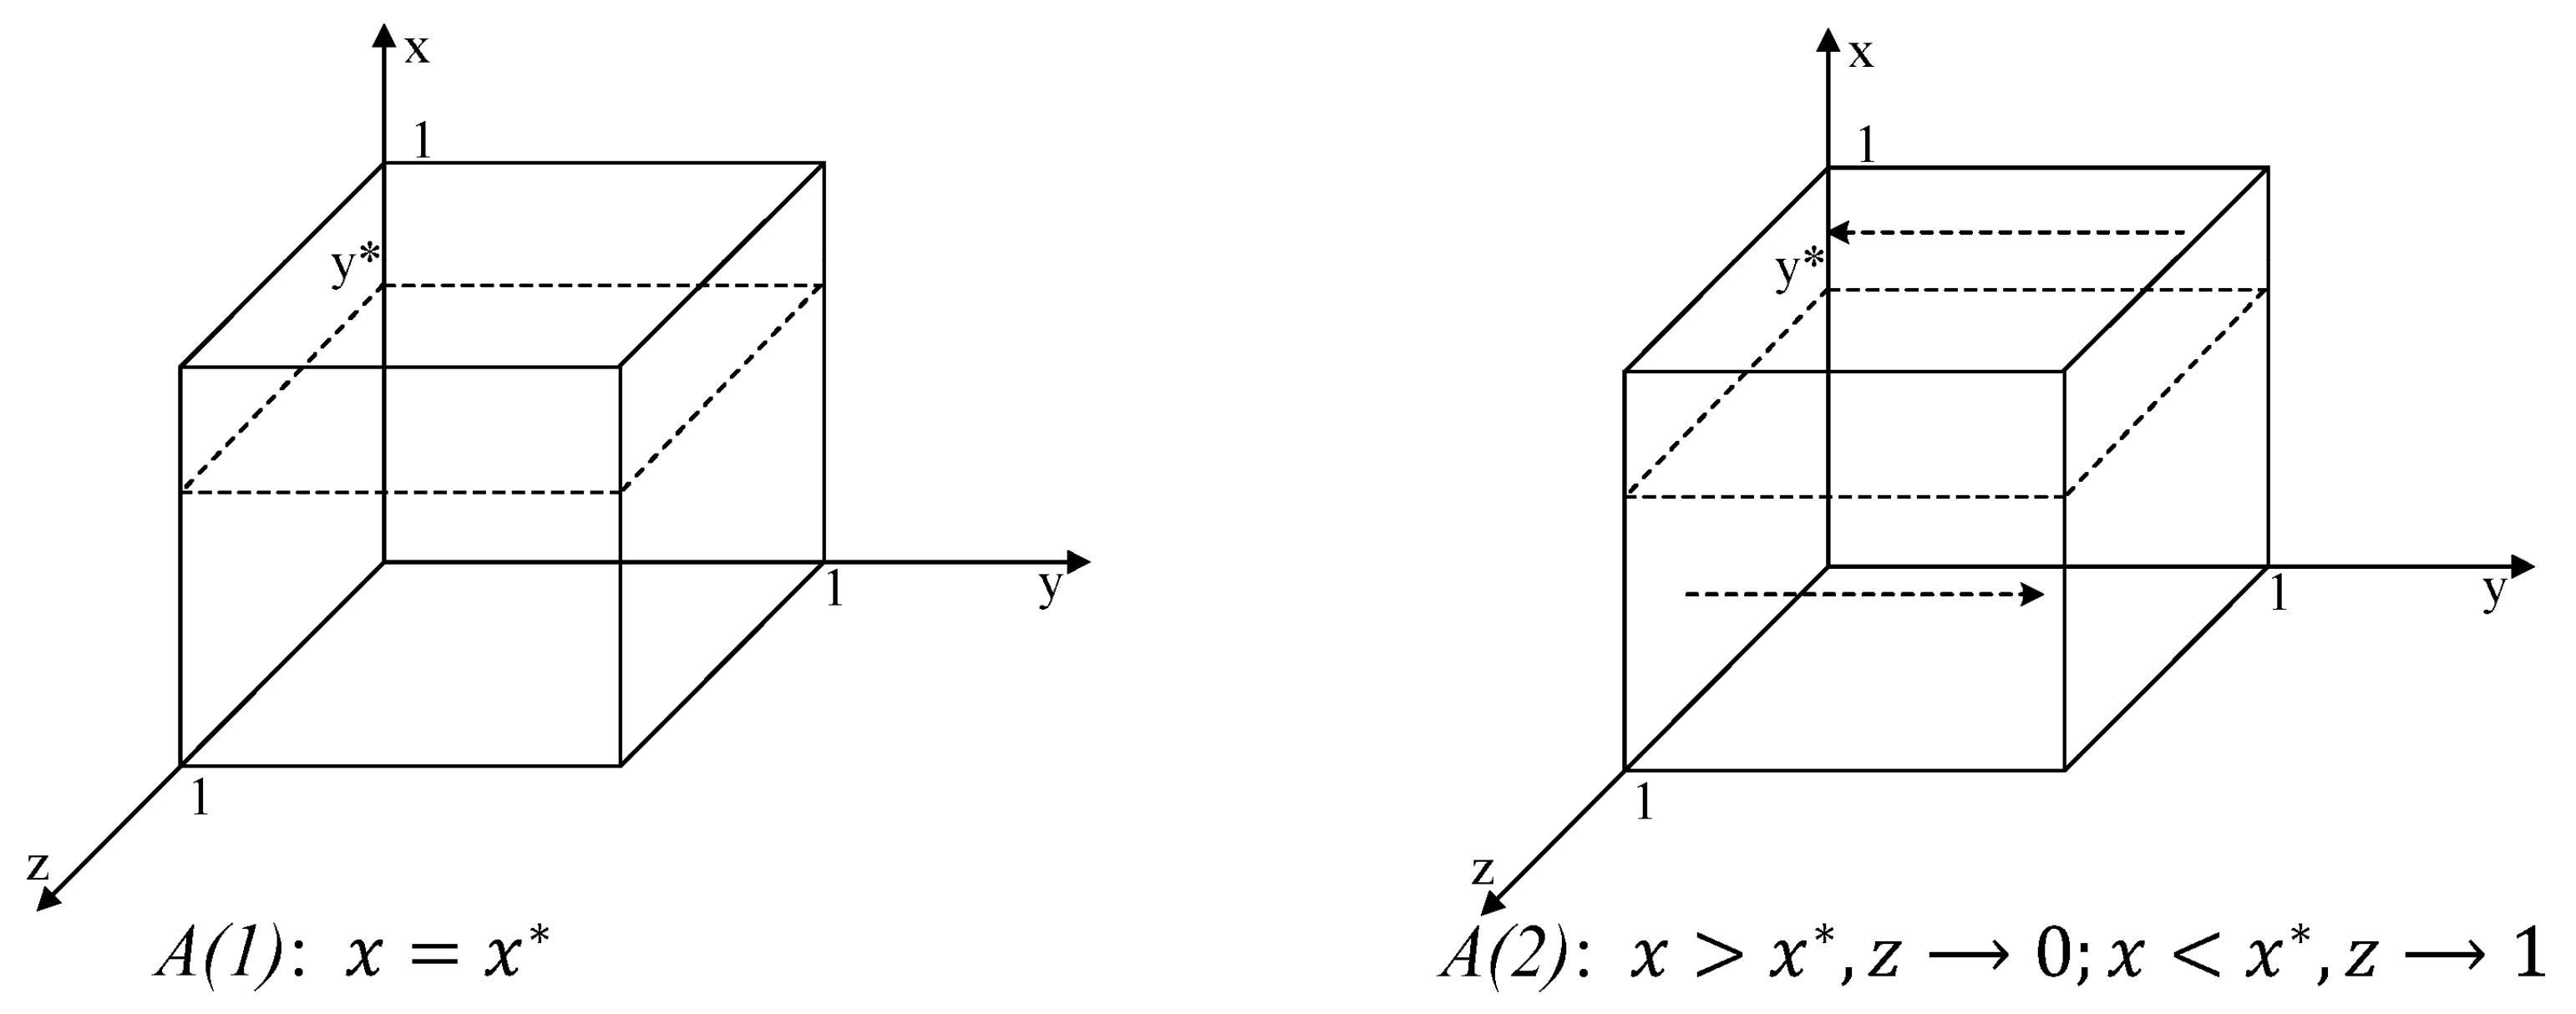
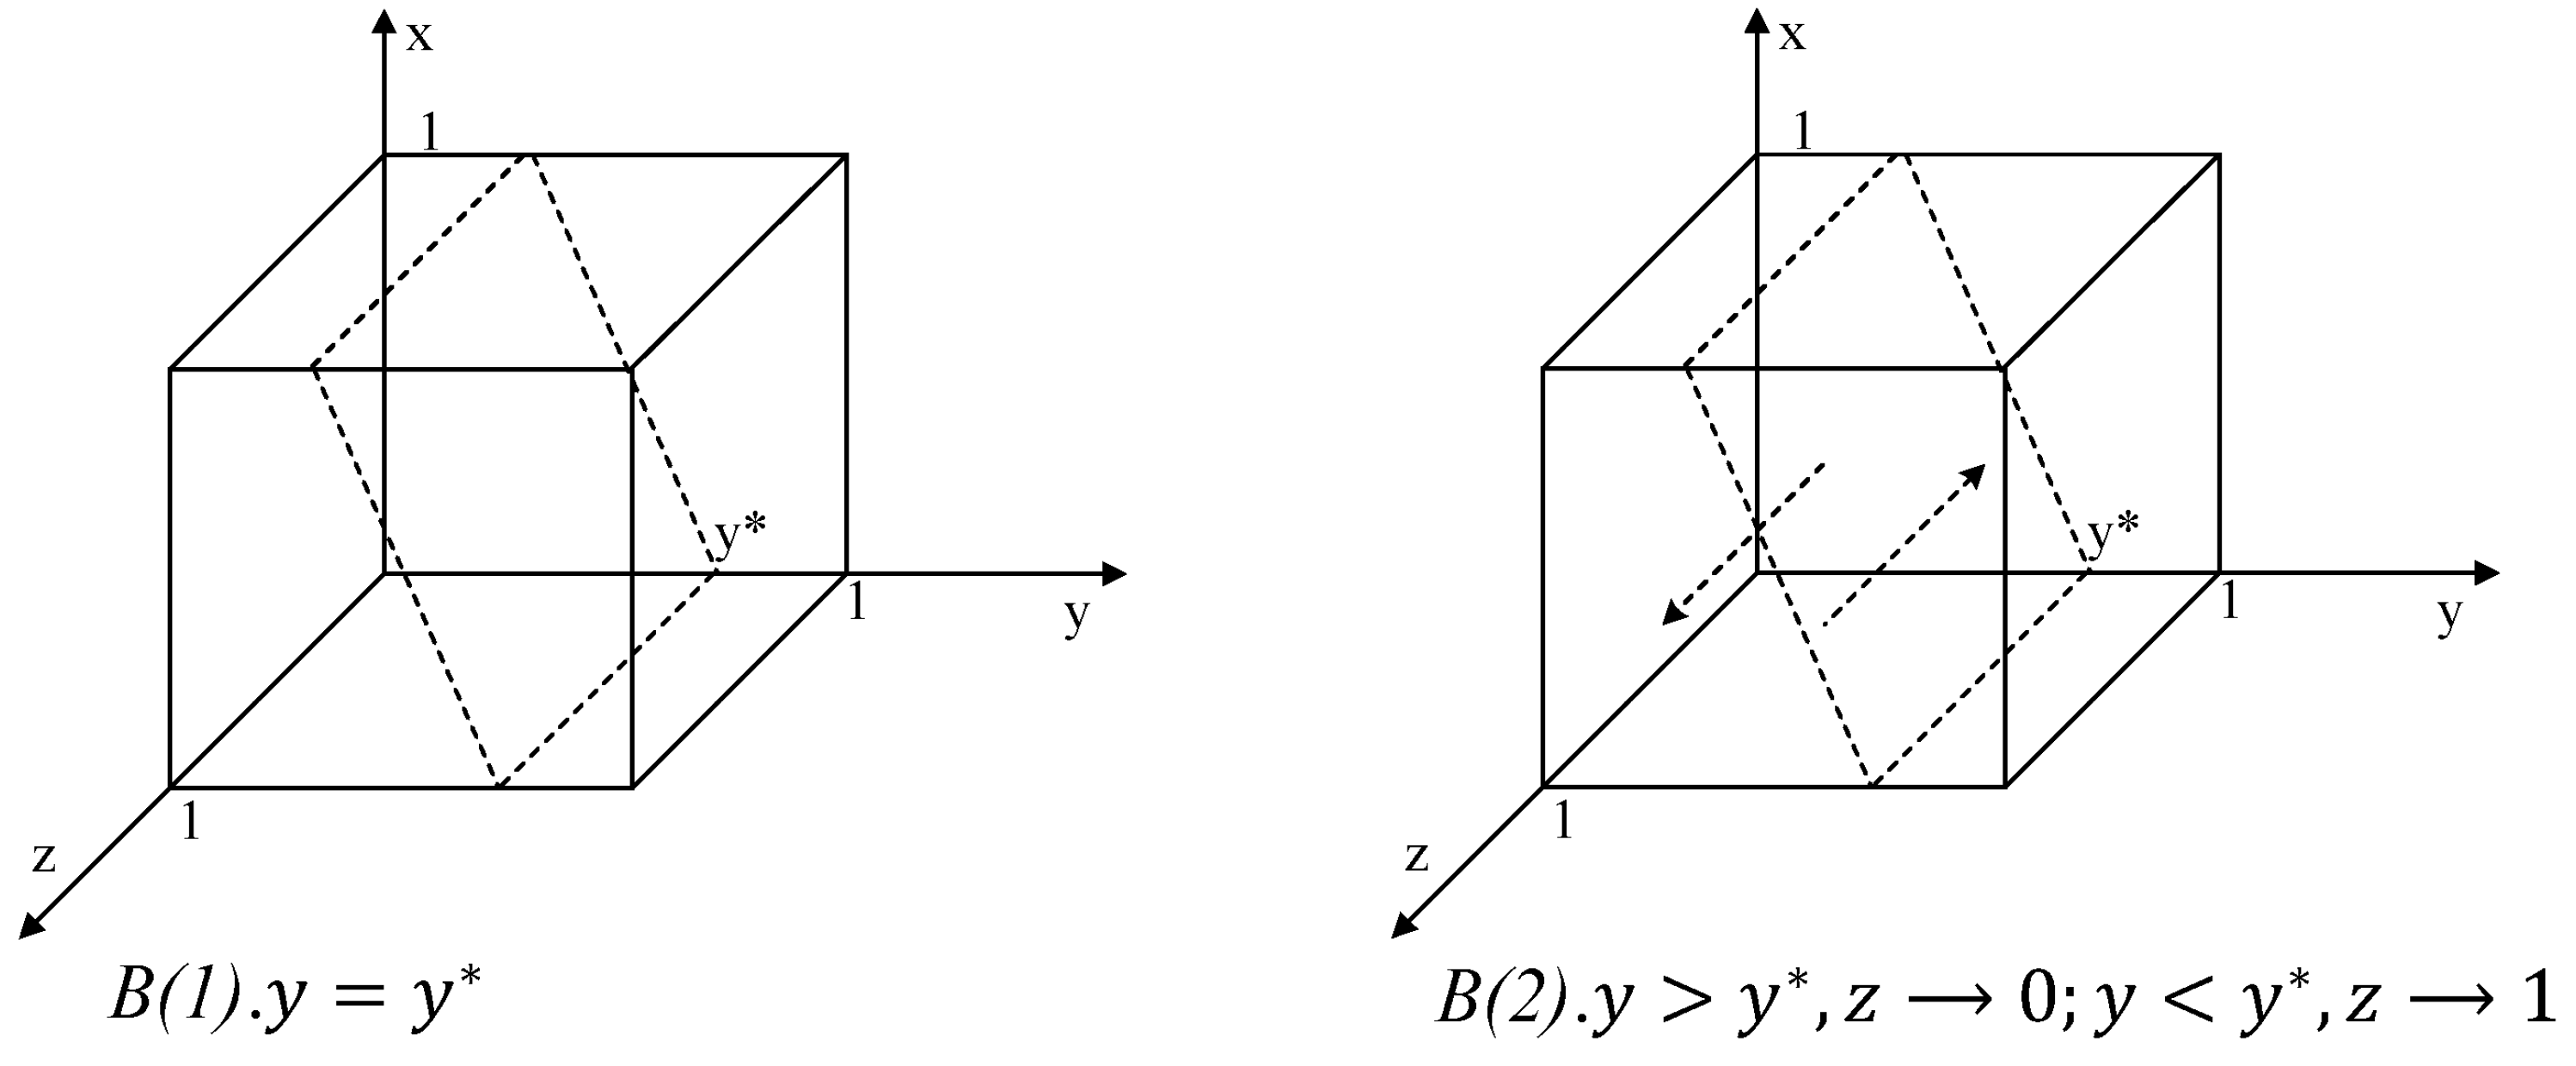
When  y = y * = 1 + 1 z [ ( 1 θ ) E B + ( 1 θ ) P B + θ C G 2 ] C G 1 ( θ 1 ) E A + ( 1 θ ) P A + θ C G 2   or   = z * = 1 + 1 y [ ( 1 θ ) E A + ( 1 θ ) P A + θ C G 2 ] C G 1 ( θ 1 ) E B + ( 1 θ ) P B + θ C G 2 ;   f ( x ) = 0 , this causes all behavioral strategies to be in a steady state.
(2) 
When   z z * , assuming     f ( y ) = 0 , then there exist    x = 0   and   x = 1   are   f ( y )   two stable solutions.
Proposition 2
(1) 
When   x = x * = S A + V A Q A + θ P A + ( 1 z ) n + m z ( θ 1 ) P A   time,   f ( y ) = 0 , all game strategies are in a steady state.
(2) 
When   x x * , assuming   f ( y ) = 0 , then there exist   y = 0   and  y = 1 , which are   f ( y )   two stable solutions.
Proposition 3
(1) 
When   x = x * = S B + V B Q B + θ P B + ( 1 y ) m + n y ( θ 1 ) P B   time,   f ( z ) = 0 , all game strategies are in a steady state.
(2) 
When  x x * , suppose  f ( z ) = 0 , and then  f ( z )  has the two stable solutions of the existence of  z = 0  and  z = 1 .
The proof of the above proposition is given in Appendix C.

4. Simulation of the Three-Way Evolutionary Game

This study used Matlab R2016b software to conduct a numerical study, in order to explore the overall effect of initial probabilities on the evolutionary stabilization strategy. This was achieved by randomly simulating the initial probabilities of the government, firm A, and firm B so that they vary in the (0, 1) interval.

4.1. ESS in Different Game Scenarios

The values of the exogenous variables are assigned in the context of the reality of FEB policy implementation and made to satisfy the preconditions for the evolutionary stabilization strategy to be reached. The effects of the different initial probabilities on the developmental stage of the evolutionary stabilization strategy are simulated.

4.1.1. ESS in Scenario 1

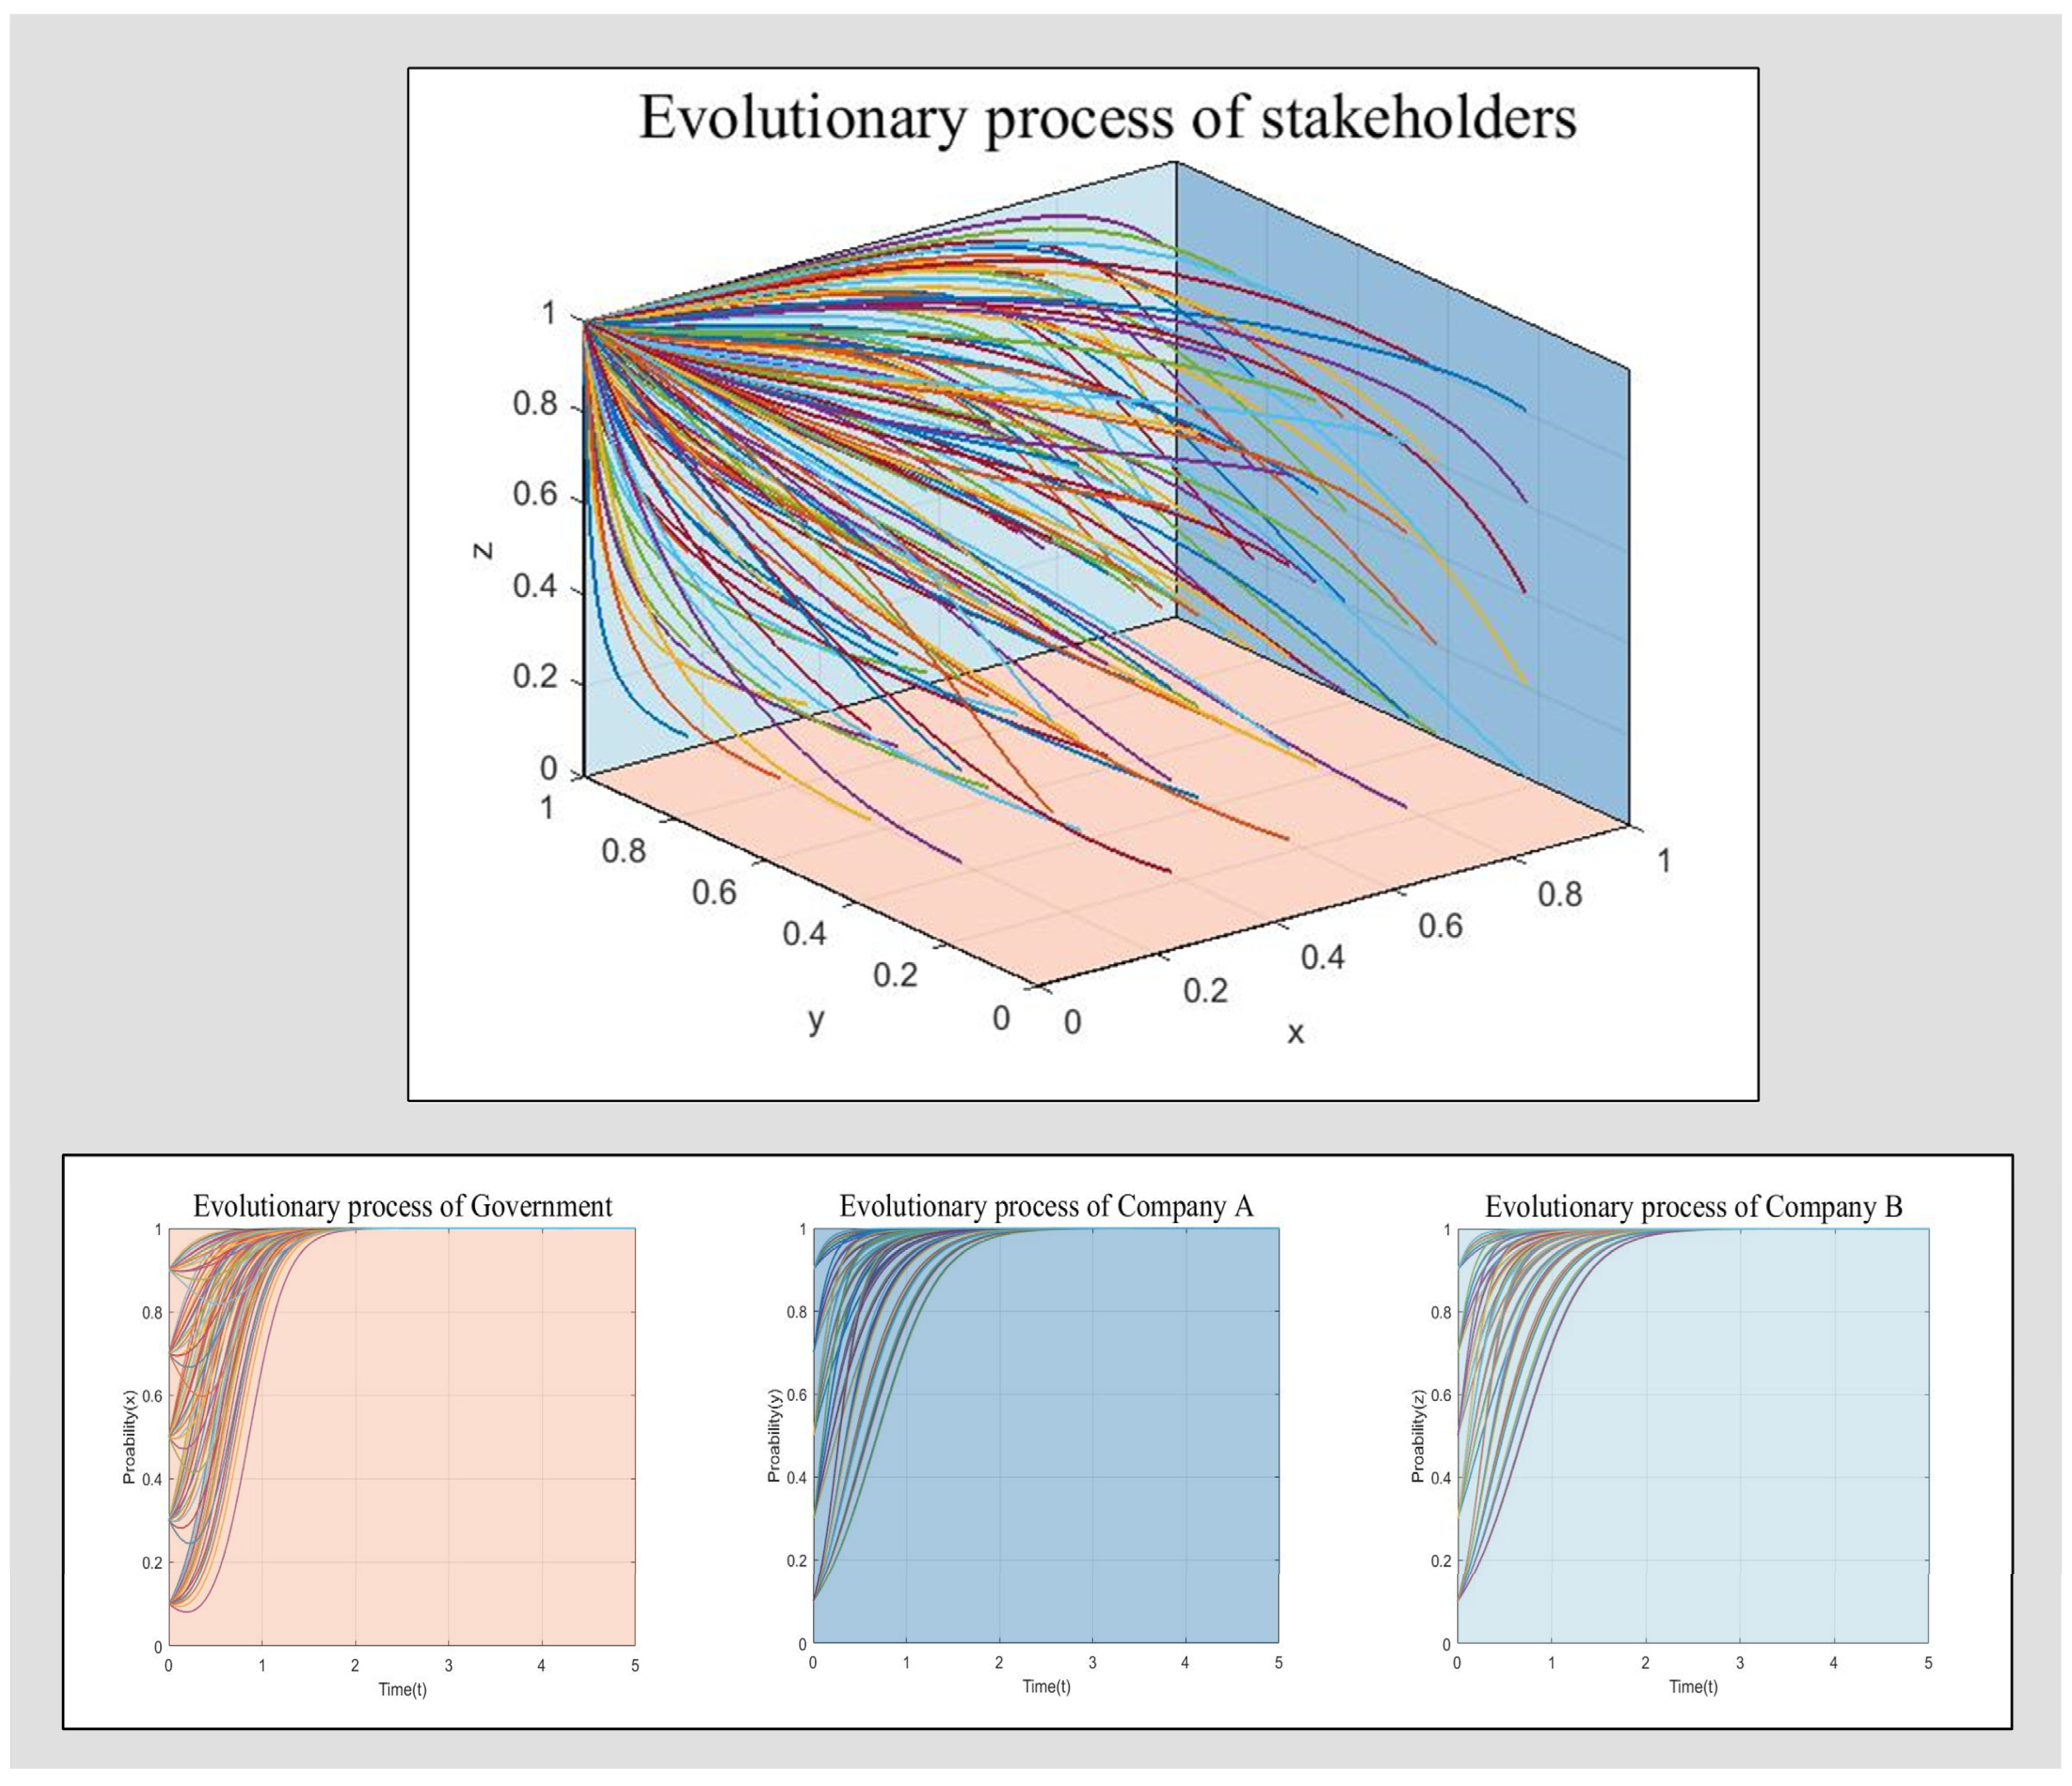
Here, F1 (0, 0, 0) is the only ESS when (1 − θ) (PA + PBEGAB) + 2θCG2 < CG1, QA > SA + VA + θPA + m and QB > SB + VB + θPB + n. To satisfy this requirement, the parameters are set as shown in Table 4. As shown in the results presented in Figure 4, the three different colors represent the cross-sectional plots according to the x, y, and z axes, indicating the trend of strategy evolution for the government, firm A, and firm B, respectively, with different initial probabilities. By observing the convergence of each curve in each cross-sectional plot, it is clear that, along with each iteration, the probability of each stakeholder choosing a strategy (x, y, z) increases continuously and finally converges at F1 (0, 0, 0). Combined with Table 3, the results show that under the stability condition, regardless of the initial probability, the government and the company assess the implementation risk and tend to make a policy choice that is contrary to the implementation. Thus, in the face of the risk of eventual economic loss due to policy implementation failure, firms will ultimately choose a “no participation” strategy, independent of their initial probability. At the same time, active government regulation puts more financial pressure on firms, and they are more likely to choose “negative” policies. Figure 4 shows that the initial probability does not affect the final stabilization outcome.

4.1.2. ESS in Scenario 2

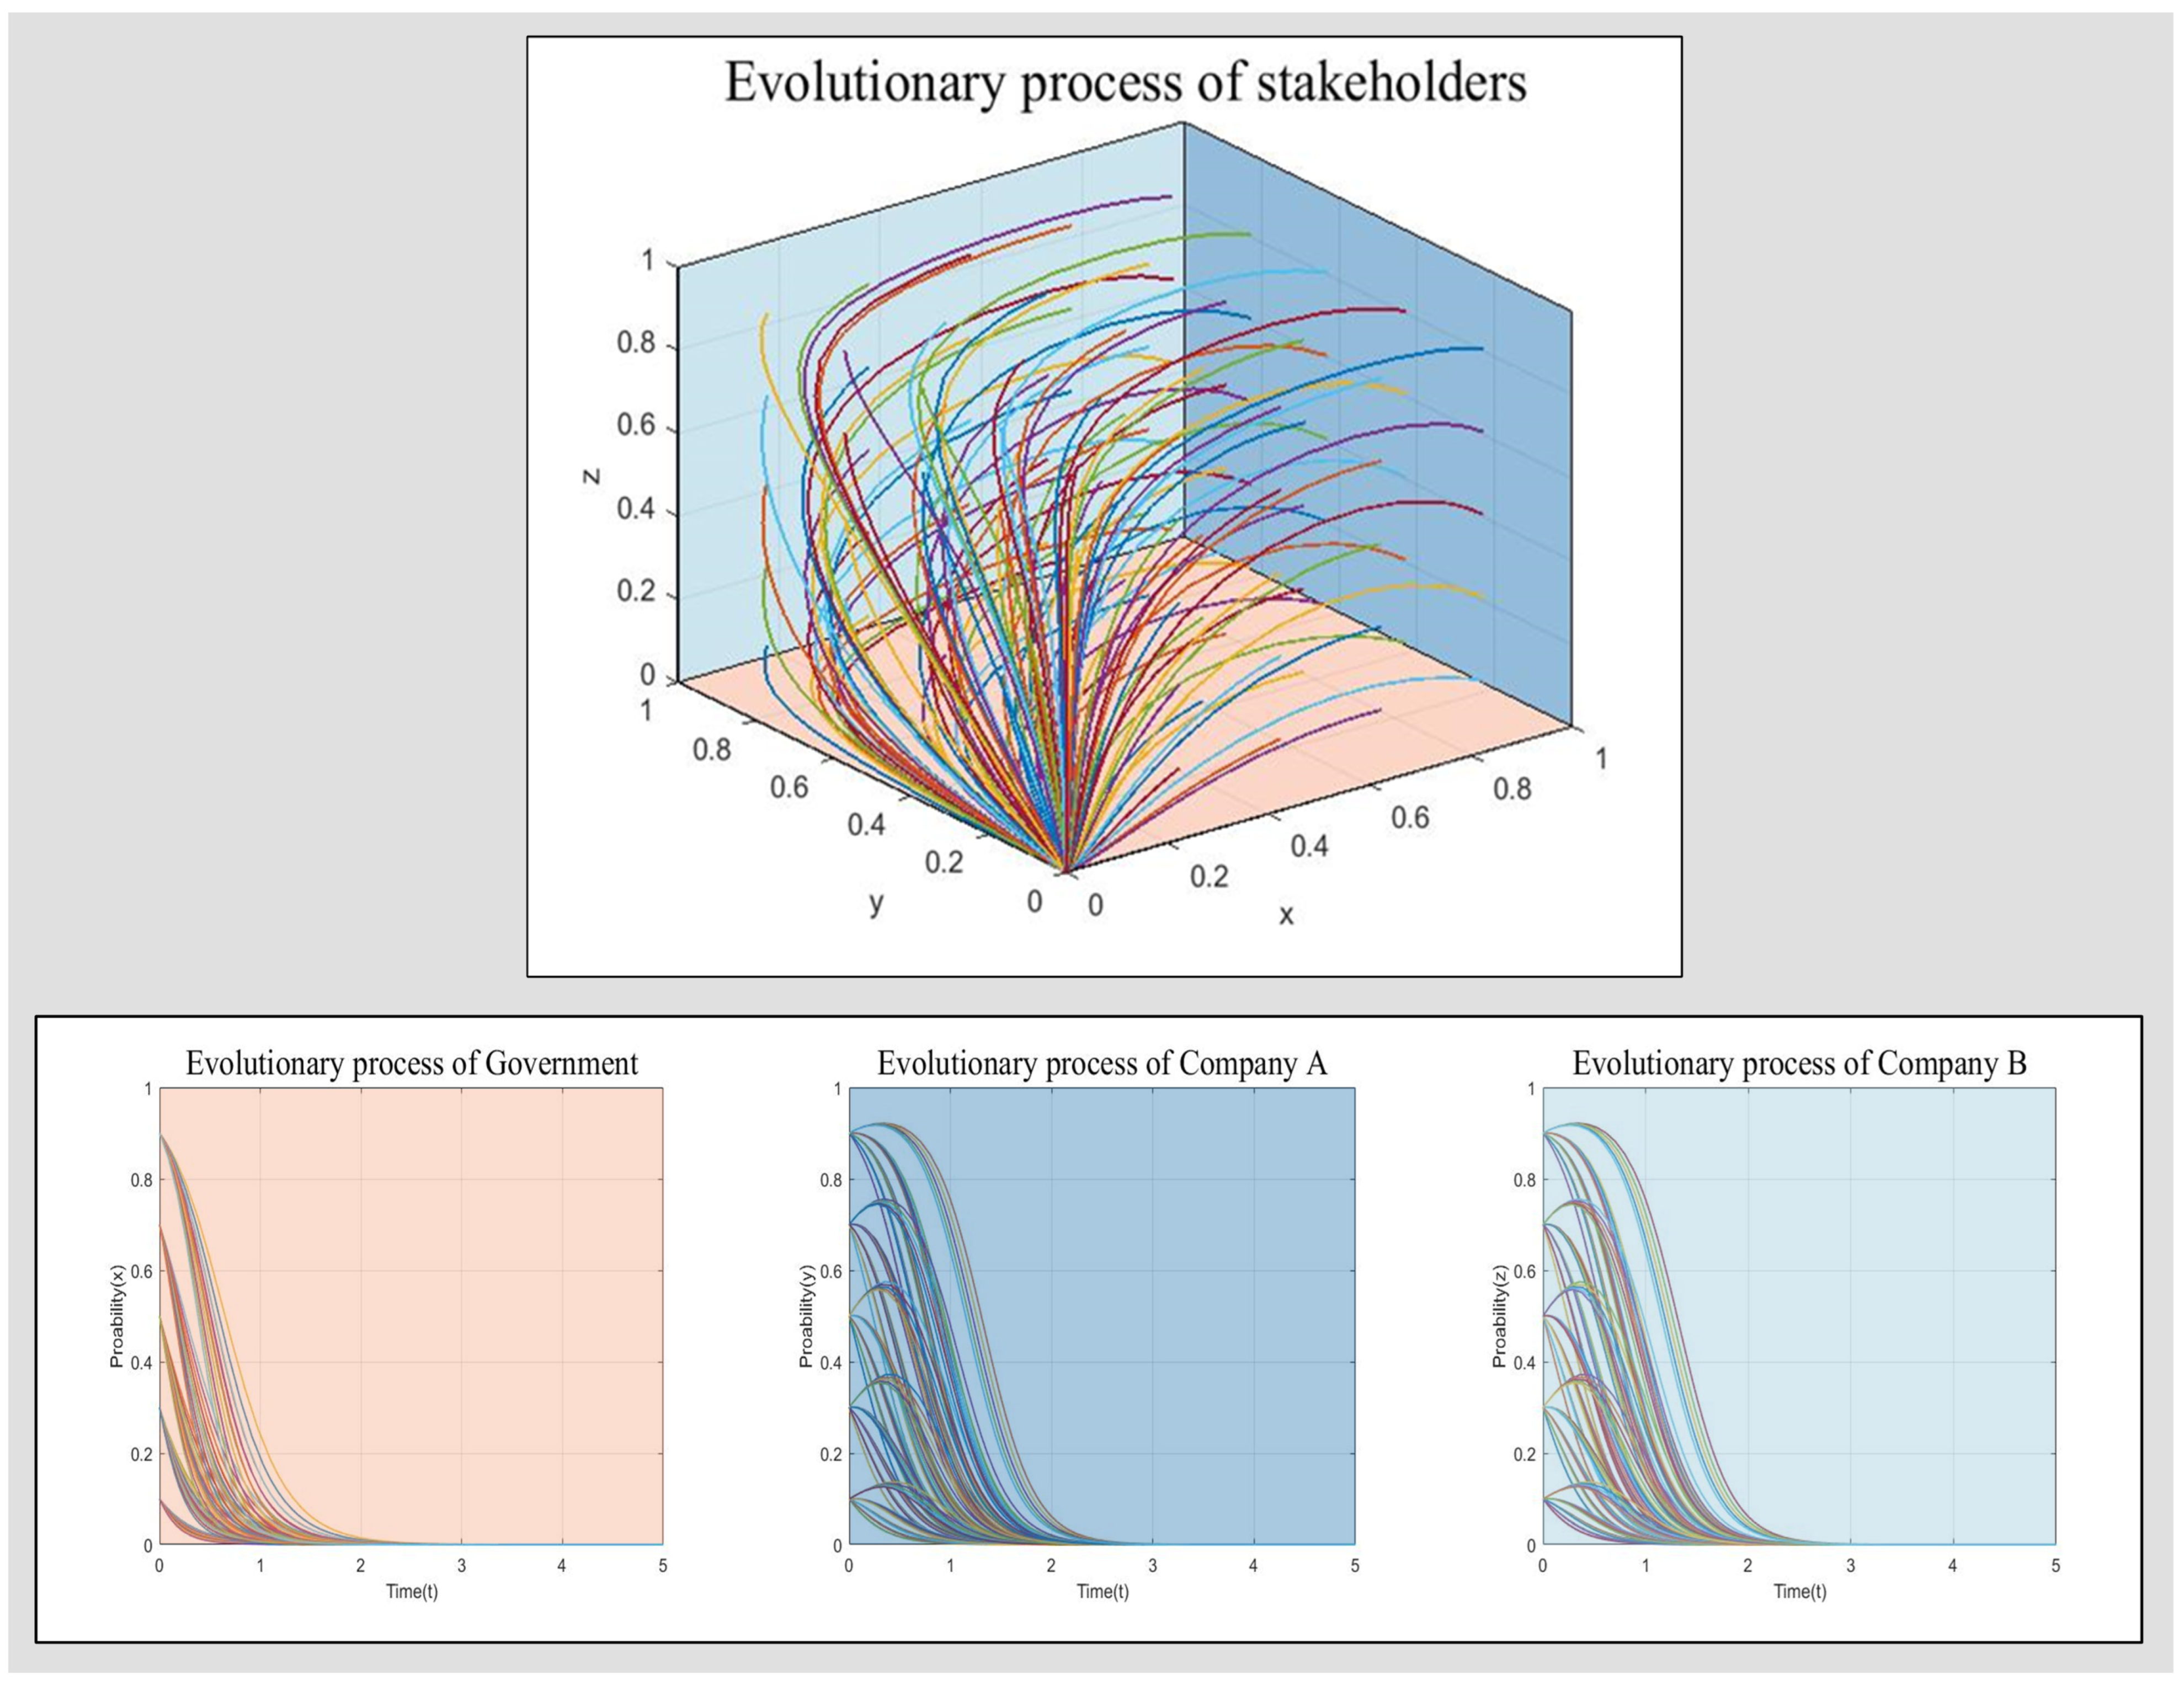
Here, F4 (0, 1, 1) is the only ESS when QA < SA + VA + θPA + m and QB < SB + VB + θPB + n. To satisfy this requirement, the parameters are set as shown in Table 5. By observing the convergence of the curves in the cross-sectional plot according to the x, y, and z axes, the simulation results in Figure 5 show that both companies of the same size and the government will adopt a specific strategy (x, y, z), which eventually stabilizes at F4 (0, 1, 1) as the iteration continues. When the expected additional cost of a firm’s “opt-in” strategy is less than the benefit of policy participation, i.e., the risk of loss is smaller, the firm will choose the “active participation” strategy, regardless of the initial probability. Figure 5 shows that participation of media monitoring shares the cost of government regulation, so the government tends to choose the “negative regulation” strategy. Therefore, the involvement of media monitoring is an important factor that influences the policy to achieve the desired policy implementation state.

4.1.3. ESS in Scenario 3

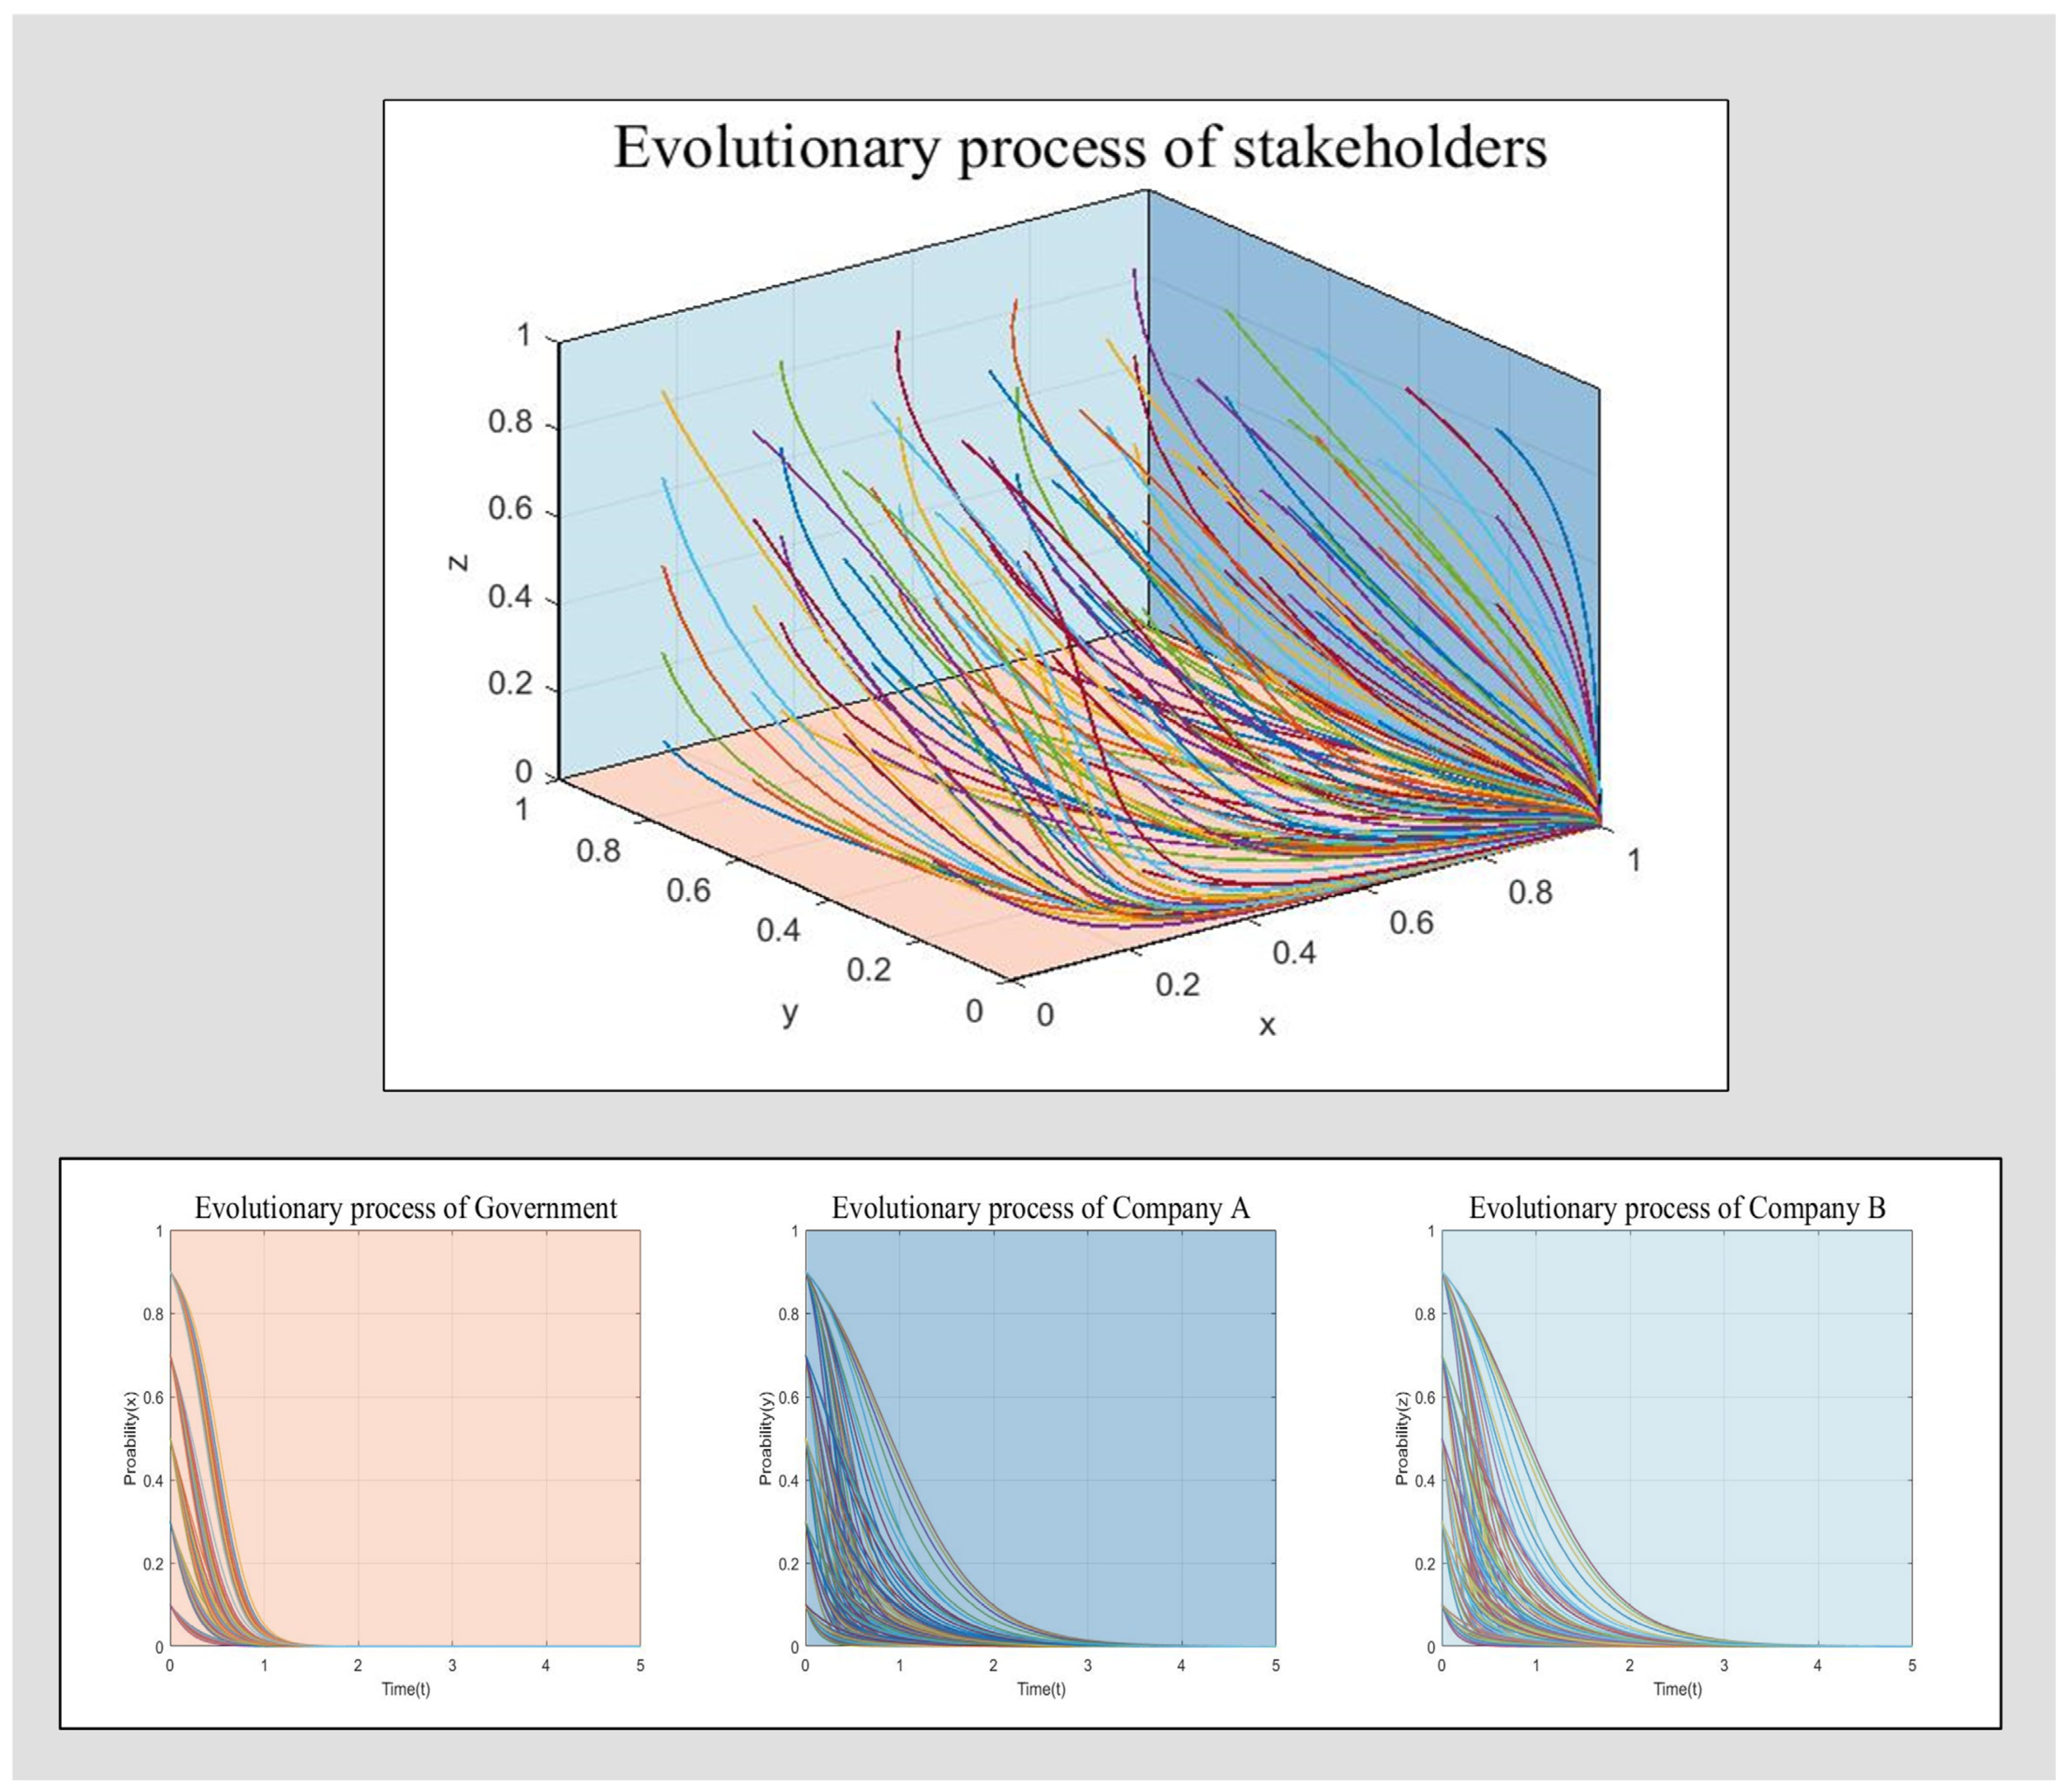
Here, F5 (1, 0, 0) is the only ESS when CG1 < 2θCG2 − (1 − θ) (EGABPAPB), QA > SA + VA + PA + m and QB > SB + VB + PB + n. To satisfy this requirement, the parameters are set as shown in Table 6. By observing the convergence of the curves in the cross-sectional plot according to the x, y, and z axes, the simulation results in the figure show that the ESS will eventually converge to F5 (1, 0, 0) when the constraint is satisfied, regardless of the initial probability change. In other words, under the strategic choice of active government regulation, companies will still tend to refuse to participate, even when faced with the risk of fines. The traditional profitability model serves as a stable revenue-generating channel to ensure the normal operation of the company. However, the company makes a strategic decision to implement the policy, which will compress the share of traditional methods. The uncertainty of carbon sink revenue increases the risk of loss for the company, and therefore, even if the government increases the level of control, it will still be difficult to attract the company to participate in the policy. Meanwhile, Figure 6 shows that the government prefers to choose negative regulation in the beginning stage, relying on the media to implement monitoring. This reduces expenditures; also, as the resistance of each relevant company to the new policy grows, the government shifts toward the strategic choice of positive regulation.

4.2. The Influence of Key Factors on Evolutionary Outcomes

4.2.1. The Size of the Relevant Company

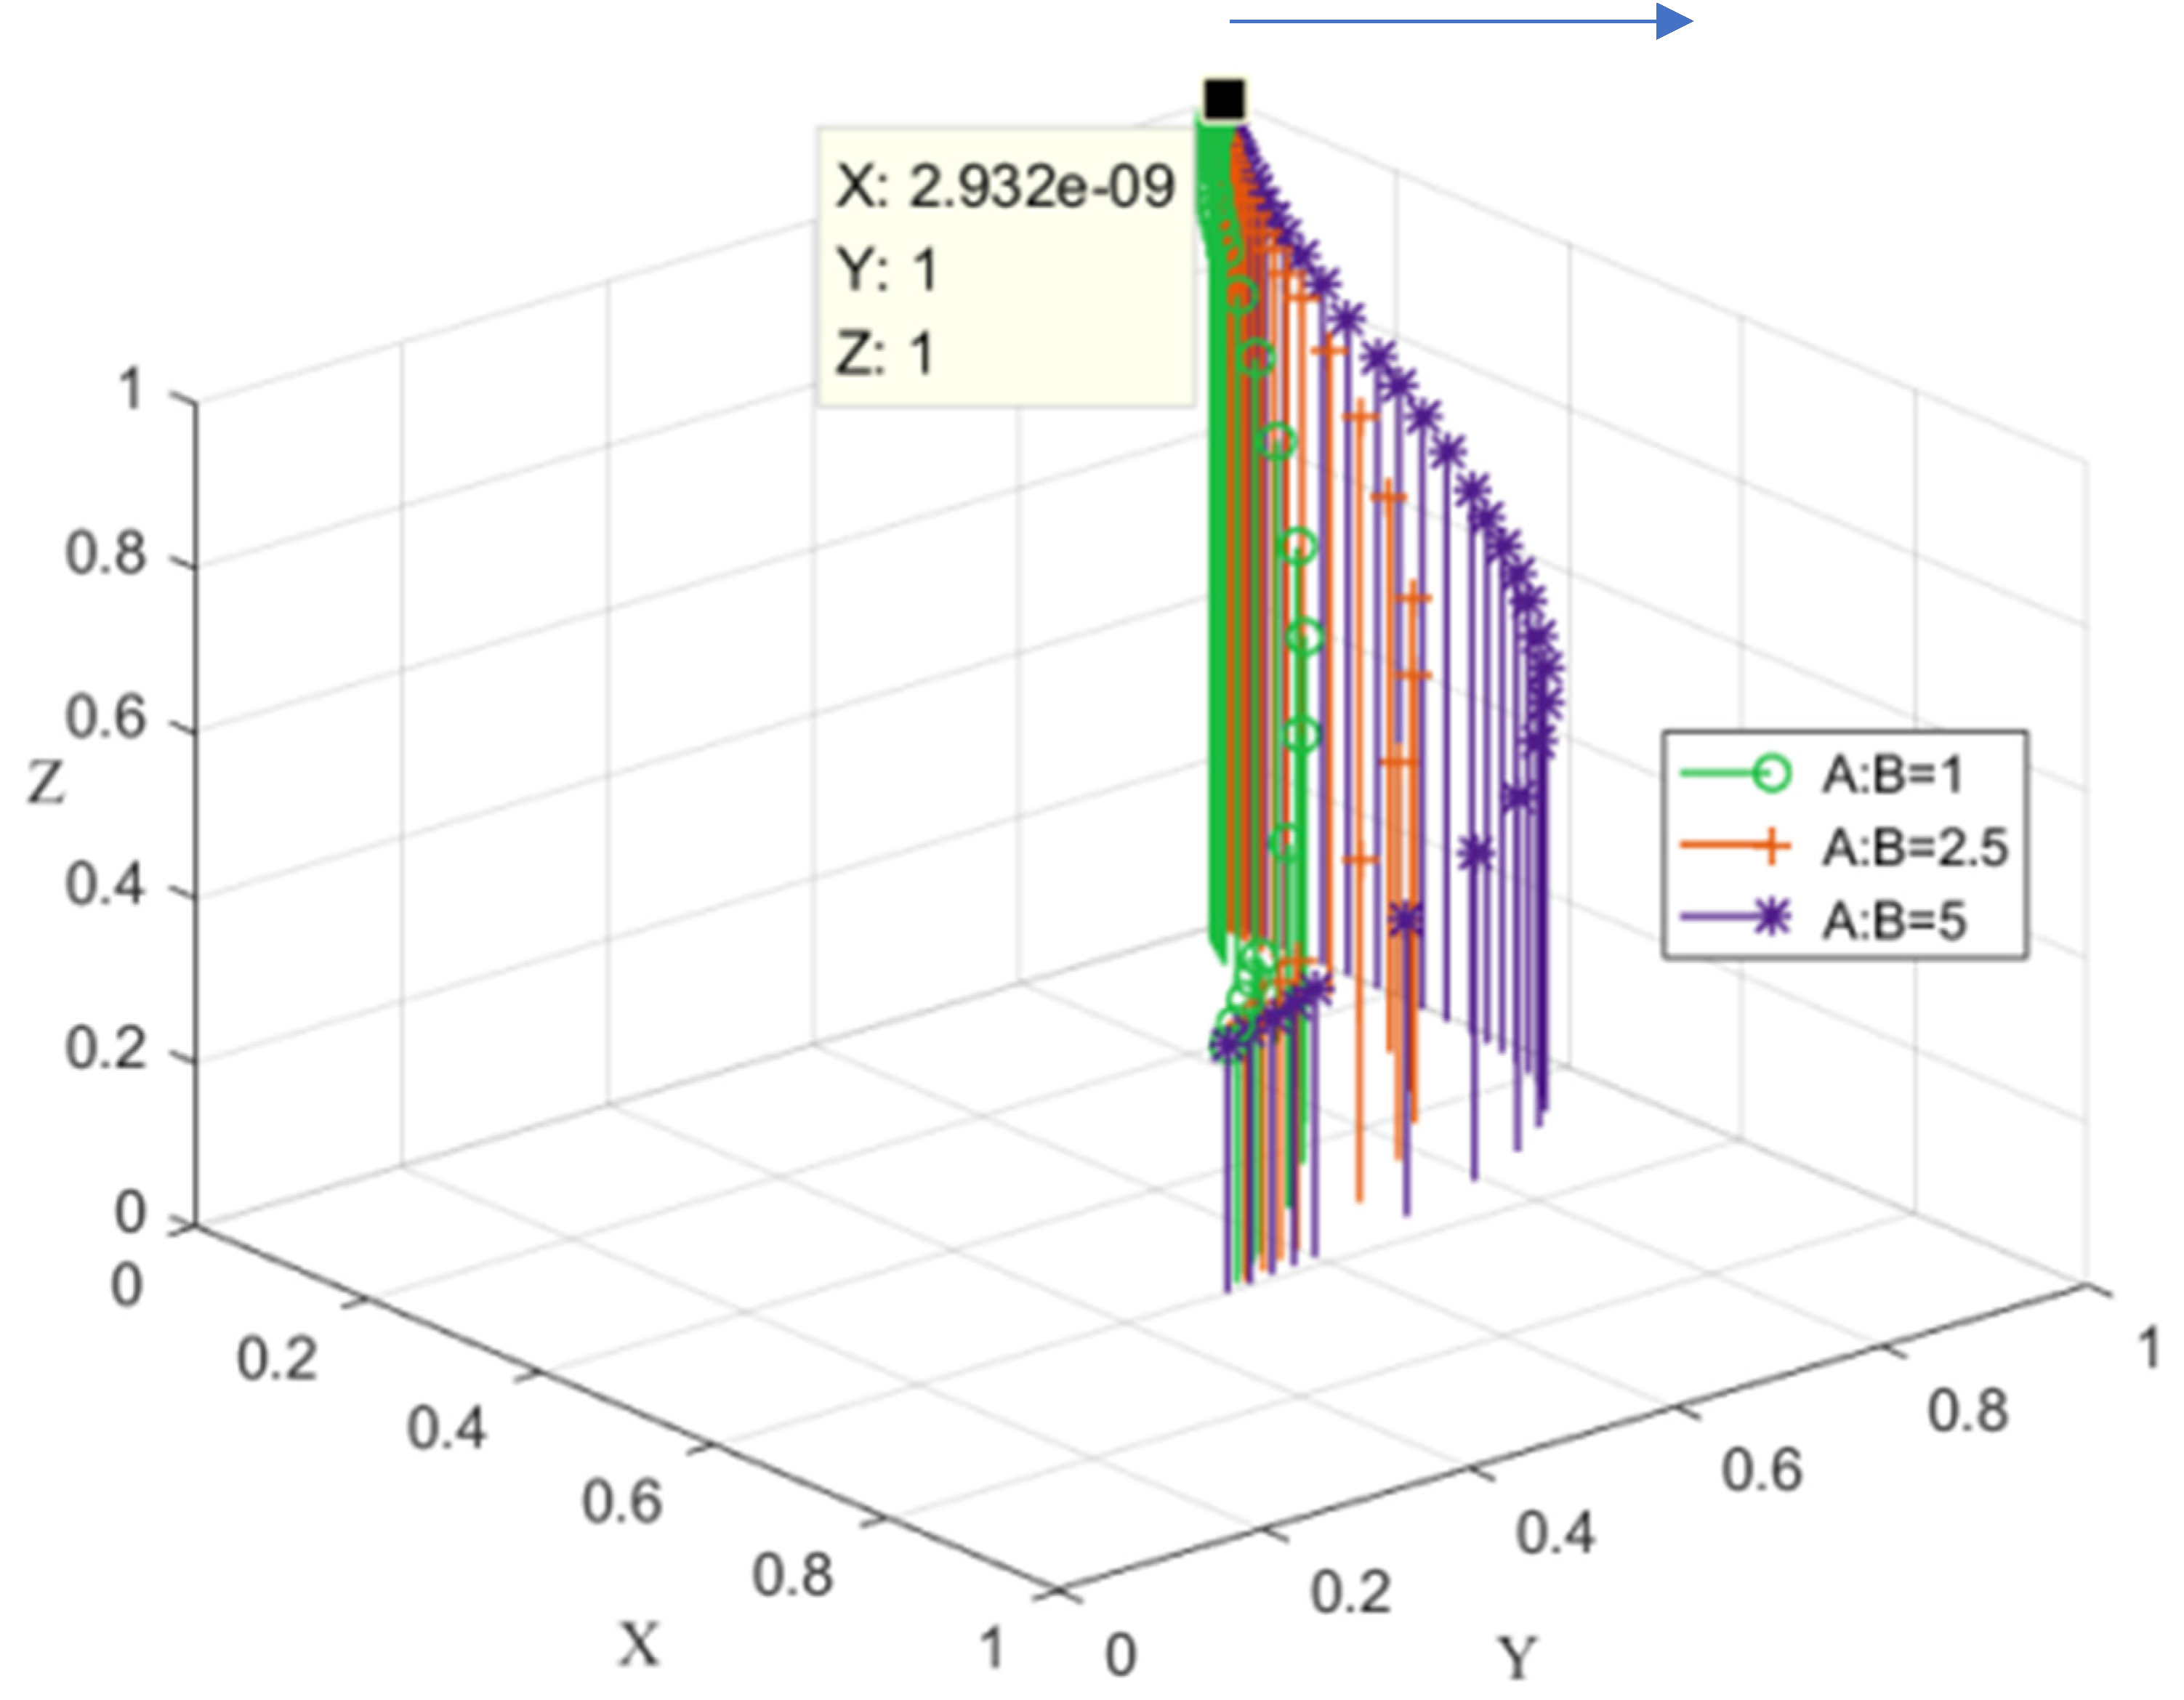
The previous results were simulated under the assumption that the two firms are of the same size. In order to fit the real-life responses of different companies to the policies, this study now assumes that the relevant companies A and B are of different sizes and simulates the cases where the size of company A is 1.8 times and 3 times that of company B, respectively, i.e., EGA = 1.8EGB, PA = 1.8PB, SA = 1.8SB, VA = 1.8VB, QA = 1.8QB, m = n; EGA = 3EGB, PA =3PB, SA =3SB, VA =3VB, QA =3QB, and m = n. Accordingly, the results are shown in Figure 7.
Analyzing the results in Figure 7, this study concludes that the presence of large firms accelerates the rate at which the equilibrium state is reached throughout the evolutionary game process. In other words, large firms have a positive impact on the achievement of the evolutionary stabilization strategy, without destroying the final equilibrium. In practical terms, large companies are more sensitive to changes in market and policy shifts; they show a keen interest in emerging technologies and market ideas and shape them while adapting to markets and policies. This study believes that large companies are more forward-looking and act as a virtual industry vane to lead the industry development trend. Therefore, in the process of FEB policy implementation, large companies join to accelerate the process of policy implementation. At the same time, companies that are first in the transition stage gain priority, and thus, they occupy the first opportunity for sustainable development. This accelerates the overall implementation of the policy, particularly due to the existence of the market’s innate competitive mechanism.

4.2.2. Government Fines

From the perspective of ecological protection and eco-efficiency enhancement, this study considers F4 (0, 1, 1) as the optimal equilibrium state for policy implementation. That is, the government deregulates, and companies A and B can still spontaneously implement the FEB policy. The final state reached is shown in Figure 8.
To analyze the effect of government fines on the model, the firm size is set to be the same (i.e., PA = PB) while controlling (except for PA and PB) for the other parameters to be constant. The values of government fines are set to 4, 8, and 12, respectively.
The rate of convergence of the evolutionary steady state increases as government penalties increase. Firms face harsh government penalty policies, and the FEB policy implementation process is accelerated. A company’s implementation strategy is closely related to the amount of the penalty; i.e., the higher the government penalty, the greater the risk of loss to the company for not implementing the FEB policy. The relevant company adjusts its strategy choice around the expected benefits, weighing the loss of fines against the additional benefits to be gained by participating in the FEB policy. Thus, in the initial stage of policy implementation, the relevant companies’ limited knowledge of the policy means strict regulation will be needed to force them to participate in the policy. Later in the implementation process, as the understanding of the policy deepens, the companies adopt a proactive participation posture. Therefore, the government sets reasonable standards for fines, which is one of the means to effectively promote the policy.

4.2.3. The Probability of Media Exposure

The simulation was conducted under the assumption of “optimal equilibrium”, controlling all parameters except media exposure (θ), and thus analyzing how θ affects the process of reaching the evolutionary stabilization strategy. The values of θ are set as 0.2, 0.5, and 0.7, respectively.
Figure 9 reveals an interesting phenomenon, namely, with the change in θ, two different evolutionary stabilization strategies are presented, with 0.2 as the boundary. Specifically, when the media exposure rate θ is 0.2, the convergence is toward the stabilization strategy F1 (0, 0, 0). When θ is 0.5, the evolutionary direction produces a change and converges toward the optimal evolutionary strategy. Finally, when θ is 0.7, the convergence toward F4 (0, 1, 1) process is accelerated. The change in λ is found to change the stability condition from QA > SA + VA + θPA + m and QB > SB + VB + θPB + n to QA < SA + VA + θPA + m and QB < SB + VB + θPB + n. With such a change, one can easily conclude that, due to the existence of the firm’s speculative psychology, with media exposure as a random event, when the probability of the occurrence of media exposure is at a low level, the firm chooses to take the risk and stick to the traditional crude and high-yield profit model. As media exposure continues to increase, the likelihood of the firm’s participation in the FEB policy also increases. The higher the probability of media exposure of a company’s refusal to implement the FEB policy is, the greater is the potential economic risk of corporate image erosion for the company. Thus, to a large extent, the less likely it is that the company will not be disclosed. Therefore, increased media exposure is an important aid to government promotion of FEB policy implementation.

5. Discussion

The FEB policy, as one of the key propositions of natural resource indicator trading, is essentially an extension of market instruments [15,30]. Catalyzed by the market and due to the market’s own risk uncertainty, the policy implementation process generates complex and variable game phenomena. This dynamic game process also determines whether the policy goes bankrupt or performs its maximum function.
Compared with the existing literature, this paper makes several breakthroughs. First, this research highlights the guiding role of the government in policy promotion and explores the impact of government actions on the ultimate effectiveness of policies. Second, this study explores the exposure of external media regulators, in addition to the government, to the strength of policy promotion. Third, attention is paid to the interaction mechanism between enterprises of different sizes in the same industry. Fourth, the scope of the application of evolutionary game models is extended. Game theory, as a traditional economic theory, has just emerged in the field of energy. However, its application in the field of environmental policy, especially the study of complex game behavior in natural resource indicator transactions, has seldom been applied.
In the process of achieving the above research breakthroughs, because the implementation of the FEB policy in China is still in its infancy and the lack of evolutionary game theory in the research field, after the initial resistance and challenges encountered in the study, the trading mechanism constructed on the basis of realistic research was refined to increase the plausibility of the game hypothesis and resolve the difficulties in the early stages of the study. The focus of this study differs from other studies in view of the current state of research. This study focuses more on the reduction of the evolutionary process and finally arrives at three stable states of evolution. The focus here is on how the parameters related to the subject’s strategy choice affect the realization of the ideal state, how to change the parameters to facilitate the smooth implementation of the policy, and whether the different initial probabilities affect the final decision of the subject’s behavior and thus have an impact on the evolutionary outcome. In contrast, due to the different degrees of policy development, other studies related to watershed ecological compensation policies have a richer and more varied selection of parameters. This eventually leads to a more reasonable benefit distribution ratio between upstream and downstream governments, thereby facilitating the allocation of functions among the respective watershed governments [9,31]. Although there are differences in the tendencies of the studies, all of them will ultimately help with the in-depth implementation of the policies. Forest ecological bank policy, as a sustainable policy designed to promote ecological and economic development [32], uses market-based instruments to add value to forest eco-products under the premise of ecological conservation, thereby enhancing socio-economic benefits. While completing the value-added of ecological products, the policy focuses on ecological landscape restoration, restoring the ecological functions of forest resources, and safeguarding ecological and environmental benefits. Forestry-related sectors under government jurisdiction generate new ideas for sustainable development of forest resource management development. Based on the core concept of forest eco-banking policy, forestry-related enterprises improve their level and ability to sustainably develop forest resources through technological innovation, and expand the channels for obtaining income from forest resource development.
However, this paper still has limitations. (1) The singularity of variable selection: the policy itself is in the early stage of implementation, so the variables finally selected are single variables. In the research yet to be conducted, more rich functional relationships will be added according to the real situation, in order to improve the accuracy of the model, while making the simulation of the subject’s decision-making process more realistic. (2) The problem of endogeneity between parameters is not considered, which is also a direction for improvement in the follow-up research. However, in this paper, the mutual influence between parameters will not affect the main conclusions of this paper. (3) Due to the lack of data support in the early stage of the policy, the research in this paper focuses on the prediction of trends and does not result in the optimal equilibrium ratio of benefit distribution between government and enterprises. Therefore, the above limitations will be the focus direction of future research. The choice of variables will be enriched, and real data will be adopted to explore a reasonable benefit distribution model among subjects after the development of the policy enters a stable and perfect stage. That research will provide theoretical support for the policy’s development.

6. Conclusions

The implementation of the forest eco-banking (FEB) policy has become one of the important ways to realize the value of ecological products. Specifically, this is carried out by implementing the core concept of natural resource index trading while achieving a “win-win” situation of economic development and ecological protection. The model of government-led active participation of other actors has become an effective way to solve the problem of sustainable development. However, the question of how the government can attract companies to join in the whole process and keep the policy running continuously is the primary research issue. Therefore, this paper constructs a three-party evolutionary game model with ‘government-firm A-firm B’ as the main body, and analyzes the final evolutionary stabilization strategies of the game parties in the process of policy implementation. In addition, through numerical simulations, this study further explores the influence of government actions on the stabilization strategies achieved by the interested parties. The main conclusions are as follows:
1.
Different governmental attitudes and approaches to policy implementation (i.e., playing different roles) influence the state in which the evolutionary stabilization strategy is ultimately achieved. Specifically, the following were found:
(1)
The strict government role motivates firms to participate in the FEB policy through intense government regulatory actions. In other words, a firm’s choice to “participate” is positively correlated with the severity of the penalty and the probability of joining the policy increases in line with the expected risk of loss. Therefore, the government adopted strict regulatory measures at the initial stage of the implementation of the forest ecological bank policy to motivate to participate by means of increasing administrative penalties and raising subsidies for policy participation.
(2)
As the policy continues, the impact of harsh regulatory actions on the companies’ “participation” behavior diminishes. Instead, the relaxed government role allows the companies’ autonomy to be fully utilized by creating a favorable market environment. This, in turn, leads to higher ecological benefits. When most enterprises participate in the forest ecological bank policy, the government deregulates, giving greater weight to market-based instruments in the management process, improving compensation mechanisms, and establishing links between the internal and external markets.
2.
The effect of different initial probabilities on the ESS convergence state of the government-firm A-firm B evolutionary game model is not significant enough. In addition, the decreasing effect of initial probabilities on the stable strategy of the model with increasing iterations indicates that the proportion of intersubjective strategy choices tends to reach the same decision as the generation of opinion leaders.
3.
In the process of FEB policy implementation, cooperative behavior between companies of different scales reduces the cost of technological innovation, and both share technological dividends. This promotes the transformation of ecological products into ecological capital and forms economies of scale, this leads to the achievement of a stabilization strategy, thus promoting the sustainable development of the FEB policy. At the same time, the relevant media’s social responsibility to track the progress of the policy’s implementation has become one of the important motivations for companies to make the decision to participate. Companies are also more inclined to make the decision to participate in the policy after weighing the pros and cons of either public opinion condemnation or building a positive company image.

Author Contributions

Conceptualization, X.N. and H.W.; methodology, M.Y.; validation, X.N. and H.W.; formal analysis, M.Y.; investigation, X.N. and H.W.; writing—original draft preparation, X.N. and M.Y.; writing—review and editing, H.W. and Z.C.; visualization, W.L.; supervision, R.Z.; project administration, X.N. and H.W.; funding acquisition, X.N. and H.W. All authors have read and agreed to the published version of the manuscript.

Funding

This research was funded by the National Natural Science Foundation of China (grant number: 71763001 and 71973038) and Thousands of Young and Middle-aged Key Teachers Training Program in Guangxi Colleges and Universities (grant number: 2021QGRW002).

Data Availability Statement

The author may provide raw data if necessary.

Acknowledgments

We thank the editors and anonymous reviewers for their careful work and professional recommendations for improving this work. This research grant is supported by the National Natural Science Foundation of China (Nos. 71763001 and 71973038); Thousands of Young and Middle-aged Key Teachers Training Program in Guangxi Colleges and Universities (No. 2021QGRW002).

Conflicts of Interest

The authors declare no conflict of interest.

Appendix A

The specific parameters for the evolutionary game analysis of the forest eco-banking (FEB) policy are shown in Table A1:
Table A1. Description of parameters.
ParametersDescription
EGABCompanies A and B both participate in the forest eco-banking (FEB) policy, and the government benefits
EGACompany A participates separately in the FEB policy, and the government benefits.
EGBCompany B participates separately in the FEB policy, and the government benefits.
CG1Cost of active government regulation
CG2Cost of negative government regulation
PA“A Penalty”, payable for refusal to participate in the FEB policy
PB“B Penalty”, payable for refusal to participate in the FEB policy
TARevenue from Company A’s development and operation using traditional methods
TBRevenue from Company B’s development and operation using traditional methods
SACompany A’s carbon sink income
SBCompany B’s carbon sink income
VAAdditional benefits from Company A’s participation in the FEB policy (ecological benefits and prestige benefits)
VBAdditional benefits from Company B’s participation in the FEB policy (ecological benefits and prestige benefits)
QAAdditional costs for Company A to participate in the FEB policy
QBAdditional costs for Company B to participate in the FEB policy
ΘExposure of relevant media for policy implementation
MA subsidizes the cost of participating in the policy to B.
NB subsidizes the cost of participating in the policy to A.
XProbability of active government regulation of policy implementation
YProbability of participation of company A in the FEB policy
ZProbability of participation of firm B in the FEB policy

Appendix B

The specific results for the values in the Jacobian matrix are shown in Table A2:
Table A2. The values in Jacobian matrix.
G ( x ) x = ( 1 2 x ) { ( 1 θ ) [ ( y 1 ) E G A + ( z 1 ) E G B + ( 1 y ) P A + ( 1 z ) P B ] C G 1 + θ ( 2 y z ) C G 2 }
G ( x ) y = x ( 1 x ) [ ( 1 θ ) E G A + ( 1 + θ ) P A θ C G 2 ]
G ( x ) z = x ( 1 x ) [ ( 1 θ ) E G B + ( 1 + θ ) P B θ C G 2 ]
A ( y ) x = y ( 1 y ) ( 1 θ ) P A
A ( y ) y = ( 1 2 y ) [ S A + V A Q A + ( θ + x θ x ) P A + ( 1 z ) n + m z ]
A ( y ) z = y ( 1 y ) [ n + m ]
B ( z ) x = z ( 1 z ) ( 1 λ ) P B
B ( z ) y = z ( 1 z ) [ m + n ]
B ( z ) z = ( 1 2 z ) [ S A + V A Q A + ( θ + x θ x ) P B + ( 1 y ) m + n y ]

Appendix C

Proof A1.
The derivative of the government’s replication dynamics equation can be further calculated as follows:
G ( x ) = d G ( x ) d x = ( 1 2 x ) [ ( y 1 ) ( 1 θ ) E G A + ( z 1 ) ( 1 θ ) E G B + ( 1 y ) ( 1 θ ) P A + ( 1 z ) ( 1 θ ) P B C G 1 + θ ( 2 y z ) C G 2 ]
Around the equation. we discuss the following two cases:
Under the 0 < x < 1 ,   0 < y < 1 ,   0 < z < 1 the condition that if ( 1 θ ) ( P A + P B E G A B ) C G 1 + 2 θ C G 2 < 0 , one can then deduce that ( y 1 ) ( 1 θ ) E G A + ( z 1 ) ( 1 θ ) E G B + ( 1 y ) ( 1 θ ) P A + ( 1 z ) ( 1 θ ) P B C G 1 + λ ( 2 y z ) C G 2 < 0 . Therefore, when x = 0 when G ( x ) < 0 ; when   x = 1 when G ( x ) > 0 , as shown in Figure A1.
Figure A1. Replicated dynamic phase diagram of government.
Forests 14 01002 g0a1
Under the 0 < x < 1 ,   0 < y < 1 ,   0 < z < 1 the constraint that, if ( 1 θ ) ( P A + P B E G A B ) C G 1 + 2 θ C G 2 > 0 , one can then deduce that ( y 1 ) ( 1 θ ) E G A + ( z 1 )   ( 1 θ ) E G B + ( 1 y ) ( 1 θ ) P A + ( 1 z ) ( 1 θ ) P B C G 1 + θ ( 2 y z ) C G 2 < 0 . Therefore, when x = 0   G ( x ) > 0 ; when x = 1 when G ( x ) < 0 . □
The incremental stability of firm A’s behavioral strategy is then analyzed.
Proof A2.
The derivative of the kinetic equation for the replication of company A can be further calculated as follows:
A ( y ) = d A ( y ) d y = ( 1 2 y ) [ S A + V A Q A + ( θ + x θ x ) P A + ( 1 z ) n + m z ]
The following two cases are discussed separately, according to the equation.
Under the constraint 0 < x < 1 , 0 < y < 1 , 0 < z < 1 . Under the constraints, if Q A < S A + V A + θ P A + m , and in turn, we can derive the following possible scenarios:
When   x < x * , we can deduce that S A + V A Q A + ( θ + x θ x ) P A + ( 1 z ) n + m z > 0 is established. Under this condition, the A ( y ) | y = 0 0 , G ( y ) | y = 1 < 0 , and therefore, the y = 1 is the evolutionary stabilization strategy, as shown in Figure A2.
Figure A2. Replicated dynamic phase diagram of company A.
Forests 14 01002 g0a2
When x < x * , we can deduce that S A + V A Q A + ( θ + x θ x ) P A + ( 1 z ) n + m z < 0 holds, under the condition that A ( y ) | y = 0 < 0 , A ( y ) | y = 1 0 , and therefore, the y = 0 is the evolutionary stabilization strategy. The results are shown in Figure A3.
Under the restriction   0 < x < 1 , 0 < y < 1 , 0 < z < 1 . Under the restriction, if Q A > S A + V A + θ P A + m , we can deduce that S A + V A Q A + ( θ + x θ x ) P A + ( 1 z ) n + m z < 0 that the condition always holds; A ( y ) | y = 0 < 0 , A ( y ) | y = 1 0 , and therefore, the y = 0 is the evolutionary stabilization strategy, and the result is shown in Figure A2. □
The incremental stability of firm B’s behavior strategy is then analyzed.
Proof A3.
The derivative of the replication kinetic equation for firm B can be further calculated as follows:
B ( z ) = d B ( z ) d z = ( 1 2 z ) [ S B + V B Q B + ( θ + x θ x ) P B + ( 1 y ) m + n y ]
The following two cases are discussed separately according to the equation.
Under the constraints 0 < x < 1 , 0 < y < 1 , 0 < z < 1 . The constraint that if Q B < S B + V B + θ P B + n can be deduced that:
When y < y * , B ( z ) | z = 0 0 , B ( z ) | z = 1 < 0 , then, the z = 1 is the evolutionary stabilization strategy, as shown in Figure A3.
When y > y * , B ( z ) | z = 0 < 0 , B ( z ) | z = 1 > 0 , then, the z = 0 is the evolutionary stabilization strategy, as shown in Figure A3.
Figure A3. Replicated dynamic phase diagram of company B.
Forests 14 01002 g0a3
Under the constraints 0 < x < 1 , 0 < y < 1 , 0 < z < 1 . The constraint that if Q B < S B + V B + θ P B + n can be deduced that S B + V B Q B + ( θ + x θ x ) P B + ( 1 y ) m + n y < 0 , the condition always holds; B ( z ) | z = 0 < 0 , B ( z ) | z = 1 0 . Therefore, z = 0 is the evolutionary stabilization strategy, as shown in Figure A3. □

References

  1. Fan, W.; Wang, S.; Gu, X.; Zhou, Z.; Zhao, Y.; Huo, W. Evolutionary game analysis on industrial pollution control of local government in China. J. Environ. Manag. 2021, 298, 113499. [Google Scholar] [CrossRef] [PubMed]
  2. Ju, F.; Zhou, J.; Jiang, K. Evolution of stakeholders’ behavioral strategies in the ecological compensation mechanism for poverty alleviation. Resour. Conserv. Recycl. 2022, 176, 105915. [Google Scholar] [CrossRef]
  3. Sun, Y.; Liu, B.; Fan, J.; Qiao, Q. The multi-player evolutionary game analysis for the protective development of ecotourism. Environ. Sci. Policy 2021, 126, 111–121. [Google Scholar] [CrossRef]
  4. Hiironen, J.; Riekkinen, K. Agricultural impacts and profitability of land consolidations. Land Use Policy 2016, 55, 309–317. [Google Scholar] [CrossRef]
  5. Pruetz, R.; Standridge, N. What Makes Transfer of Development Rights Work?: Success Factors From Research and Practice. J. Am. Plan. Assoc. 2008, 75, 78–87. [Google Scholar] [CrossRef]
  6. Burnett, P. Land Use Regulations and Regional Economic Development. Land Econ. 2016, 92, 237–255. [Google Scholar] [CrossRef]
  7. Wang, H.; He, C.; Li, W.; Nie, X.; Zhong, H.; Wen, L. Will transferable development rights (TDR) increase regional economic imbalance?—A quota transaction case of cultivated land conversion and reclamation in Guangxi, China. Habitat Int. 2020, 104, 102254. [Google Scholar] [CrossRef]
  8. Rosegrant, M.; Binswanger, H.P. Markets in tradable water rights: Potential for efficiency gains in developing country water resource allocation. World Dev. 1994, 22, 1613–1625. [Google Scholar] [CrossRef]
  9. Zheng, H.; Liu, Y.; Zhao, J. Understanding water rights and water trading systems in China: A systematic framework. Water Secur. 2021, 13, 100094. [Google Scholar] [CrossRef]
  10. Keohane, N.; Petsonk, A.; Hanafi, A. Toward a club of carbon markets. Clim. Chang. 2015, 144, 81–95. [Google Scholar] [CrossRef]
  11. Weng, Q.; Xu, H. A review of China’s carbon trading market. Renew. Sustain. Energy Rev. 2018, 91, 613–619. [Google Scholar] [CrossRef]
  12. Wang, H.; Chen, Z.; Wu, X.; Nie, X. Can a carbon trading system promote the transformation of a low-carbon economy under the framework of the porter hypothesis?—Empirical analysis based on the PSM-DID method. Energy Policy 2019, 129, 930–938. [Google Scholar] [CrossRef]
  13. Sullivan, J.; Amacher, G.S.; Chapman, S. Forest banking and forest landowners forgoing management rights for guaranteed financial returns. For. Policy Econ. 2003, 7, 381–392. [Google Scholar] [CrossRef]
  14. Wei, G.; Kong, X.; Wang, Y.; Gao, Q. China’s Forest Eco-Bank Project: An Analysis Based on the Actor-Network Theory. Forests 2022, 13, 944. [Google Scholar] [CrossRef]
  15. Pirard, R. Market-based instruments for biodiversity and ecosystem services: A lexicon. Environ. Sci. Policy 2012, 19–20, 59–68. [Google Scholar] [CrossRef]
  16. Bramwell, B.; Lane, B. Critical research on the governance of tourism and sustainability. J. Sustain. Tour. 2011, 19, 411–421. [Google Scholar] [CrossRef]
  17. Jamal, T.; Camargo, B.A. Tourism governance and policy: Whither justice? Tour. Manag. Perspect. 2018, 25, 205–208. [Google Scholar] [CrossRef]
  18. Althor, G.; Witt, B. A quantitative systematic review of distributive environmental justice literature: A rich history and the need for an enterprising future. J. Environ. Stud. Sci. 2019, 10, 91–103. [Google Scholar] [CrossRef]
  19. Schaafsma, M.; Eigenbrod, F.; Gasparatos, A.; Gross-Camp, N.; Hutton, C.; Nunan, F.; Schreckenberg, K.; Turner, K. Trade-off decisions in ecosystem management for poverty alleviation. Ecol. Econ. 2021, 187, 107103. [Google Scholar] [CrossRef]
  20. Moledina, A.A.; Coggins, J.S.; Polasky, S.; Costello, C. Dynamic environmental policy with strategic firms: Prices versus quantities. J. Environ. Econ. Manag. 2003, 45, 356–376. [Google Scholar] [CrossRef]
  21. Zheng, S.; Yu, L. The government’s subsidy strategy of carbon-sink fishery based on evolutionary game. Energy 2022, 254, 124282. [Google Scholar] [CrossRef]
  22. Dong, J.; Jiang, Y.; Liu, D.; Dou, X.; Liu, Y.; Peng, S. Promoting dynamic pricing implementation considering policy incentives and electricity retailers’ behaviors: An evolutionary game model based on prospect theory. Energy Policy 2022, 167, 113059. [Google Scholar] [CrossRef]
  23. Lin, B.; Ge, J. Carbon sinks and output of China’s forestry sector: An ecological economic development perspective. Sci. Total. Environ. 2019, 655, 1169–1180. [Google Scholar] [CrossRef] [PubMed]
  24. Sandra, D.A.; Otto, A.R. Cognitive capacity limitations and Need for Cognition differentially predict reward-induced cognitive effort expenditure. Cognition 2018, 172, 101–106. [Google Scholar] [CrossRef] [PubMed]
  25. Chen, Z.; Wang, T. Photovoltaic subsidy withdrawal: An evolutionary game analysis of the impact on Chinese stakeholders’ strategic choices. Sol. Energy 2022, 241, 302–314. [Google Scholar] [CrossRef]
  26. Cressman, R.; Tao, Y. The replicator equation and other game dynamics. Proc. Natl. Acad. Sci. USA 2014, 111, 10810–10817. [Google Scholar] [CrossRef]
  27. Ritzberger, K.; Weibull, J.W. Evolutionary Selection in Normal-Form Games. Econometrica 1995, 63, 1371. [Google Scholar] [CrossRef]
  28. Xu, X.; Yang, Y. Analysis of the Dilemma of Promoting Circular Logistics Packaging in China: A Stochastic Evolutionary Game-Based Approach. Int. J. Environ. Res. Public Health 2022, 19, 7363. [Google Scholar] [CrossRef]
  29. Liu, X.; Lin, K.; Wang, L. Stochastic evolutionary game analysis of e-waste recycling in environmental regulation from the perspective of dual governance system. J. Clean. Prod. 2021, 319, 128685. [Google Scholar] [CrossRef]
  30. Vaissière, A.-C.; Levrel, H. Biodiversity offset markets: What are they really? An empirical approach to wetland mitigation banking. Ecol. Econ. 2015, 110, 81–88. [Google Scholar] [CrossRef]
  31. Gao, X.; Shen, J.; He, W.; Sun, F.; Zhang, Z.; Guo, W.; Zhang, X.; Kong, Y. An evolutionary game analysis of governments’ decision-making behaviors and factors influencing watershed ecological compensation in China. J. Environ. Manag. 2019, 251, 109592. [Google Scholar] [CrossRef] [PubMed]
  32. Spreafico, C.; Landi, D. Investigating students’ eco-misperceptions in applying eco-design methods. J. Clean. Prod. 2022, 342, 130866. [Google Scholar] [CrossRef]
Figure 1. Operational mechanism of the FEB.
Forests 14 01002 g001
Figure 2. The relationship between the three stakeholders.
Forests 14 01002 g002
Figure 3. Evolutionary game system.
Forests 14 01002 g003
Figure 4. The evolution toward the sink F1 (0, 0, 0).
Forests 14 01002 g004
Figure 5. The evolution toward the sink F4 (0, 1, 1).
Forests 14 01002 g005
Figure 6. The evolution toward the sink F5(1, 0, 0).
Forests 14 01002 g006
Figure 7. (0, 1, 1) Not an evolutionary game of the same scale.
Forests 14 01002 g007
Figure 8. The impact of the probability of government fines on the evolution of tripartite behaviors.
Forests 14 01002 g008
Figure 9. The impact of the probability of media reporting (θ) on the evolution of tripartite behaviors.
Forests 14 01002 g009
Table 1. Revenue matrix for local government, firm A, and firm B.
Active Regulation by Local Governments (x)Negative Regulation by Local Governments (1 − x)
Company A Chooses to Participate in (y)Company A Refuses to Participate (1 − y)Related Companies Opt-in (y)Related Companies Refuse to Join (1 − y)
Company B chooses to participate in (z)EGABCG1EGB + PACG1EGABEGB + θ(PACG2) + (1 − θ)EGA
TA + SA + VAQATAPAmTA + SA + VAQATAθPAm
TB + SB + VBQBTB + SB + VBQB + mTB + SB + VBQBTB + SB + VBQB + m
Company B refuses to participate (1 − z)EGA + PBCG1PA + PBCG1EGA + θ(PBCG2) + (1 − θ) EGB(1 − θ)EGAB + θ(PA + PB − 2CG2)
TA + SA + VAQA + nTAPATA + SA + VAQA + nTAθPA
TBPBnTBPBTBθPBnTBθPB
Table 2. Eigenvalues of Jacobi matrix.
Eigenvalue 1λ1Eigenvalue 2λ2Eigenvalue 3λ3
(0, 0, 0)(1 − θ)(PA + PBEGAB) − CG1 + 2θCG2SA + VAQA + θPA + nSB + VBQB + θPB + m
(0, 0, 1)(θ − 1)EGA + (1 − θ) PACG1 + θCG2SA + VAQA + θPA + mQBSBVBθPBm
(0, 1, 0)(θ − 1)EGB + (1 − θ) PBCG1 + θCG2QASAVAθPAnSB + VBQB + θPB + n
(0, 1, 1)CG1QASAVAθPAmQBSBVBθPBn
(1, 0, 0)(1 − θ)(EGABPAPB) + CG1 − 2θCG2SA + VAQA + PA + nSB + VBQB + PB + m
(1, 0, 1)(1 − θ)EGA − (1 − θ) PA + CG1θCG2SA + VAQA + PA + mQBSBVBPBm
(1, 1, 0)(1 − θ)EGB − (1 − θ) PB + CG1θCG2QASAVAPAnSB + VBQB + PB + n
(1, 1, 1)CG1QASAVAPAmQBSBVBPBn
Table 3. Stability analysis of the equilibrium solution of the three-party evolutionary game system.
λ1λ2λ3Stable ConditionStable Conditions
F1 (0, 0, 0)ESS(1 − θ) (PA + PBEGAB) + 2θCG2 < CG1
QA > SA + VA + θPA + m
QB > SB + VB + θPB + n
F2 (0, 0, 1)+, −+, −+, −No ESS/
F3 (0, 1, 0)+, −+, −+, −No ESS/
F4 (0, 1, 1)ESSQA < SA + VA + θPA + m
QB < SB + VB + θPB + n
F5 (1, 0, 0)ESSCG1 < 2θCG2 − (1− θ) (EGABPAPB)
QA > SA + VA + PA + m
QB > SB + VB + PB + n
F6 (1, 0, 1)+, −+, −+, −No ESS/
F7 (1, 1, 0)+, −+, −+, −No ESS/
F8 (1, 1, 1)++, −+, −No ESS/
Table 4. Equilibrium simulation under (0, 0, 0).
ParametersEGAEGBPAPBCG1CG2SASBVAVBQAQBmnθ
Values33446255441818330.5
Table 5. Equilibrium simulation under (0, 1, 1).
ParametersEGAEGBPAPBCG1CG2SASBVAVBQAQBmnθ
Values33446255331010330.5
Table 6. Equilibrium simulation under (1, 0, 0).
ParametersEGAEGBPAPBCG1CG2SASBVAVBQAQBmnθ
Values33553622442121330.5
Disclaimer/Publisher’s Note: The statements, opinions and data contained in all publications are solely those of the individual author(s) and contributor(s) and not of MDPI and/or the editor(s). MDPI and/or the editor(s) disclaim responsibility for any injury to people or property resulting from any ideas, methods, instructions or products referred to in the content.