Abstract
Carbon gas flux is important for studies on carbon dynamics in mangroves, but the controlling factors have not always been sufficiently understood. In this study, it is suggested that sediment carbon dioxide (CO2) fluxes in a natural mangrove in Southern China are controlled by tidal positions, seasons, species, the densities of crab burrows and pneumatophores, light conditions and sediment temperature. All these factors account for 51.47% variation in CO2 flux from the sediment–air interface. CO2 flux generally decreased along the tidal position from landward to seaward, and was higher in the dry season than in the wet season. CO2 flux was highest in Avicennia marina (grey mangrove) in comparison with Aegiceras corniculatum (river mangrove) and Kandelia obovata. Pneumatophores and crab burrows promoted sediment CO2 flux in the mangrove at a rate of 18.29 and 15.52 mmol m−2 d−1. Dark flux was higher than light flux. Sediment temperature has a negative influence on CO2 flux. Pneumatophores explain the most variation (13.9%) in CO2 flux among the above factors. Our study suggests that the photosynthesis activity of microphytobenthos is an important factor driving the change of CO2 emissions in this natural mangrove. This is of great significance for the study and for the full exploitation of the carbon sink potential of mangroves.
1. Introduction
Mangroves have been credited with a highly productive ecosystem and high sediment carbon (C) accumulation capacity [1]. In particular, they are among the most carbon-rich forests in the tropics [2]. They are increasingly regarded as C rich ecosystems that warrant restoration and preservation [3], considered to be able to assume a role in regulating climate, sequestering and preserving noticeable amounts of C to help counteract anthropogenic carbon dioxide (CO2) emissions [4,5]. During 2003 to 2010, total wetland C stocks increased by 22% due to mangrove encroachment into salt marshes along the eastern coast of Florida, USA [6]. Mangrove C stocks can also change due to land use change, and natural growth and regeneration [7]. Accordingly, studies in terms of mangrove C dynamics have been listed as one of the focuses in the discussion of mangroves over the past five decades [8].
Among the research branches of mangrove C dynamics, C gas flux attracts attention in mangrove research communities, and specific studies contribute to the understanding of net ecosystem productivity (NEP) and other ecosystem processes. CO2 flux from sediments is a noticeable fraction of C loss. Specifically, the quantification of CO2 flux is significant, since 94%–98% of sediment organic carbon (OC) losses in mangroves result from microbial respiration, i.e., CO2 flux [9]. Measurements of sediment CO2 flux in mangroves have a great potential to serve as an indicator of ecosystem processes, including sediment metabolic activity, persistence and decay of plant residue (such as root and rhizosphere material) in sediments, and conversion of sediment OC to CO2 [10,11].
The release of CO2 via the sediment–air interface includes CO2 flux from litter decomposition, roots and heterotrophic respiration [12,13,14], and tends to be measured by the closed dynamic chamber (CDC) technique. The net primary productivity (NPP) and heterotrophic respiration in sediments permit the estimation of NEP. Similar extrapolation of C budgets in global mangrove ecosystems used the heterotrophic CO2 flux as a proxy for C mineralization in sediments [15]. The heterotrophic respiration in sediments follows a sequence on the ground of the availability of electron acceptors, which is associated with vertical changes in redox chemistry and population abundance of the different metabolic types of bacteria [16]. The main pathways of sediment heterotrophic respiration include aerobic respiration, sulphate reduction, manganese reduction, iron reduction and denitrification. Because sediments have microzones where some of these metabolic processes coexist, what all of these processes have in common is the production of CO2, as it can be measured at the sediment surface in closed chambers to give an estimate of the total heterotrophic respiration of C.
CO2 flux from the sediment–air interface in mangroves has been found to vary with sediment properties, tidal positions [17], seasons and species [18], and be modulated by crab burrows and pneumatophores [19]. However, past studies tended to examine the variation in CO2 flux with only some of the aforementioned factors. In addition, [19] investigated the increase of CO2 release due to the occurrence of pneumatophores, but did not establish the relationship between CO2 flux and the densities of pneumatophores. However, this kind of relationship may be attributed to the fact that pneumatophores provide large amounts of oxygen for sediment microbial activities and increase aerobic respiration, thus affecting CO2 flux [20].
Mangroves are primarily distributed in tropical and subtropical coastal regions. In China, mangroves occur in the southern region where the climate is subtropical. In this study, CO2 flux measurement was conducted in a natural mangrove in Southern China. We aimed to examine the relationship between CO2 flux and a variety of variables, including seasons, tidal positions, species, sediment temperature, crab burrow and pneumatophore densities, and to identify the main factors resulting in the variation of sediment CO2 flux. The result of our study is expected to shed light on the studies of mangrove C flux.
2. Materials and Methods
2.1. Sampling Site
This study was conducted in Zhangjiangkou National Mangrove Nature Reserve (23°53′45″–23°56′00″ N, 117°24′07″–117°24′30″ E) in Yunxiao, Fujian Province, China (Figure 1). The sampling site is located in the mid-to-upper tidal position of the Zhangjiang estuary, which is semi-enclosed and opens into the Taiwan Strait. The estuary occupies ~2360 ha and is forested by 117.9 ha of mangroves. Mangroves in the estuary are dominated by Avicennia marina (grey mangrove), Kandelia obovata and Aegiceras corniculatum (river mangrove). Seven of 32 National Nature Reserves, established to protect native animal or plant species over China’s coast, have been markedly invaded by Spartina alterniflora, with the total area accounting for about one-third of the total invasion area in mainland China. Given the rapid expansion of S. alterniflora since its introduction and the serious ecological effects, effective response decisions are urgently needed [21]. The invasion of cordgrass Spartina alterniflora has resulted in rapid encroachment of the intertidal mudflat seaward to the mangroves, effectively suppressing mangrove expansion into the accreting coast [22]. Table 1 shows the mangrove and saltmarsh species in the studied area. The average annual rainfall was 1583.1 mm, and the average annual temperature was 22.4 °C. The detailed monthly temperature and rainfall are shown in Table 2. The average water salinity was 19%.
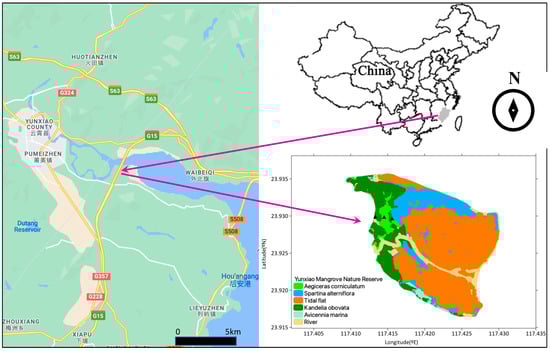
Figure 1.
CO2 flux sampling site in Yunxiao, Fujian Province, China. The triangles in the lower right panel show the sampling points.

Table 1.
A list of mangrove and saltmarsh plant species in the studied area.
Table 2.
Monthly temperature and precipitation in 2022 in the studied area.
2.2. Sampling Scheme
A four-factorial sampling design (season × tidal position × species × light condition) was considered in this study. While these factors have been considered important in regulating CO2 fluxes [17,18], they have seldom been examined together. Light conditions were defined as dark or light. The sampling campaigns were conducted in April (wet season) and November (dry season). CO2 fluxes were measured across a tidal gradient from seaward, middle to landward sites. At each location, sampling was performed in all the dominant species, i.e., Avicennia marina, Kandelia obovata and Aegiceras corniculatum, under both dark and light conditions. Five replicates (plots) were selected randomly. The plots are ~2 m away from each other, and the sampling area at each position is 10 m2.
2.3. Sampling Methods
In order to standardize the measurements, CO2 efflux across the sediment–air interface was measured between 9:00 am and 1:00 pm in the mangrove on consecutive days during the sampling campaign. Dark and light CO2 fluxes were measured using transparent polycarbonate chambers and chambers covered by aluminum foil, respectively. The chambers (diameter 35.5 cm, volume 5.7 L) were pushed 0.5 cm into the sediment 30 min before CO2 measurement, to allow the set-up to equilibrate while preventing undue difference (e.g., temperature) in conditions between the two chambers. Each chamber has an air pump, and two sampling ports on opposite sides of the chamber through which a stream of air flow was maintained by the air pump at a flow rate of 200 mL min−1 to minimize gas build-up in the chamber. Pressure equilibrium between air in the chamber and the surrounding air was maintained by a relief vent in accordance with [23]. CO2 efflux was measured by an infrared gas analyzer SBA-5 (PP System Inc., Amesbury, MA, USA) up to a 20-min period, until a stable rate lasting for at least 2.5 min was obtained. The short incubation period was selected to avoid excessive environmental microclimatic changes (e.g., water content, sediment temperature and CO2 concentration gradients), which may influence gas diffusivity [24,25]. Zero calibration was conducted using a soda lime canister after each measurement to ensure accuracy. Sediment CO2 effluxes were calculated by the following equation:
where F is the sediment CO2 efflux (µmol m−2 s−1) and was transformed to mmol m−2 d−1, divided by a coefficient of 86.4; ∆pCO2/∆t is the variation in pCO2 with the measurement time t (ppm s−1); V is the volume of the measurement system (m3); R is the ideal gas constant of 8.2058 × 10⁻⁵ atm m3 K−1 mol−1; T is the air temperature (K); and S is the surface sediment area covered by the chamber (m2).
During each gas flux measurement, the sediment’s physical and hydrological parameters were recorded. Air and sediment temperature as well as humidity were recorded after measurement by sensors. The water level was measured by a line tape after digging a hole in the sampling plot. The number of crab burrows and pneumatophores were counted in each sampling plot. The canopy height of each mangrove species at the study site was extracted from the site map of the canopy height, generated from UAV-borne LiDAR data [26].
2.4. Statistical and Data Analysis
Multiple regression analysis was undertaken to explore the relationship between CO2 flux and all the factors, including seasons, tidal positions, species, light conditions, sediment temperature and humidity, water level, and the densities of crab burrows and pneumatophores. The assumption of homogeneity was verified by plotting the results of linear regression (similar to the homogeneity test in linear regression). The assumption of normality was tested by the Shapiro–Wilk normality test. Influential values were removed from the data set according to the Cook distance. Stepwise regression analysis was conducted with seasons, tidal positions, species and light conditions input as dummy variables, with one level of each dummy variable setting as the reference. The same multiple regression model was run for both dark and light fluxes to investigate the difference in regression coefficients. Principal component analysis (PCA) was performed to examine the variability of all variables, including CO2 flux, in the studied site.
Because seasons, tidal positions, species and light conditions are significant in the regression model, the four-way analysis of variance (ANOVA), the random effect model was used to further analyze the variation in CO2 flux among these factors. The plot is set as a random effect, as there may be variation in CO2 flux at each plot arising from differences in the sediment’s micro-environment, e.g., moisture, shading, the densities of crab burrows and pneumatophores. Data were checked for the possibility of an interaction between the random blocking factor and the main effects by Tukey’s test for additivity, and then checked for sphericity (homogeneity of variances from all pairs of treatment levels) by Mauchly’s test. Tukey’s HSD test was conducted to examine the difference where there is a significant treatment effect (the number of groups > 3). Paired-sample t test was conducted to compare dark and light CO2 efflux recorded from the paired chambers, and to compare CO2 flux in wet and dry seasons from the same location.
The variation of CO2 effluxes with species, light conditions and species over the mangroves in the nature reserve was mapped by combining the species distribution of the mangroves [26]. A map of average CO2 efflux at the study site was also generated by averaging CO2 effluxes by combining seasons and light conditions.
R programming language was used to perform data analysis [27]. The R packages ‘asbio’ [28], ‘car’ [29] and ‘relaimpo’ [30] were employed to perform the Tukey’s test for additivity, to check for sphericity and to examine the relative importance of independent variables, respectively. Data are presented as mean ± 1 standard error (SE).
3. Results
3.1. Relationship between CO2 Flux and Influential Factors
Multiple regression analysis reflects a very significant relationship between sediment CO2 flux and sediment temperature, crab burrows and pneumatophore densities, seasons, tidal positions and light conditions (p < 0.001, Table 3). The combination of the above factors explains the 51.5% variation in sediment CO2 flux (R2 = 0.515). Amongst these factors, the pneumatophore densities represent most of the variation in CO2 flux (13.85%), followed by species (12.72%) and light conditions (7.57%), while the variances explained by other factors are all below 5% (Figure 2). PCA analysis showed that the first two components explained 40.1% of the variance in all the variables in the studied mangrove forest. CO2 flux showed a close positive correlation with pneumatophore densities but negative correlations with light conditions, which is consistent with the results of multiple regression analysis (Figure 3).
Table 3.
Relationship between all CO2 fluxes and independent variables.
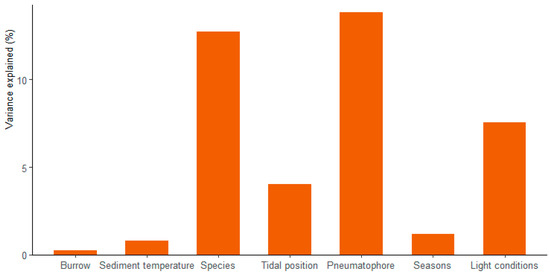
Figure 2.
The variance of CO2 flux explained by individual factors.
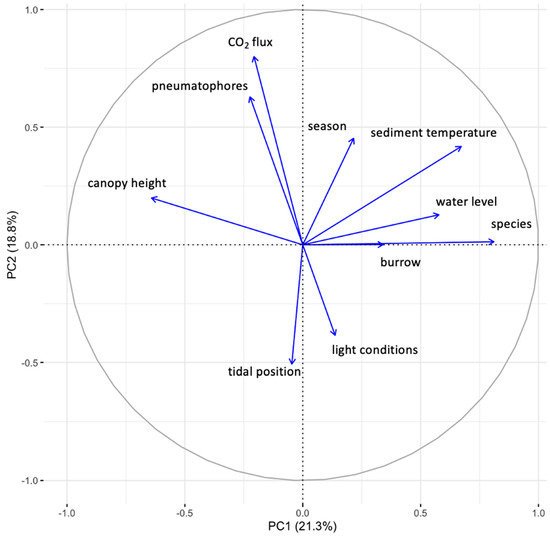
Figure 3.
PCA analysis of CO2 flux and other variables in the studies mangrove.
When dark and light fluxes were analyzed separately, a very significant relationship was found between dark flux and species, tidal positions as well as the densities of pneumatophores (p < 0.001, Table 4). Likewise, there was a very significant relationship between light flux and sediment temperature, the densities of crab burrows and pneumatophores, seasons as well as tidal positions (p < 0.001, Table 5). The above models extrapolate 48.6% and 48.7% of the variance in dark and light flux, respectively (R2 = 0.486 and 0.487).
Table 4.
Relationship between dark CO2 flux and independent variables.
Table 5.
Relationship between light CO2 flux and independent variables.
3.2. Variation in CO2 Flux with Seasons, Tidal Positions, Species and Light Conditions
Table 6 shows that there were very significant differences in sediment CO2 flux among different treatments of species, tidal positions, seasons and light conditions, and also the interactions of species × tidal position, species × season (ANOVA, p < 0.001), and species × light condition (ANOVA, p < 0.01). In addition, there was a significant interaction effect of tidal position × light condition on the variation in CO2 flux (ANOVA, p < 0.05).
Table 6.
Four-way ANOVA of CO2 flux variation.
Furthermore, CO2 flux at the seaward sites was significantly lower than at the landward and middle sites (Tukey’s HSD test, p < 0.001, Figure 4). Similarly, sediment CO2 flux from Avicennia marina was significantly higher than that from both Aegiceras corniculatum and Kandelia obovata (Tukey’s HSD test, p < 0.001). Dark flux was significantly higher than light flux (paired sample t-test, p < 0.001), while CO2 flux in the wet season was significantly lower than that in the dry season (paired sample t-test, p < 0.01). Further, CO2 flux varied under different scenarios among the combinations of 2 factors, including species × tidal position, species × light conditions, species × seasons, and tidal positions × seasons. CO2 flux was significantly higher in Avicennia marina at the landward and mid locations (scenario 1, Tukey’s HSD test, p < 0.001), in A. marina under dark conditions (scenario 2, Tukey’s HSD test, p < 0.01), in Avicennia marina in dry seasons (scenario 3, Tukey’s HSD test, p < 0.001) and at mid locations under dark conditions (scenario 4, Tukey’s HSD test, p < 0.05), in contrast to others. The spatial variation of CO2 fluxes over the mangroves in the Zhangjiangkou National Mangrove Nature Reserve was mapped by considering the variation of CO2 fluxes with seasons, light conditions and species (Figure 5). The average annual dark and light CO2 fluxes in the studied site reached 21.5 ± 1.9 mol m−2 yr−1 and 5.6 ± 1.9 mol m−2 yr−1, respectively. Combining the dark and light flux, the average annual CO2 flux reached 13.6 ± 1.5 mol m−2 yr−1 (Figure 6).
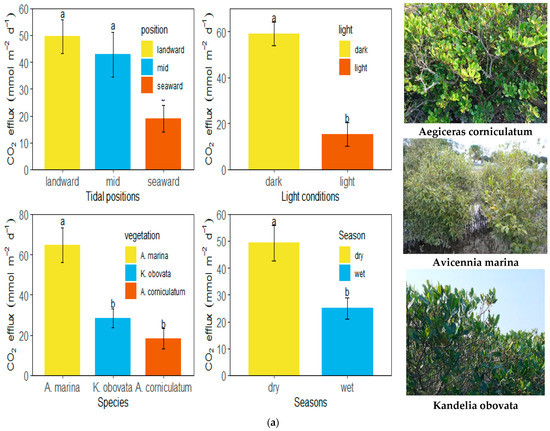
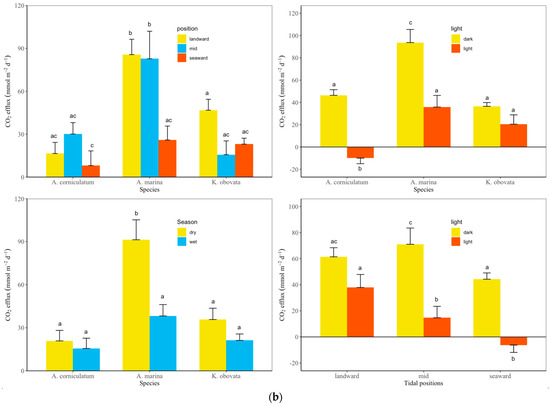
Figure 4.
Differences of CO2 flux among tidal positions, species, light conditions and seasons (a) and combinations of 2 factors (b). Error bars labelled with different letters suggest there is a significant difference in values.
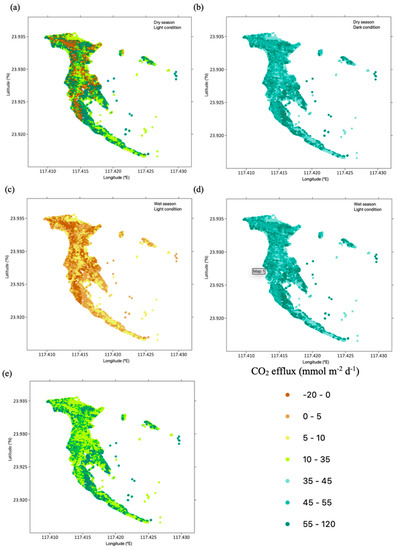
Figure 5.
Spatial distribution of CO2 efflux in Zhangjiangkou National Mangrove Nature Reserve. The panels show CO2 efflux for dry seasons and light (a), dry seasons and dark (b), wet seasons and light (c), wet seasons and dark (d), and the average value combining seasons and light conditions (e).
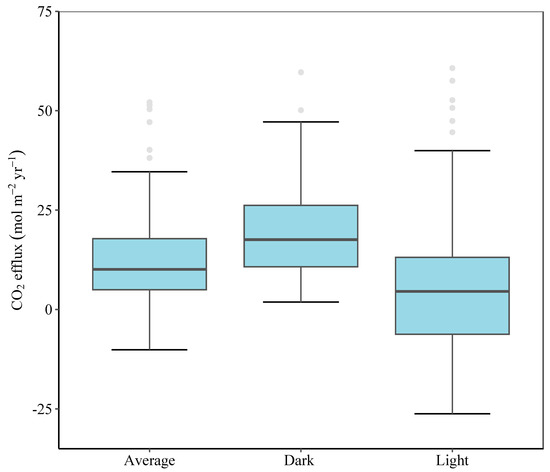
Figure 6.
Annual CO2 flux from the studied site. The grey points over the whiskers are outliers. The lower and upper hinges correspond to the 25th and 75th percentiles, respectively.
4. Discussion
4.1. Spatial and Seasonal Variation in CO2 Flux
There is spatial and seasonal variation in CO2 flux in the sampling site. CO2 flux at the landward and middle sites was found to be significantly higher than that at the seaward sites, and was higher in the dry season (November) than that in the wet season (April) in 2015. The spatial variation in CO2 flux is generally in line with the study by [17], in which contended CO2 flux drops along the tidal gradient from landward to seaward. Further, landward positions at the studied area are subject to nutrient enrichment from aquaculture wastewater discharge, which may stimulate CO2 flux [31]. The difference mainly reflects the fact that CO2 is constrained by the water-logging conditions of the sediment, as is the seasonal difference, since microbial respiration may be hindered under high water levels [32]. Nonetheless, the average CO2 flux from the landward sites is higher than that from the middle sites, but is not statistically different. The lack of a clear-cut pattern between the landward and middle sites may be due to confounding factors, such as stand stature, which determines substrate supply for microbial respiration. Mangrove tree heights are lower at the landward sites than those at the middle sites, especially Aegiceras corniculatum (landward sites ~1 m versus middle sites 3~4 m). Specifically, sulphate reduction tends to be the main anoxic pathway for sediment CO2 production in mangroves. High stand stature from the same species may exudate more organic matter from live/dead root material [33], which was consumed by sulphate reducers to produce more CO2. The average annual CO2 flux at the studied site (13.6 ± 1.5 mol m−2 year−1) is lower than the global average value of 56.5 ± 8.9 mmol m−2 day1 (i.e., 20.6 ± 3.2 mol m−2 year−1) [34].
4.2. Biotic Controls on the Release of CO2
Our result suggests that CO2 flux varies with mangrove species and the number of biogenic structures (crab burrows and pneumatophores). The variation in CO2 flux with mangrove species could also be primarily attributed to the density of pneumatophores, because pneumatophores are the major physiological characteristic of Avicennia marina, and are densely distributed in the mangroves. The impact of crab burrows on CO2 release is dual; one is the heterotrophic respiration of crabs, and the other is the increase of CO2 flux from burrows. Earlier investigation showed that the density of crab burrows was significantly higher in mangroves dominated by Avicennia marina than that of other mangroves in the studied site [35]. This result may also contribute to the higher sediment CO2 flux of Avicennia marina relative to those of Aegiceras corniculatum and Kandelia obovata.
The increase of CO2 by the biogenic structures of mangroves has been reported to be a more important portion of soil respiration in comparison with heterotrophic respiration. Mangrove sediments are featured with abundant biogenic structures. These structures alter the biogeochemical trade-off and enhance the exchange of solutes and gases several folds, making them important conduits that affect C dynamics in mangroves [36,37]. The enhancement of CO2 release by pneumatophores is owing to the aerenchyma tissues.
Mangrove pneumatophores have open lenticels when exposed to air, not only permitting rapid diffusion of gases into (e.g., O2) and from (e.g., CO2) deep sediments through the air-filled aerenchyma tissue to the atmosphere [38,39], but also by stimulating sulphate reduction via root exudates [40,41]. In particular, the study shows that CO2 flux increases linearly with pneumatophore densities, coinciding with the positive linear relationship between methane flux and pneumatophore densities [42].
Epibenthic burrows facilitate the exchange of nutrients and gases via increasing the area of sediment and air/water interfaces [43], as well as the transport of labile detritus to the subsurface layer during bioturbation activities [19]. In addition, crab burrows were suggested to considerably influence aeration, drainage, sediment chemistry and other conditions in our studied site [35].
From the regression analysis, the estimated CO2 emission promoted by pneumatophores was 0.13 and 0.467 mmol pneumatophore−1 d−1 for all and dark flux measurements, respectively. The increase of dark CO2 flux due to pneumatophores is well within the range of reported values for dark flux, i.e., 0.26–0.66 mmol pneumatophore−1 d−1 [19,37,44]. Likewise, the estimated CO2 emission per burrow was 0.394 mmol burrow−1 d−1 for all measurements. There may be at least one crab in each burrow (based on personal communication with local fishermen). Thus, this value also falls in the range of reported values (0.207–0.55 mmol burrow−1 d−1) for fiddle, ocypodid and grapsid crabs [19,44] when aggregating the increase of CO2 emission by one crab and burrow. In particular, the estimated increase of CO2 flux by burrows approaches the flux (0.39 mmol burrow−1 d−1) from [44] under sewage treatment, which is ~5× the flux without sewage treatment. Our studied mangrove site receives wastewater from adjacent aquaculture ponds. In addition, the disposal of wastewater in mangrove sediments initially leads to the enrichment of labile organic matter and nitrogen compounds. These nitrogen compounds are converted into nitrates and ammonium, which accelerate organic matter decomposition [45]. The high nutrient-enriched sewage from the ponds may promote sediment greenhouse gas emissions in mangroves [46], especially emissions from microbes inhabiting the burrow walls.
The data can be propagated from the individual biogenic structure to the unit area by averaging the number of biogenic structures under each chamber (0.099 m2). Accordingly, the estimated CO2 emission enhanced by biogenic structures was 18.29 mmol m−2 d−1 for pneumatophores and 15.52 mmol m−2 d−1 for crab burrows, which are the same order of magnitude reported in a mangrove forest in south-eastern Queensland, Australia by [47]. This could partly account for the significantly higher CO2 flux of Avicennia marina in relation to the other species, since pneumatophore densities are more than doubled in Avicennia marina compared with the overall mean. On the other hand, Avicennia generates oxic layers due to their allocation of O2 to roots, and their root system is permeable [16]. The oxic conditions may facilitate OC decomposition and hence CO2 production. Further, if excluding the influence of crab burrows and pneumatophores, CO2 flux reaches 12.93 mmol m−2 d−1, which falls in the global CO2 flux from sediment surface in mangroves estimated by [5].
4.3. The Influence of Sediment Temperature and Light Conditions on CO2 Flux
Sediment temperature is demonstrated to have a negative impact on CO2 release. Moreover, when explored separately, sediment temperature has more of a negative impact on light CO2 flux. Sediment temperature can be considered as a surrogate for light intensity during our sampling campaign. Higher sediment temperature designates more intensive sunlight, which promotes the photosynthetic activities of microphytobenthos (MPB) [18] and thereby assimilating more CO2. In addition, by measuring the δ13C-CO2 values of the CO2 emitted under dark and light conditions, we were also able to confirm the reduction of CO2 and its consumption during photosynthesis at the sediment surface [48]. This is also corroborated by the significantly higher dark flux relative to light flux in our study. Under dark conditions, the photosynthetic activity of MPB is limited while it is activated, and MPB uptakes CO2 from the chamber under light conditions. Our inference is also underpinned by [49], which suggested that temperature and chlorophyll concentrations (a proxy for MPB abundance) were the main factors accounting for the variability of sediment CO2 flux in a New Zealand mangrove.
Sediment temperature is one of the most influential factors regulating sediment greenhouse gas emissions [17], and high sediment temperature generally stimulates microbial respiration. However, sediment temperature was not found to have a relationship with dark flux; high sediment temperature in general corresponds to high air temperature which is negatively linked to CO2 flux, as present in the formula of CO2 flux calculation. Under light conditions, the negative impact of sediment temperature on CO2 flux likely suggests that the MPB photosynthesis outreaches the impact of air temperature and microbial respiration. The extrapolation of variance explained by individual factors suggests that light is the most important factor driving the variation in CO2 flux.
5. Conclusions
Our study shows that there is a significant relationship between sediment CO2 flux and sediment temperature, the densities of crab burrows and pneumatophores, seasons, tidal positions and light conditions in a natural mangrove in Southern China, among which light conditions are the most important. Sediment CO2 flux is controlled by a combination of spatial, temporal, biotic and physical factors. Further, sediment CO2 flux at the landward and middle sites was significantly higher than that at seaward sites. CO2 released from Avicennia marina was significantly faster than that from Aegiceras corniculatum and Kandelia obovata. CO2 flux measured under dark conditions and dry seasons was higher than that measured under light conditions and wet seasons. Additionally, under the scenarios of two combined factors, CO2 flux was significantly higher in Avicennia marina at landward and middle locations under dark conditions in dry seasons, and at middle locations under dark conditions, compared with others.
In particular, pneumatophores and crab burrows promote CO2 release in the mangrove forest at a rate of 18.29 and 15.52 mmol m−2 d−1, respectively. The increase of CO2 flux by pneumatophores is mainly attributed to aerenchyma tissues, promoting CO2 diffusion, but heterotrophic respiration (e.g., sulphate reduction) via root exudates is non-negligible. However, our study could not partition the two components, but the method of [50] provides the potential to address the issue. Future studies on NEP are expected to differentiate pneumatophore respiration and indirect heterotrophic respiration. The increase of CO2 flux by burrows consists of crab respiration and the enhancement of CO2 flux by burrows. Further exploration of CO2 flux from burrows of different crab species and sizes may provide clearer clues on the contribution of burrows to CO2 flux.
Author Contributions
S.N., X.O., W.W., Z.Z., F.G., Z.Y. and S.Y.L. contributed to the conception and design of the study. S.N. and X.O. analyzed the data and wrote the initial version of the ms. W.W. and S.Y.L. critically revised the ms. All authors have read and agreed to the published version of the manuscript.
Funding
This study was supported by the National Natural Science Foundation of China (Nos. 52239005, 52271280), the Science and Technology Project of Guangdong Province (2022A0505050075), and the PI project of Southern Marine Science and Engineering Guangdong Laboratory (Guangzhou) (GML2022009).
Data Availability Statement
Data are available upon request sent to Xiaoguang Ouyang.
Acknowledgments
We cordially thank Qiucheng Wu who helped to coordinate the field work. We thank Xudong Zhu at Xiamen University for providing the map of species distribution and canopy height for the mangroves in the study site. Kaizhu Wu is appreciated for his assistance in the field.
Conflicts of Interest
There are no conflict of interest in this study.
References
- Breithaupt, J.L.; Steinmuller, H.E. Refining the Global Estimate of Mangrove Carbon Burial Rates Using Sedimentary and Geomorphic Settings. Geophys. Res. Lett. 2022, 49, e2022GL100177. [Google Scholar] [CrossRef]
- Donato, D.C.; Kauffman, J.B.; Murdiyarso, D.; Kurnianto, S.; Stidham, M.; Kanninen, M. Mangroves among the most carbon-rich forests in the tropics. Nat. Geosci. 2011, 4, 293–297. [Google Scholar] [CrossRef]
- Alongi, D.M. Carbon Cycling and Storage in Mangrove Forests. Annu. Rev. Mar. Sci. 2014, 6, 195–219. [Google Scholar] [CrossRef] [PubMed]
- McLeod, E.; Chmura, G.L.; Bouillon, S.; Salm, R.; Björk, M.; Duarte, C.M.; Lovelock, C.E.; Schlesinger, W.H.; Silliman, B.R. A blueprint for blue carbon: Toward an improved understanding of the role of vegetated coastal habitats in sequestering CO2. Front. Ecol. Environ. 2011, 9, 552–560. [Google Scholar] [CrossRef]
- Siikamäki, J.; Sanchirico, J.N.; Jardine, S.L. Global economic potential for reducing carbon dioxide emissions from mangrove loss. Proc. Natl. Acad. Sci. USA 2012, 109, 14369–14374. [Google Scholar] [CrossRef]
- Doughty, C.L.; Langley, J.A.; Walker, W.S.; Feller, I.; Schaub, R.; Chapman, S.K. Mangrove Range Expansion Rapidly Increases Coastal Wetland Carbon Storage. Estuaries Coasts 2015, 39, 385–396. [Google Scholar] [CrossRef]
- Richards, D.R.; Thompson, B.S.; Wijedasa, L. Quantifying net loss of global mangrove carbon stocks from 20 years of land cover change. Nat. Commun. 2020, 11, 426. [Google Scholar] [CrossRef]
- Lee, S.Y.; Primavera, J.H.; Dahdouh-Guebas, F.; McKee, K.; Bosire, J.O.; Cannicci, S.; Diele, K.; Fromard, F.; Koedam, N.; Marchand, C.; et al. Ecological role and services of tropical mangrove ecosystems: A reassessment. Glob. Ecol. Biogeogr. 2014, 23, 726–743. [Google Scholar] [CrossRef]
- Chambers, L.G.; Davis, S.E.; Troxler, T.; Boyer, J.N.; Downey-Wall, A.; Scinto, L.J. Biogeochemical effects of simulated sea level rise on carbon loss in an Everglades mangrove peat soil. Hydrobiologia 2013, 726, 195–211. [Google Scholar] [CrossRef]
- Kirui, B.; Huxham, M.; Kairo, J.G.; Mencuccini, M.; Skov, M.W. Seasonal dynamics of soil carbon dioxide flux in a restored young mangrove plantation at Gazi Bay. In Advances in Coastal Ecology: People, Processes and Ecosystems in Kenya; Hoorweg, J.M.N., Ed.; African Studies Centre: Leiden, The Netherlands, 2009; Volume 20, pp. 122–130. [Google Scholar]
- Ryan, M.G.; Law, B. Interpreting, measuring, and modeling soil respiration. Biogeochemistry 2005, 73, 3–27. [Google Scholar] [CrossRef]
- Ouyang, X.; Kristensen, E.; Zimmer, M.; Thornber, C.; Yang, Z.; Lee, S.Y. Response of macrophyte litter decomposition in global blue carbon ecosystems to climate change. Glob. Chang. Biol. 2023. [Google Scholar] [CrossRef]
- Hanson, P.J.; Edwards, N.T.; Garten, C.T.; Andrews, J.A. Separating root and soil microbial contributions to soil respiration: A review of methods and observations. Biogeochemistry 2000, 48, 115–146. [Google Scholar] [CrossRef]
- Lee, M.-S.; Nakane, K.; Nakatsubo, T.; Koizumi, H. Seasonal changes in the contribution of root respiration to total soil respiration in a cool-temperate deciduous forest. Plant Soil 2003, 255, 311–318. [Google Scholar] [CrossRef]
- Bouillon, S.; Borges, A.V.; Castaneda, E.; Diele, K.; Dittmar, T.; Duke, N.C.; Kristensen, E.; Lee, S.Y.; Marchand, C.; Middelburg, J.; et al. Mangrove production and carbon sinks: A revision of global budget estimates. Glob. Biogeochem. Cycles 2008, 22. [Google Scholar] [CrossRef]
- Alongi, D.M. The Energetics of Mangrove Forests; Springer: New York, NY, USA, 2009; p. 216. [Google Scholar]
- Chen, G.C.; Tam, N.F.; Ye, Y. Spatial and seasonal variations of atmospheric N2O and CO2 fluxes from a subtropical mangrove swamp and their relationships with soil characteristics. Soil Biol. Biochem. 2012, 48, 175–181. [Google Scholar] [CrossRef]
- Leopold, A.; Marchand, C.; Deborde, J.; Chaduteau, C.; Allenbach, M. Influence of mangrove zonation on CO2 fluxes at the sediment–air interface (New Caledonia). Geoderma 2013, 202–203, 62–70. [Google Scholar] [CrossRef]
- Kristensen, E.; Flindt, M.; Ulomi, S.; Borges, A.; Abril, G.; Bouillon, S. Emission of CO2 and CH4 to the atmosphere by sediments and open waters in two Tanzanian mangrove forests. Mar. Ecol. Prog. Ser. 2008, 370, 53–67. [Google Scholar] [CrossRef]
- Sheng, N.; Wu, F.; Liao, B.; Xin, K. Methane and carbon dioxide emissions from cultivated and native mangrove species in Dongzhai Harbor, Hainan. Ecol. Eng. 2021, 168, 106285. [Google Scholar] [CrossRef]
- Liu, M.; Mao, D.; Wang, Z.; Li, L.; Man, W.; Jia, M.; Ren, C.; Zhang, Y. Rapid Invasion of Spartina alterniflora in the Coastal Zone of Mainland China: New Observations from Landsat OLI Images. Remote Sens. 2018, 10, 1933. [Google Scholar] [CrossRef]
- Zhang, Y.; Huang, G.; Wang, W.; Chen, L.; Lin, G. Interactions between mangroves and exotic Spartina in an anthropogenically disturbed estuary in southern China. Ecology 2012, 93, 588–597. [Google Scholar] [CrossRef]
- Xu, L.; Furtaw, M.D.; Madsen, R.A.; Garcia, R.L.; Anderson, D.J.; McDermitt, D.K. On maintaining pressure equilibrium between a soil CO2 flux chamber and the ambient air. J. Geophys. Res. Atmos. 2006, 111, D08. [Google Scholar] [CrossRef]
- Jensen, L.; Mueller, T.; Tate, K.; Ross, D.; Magid, J.; Nielsen, N. Soil surface CO2 flux as an index of soil respiration in situ: A comparison of two chamber methods. Soil Biol. Biochem. 1996, 28, 1297–1306. [Google Scholar] [CrossRef]
- Kabwe, L.; Hendry, M.; Wilson, G.; Lawrence, J. Quantifying CO2 fluxes from soil surfaces to the atmosphere. J. Hydrol. 2002, 260, 1–14. [Google Scholar] [CrossRef]
- Zhu, X.; Hou, Y.; Weng, Q.; Chen, L. Integrating UAV optical imagery and LiDAR data for assessing the spatial relationship between mangrove and inundation across a subtropical estuarine wetland. ISPRS J. Photogramm. Remote Sens. 2019, 149, 146–156. [Google Scholar] [CrossRef]
- R Core Team. A Language and Environment for Statistical Computing; R Foundation for Statistical Computing: Vienna, Austria, 2023. [Google Scholar]
- Aho, K. asbio: A Collection of Statistical Tools for Biologists, R package version 1.2-5; CRC/Taylor and Francis: Boca Raton, FL, USA, 2015.
- Fox, J.; Weisberg, S. An [1] Companion to Applied Regression, 2nd ed.; Sage: Thousand Oaks, CA, USA, 2011. [Google Scholar]
- Grömping, U. Relative importance for linear regression in R: The package relaimpo. J. Stat. Softw. 2006, 17, 1–27. [Google Scholar] [CrossRef]
- Barroso, G.C.; Abril, G.; Machado, W.; Abuchacra, R.C.; Peixoto, R.B.; Bernardes, M.; Marques, G.S.; Sanders, C.J.; Oliveira, G.B.; Filho, S.R.O.; et al. Linking eutrophication to carbon dioxide and methane emissions from exposed mangrove soils along an urban gradient. Sci. Total. Environ. 2022, 850, 157988. [Google Scholar] [CrossRef] [PubMed]
- Poungparn, S.; Komiyama, A.; Tanaka, A.; Sangtiean, T.; Maknual, C.; Kato, S.; Tanapermpool, P.; Patanaponpaiboon, P. Carbon dioxide emission through soil respiration in a secondary mangrove forest of eastern Thailand. J. Trop. Ecol. 2009, 25, 393–400. [Google Scholar] [CrossRef]
- Dittmar, T.; Lara, R.J. Molecular evidence for lignin degradation in sulfate reducing mangrove sediments (Amazonia, Brazil). Geochim. Cosmochim. Acta 2001, 65, 1403–1414. [Google Scholar] [CrossRef]
- Rosentreter, J.A.; Maher, D.; Erler, D.; Murray, R.; Eyre, B. Seasonal and temporal CO2 dynamics in three tropical mangrove creeks—A revision of global mangrove CO2 emissions. Geochim. et Cosmochim. Acta 2018, 222, 729–745. [Google Scholar] [CrossRef]
- Wang, M.; Gao, X.; Wang, W. Differences in burrow morphology of crabs between Spartina alterniflora marsh and mangrove habitats. Ecol. Eng. 2014, 69, 213–219. [Google Scholar] [CrossRef]
- Holmer, M.; Andersen, F.; Holmboe, N.; Kristensen, E.; Thongtham, N. Transformation and exchange processes in the Bangrong mangrove forest-seagrass bed system, Thailand. Seasonal and spatial variations in benthic metabolism and sulfur biogeochemistry. Aquat. Microb. Ecol. 1999, 20, 203–212. [Google Scholar] [CrossRef]
- Kitaya, Y.; Yabuki, K.; Kiyota, M.; Tani, A.; Hirano, T.; Aiga, I. Gas exchange and oxygen concentration in pneumatophores and prop roots of four mangrove species. Trees 2002, 16, 155–158. [Google Scholar] [CrossRef]
- Purnobasuki, H.; Suzuki, M. Aerenchyma tissue development and gas-pathway structure in root of Avicennia marina (Forsk.) Vierh. J. Plant Res. 2005, 118, 285–294. [Google Scholar] [CrossRef]
- Purnobasuki, H.; Suzuki, M. Aerenchyma formation and porosity in root of a mangrove plant, Sonneratia alba (Lythraceae). J. Plant Res. 2004, 117, 465–472. [Google Scholar] [CrossRef]
- Alongi, D.; Sasekumar, A.; Tirendi, F.; Dixon, P. The influence of stand age on benthic decomposition and recycling of organic matter in managed mangrove forests of Malaysia. J. Exp. Mar. Biol. Ecol. 1998, 225, 197–218. [Google Scholar] [CrossRef]
- Kristensen, E.; Alongi, D.M. Control by fiddler crabs (Uca vocans) and plant roots (Avicennia marina) on carbon, iron, and sulfur biogeochemistry in mangrove sediment. Limnol. Oceanogr. 2006, 51, 1557–1571. [Google Scholar] [CrossRef]
- Livesley, S.J.; Andrusiak, S.M. Temperate mangrove and salt marsh sediments are a small methane and nitrous oxide source but important carbon store. Estuarine, Coast. Shelf Sci. 2012, 97, 19–27. [Google Scholar] [CrossRef]
- Lee, S. Mangrove macrobenthos: Assemblages, services, and linkages. J. Sea Res. 2008, 59, 16–29. [Google Scholar] [CrossRef]
- Penha-Lopes, G.; Kristensen, E.; Flindt, M.; Mangion, P.; Bouillon, S.; Paula, J. The role of biogenic structures on the biogeochemical functioning of mangrove constructed wetlands sediments—A mesocosm approach. Mar. Pollut. Bull. 2010, 60, 560–572. [Google Scholar] [CrossRef]
- Queiroz, H.M.; Artur, A.G.; Taniguchi, C.A.K.; da Silveira, M.R.S.; Nascimento, J.C.D.; Nóbrega, G.N.; Otero, X.L.; Ferreira, T.O. Hidden contribution of shrimp farming effluents to greenhouse gas emissions from mangrove soils. Estuarine Coast. Shelf Sci. 2019, 221, 8–14. [Google Scholar] [CrossRef]
- Ouyang, X.; Guo, F. Paradigms of mangroves in treatment of anthropogenic wastewater pollution. Sci. Total. Environ. 2016, 544, 971–979. [Google Scholar] [CrossRef] [PubMed]
- Ouyang, X.; Lee, S.Y.; Connolly, R.M. Structural equation modelling reveals factors regulating surface sediment organic carbon content and CO2 efflux in a subtropical mangrove. Sci. Total. Environ. 2017, 578, 513–522. [Google Scholar] [CrossRef] [PubMed]
- Jacotot, A.; Marchand, C.; Allenbach, M. Biofilm and temperature controls on greenhouse gas (CO2 and CH4) emissions from a Rhizophora mangrove soil (New Caledonia). Sci. Total. Environ. 2019, 650, 1019–1028. [Google Scholar] [CrossRef] [PubMed]
- Bulmer, R.H.; Lundquist, C.J.; Schwendenmann, L. Sediment properties and CO2 efflux from intact and cleared temperate mangrove forests. Biogeosciences 2015, 12, 6169–6180. [Google Scholar] [CrossRef]
- Ouyang, X.; Lee, S.Y.; Connolly, R.M. Using isotope labeling to partition sources of CO2 efflux in newly established mangrove seedlings. Limnol. Oceanogr. 2017, 63, 731–740. [Google Scholar] [CrossRef]
Disclaimer/Publisher’s Note: The statements, opinions and data contained in all publications are solely those of the individual author(s) and contributor(s) and not of MDPI and/or the editor(s). MDPI and/or the editor(s) disclaim responsibility for any injury to people or property resulting from any ideas, methods, instructions or products referred to in the content. |
© 2023 by the authors. Licensee MDPI, Basel, Switzerland. This article is an open access article distributed under the terms and conditions of the Creative Commons Attribution (CC BY) license (https://creativecommons.org/licenses/by/4.0/).