Article

Interspecies Association and Community Stability of Plants in the Core Distribution Area of Thuja sutchuenensis

1
Key Laboratory National Forestry and Grassland Administration on Ecological Hydrology and Disaster Prevention in Arid Regions, Northwest Surveying and Planning Institute of National Forestry and Grassland Administration, Xi’an 710048, China
2
Chongqing Institute of Medicinal Plant Cultivation, Chongqing 408435, China
3
Key Laboratory of Forest Ecology and Environment of National Forestry and Grassland Administration, Ecology and Nature Conservation Institute, Chinese Academy of Forestry, Beijing 100091, China
4
Beijing Jiulong Mountain National Long-Term Scientific Research Base of Warm Temperate Forests, Experimental Center of Forestry in North China, Chinese Academy of Forestry, Beijing 102300, China
*
Authors to whom correspondence should be addressed.
These authors contributed equally to this work.
Forests 2023, 14(4), 762; https://doi.org/10.3390/f14040762
Submission received: 24 March 2023 / Revised: 4 April 2023 / Accepted: 5 April 2023 / Published: 7 April 2023
(This article belongs to the Section Forest Ecology and Management)

Abstract

:
The protection of endangered species is a hot topic for scholars worldwide, and interspecific association and community stability analysis are important methods with which to explore the structure and function of the endangered species community. Thuja sutchuenensis Franch. is an endangered species; however, studies on the T. sutchuenensis community remain insufficient. Here, based on the data of the plot survey of the T. sutchuenensis community in the Ta-pa Mountains and Xuebao Mountains, we analyzed the interspecific associations, niche width, and niche overlap of major species in the arborous and shrub layers, as well as community stability. The results showed that the overall interspecies association between the species of the arbor layer was non-significantly negatively associated, while the shrub layer was non-significantly positively associated. The Chi-square test results showed that the species pairs without interspecific association in the arbor layer and the shrub layer were much higher than those with significant interspecific association; in other words, the interspecific association of species in the T. sutchuenensis community was loose. The results of interspecific association coefficient analysis showed that the number of negatively associated species pairs was significantly higher than that of positive association species pairs, but Pearson’s correlation coefficient and Morisita’s niche overlap index analysis showed that the degree of competition between species in the community was small. In the arbor layer, the niche width of T. sutchuenensis was the widest, while in the shrub layer, the niche width of T. sutchuenensis was relatively high, indicating that T. sutchuenensis had a strong ability to adapt to the environment and use available resources. In addition, the intersection point of community stability (32.11, 67.89) in the vegetative community of T. sutchuenensis suggested that the community displayed a better stability. The survival strategy of T. sutchuenensis is based on its strong adaptability to the harsh environment to escape the competition among species, and this knowledge can provide a reference for the protection and restoration of endangered species.

1. Introduction

Thuja sutchuenensis Franch. is a magaphanerophyte of the genus Thuja (Cupressaceae), which is a tertiary relict plant. However, due to human interference, the mixed coniferous and broad-leaved forest dominated by T. sutchuenensis showed a tendency of succession to broad-leaved forest [1]. It was thought to be extinct until its rediscovery in the early 2000s, so it has been listed as a key protected wild plant in China and classified as an endangered species (EN) by the International Union for Conservation of Nature (IUCN) [2,3]. Wild T. sutchuenensis populations are mainly distributed in the border area of Chengkou County and the Kaizhou District of Chongqing City and Xuanhan County of the Sichuan Province. T. sutchuenensis habitat distribution is narrow and fragmented, coupled with its own deficiencies in genetics, reproduction and adaptability, which can hinder the natural regeneration of T. sutchuenensis. The population’s viability and its dominance in the community are on the decline [4,5]. Therefore, understanding the species composition and structure of the community, interspecies association, ecological niches and community stability of such species is essential both for their modern-day conservation and to discover the mechanisms that have influenced their biogeography and allowed them to persist for millennia.
Interspecies association and community stability are effective methods for studying species distribution, coexistence, mechanisms of endangerment, and revealing plant population competition and community succession. They are also important characteristics of community quantity and structure [6,7]. Interspecific association, in which pairs of species co-occur at a particular spatial scale more or less frequently than expected by chance, is usually caused by the impact of differences in the environment of the community on the distribution of species [8]. It can be used to judge the possible interactions between species and to help correctly understand the structural characteristics of plant communities [9,10,11]. The wild population of rare and endangered species is relatively low, and the interspecific relationship can better reflect the population dynamics of endangered species and their adaptability to the environment, which plays an important role in the protection and restoration of rare and endangered species [12].
Previous studies have extensively researched the distribution [13], community structure [14], population recovery [15], genetic diversity [2,16], phylogenetics [17], rhizosphere microorganisms [18,19], asexual reproduction [5], and metabolites [20] of T. sutchuenensis, and some key conclusions have been drawn. However, there is still some confusion about the interspecies association of the T. sutchuenensis community. Further study is necessary for the following reasons: T. sutchuenensis, as one of the extremely small populations of wild plants that are endangered and in need of urgent protection, has small numbers in the wild and it is difficult to investigate. Therefore, there are relatively few studies on the community ecology of T. sutchuenensis, and most of the previous studies were mainly carried out in the Ta-pa Mountains National Nature Reserve in Chengkou County [1] while ignoring the research on the Xuebao Mountains National Forest Park in Kaizhou District, another core distribution area of T. sutchuenensis. Researchers’ main concerns pertained to the dominant arborous and shrub layer species [21], ignoring the impact of interspecific relationships of non-dominant species on community structure, which may lead to the masking of roles of some key species in the community. Thus, it is necessary to expand the research scope and number of species of natural population for the protection of endangered species and population recovery. However, to the best of our knowledge, such an experiment has not yet been conducted.
Considering the above factors, in this paper, T. sutchuenensis community survey plots were set up in the Ta-pa Mountains and Xuebao Mountains. The interspecific associations, niche width, and niche overlap of major species in the arborous and shrub layers and community stability were analyzed. The objectives of our study were: (1) to explore the role of interspecific associations in the mechanisms of endangerment of the extremely small populations of T. sutchuenensis; (2) to assess the stability of natural populations in the core distribution area of T. sutchuenensis. This research could help determine the current status of interspecific relationships and community stability of the T. sutchuenensis natural population, providing a theoretical basis for the protection, population recovery and management of the endangered species T. sutchuenensis.

2. Materials and Methods

2.1. Location Overview of Study Area

The study areas are located in the Ta-pa Mountains National Nature Reserve (TPM) in Chengkou County and Xuebao Mountains National Forest Park (XBM) in the Kaizhou District of Chongqing City. Geographic locations are between 108 30 109 15 E and 31 30 31 50 N, respectively, and the altitude range of T. sutchuenensis is 900 m to 2200 m. The region is characterized by a northern subtropical mountain climate, an annual average air temperature of 14.1 °C, an annual frost-free period of 234 days, an average annual rainfall of 1319 mm, and 1165.1 h of annual sunshine. The zonal vegetation is mid-subtropical evergreen broad-leaved forest, and the soil is mountain cinnamon or tan soil developed on limestone parent material [21].

2.2. Plots Setting and Data Collection

On the basis of a comprehensive survey of Ta-pa Mountains National Nature Reserve and Xuebao Mountains National Forest Park, the standard plot method was used to carry out plant community surveys. Considering the characteristics of the distribution of various plants along the habitat gradient, the lowest altitude of the plot was 980 m, and the highest altitude was 2169 m. The location of the sample plot was selected in a representative section in the concentrated distribution area of T. sutchuenensis, with a plot area of 20 m × 20 m, and a total of nine plots were set up. Four 10 m × 10 m arbor survey samples were evenly set in each plot. The diameter at breast height (DBH) and the height of trees with DBH greater than 4 cm in the plot were measured by DBH ruler and TruPulse LI-T200B altimeter (Laser Technology Inc., Englewood, CO, USA), and based on the Flora of China, the species names were identified and recorded. Then, four 5 m × 5 m and 2 m × 2 m shrub and herb sample subplots were set up in each arbor sample, and the species name, richness, height, ground diameter, and coverage were measured [14]. Next, 42, 165, and 70 species of plants were recorded in the arbor layer, shrub layer, and herb layer, respectively. Meanwhile, the latitude and longitude, altitude, slope, aspect, and slope position of each plot were measured by geological and compass and Garmin Map80 GPS (GARMIN, CH) [14]. See Table 1 for an overview of the various sites.

2.3. Data Analysis

2.3.1. Interspecific Association

Based on field survey data, a 2 × 2 contingency table of “sample–species” composition was created, and a total of 36 samples of 10 m × 10 m were used for interspecific association analysis [22]. For each pair of species A and B, we can obtain a contingency table such as Table 2.
Firstly, the overall connectivity of the arbor layer and shrub layer species in the natural communities of T. sutchuenensis were tested based on the variance ratio ( V R ). For instance, V R > 1 means that the community species is positively correlated; otherwise, it is negatively correlated [23]. The W statistic was used to test the significance of V R . The formulas are listed below:
P i = n i / N
V R = S 2 T / δ 2 T = [ 1 N i = 1 N ( T j t ) 2 ] / i = n S P i ( 1 P i )
W = V R × N
where n i is the number of quadrats containing species i, N is the total number of quadrats, S is the total number of species, T j is the number of species occurring in quadrat j, and t is the average number of species in the quadrats.
Secondly, the Chi-square ( χ 2 ) test based on Yates correction was used to test for any relation between species [24], and the association coefficient ( A C ) was used to reflect the tightness of the connection between species. If the A C value was closer to 1.00, the positive association between species was closer; if the A C value was closer to −1.00, the negative association between species was closer, and if A C was equal to 0, the species were relatively independent [25]. The formulas are listed below:
χ Y a t e s 2 = ( a d b c 0.5 n ) 2 n ( a + b ) ( a + c ) ( b + d ) ( c + d )
if a d b c , A C = a d b c ( a + b ) ( b + d ) if b c > a d , and d a , A C = a d b c ( a + b ) ( a + c ) if b c > a d , and d < a , A C = a d b c ( b + d ) ( d + c )
Thirdly, the Pearson correlation coefficient was used to judge the degree of correlation between species pairs [6]. The formula is listed below:
r i k = j = 1 N ( x i j x ¯ i ) ( x k j x ¯ k ) j = 1 N ( x i j x ¯ i ) 2 j = 1 N ( x k j x ¯ k ) 2
where x is the number of individuals of a species in the quadrat, r i k is the correlation coefficient between species i and species k, j is the quadrat, and N is the total number of quadrats.
Finally, the Levins’s niche width index was used to measure the niche width of species ( B i ), and the Morisita’s niche overlap index ( O i k ) between species pairs was calculated [26,27]. The formulas are listed below:
B i = 1 j = 1 r ( P i j ) 2
O i k = 2 j = 1 r P i j P k j j = 1 r P i j 2 + j = 1 r P k j 2
where B i is the niche width of species i, j is the quadrat, r is the number of quadrats, P is the relative richness frequency of species, O i k is the niche overlap index of species i and species k, P i j and P k j are the richness of species i and k in the j quadrat, respectively.
To avoid the influence of the infrequently occurring species on the analysis results, we removed the species that appeared in the unique quadrat. After the occasional species were removed, 27 species and 112 species of plants were included in the arbor layer and shrub layer, respectively. Because there is no T. sutchuenensis in the herb layer, this paper only studies the arbor layer and shrub layer plants containing T. sutchuenensis.

2.3.2. Community Stability Index

The stability of the community was assessed using the Godron stability index. In this study, 36 samples were treated as a unit, the frequency of all the plants in the community was arranged from highest to lowest, and the cumulative reciprocal percentage and cumulative relative frequency of plant species were calculated. Then, the scatter plot was drawn and fitted with a smooth curve to determine the binomial fitting equation, and the graph of the equation y = 100 x was drawn. The coordinates of the intersection of the two equations were calculated, and the distance of this intersection from the coordinate point (20, 80) was calculated. According to the Godron stability judgment method, the smaller the distance value, the higher the community stability [28].

2.4. Statistics and Analysis

Data wrangling was performed using Excel 2016 (Microsoft, USA). Data analysis and plotting were performed using the “vegan”, “spaa”, “ggplot2” and “ggtrendline” packages in the R 4.2.1 software.

3. Results

3.1. Overall Interspecies Association Analysis

The results of the overall interspecies association analysis between species in the arbor layer and shrub layer in the natural distribution core area of T. sutchuenensis are shown in Table 3. The V R of the arbor layer is less than 1.00, the V R of the shrub layer is greater than 1.00, and the W statistics of the arbor layer and the shrub layer both fall within the critical value of the Chi-square distribution. Therefore, the overall interspecies association between the species of the arbor layer is non-significantly negatively associated, while the shrub layer is non-significantly positively associated. This indicates that insignificant competition and mutualistic symbiosis occur between species in the arbor layer and the shrub layer, respectively.

3.2. Interspecific Association Analysis

According to the results of the Chi-square test of the interspecies associations between the main plant species in different layers (Figure 1), the main plant species in the arbor layer and shrub layer in the natural distribution core area of T. sutchuenensis formed 351 and 6216 species pairs, respectively. The majority of species pairs lacked interspecific associations in the arbor layer (92.31%) and shrub layer (94.11%), which indicates that the interspecific association in the community is relatively loose.

3.3. Interspecies Association Coefficient Analysis

The association coefficient ( A C ) was used to analyze the association coefficient between plant species in the arbor layer and shrub layer in the core distribution area of the T. sutchuenensis natural community (Figure 2). Based on the A C results, the number of species pairs with negative associations in both the arbor layer and the shrub layer are higher than in the position association. The number of species pairs with a significant negative association ( A C 0.06 ) in the arbor layer is 8.00 times the number of species pairs with a significantly positive association ( A C 0.06 ), while the ratio in the shrub layer is 10.01; that is, the negative association between species in the shrub layer is stronger than in the arbor layer. In the arbor layer, T. sutchuenensis is significantly negatively associated with one other species, while it is significantly positively associated with the other three species. However, in the shrub layer, the number of species with significant negative association (40) with T. sutchuenensis is higher than that with significant positive association (three).

3.4. Interspecific Correlation Analysis

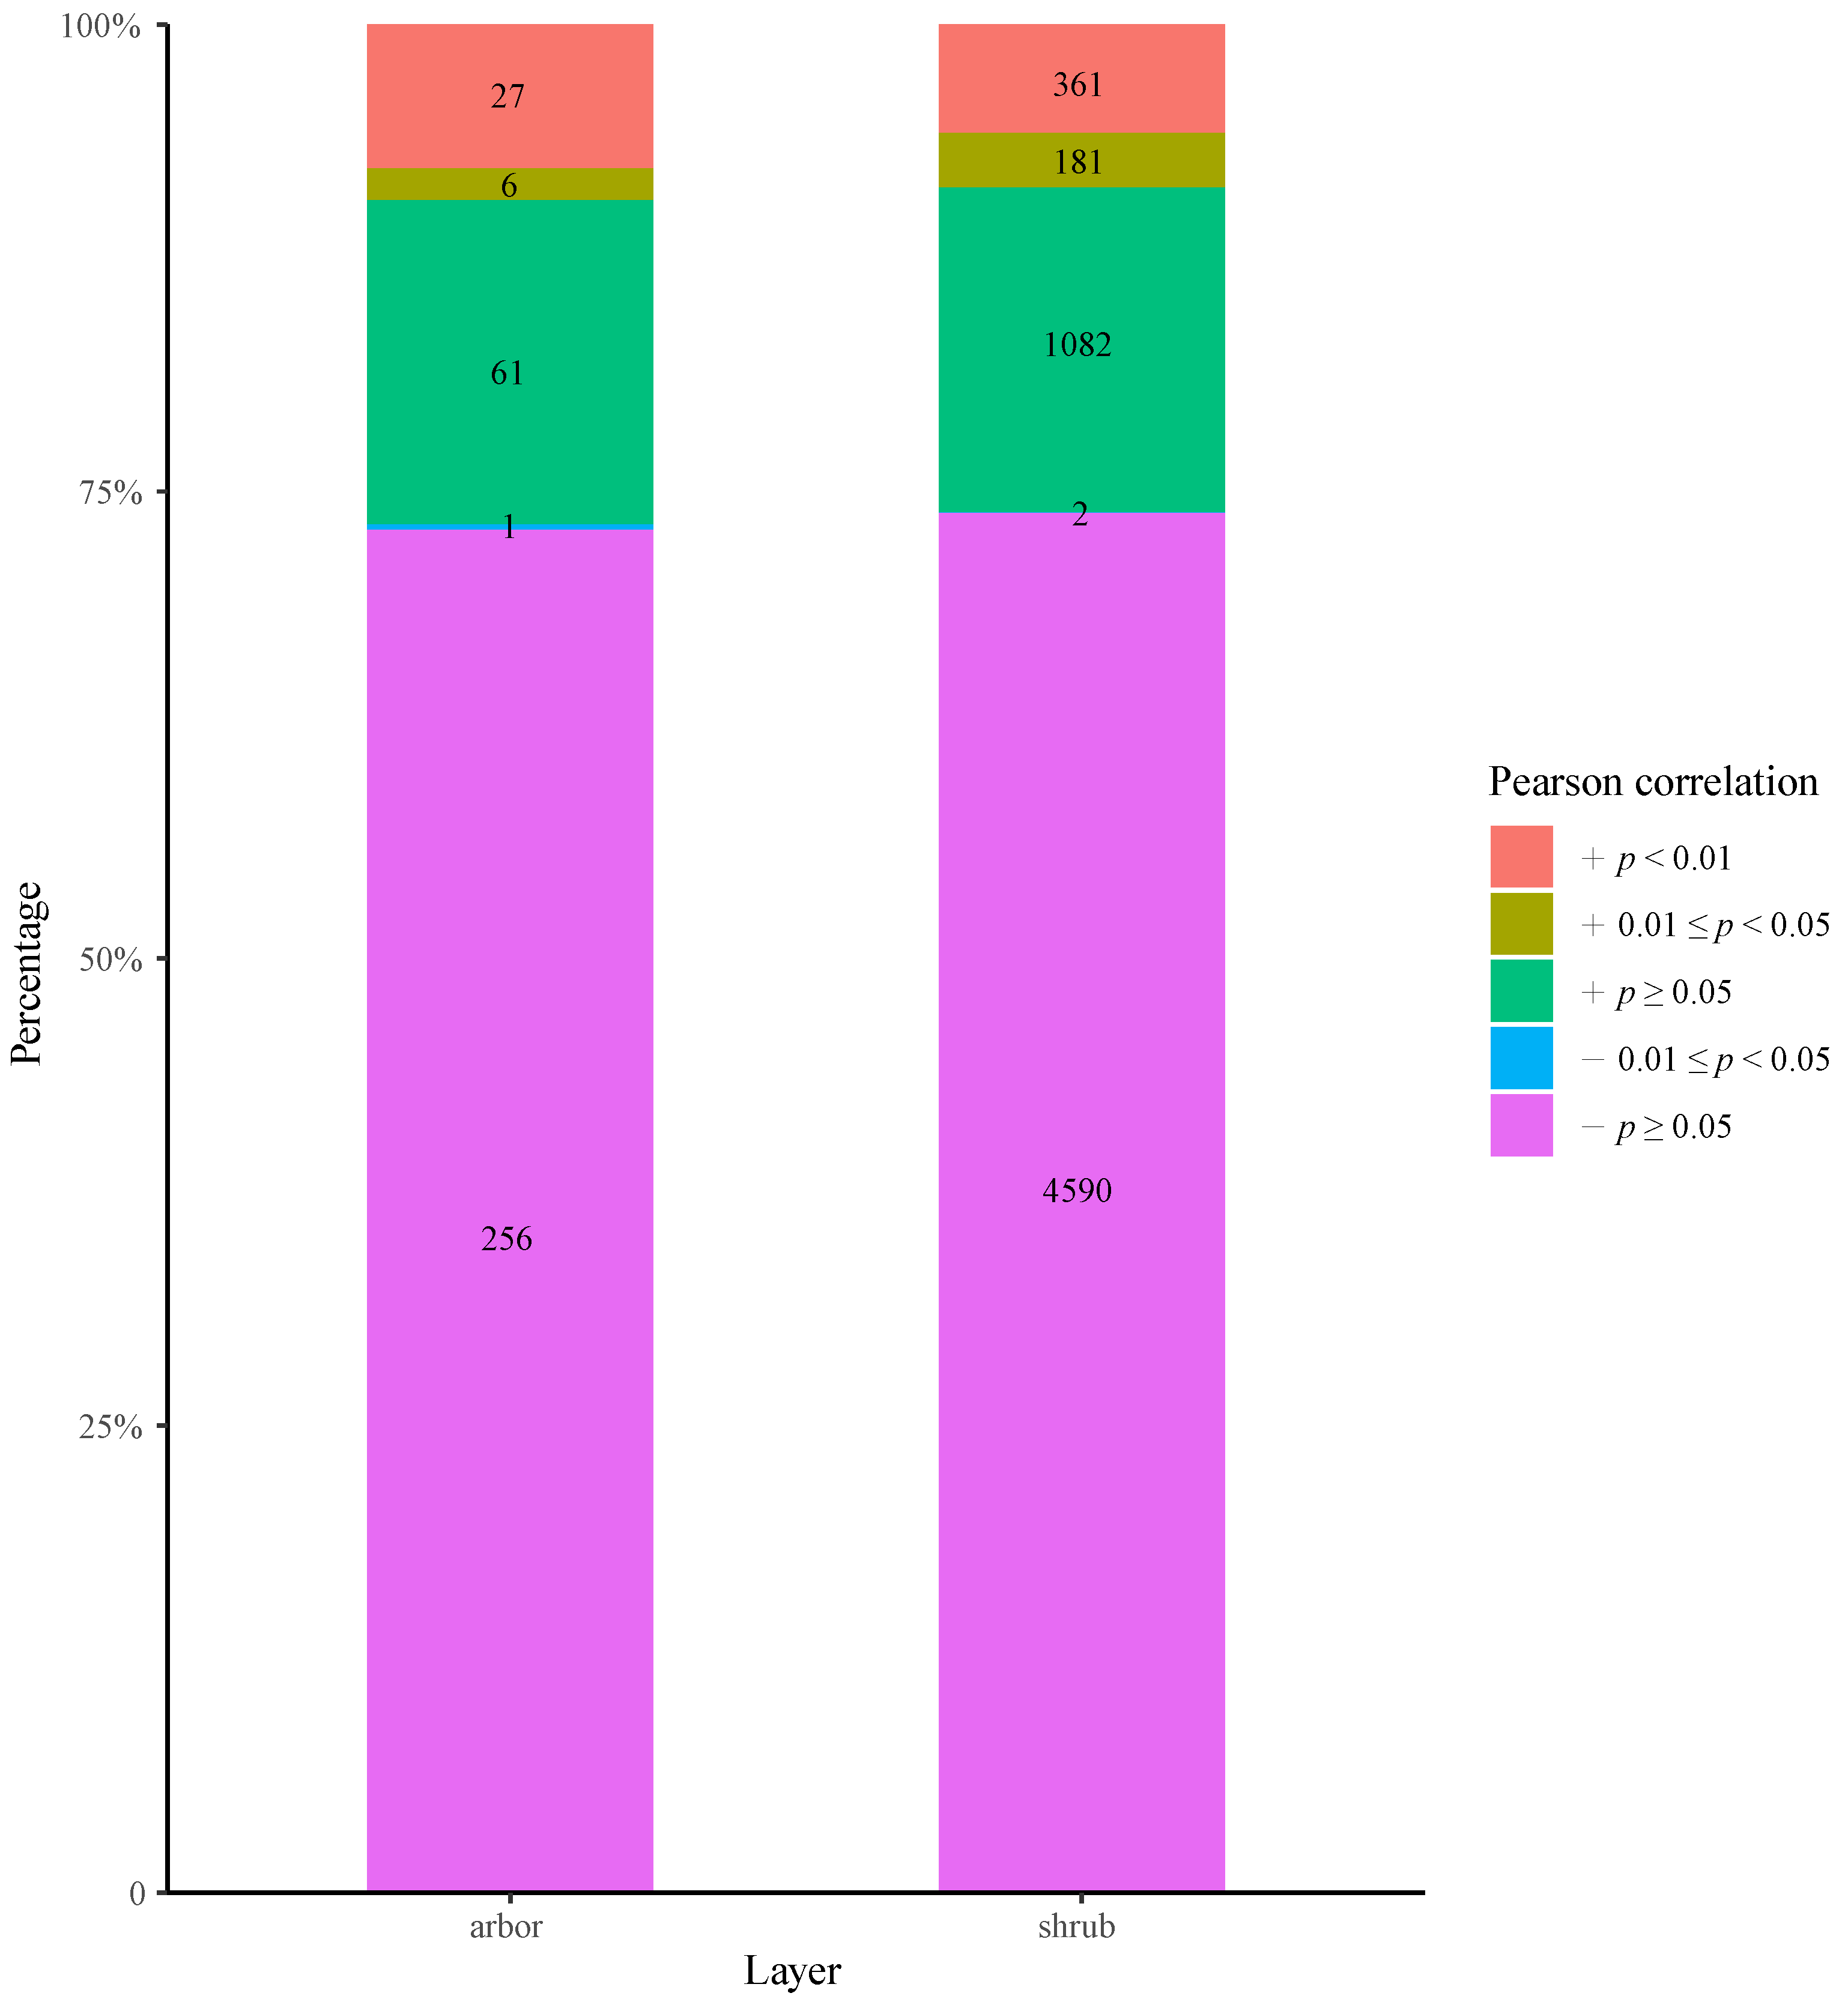
Pearson correlation analysis results are shown in Figure 3. Pearson’s correlation test showed that the number of species with significant positive correlation between the arbor layer and the shrub layer are greater than the number of species with significant negative correlation. Among 351 species pairs in the arbor layer, 27 and 6 species pairs are highly significant ( p < 0.01 ) and significantly ( p < 0.05 ) in positive correlation, while only one species pair has significantly negative correlation. Of 6216 species pairs in the shrub layer, 361 and 181 species pairs are highly significant with significant positive correlation, while only two species pairs exhibit significantly negative correlation. In the arbor layer, the T. sutchuenensis is only significantly positively correlated with Tsuga chinensis ( r = 0.47 , p < 0.01 ), while in the shrub layer, the T. sutchuenensis is significantly positively correlated with 17 species ( p < 0.05 ) and there are no significant negative correlation pairs.

3.5. Niche Width Analysis

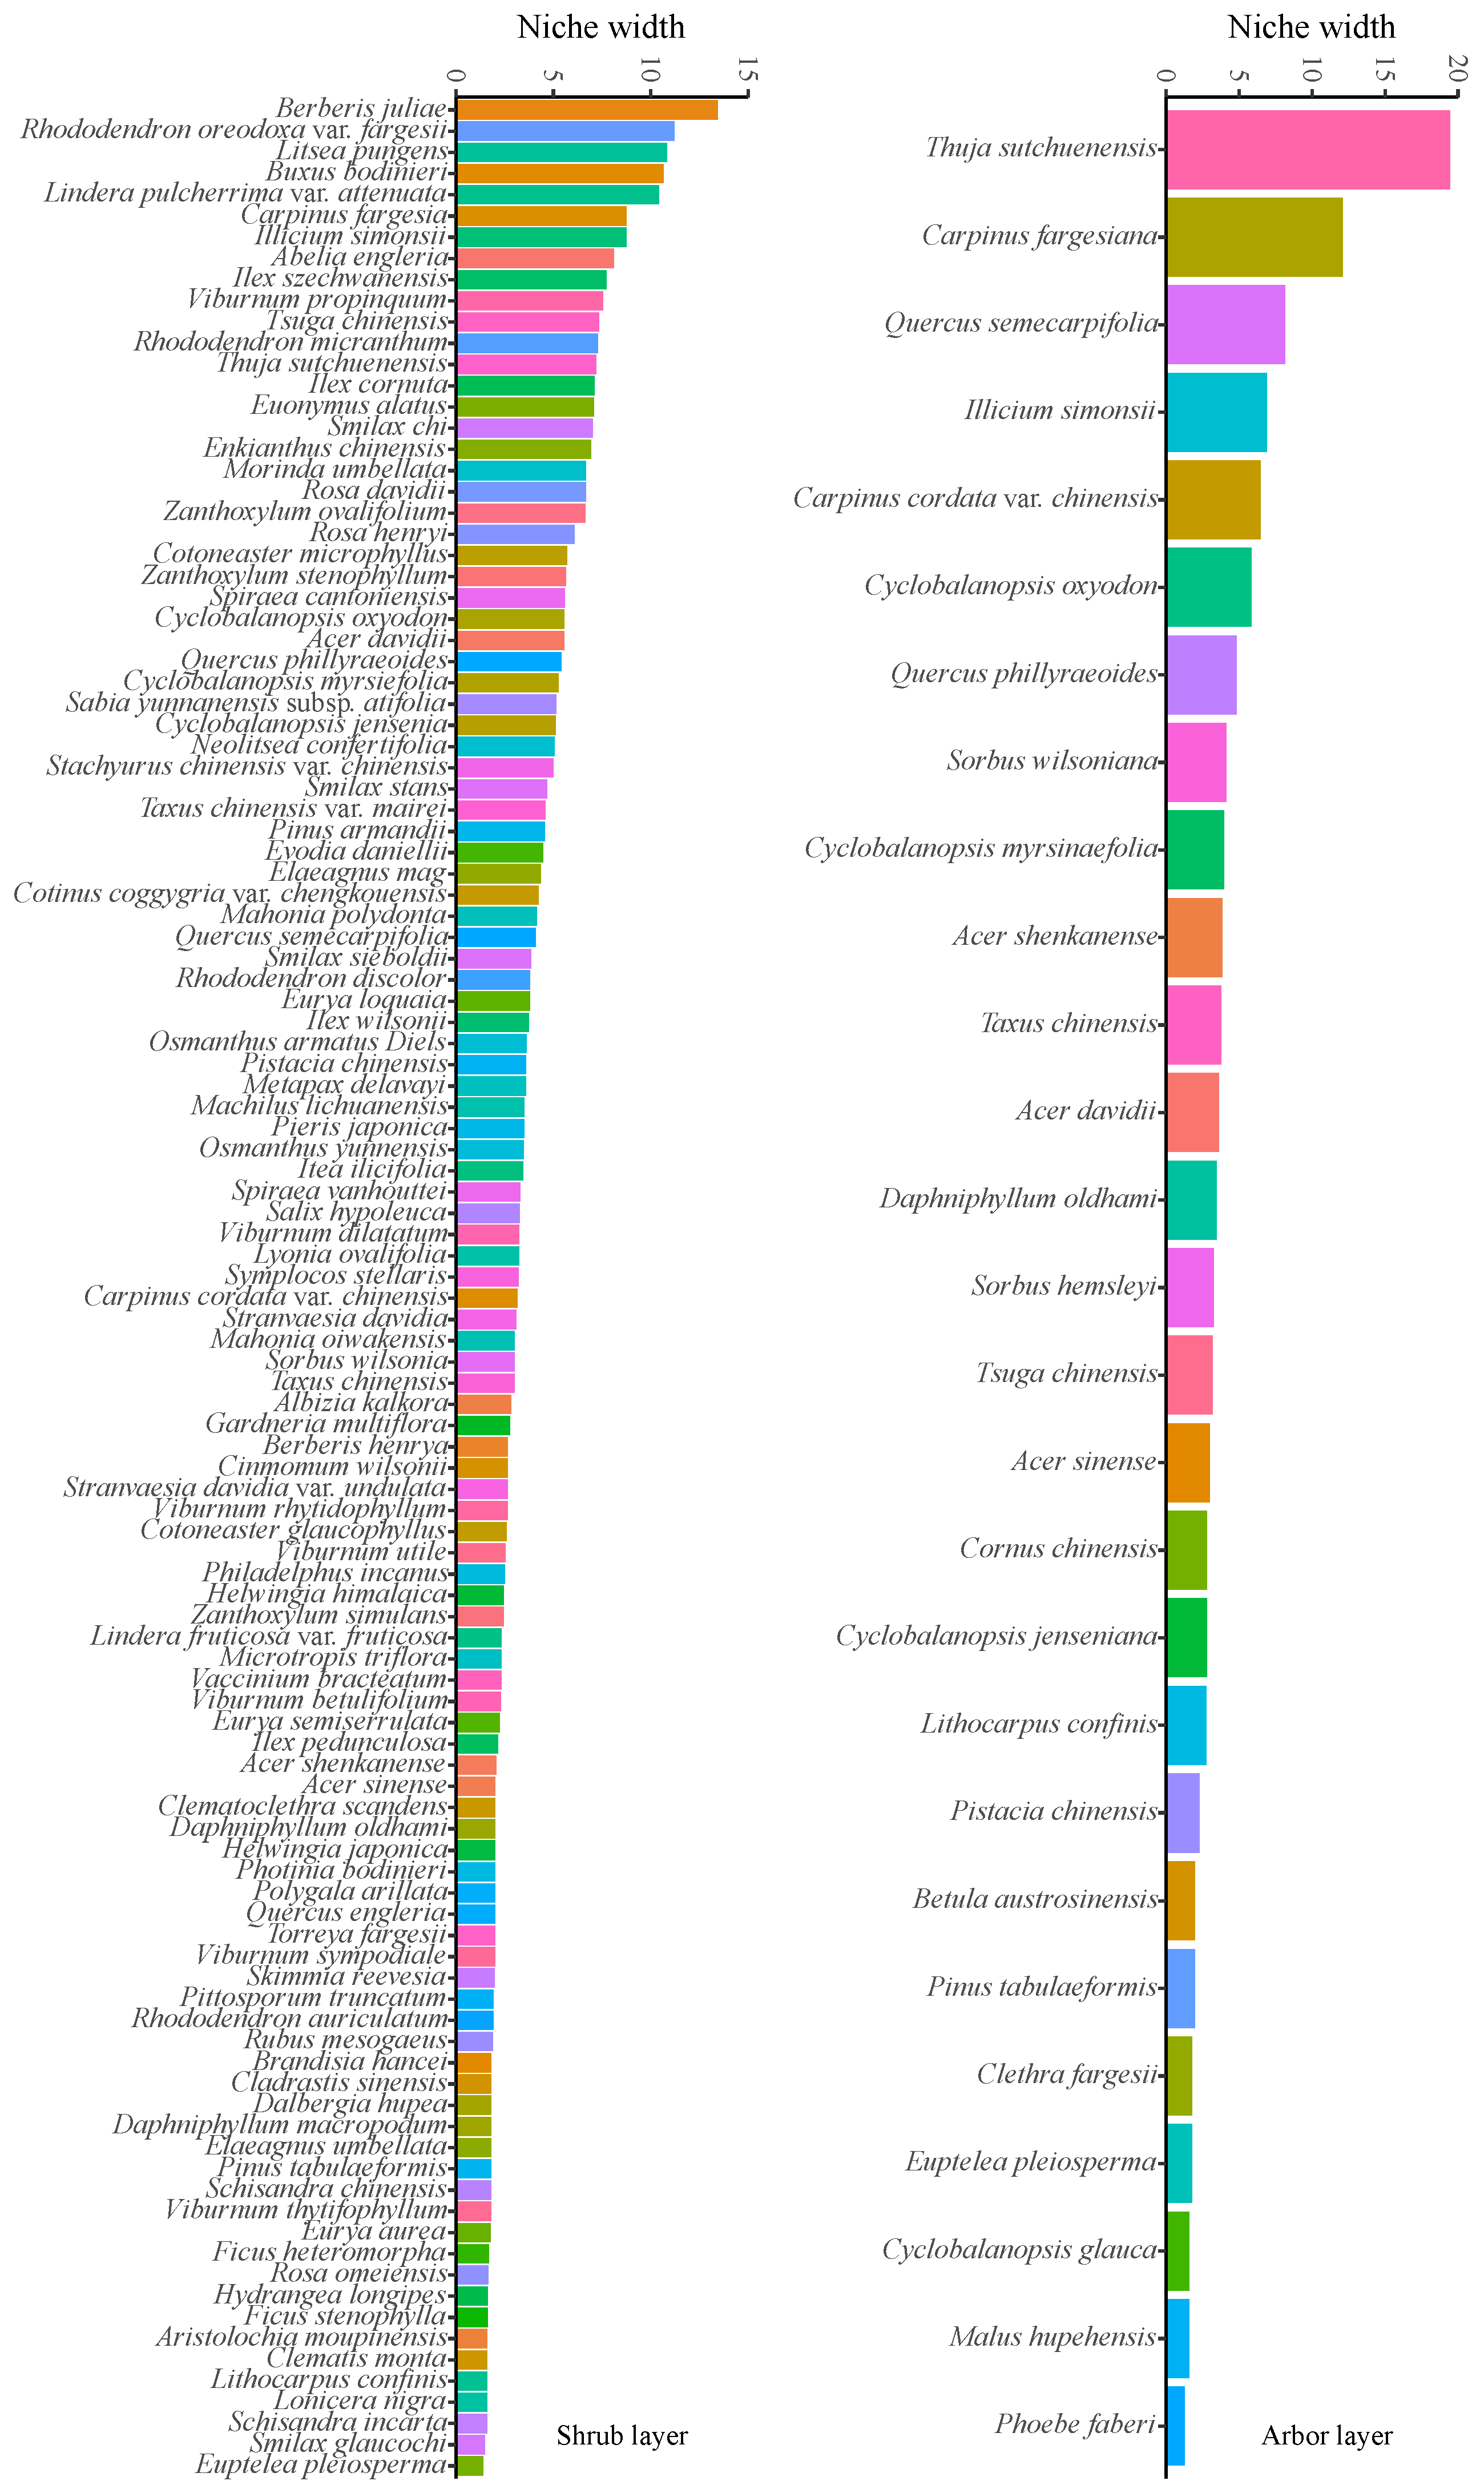
Based on Levins’s niche width index, the niche width of species was calculated, and the results are shown in Figure 4. In the arbor layer, the niche width of T. sutchuenensis is the widest, and the niche width of Phoebe faberi is the narrowest. Meanwhile, in the shrub layer, the plant species with the widest niche is Berberis juliae, the narrowest is the Euptelea pleiosperma, and the niche width of T. sutchuenensis is relatively high. The niches of Cupressaceae, Betulaceae and Fagaceae in the arbor layer are wider, while the niche of the Lauraceae is narrower. However, in the shrub layer, the niches of Berberidaceae, Ericaceae and Lauraceae are wider, while the niche of the Eupteleaceae is narrower.

3.6. Niche Overlap Analysis

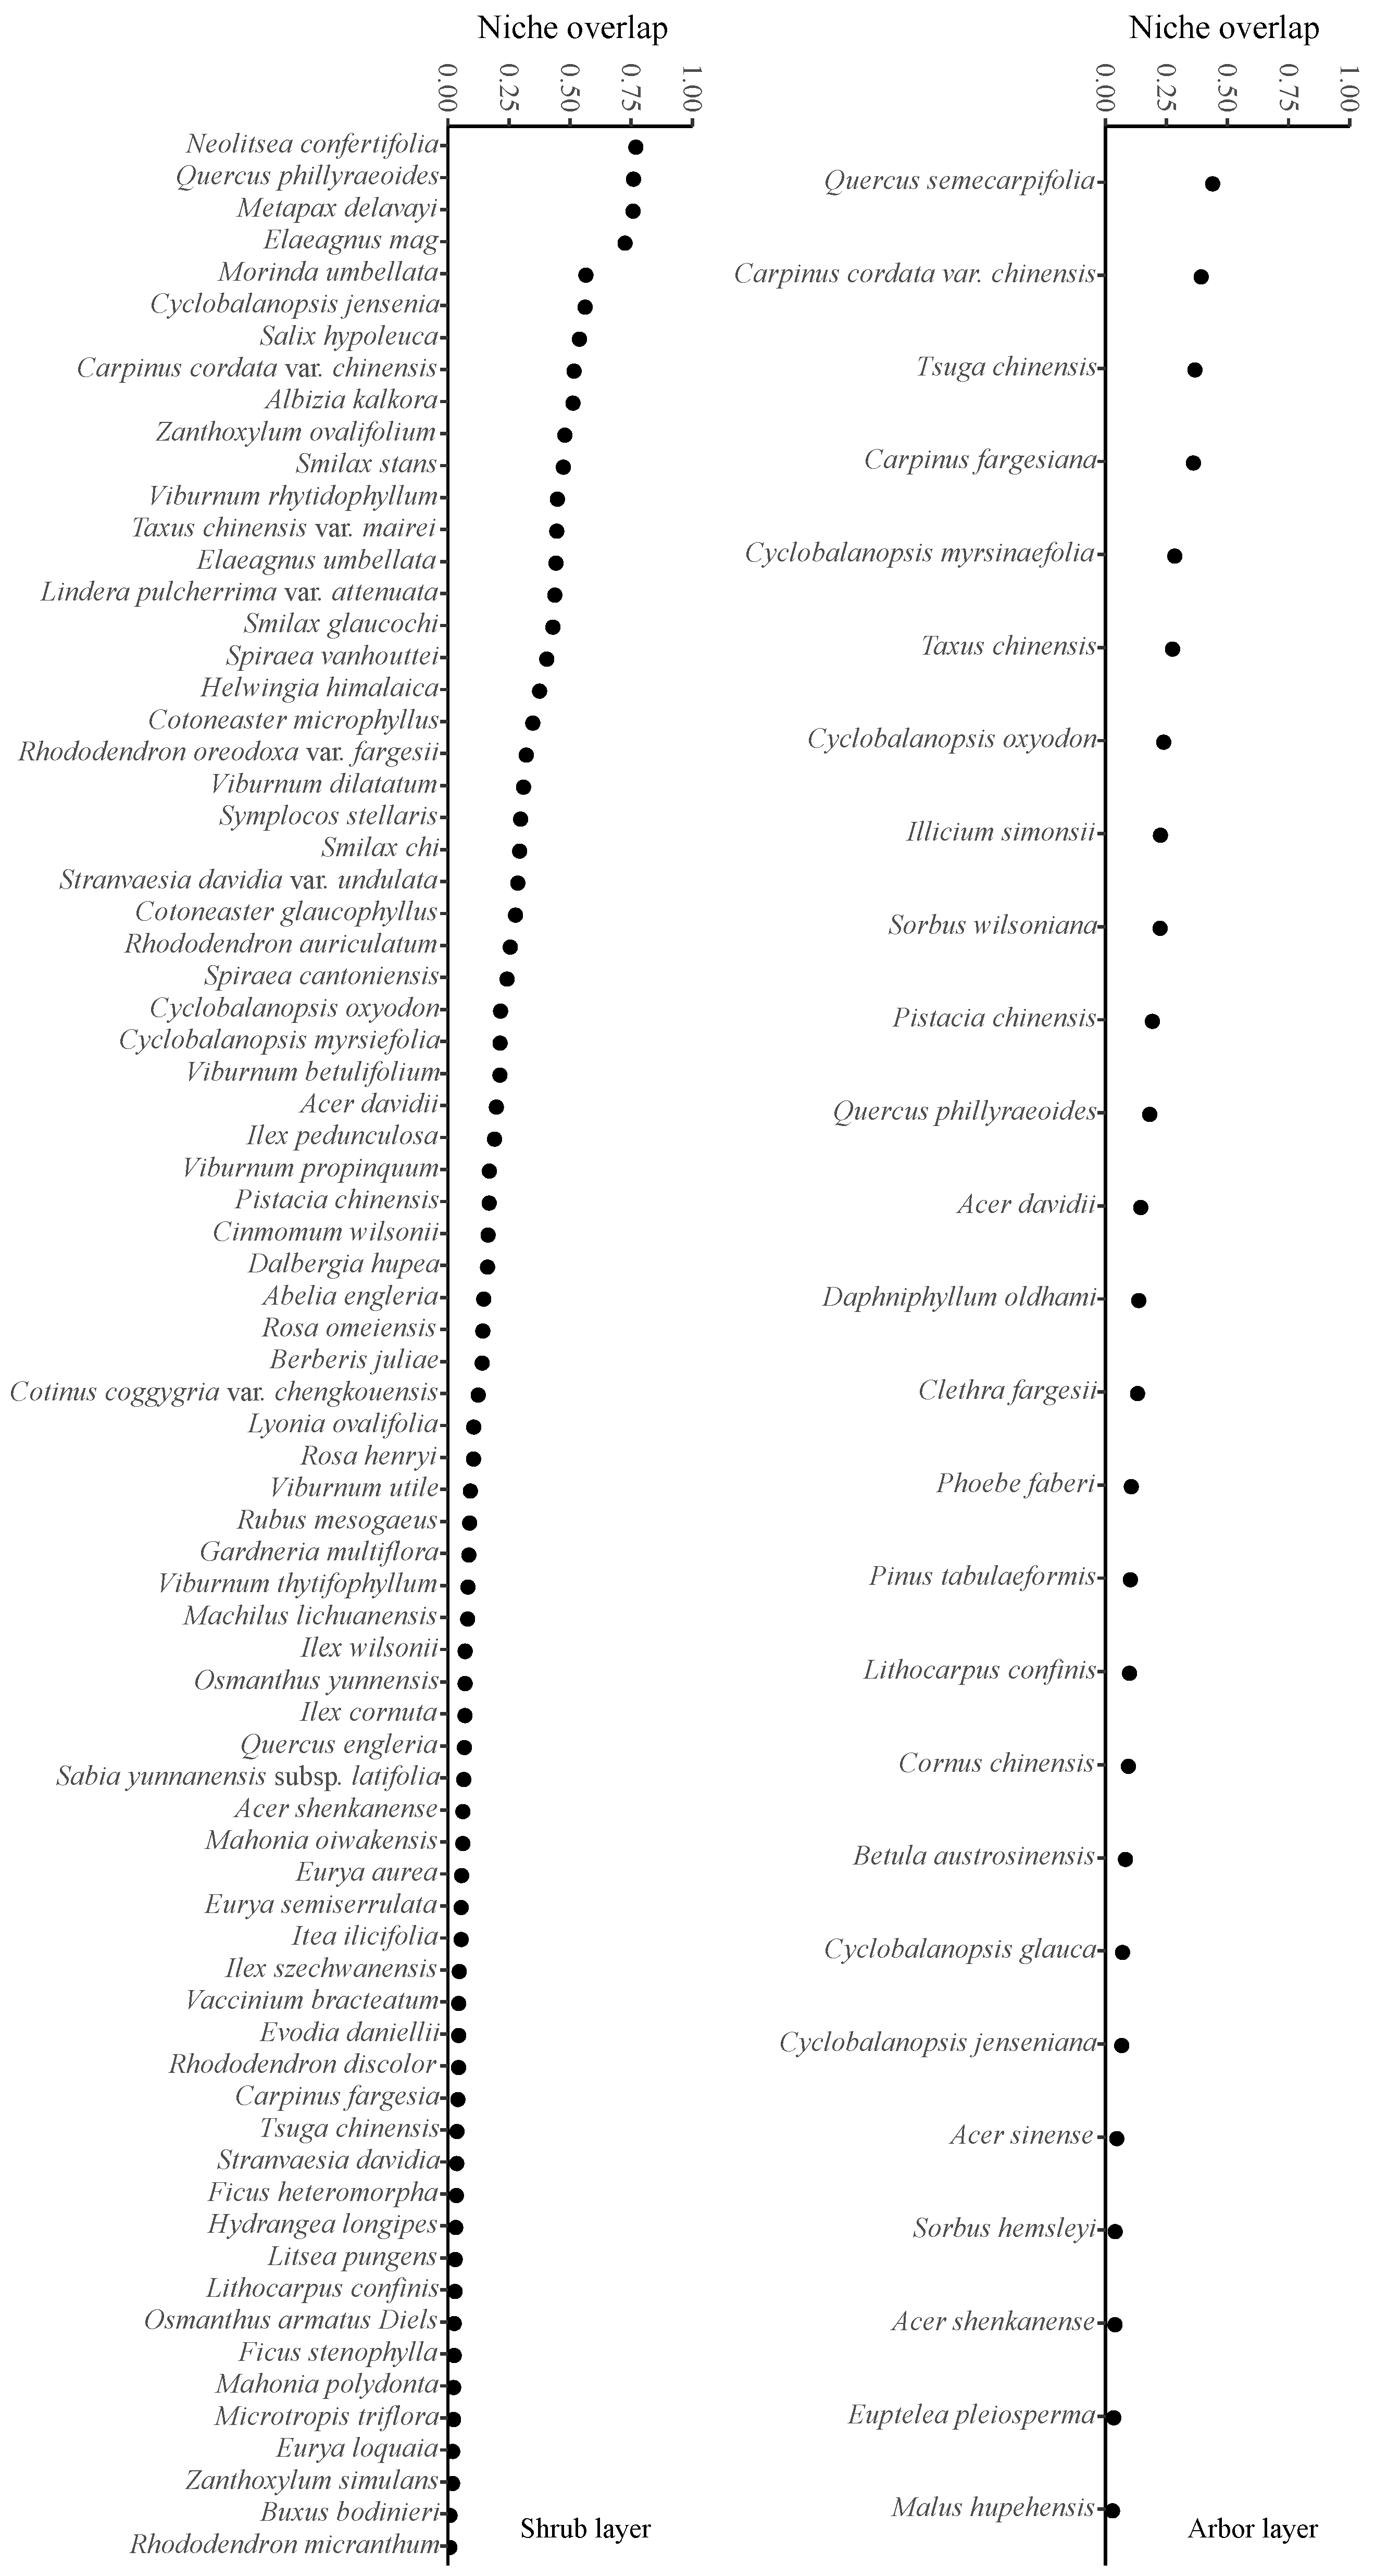
Morisita’s niche overlap index analysis results are shown in Figure 5 and Table 4. There are 10 (2.85%) and 180 (2.90%) pairs of species with niche overlap index greater than 0.59 in the arbor layer and the shrub layer, respectively. The niche overlap index among most species is small, indicating that the overall ecological similarity between species is relatively small. In the arbor layer, the niche overlap index between T. sutchuenensis and other species is less than 0.59, while in the shrub layer, the niche overlap indices between T. sutchuenensis and Neolitsea confertifolia, Quercus phillyraeoides, Metapax delavayi, and Elaeagnus mag are greater than 0.59, indicating that the ecological similarity between T. sutchuenensis and other plants in the arbor layer is small, while there are many species that exhibit similar utilization of T. sutchuenensis resources in the shrub layer.

3.7. Community Stability Analysis

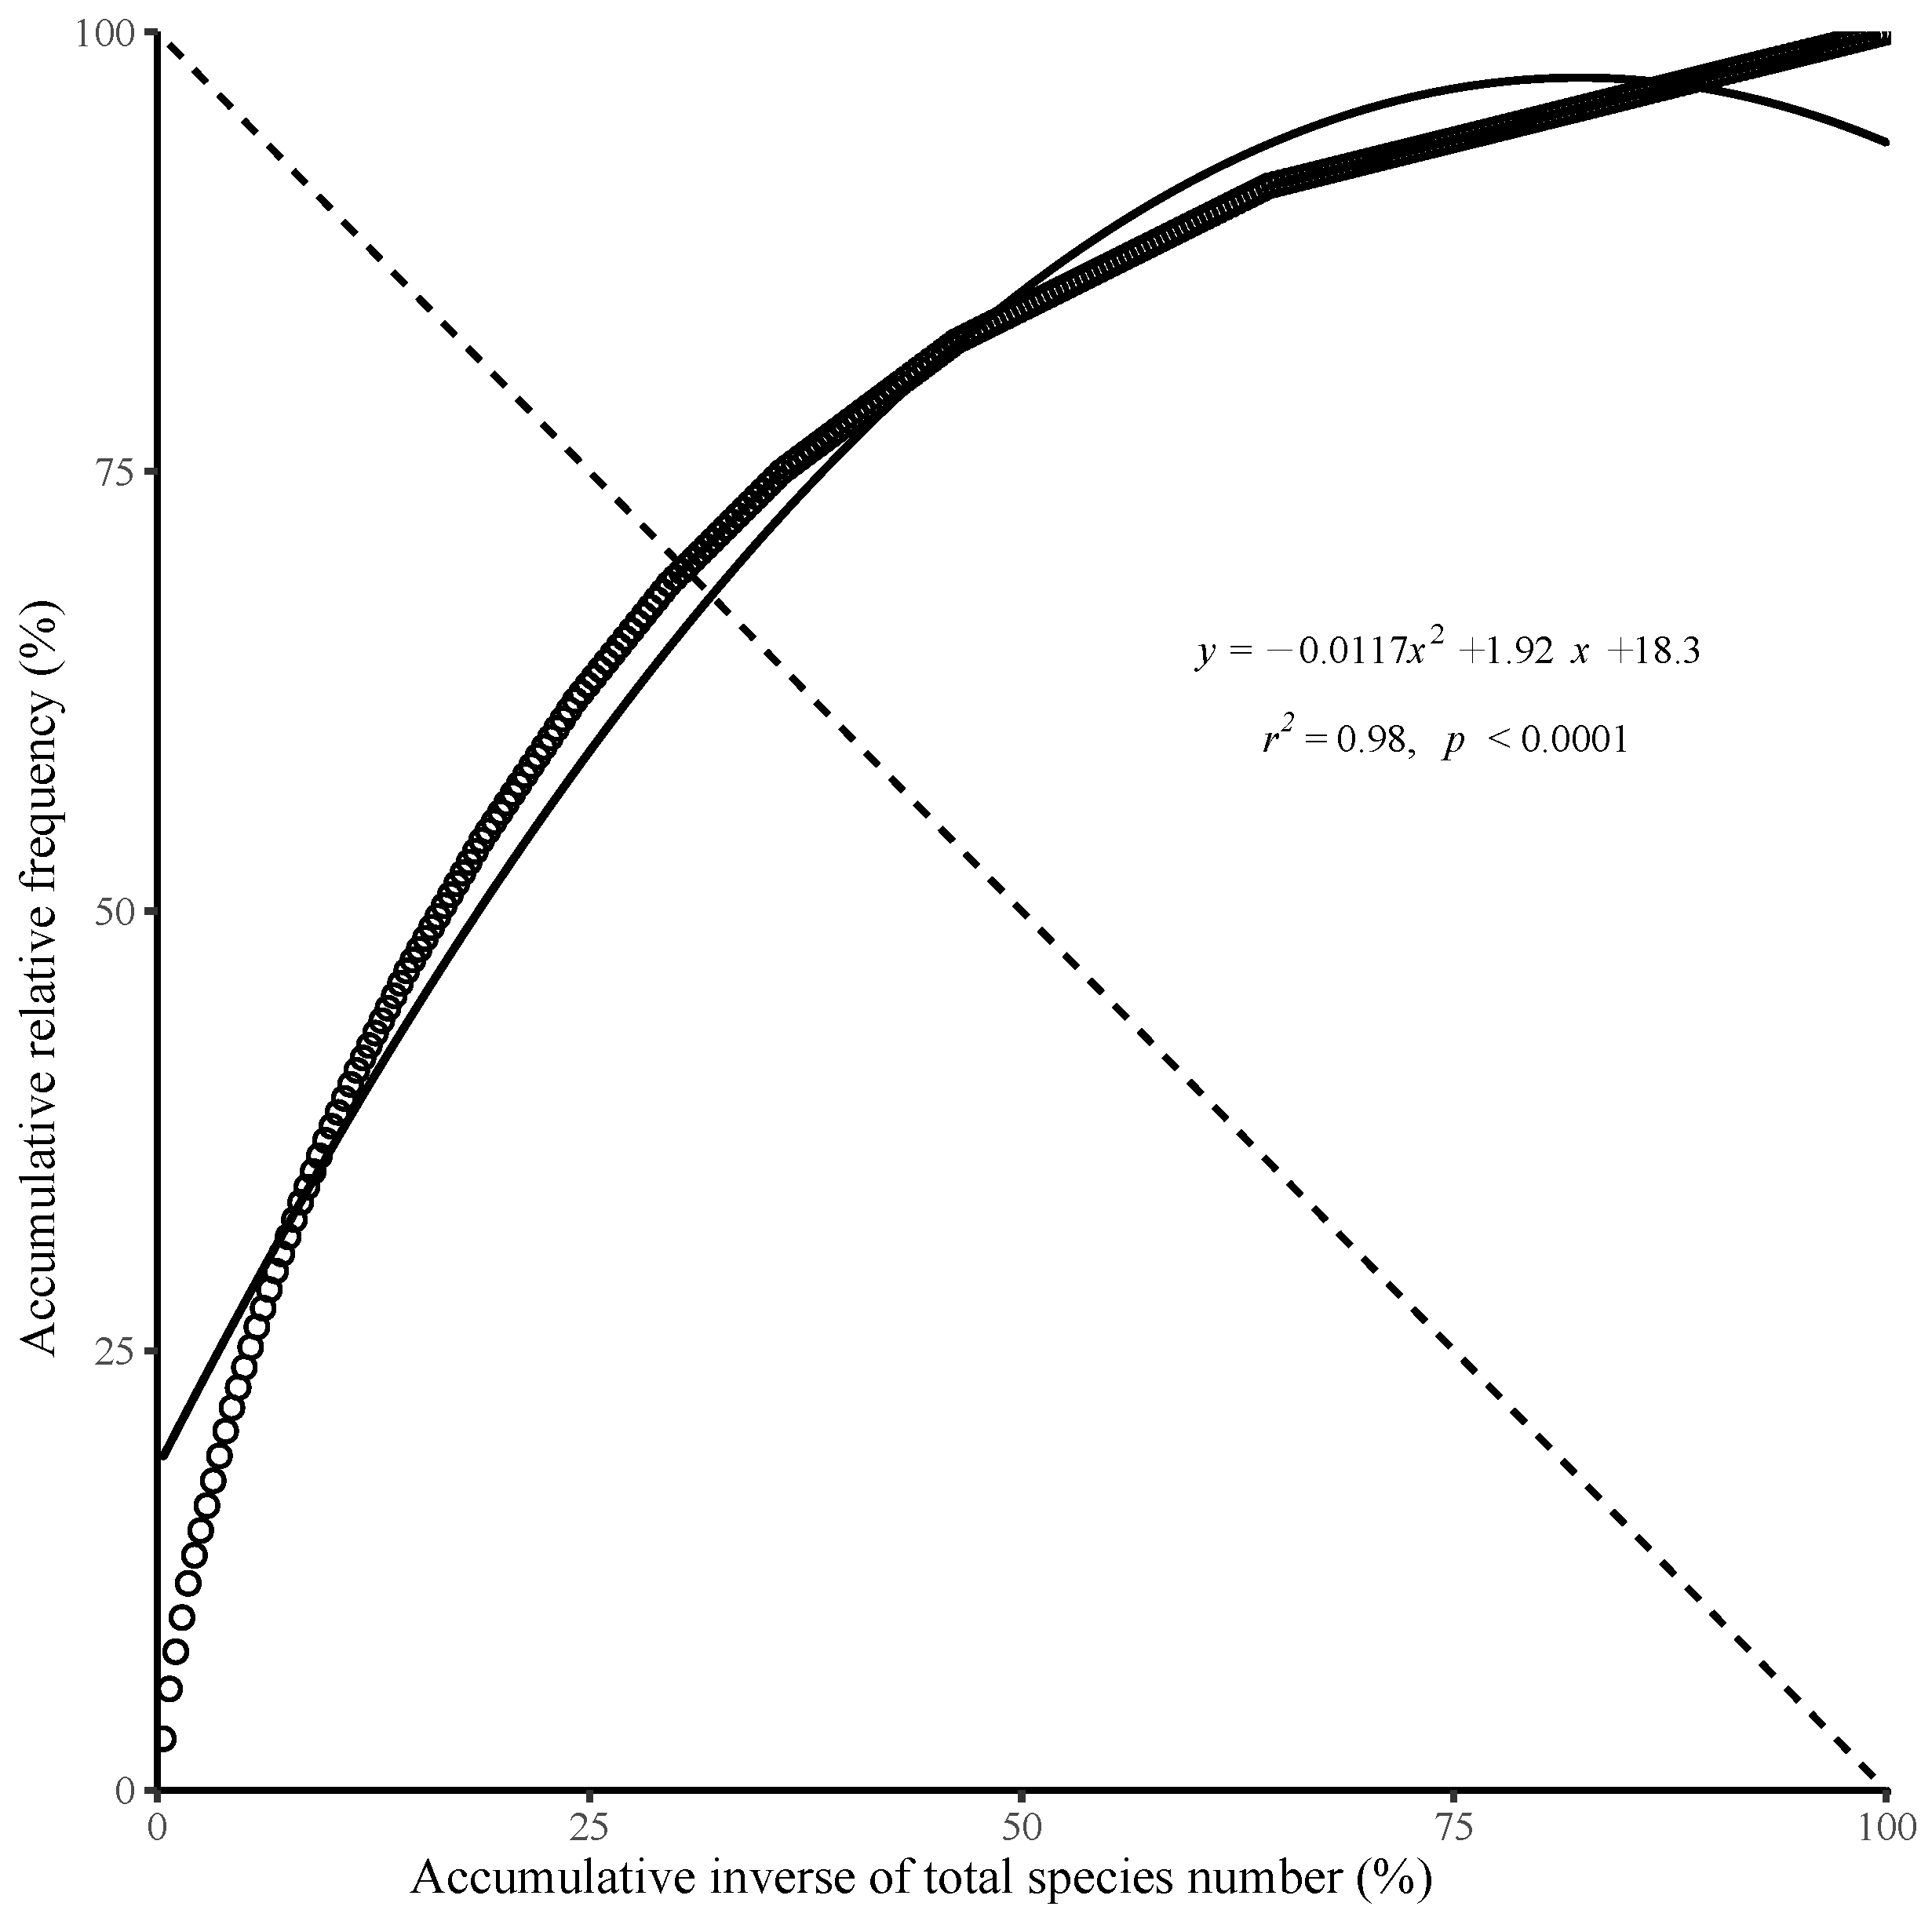
Godron scatter plots and the curve equation of the T. sutchuenensis community are shown in Figure 6. The result shows that the fitting curve intersects equation y = 100 x at (32.11, 67.89), and the distance between the intersection point coordinate and (20, 80) coordinate point is 17.13, indicating that the natural community of T. sutchuenensis is relatively stable.

4. Discussion

Interspecific association reflects the relationship between species pairs and their adaptability to the environment [29], and the overall interspecific association reflects the stability of the plant community and serves as an important parameter for community succession stage [30,31]. According to ecological theory, if the overall association of community species is significantly positive, the community structure and species composition will gradually become perfect and stable; otherwise, the opposite will occur [32]. In this study, we calculated the overall interspecific association of the major plant species in different layers and found that the shrub layer exhibited non-significant positive association and the arbor layer exhibited non-significant negative association, indicating that the shrub layer was more stable than the arbor layer. Our research further supports the diversity–stability hypothesis of Odum, Elton and MacArthur; that is, high species diversity (species richness) results in high stability [33].
The Chi-square test results showed that the interspecific association of species in the T. sutchuenensis community is loose, the independence of species pairs is strong, and the niche overlap analysis obtained the same results. Studies have shown that the formation of interspecific association depends on the environment and the succession stage of the community [11], so the loose interspecific association of the T. sutchuenensis community may be related to the habitat of the T. sutchuenensis community and the ecological characteristics of plant species: T. sutchuenensis is mainly distributed on cliffs, steep slopes and crest ridges, and its environmental conditions are relatively harsh [4]. The distribution of plant species is restricted by obvious terrain and hydrothermal conditions, resulting in a low interspecies association between plant species.
The associations between species are predominantly affected by the differences (negative association), similarities (positive association), positive association caused by commensalism or mutualism, negative association caused by mutual exclusion when competing for the same resources, and positive or negative association effects caused by physical or allelopathy among species [34,35]. In theory, the higher the ratio of positive to negative association, the more stable the community structure. This means that a variety of species can coexist stably, and the community reaches a stable stage which is adapted to environmental conditions [36]. However, some studies believe that when the distribution characteristics of species in the community are relatively independent and the probability of plant species meeting is low, the interspecific association does not necessarily show characteristics of positive association; on the contrary, most species pairs exhibit the characteristics of weak association, no association, or negative association [6,37,38], and the interspecies association coefficient analysis results of this study also support the above research conclusions. In other words, the negative association between species is also the adaptation and response of plant species to their external environmental conditions [39].
The interspecific association analysis is an important way to explore the structure and function of the endangered species community [40]. The association coefficient quantifies the degree of close association between species, which helps us to understand the interspecific relationship between endangered species and associated species. It can also be used to determine the species that compete most fiercely with the target plant, as the competition between adjacent plants for light and nutrients will directly affect the growth of species in the community [32,41]. In this study, we found that there is only a significant negative association between T. sutchuenensis and Carpinus fargesiana ( A C = 1.00 ) in the arbor layer, while in the shrub layer, the interspecific association coefficient between T. sutchuenensis and 35 species of plants (such as Torreya fargesii, Aristolochia moupinensis and B. henrya, etc.) is −1.00. However, Pearson correlation coefficient analysis results showed that there is only significant positive correlation between T. sutchuenensis and other species, and niche overlap analysis results also showed that the niche overlap index between T. sutchuenensis and Carpinus fargesiana is 0.36 in the arbor layer, and the niche overlap index between T. sutchuenensis and the above 35 species ( A C = 1.00 ) is 0 in the shrub layer. This result further explains that the encounter probability between T. sutchuenensis and other plant species is low, resulting in a negative association between it and many other species.
Niche width mainly reflects the degree to which species utilize available resources. The wider the niche, the higher the utilization degree of resources [42,43,44]. In this study, we found that T. sutchuenensis and B. juliae have the largest niche width in the arbor layer and shrub layer, which indicates that these plant species experience a greater amount of adaption to their environment and demonstrate superior resource utilization compared to other species in the community. In addition, the niche width of natural regeneration of T. sutchuenensis in the shrub layer is relatively wide, indicating that it has certain advantages compared to the forest, but it is not significant, and its adaptability can be improved through appropriate human intervention [45].
Species tend to share the basic niche of other species, resulting in two or more species having similar needs in terms of resources. This can result in the niches of different species overlapping to varying degrees [43,45,46]. In this study, we found that niche overlap among species of T. sutchuenensis community is low; that is, the community environment is broad. The breadth of the environment has a strong effect on the dynamics of the community, with broader environments leading to reduced niche overlap and enhanced coexistence [47]. In addition, niche overlap can be used to measure interspecific ecological similarity or interspecific competition. In the case of insufficient resources, niche overlap between species can not only reflect the degree of ecological similarity between species, but also the competition between species, while in the case of sufficient resources, niche overlap does not reflect the degree of competition, but only indicates the ecological similarity between the two species or occupies a similar ecological space [48].
For example, this study found that niche overlap between natural regeneration of T. sutchuenensis and E. mag reached 0.72, but the analysis results of the interspecific association coefficient showed that the association coefficient between the above species is equal to 1.00. The study also found that the wider the niche of a species is, the greater the niche overlap between it and other species. However, the niche overlap value between the species with smaller niche width and other species is not necessarily small, as demonstrated by E. pleiosperma ( B i = 1.38 ) and Schisandra incarta ( B i = 1.60 ) ( O i k = 0.93 ). These factors may change the niche of plant species due to species competing for resources or the promotion between species [49].
The results of the community stability analysis show that the stability of the T. sutchuenensis community is relatively high, indicating that the construction of nature reserves has effectively protected endangered species. The results of interspecific association analysis of the T. sutchuenensis community in this study showed that fewer species in the T. sutchuenensis community demonstrated significant competition with them, mainly because T. sutchuenensis could survive in places with poor site conditions, which were unsuitable for the survival of Fagaceae and Betulaceae plants. In places with good site conditions, T. sutchuenensis is less distributed. However, previous studies have shown that in the T. sutchuenensis community, there is competition between many arbor species and T. sutchuenensis in the utilization of ecological resources dominated by light factors [14]. In places with poor site conditions, T. sutchuenensis has less competition pressure on light resources due to less plant distribution. The above research shows that the survival strategy of T. sutchuenensis is to escape interspecies competition through its strong ability to adapt to a harsh environment, e.g., strong adaptability and low competitiveness. This conclusion has important theoretical significance for the conservation and restoration of the T. sutchuenensis population.
This study systematically studied the relationship between species in the community of the core distribution area of T. sutchuenensis, and provided a theoretical basis for the formulation of policies for the protection and restoration of the natural community of T. sutchuenensis. However, the endangered species are also affected by climate, soil, disturbance, biological characteristics of species and other aspects in addition to the relationship between species [50,51]. In recent years, the restoration of endangered species has gradually changed from the restoration of a single population to the restoration of population functions, and research methods based on plant and community functional traits have strongly promoted the research on the construction mechanism and restoration mechanism of endangered species’ communities [52,53,54]. Therefore, future research should be comprehensively considered to deeply reveal the endangerment mechanisms of T. sutchuenensis and better provide scientific and technological support for the return, restoration of population functions, and management of T. sutchuenensis.

5. Conclusions

We explored the interspecific association and community stability of main plant species in the community of the core distribution area of T. sutchuenensis. We concluded that the survival strategy of T. sutchuenensis is based on its strong adaptability to the harsh environment, which allows it to escape the competition among species. However, this limits the distribution range of T. sutchuenensis. This knowledge can provide a reference for the protection and restoration of endangered species, promoting the natural regeneration of T. sutchuenensis by appropriately reducing the number of species competing with T. sutchuenensis for resources.

Author Contributions

Research conceptualization, S.P. and Q.G.; methodology and analysis, X.W., Y.L. (Yong Liu) and Y.L. (Yuanhui Li); investigation, X.W. and J.J.; funding acquisition, J.J.; writing and editing, X.W. and Y.L. (Yong Liu). All authors have read and agreed to the published version of the manuscript.

Funding

This research was supported by National key research and development program (No. 2022YFD1201601).

Data Availability Statement

Not applicable.

Acknowledgments

The authors wish to thank the anonymous reviewers for their constructive reviews.

Conflicts of Interest

The authors declare no conflict of interest.

References

  1. Zhao, Z.; Zhao, C.; Deng, S.; Shen, G.; Xie, Z.; Xiong, G.; Li, J. Community structure and dynamics of a remnant forest dominated by Thuja sutchuenensis after deforestation. Biodivers. Sci. 2020, 28, 333. [Google Scholar]
  2. Qin, A.; Ding, Y.; Jian, Z.; Ma, F.; Worth, J.R.; Pei, S.; Xu, G.; Guo, Q.; Shi, Z. Low genetic diversity and population differentiation in Thuja sutchuenensis Franch., an extremely endangered rediscovered conifer species in southwestern China. Glob. Ecol. Conserv. 2021, 25, e01430. [Google Scholar] [CrossRef]
  3. Yang, Y.; Li, N.; Christian, T.; Luscombe, D. Thuja sutchuenensis. The IUCN Red List of Threatened Species 2013: e. T32378A2816862. Available online: https://www.iucnredlist.org/species/32378/2816862 (accessed on 4 April 2023).
  4. Tang, C.Q.; Yang, Y.; Ohsawa, M.; Momohara, A.; Yi, S.R.; Robertson, K.; Song, K.; Zhang, S.Q.; He, L.Y. Community structure and survival of tertiary relict Thuja sutchuenensis (Cupressaceae) in the subtropical Daba Mountains, southwestern China. PLoS ONE 2015, 10, e0125307. [Google Scholar] [CrossRef] [PubMed]
  5. Jin, J.; Guo, Q.; Han, S.; Zhu, L.; Liu, Y.; Chen, Y. In vitro propagation of ‘Lazarus’ species Thuja sutchenensis Franch. Propag. Ornam. Plants 2018, 18, 77–86. [Google Scholar]
  6. Li, S.; Lang, X.; Huang, X.; Liu, W.; Su, J.; Xu, C.; Li, Z.; Xu, F. Interspecific association of woody plant species and community stability in the Eleutharrhena macrocarpa habitat. Biodivers. Sci. 2020, 28, 350. [Google Scholar]
  7. Jin, S.S.; Zhang, Y.Y.; Zhou, M.L.; Dong, X.M.; Chang, C.H.; Wang, T.; Yan, D.F. Interspecific association and community stability of tree species in natural secondary forests at different altitude aradients in the southern Taihang Mountains. Forests 2022, 13, 373. [Google Scholar] [CrossRef]
  8. Sanjerehei, M.M.; Rundel, P.W. A comparison of methods for detecting association between plant species. Ecol. Inform. 2020, 55, 101034. [Google Scholar] [CrossRef]
  9. Zhang, Z.H.; Hu, G.; Zhu, J.D.; Luo, D.H.; Ni, J. Spatial patterns and interspecific associations of dominant tree species in two old-growth karst forests, SW China. Ecol. Res. 2010, 25, 1151–1160. [Google Scholar] [CrossRef]
  10. Wiegand, T.; Huth, A.; Getzin, S.; Wang, X.; Hao, Z.; Gunatilleke, C.V.S.; Gunatilleke, I.A.U.N. Testing the independent species’ arrangement assertion made by theories of stochastic geometry of biodiversity. Proc. Biol. Sci. 2012, 279, 3312–3320. [Google Scholar] [CrossRef] [Green Version]
  11. He, D.; Biswas, S.R. Negative relationship between interspecies spatial association and trait dissimilarity. Oikos 2019, 128, 659–667. [Google Scholar] [CrossRef]
  12. Yao, Z.; Wang, X.; Wang, K.; Yu, W.; Deng, P.; Dong, J.; Li, Y.; Cui, K.; Liu, Y. Chloroplast and nuclear genetic diversity explain the limited distribution of endangered and endemic Thuja sutchuenensis in China. Front. Genet. 2021, 12, 801229. [Google Scholar] [CrossRef] [PubMed]
  13. Qin, A.; Liu, B.; Guo, Q.; Bussmann, R.W.; Ma, F.; Jian, Z.; Xu, G.; Pei, S. Maxent modeling for predicting impacts of climate change on the potential distribution of Thuja sutchuenensis Franch., an extremely endangered conifer from southwestern China. Glob. Ecol. Conserv. 2017, 10, 139–146. [Google Scholar] [CrossRef]
  14. Wang, X. Community Ecology of Thuja sutchuenensis. Master’s Thesis, Chinese Academy of Forestry, Beijing, China, 2008. [Google Scholar]
  15. Ma, F.; Guo, Q.; Qin, A.; Jian, Z.; Huang, J.; Wang, Z.; Yang, Q.; Zhang, S. Survival and Growth of Reintroduced Thuja sutchuenensis Seedlings in Relation to Environmental Factors. Sci. Silvae Sin. 2021, 57, 1–12. [Google Scholar]
  16. Liu, J.; Shi, S.; Chang, E.; Yang, W.; Jiang, Z. Genetic diversity of the critically endangered Thuja sutchuenensis revealed by ISSR markers and the implications for conservation. Int. J. Mol. Sci. 2013, 14, 14860–14871. [Google Scholar] [CrossRef] [PubMed] [Green Version]
  17. Yu, T.; Huang, B.H.; Zhang, Y.; Liao, P.C.; Li, J.Q. Chloroplast genome of an extremely endangered conifer Thuja sutchuenensis Franch.: Gene organization, comparative and phylogenetic analysis. Physiol. Mol. Biol. Plants 2020, 26, 409–418. [Google Scholar] [CrossRef]
  18. Zuo, Y.W.; Zhang, J.H.; Ning, D.H.; Zeng, Y.L.; Li, W.Q.; Xia, C.Y.; Zhang, H.; Deng, H.P. Comparative analyses of rhizosphere bacteria along an elevational gradient of Thuja sutchuenensis. Front. Microbiol. 2022, 13, 881921. [Google Scholar] [CrossRef] [PubMed]
  19. Zuo, Y.W.; He, P.; Zhang, J.H.; Li, W.Q.; Ning, D.H.; Zeng, Y.L.; Yang, Y.; Xia, C.Y.; Zhang, H.; Deng, H.P. Contrasting responses of multispatial soil fungal communities of Thuja sutchuenensis Franch., an Extremely Endangered Conifer in Southwestern China. Microbiol. Spectr. 2022, 10, e0026022. [Google Scholar] [CrossRef]
  20. Wang, M.; Huo, L.; Liu, H.; Zhao, L.; Xu, Z.; Tan, H.; Qiu, S.X. Thujasutchins N and O, two new compounds from the stems and roots of Thuja sutchuenensis. Nat. Prod. Res. 2022, 36, 2356–2362. [Google Scholar] [CrossRef]
  21. Guo, Q.; Wang, X.; Bahaer, G.; Wan, X. Interspecific relationships of dominant tree species in Thuja sutchuenensis community. Chin. J. Ecol. 2007, 26, 1911–1917. [Google Scholar]
  22. Liu, L.; Wang, X.; Wen, Q.; Jia, Q.; Liu, Q. Interspecific associations of plant populations in rare earth mining wasteland in southern China. Int. Biodeterior. Biodegrad. 2017, 118, 82–88. [Google Scholar] [CrossRef]
  23. Schluter, D. A variance test for detecting species associations, with some example applications. Ecology 1984, 65, 998–1005. [Google Scholar] [CrossRef]
  24. Yates, F. Contingency tables involving small numbers and the χ2 test. Suppl. J. R. Stat. Soc. 1934, 1, 217–235. [Google Scholar] [CrossRef]
  25. Cole, L.C. The measurement of interspecific associaton. Ecology 1949, 4, 411–424. [Google Scholar] [CrossRef]
  26. Levins, R. Evolution in Changing Environments: Some Theoretical Explorations; Princeton University Press: Princeton, NJ, USA, 1968. [Google Scholar]
  27. Regmi, S.; Neupane, B.; Dhami, B.; Gautam, D.; Panthi, S.; Poudel, M. Niche breadth and overlap of spotted deer and domestic cattle with swamp deer in tropical region of Nepal. Ecol. Process. 2022, 11, 22. [Google Scholar] [CrossRef]
  28. Godron, M.; Daget, P.; Poissonet, P. Some aspects of heterogeneity in grasslands of Cantal. Stat. Ecol. 1971, 3, 397–415. [Google Scholar]
  29. Wu, S.; Wen, L.; Dong, S.; Gao, X.; Xu, Y.; Li, S.; Dong, Q.; Wessell, K. The plant interspecific association in the revegetated alpine grasslands determines the productivity stability of plant community across restoration time on Qinghai-Tibetan Plateau. Front. Plant Sci. 2022, 13, 850854. [Google Scholar] [CrossRef]
  30. Zhang, M.t.; Kang, X.g.; Meng, J.h.; Zhang, L.x. Distribution patterns and associations of dominant tree species in a mixed coniferous-broadleaf forest in the Changbai Mountains. J. Mt. Sci. 2015, 12, 659–670. [Google Scholar] [CrossRef]
  31. Su, S.j.; Liu, J.f.; He, Z.s.; Zheng, S.q.; Hong, W.; Xu, D.w. Ecological species groups and interspecific association of dominant tree species in Daiyun Mountain National Nature Reserve. J. Mt. Sci. 2015, 12, 637–646. [Google Scholar] [CrossRef]
  32. Jian, M.; Liu, Q.; Zhu, D.; You, H. Inter-specific correlations among dominant populations of tree layer species in evergreen broad-leaved forest in Jiulianshan Mountain of subtropical China. J. Plant Ecol. 2009, 33, 672–680. (In Chinese) [Google Scholar]
  33. McCann, K.S. The diversity–stability debate. Nature 2000, 405, 228–233. [Google Scholar] [CrossRef] [PubMed]
  34. Greig-Smith, P. Quantitative Plant Ecology, 3rd ed.; Blackwell Scientific Publications: Oxford, UK, 1983. [Google Scholar]
  35. Kershaw, K.A.; Looney, J.H.H. Quantitative and Dynamic Plant Ecology, 3rd ed.; Edward Arnold Limited: London, UK, 1985. [Google Scholar]
  36. Zhou, X.Y.; Wang, B.S.; Li, M.G.; Zan, Q.J. An analysis of interspecific associations in secondary succession forest communities in Heishiding Natural Reserve, Guangdong Province. Chin. J. Plant Ecol. 2000, 24, 332. [Google Scholar]
  37. Li, Y. Discussing on the Ecological Species Groups and Functional Groups Division based on the interspecific association—A case study on the arbor layer data in tropical lowland rain forest of Jianfenling, Hainan Island, China. Sci. Silvae Sin. 2007, 43, 9–16. [Google Scholar]
  38. Chen, Q.; Chen, J.; Zhong, J.J.; Ji, L.T.; Kang, B. Interspecific association and functional group classification of the dominant populations in shrub layer in secondary forest of Pinus tabuliformis in Qinling Mountain, China. Ying Yong Sheng Tai Xue Bao = J. Appl. Ecol. 2018, 29, 1736–1744. [Google Scholar]
  39. Leimu, R.; Fischer, M. A meta-analysis of local adaptation in plants. PLoS ONE 2008, 3, e4010. [Google Scholar] [CrossRef] [PubMed] [Green Version]
  40. Zhang, P.J.; Qing, H.; Zhao, L.Q.; Zhang, L.; Yang, J.; Huang, J.H. Spatial pattern and association of shrub species in gravel hilly and rocky low mountain desert dominated by relict Helianthemum songaricum in China. Glob. Ecol. Conserv. 2021, 32, e01914. [Google Scholar] [CrossRef]
  41. Zhang, W.; Liu, G.; Sun, J.; Fornara, D.; Zhang, L.; Zhang, F.; Li, L. Temporal dynamics of nutrient uptake by neighbouring plant species: Evidence from intercropping. Funct. Ecol. 2017, 31, 469–479. [Google Scholar] [CrossRef]
  42. Silvertown, J.; Dodd, M.E.; Gowing, D.J.; Mountford, J.O. Hydrologically defined niches reveal a basis for species richness in plant communities. Nature 1999, 400, 61–63. [Google Scholar] [CrossRef]
  43. Silvertown, J. Plant coexistence and the niche. Trends Ecol. Evol. 2004, 19, 605–611. [Google Scholar] [CrossRef]
  44. Gu, L.; Gong, Z.w.; Li, W.z. Niches and interspecific associations of dominant populations in three changed stages of natural secondary forests on Loess Plateau, P.R. China. Sci. Rep. 2017, 7, 6604. [Google Scholar] [CrossRef] [Green Version]
  45. Sun, C.; Li, L.; Dong, X.; Qin, F.; Yang, Z. Variations and factors characterizing ecological niches of understory herbaceous species in plantation forests. Sustainability 2022, 14, 10719. [Google Scholar] [CrossRef]
  46. Chu, C.; Kleinhesselink, A.R.; Havstad, K.M.; McClaran, M.P.; Peters, D.P.; Vermeire, L.T.; Wei, H.; Adler, P.B. Direct effects dominate responses to climate perturbations in grassland plant communities. Nat. Commun. 2016, 7, 11766. [Google Scholar] [CrossRef] [PubMed] [Green Version]
  47. Pastore, A.I.; Barabás, G.; Bimler, M.D.; Mayfield, M.M.; Miller, T.E. The evolution of niche overlap and competitive differences. Nat. Ecol. Evol. 2021, 5, 330–337. [Google Scholar] [CrossRef]
  48. Zhong, Y.; Zhang, J.; Liu, Q.; Yang, W.; Wu, F.; Feng, M. Niche characteristics of main herbage populations in Eucalyptus grandis plantation. Acta Prataculturae Sin. 2010, 19, 16–21. [Google Scholar]
  49. Pulla, S.; Suresh, H.S.; Dattaraja, H.S.; Sukumar, R. Multidimensional tree niches in a tropical dry forest. Ecology 2017, 98, 1334–1348. [Google Scholar] [CrossRef]
  50. Guo, Q.; Qin, A.; Ma, F.; Jian, Z.; Pei, S. Research progress on Thuja sutchuenensis: A critically endangered species in the world. World For. Res. 2015, 28, 18–22. [Google Scholar]
  51. Jin, J.; Ren, F.; Xia, Y.; Liu, Z.; Chen, Y.; Zhang, J. Research on reproductive phenology, pollination, and embryonic development of Thuja sutchuenensis Franch., a plant species with extremely small populations. Plant Sci. J. 2020, 38, 696–706. [Google Scholar]
  52. McGill, B.J.; Enquist, B.J.; Weiher, E.; Westoby, M. Rebuilding community ecology from functional traits. Trends Ecol. Evol. 2006, 21, 178–185. [Google Scholar] [CrossRef] [PubMed]
  53. He, N.; Liu, C.; Piao, S.; Sack, L.; Xu, L.; Luo, Y.; He, J.; Han, X.; Zhou, G.; Zhou, X. Ecosystem traits linking functional traits to macroecology. Trends Ecol. Evol. 2019, 34, 200–210. [Google Scholar] [CrossRef] [PubMed]
  54. Liu, C.; Li, Y.; Yan, P.; He, N. How to improve the predictions of plant functional traits on ecosystem functioning? Front. Plant Sci. 2021, 12, 622260. [Google Scholar] [CrossRef]
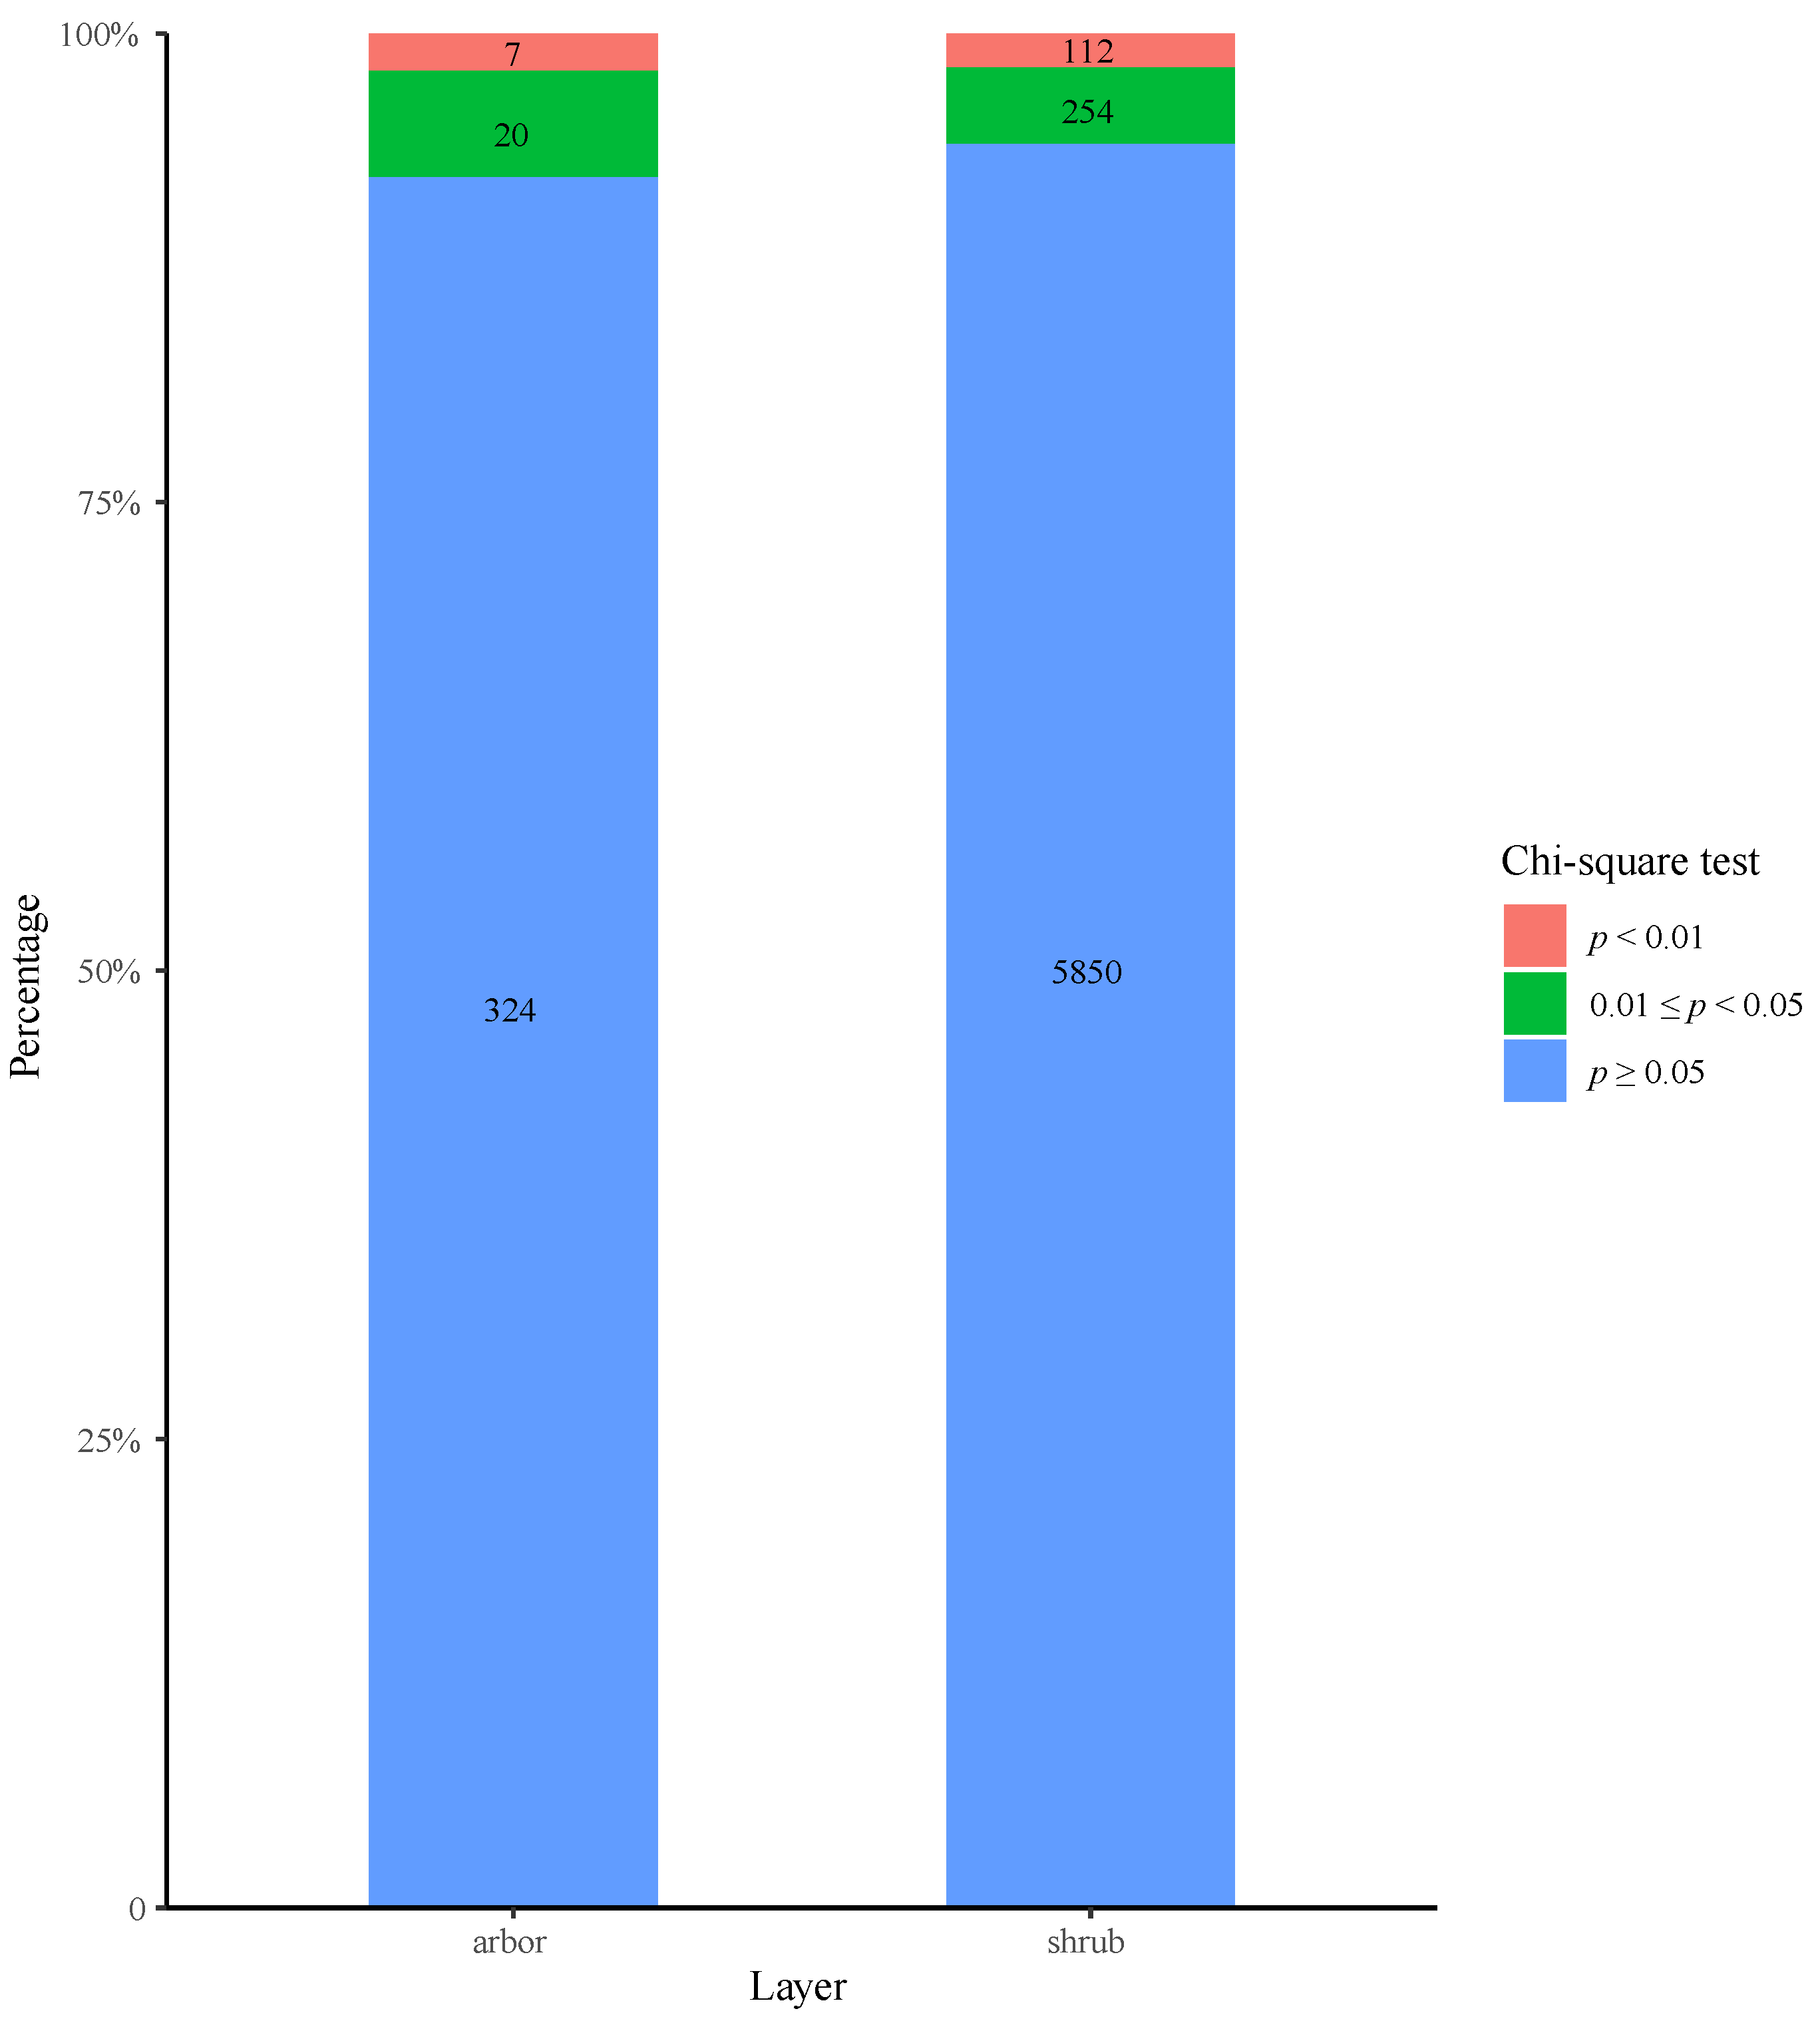
Figure 1. Chi-square test of major plant species in arbor and shrub layers.
Forests 14 00762 g001
Figure 2. Interspecific association coefficients of major plant species in arbor and shrub layers.
Forests 14 00762 g002
Figure 3. Pearson correlation coefficient of major plant species in arbor and shrub layers.
Forests 14 00762 g003
Figure 4. Levins’s niche width of major plant species in arbor and shrub layers.
Forests 14 00762 g004
Figure 5. Niche overlap analysis of T. sutchuenensis and other species in arbor and shrub layers.
Forests 14 00762 g005
Figure 6. Godron community stability in the community of T. sutchuenensis.
Forests 14 00762 g006
Table 1. The overview of plots in TPM and XBM.
PlotsLocationLongitudeLatitudeAltitude (m)Slope (°)AspectSlope PositionMean DBH (cm)Mean H (m)
1TPM 108 45.738 31 42.882 98030NorthwestLower7.165.34
2 108 45.722 31 42.788 108552WestUpper8.146.02
3 108 48.132 31 43.279 158049NortheastUpper middle8.245.62
4 108 47.689 31 42.970 180242NorthMiddle8.597.80
5 108 47.581 31 43.083 173048NorthwestMiddle7.826.48
6XBM 108 40.421 31 36.902 215346NorthUpper9.054.65
7 108 40.313 31 36.524 212025SouthUpper middle11.686.34
8 108 40.367 31 36.986 216945WestUpper11.116.71
9 108 40.398 31 36.990 216945NorthwestUpper9.136.10
Table 2. 2 × 2 contingency table.
Species BSum
PresentAbsent
Species APresentaba + b
Absentcdc + d
suma + cb + dN = a + b + c + d
a, the number of quadrats in which species A and B co-occurred; b, the number of quadrats in which species A occurred, but not B; c, the number of quadrats in which species B occurred, but not A; d, the number of quadrats in which neither A nor B were found; N, the total number of quadrats.
Table 3. Overall interspecies association analysis between species of plants in different layers.
LayerVariance Ratio (VR)Test Statistic (W) χ 0.95 , N 2 , χ 0.05 , N 2 Result
Arbor0.9032.2923.27, 51.00Non-significant negative association
Shrub1.1842.5523.27, 51.00Non-significant positive association
Table 4. Statistics of Morisita’s niche overlap index.
Niche Overlap IndexArborShrub
Species Pairs Number%Species Pairs Number%
O i k 0.98 00.0020.03
0.78 O i k < 0.9820.57540.87
0.59 O i k < 0.7882.281241.99
0.40 O i k < 0.59195.413195.13
0.21 O i k < 0.404111.685979.60
O i k < 0.21 28180.06512082.37
O i k is the niche overlap index of species i and species k.
Disclaimer/Publisher’s Note: The statements, opinions and data contained in all publications are solely those of the individual author(s) and contributor(s) and not of MDPI and/or the editor(s). MDPI and/or the editor(s) disclaim responsibility for any injury to people or property resulting from any ideas, methods, instructions or products referred to in the content.