Article

Hydroclimate Variations across North-Central China during the Past 530 Years and Their Relationships with Atmospheric Oscillations

1
Northwest Institute of Eco-Environment and Resources, Chinese Academy of Sciences, Lanzhou 730000, China
2
Key Laboratory of Desert and Desertification, Northwest Institute of Eco-Environment and Resources, Chinese Academy of Sciences, Lanzhou 730000, China
*
Author to whom correspondence should be addressed.
Forests 2023, 14(3), 640; https://doi.org/10.3390/f14030640
Submission received: 27 February 2023 / Revised: 11 March 2023 / Accepted: 18 March 2023 / Published: 21 March 2023
(This article belongs to the Section Forest Meteorology and Climate Change)

Abstract

:
Detailed study of historical drought events in North-Central China (NCC) is important to understand current hydroclimate variability in the background of global warming. Here, we combined 12 published tree-ring chronologies and 12 dryness/wetness indices (DWI) to reconstruct dry and wet climate variability across NCC. These 24 proxy records showed similarly significant responses to warm season (May–June–July–August–September, MJJAS) moisture signals. A new 530-year-long reconstruction of self-calibrating Palmer Drought Severity Index (scPDSI) values for the warm season in NCC was determined using a nested principal component regression (PCR) approach. The new reconstruction shows significant correlations with the instrumental MJJAS scPDSI data across NCC during the period AD 1901–2012. The reconstructed MJJAS scPDSI revealed seven severe dry/wet events from AD 1470 to 2012. The periods AD 1701–1727 and AD 1985–2011 represent the longest dry periods, and the drought during the 1920s is identified as the most severe one over the past 530 years. Our reconstruction shows significant interannual spectral peaks at the frequency domain of 2–7 years, together with relatively weaker decadal frequencies of 16, 24, and 78 years. The results of superposed epoch analysis (SEA) show that extreme North Atlantic Oscillation (NAO) years may modulate drought variability in NCC.

1. Introduction

Observational data and model simulations commonly suggest that global drought events are increasingly aggravated due to global warming [1,2,3], but Sheffield et al. [4] and Greve et al. [5] have reported that the extent of global aridity has not changed significantly over the past 60 years. Similar confusion surrounds the magnitude and impact of climate change in China itself. For example, several studies have shown that China exhibited a drying trend during this period, and that increased aridity led to water scarcity and caused detrimental economic impacts [6,7,8]; however, other studies suggest that there was no change in dry event frequency in China from the year of 1961 to 2012 [9]. This discrepancy is likely due to different studies using different gridded datasets [10]; for example, the Palmer Drought Severity Index (PDSI), the standardized precipitation index (SPI), and the standardized precipitation evapotranspiration index (SPEI) consider different climatic factors and are appropriate of specific regions, accordingly, producing conflicting results. Therefore, the strategies of selecting datasets are crucial, and some types of climate studies are better than others at accurately modeling historical dry conditions at the sub-regional scale.
Substantial research has been performed on the climate of North-Central China (NCC, 101–113° E, 33–42° N) since 1951, with results obtained using different indices (e.g., monthly precipitation, surface wetness index, PDSI, and soil moisture retrieval) consistently showing that the region was extremely arid [11,12]. Instrumental data and observations record an intensifying drying trend in NCC since the 1950s that was mainly caused by global warming and a decrease in regional precipitation [13]. Not only that, with increasing anthropogenic disruption, proxy data showed that river flow rates in the middle of the Yellow River had reduced substantially since the late 1960s [14]. Drought is one of the principal factors that limit economic growth, agricultural prosperity, and societal development, such that variations in hydroclimate in the NCC region have recently attracted much attention in the literature.
Paleoclimate data can be used to investigate long-term dry/wet variation and can strengthen our understanding of past and present hydroclimates. The longest dendroclimatic reconstruction in China for Asian monsoon rainfall has revealed a long-term decrease in precipitation in the northeastern Tibetan Plateau (TP) over the past 6700 years [15]. Moisture reconstructions based on tree-ring proxies have been performed for NCC [16,17,18,19], but these reconstructions only extend to several centuries in the past, limiting our understanding of the current hydroclimate anomalies with a long-term perspective, although a few millennial hydroclimate reconstructions are reported for the surrounding areas [20,21]. Moisture-sensitive pollen [22,23], lake sediments [24,25,26], and speleothems [27,28,29] could preserve hydroclimate information over NCC in the past millennium (AD 1000–1999), but they often have a relatively low temporal resolution.
In this study, we combined 12 previously published tree-ring chronologies and 12 dryness/wetness indices (DWI) records at an annual resolution to develop a new regional-scale self-calibrating PDSI (scPDSI) reconstruction over NCC for the warm season (May–June–July–August–September, MJJAS) during the past 530 years. We analyzed the relationships of our reconstruction with atmospheric oscillations and compared them with other previously reported hydroclimate records across the surrounding areas.

2. Materials and Methods

2.1. Study Region

The portion of NCC studied here was delimited between 101–113° E and 33–42° N (Figure 1), and contains arid, semi-arid, and semi-humid areas, which are climatically sensitive zones and monsoon transitional regions [11,20]. The climate in this area is controlled by the Asian monsoon, which leads to very dry winter (December–January–February) and spring (March–April–May) seasons, with substantial precipitation in summer (June–July–August) and autumn (September–October–November) each year. Calculated precipitation rates and mean temperatures were determined using data collected from 67 meteorological stations in our target NCC over the period AD 1951–2012. These data show that 67% of the region’s annual precipitation occurs from May to September, and the average annual temperature is 7.8 °C. The study area contains the Loess Plateau, the Ordos Plateau, and the middle reaches of the Yellow River Basin. These unique geographical and physioclimatic characteristics lead to drought being more common than flood events.

2.2. Climate Data and MADA Data

We extracted the temperature and precipitation dataset on a 0.5° latitude by 0.5° longitude grid from Climatic Research Unit (CRU) TS 4.06 [32] on a monthly basis from AD 1950 to 2012. Monthly scPDSI data [33] were obtained from CRU from AD 1901 to 2012. Thirty scPDSI grid datasets were employed with a resolution of 0.5° latitude by 0.5° longitude, which provided complete coverage of NCC. Positive values of scPDSI represent wet conditions and negative values represent dry conditions. Averaged warm season scPDSI data, i.e., May–June–July–August–September (MJJAS), were used to further analyze the relationships with proxy data (tree-ring and DWI data) in NCC.
The Monsoonal Asia Drought Atlas (MADA) [34] contains spatially gridded data sets of the PDSI for the months of June, July, and August, covering the areas of Asian summer monsoon during the past millennium. This dataset comprised 534 grid points on a 2.5° × 2.5° grid, with MADA PDSI reconstructions produced using a network of Asian tree-ring data. We extracted 17 grid points (Figure 1) adjacent to our tree-ring sites and DWI sites from this MADA PDSI dataset to compare against our scPDSI reconstruction.

2.3. Tree-Ring Data and DWI Data

We compiled 11 tree-ring width (TRW) chronologies and one tree-ring oxygen isotope chronology for this study (Figure 1). These tree-ring data provide comprehensive records of local moisture (i.e., precipitation and/or drought) variations (Table 1, ref. incl. [35,36,37,38,39,40,41,42,43,44,45,46]) at an annual timescale and provide accurate and continuous data throughout the study period. These 12 chronologies have variable lengths of 141–395 years and a median length of 260 years.
The DWI dataset contains 120 dry/wet grade sites within China that contain data covering the period AD 1470–2000 [47,48,49]. Nineteen of these DWI sites have been updated to the year AD 2008 and seven DWI sites have been added to extend coverage across northwestern China [50]. The DWI dataset contains information from local historical documents and court proceedings, and thus provides an official record of moisture variability over the past five centuries in China. The DWI dataset categorizes each year’s drought severity as either very wet (grade 1), wet (grade 2), normal (grade 3), dry (grade 4), or very dry (grade 5).
In our study, we used data from 12 DWI sites located within 101–113° E and 33–42° N (Figure 1), although we also note that the DWI series from Hohhot, Tianshui, and Lanzhou lacked data in 6, 10, and 12 separate years, respectively. The missing data were interpolated using a regularized expectation maximization method for consistency [51]. The other nine DWI series data were all integrated and continuous. DWI data from Xi’ning, Lanzhou, Tianshui, Yinchuan, Yan’an, and Xi’an covered the period from AD 1470 to 2008, whereas data for the Bailingmiao, Hohhot, Shanba, Eketuo, Taiyuan, and Linfen DWI sites covered the period from AD 1470 to 2000.

2.4. Methods

An MJJAS mean scPDSI reconstruction was constructed over the NCC study area using a nested principal component regression (PCR; [52,53,54,55,56]). This approach created a few nests, considering that the number of available tree-ring and DWI records decreased before the earliest common year (AD 1860) and after the latest common year (AD 1999) of the 24 tree-ring and DWI records. We used a sliding window approach for calibration (i.e., using 2/3 length of instrumental data over the period AD 1950–1999) and verification (i.e., using 1/3 length of instrumental data over the period AD 1950–1999) to produce the final reconstruction [56]. In each nest reconstruction, the initial calibration interval extends from AD 1950–1982 with an increment of one year to the final interval AD 1967–1999, creating an ensemble of 18 reconstruction members. The reduction of error (RE), coefficient of efficiency (CE), root mean square error (RMSE), and R2 statistics were used to assess the skill of each nested model [57]. The final scPDSI reconstruction, RE, CE, R2, and RMSE values were expressed as the ensemble median of the 18 ensemble members.
Spatial correlations between our scPDSI reconstruction and climatic data were explored using the KNMI Climate Explorer software (Royal Netherlands Meteorological Institute; https://climexp.knmi.nl/, accessed on 17 March 2023). We used the multi-taper method (MTM) of spectral analysis [58] to investigate the periodicity of our reconstruction. The superposed epoch analysis (SEA; [59]) approach was used to assess the influence of the North Atlantic Oscillation (NAO) on hydroclimate variability in our study region.

3. Results and Discussion

3.1. The scPDSI Reconstruction

An MJJAS scPDSI reconstruction for NCC from AD 1470 to 2012 was generated using the PCR method (Figure 2). The values of CE and RE for all nests are greater than zero, which imply that our PCR model passed the validation test and that the scPDSI reconstruction was reliable. It should be noted that the earlier part of reconstruction that is solely created by DWI data also has a high skill as the RE and CE are positive, and the explained variance is higher than 60% during this period (Figure 2b,c). Our scPDSI reconstruction shows rather consistent interannual variations with the CRU instrumental scPDSI data over the study region from AD 1950 to 2012, as characterized by a significantly high correlation coefficient of 0.89 (nyear = 63, p < 0.01) (Figure 3a).
The regional temporal series of moisture anomalies in NCC from AD 1470 to 2012 is shown in Figure 2a. The mean value of our reconstructed scPDSI was 0, which is within the range of the defined near normal status (−0.5~0.5) [60]. To identify the phases of wet and dry conditions in reconstruction, positive and negative values indicate wet and dry periods of the same category [60], respectively. Pluvial and drought events of the scPDSI reconstruction were recognized by identifying calculated values that were more than one standard deviation (σ = 0.74) above or below the mean value [61], respectively. The application of a 30-year low-pass filter revealed seven severe dry events at AD 1479–1499, 1626–1644, 1682–1692, 1701–1727, 1830–1840, 1922–1932, and AD 1985–2011, with these drought events having more than 10 consecutive years of negative scPDSI anomalies. Additional short-period drought events that lasted less than 10 consecutive years were also identified during AD 1527–1533, 1580–1588, 1745–1750, 1762–1770, 1809–1815, 1845–1847, 1859–1867, 1876–1884, and AD 1970–1975. Seven wet periods that lasted at least 10 years were recorded during AD 1534–1579, 1589–1608, 1645–1680, 1730–1740, 1778–1795, 1902–1914, and AD 1933–1980. Thus, phases of sustained drought generally lasted longer than wet periods. The longest dry events occurred in the periods AD 1701–1727 and AD 1985–2011, which both had 27 consecutive years of drought, and the latter of these two events was the most severe period of drought since AD 1470. When examined at annual timescales, the AD 1928 and AD 1964 events were the driest and the most humid phases, respectively.

3.2. The Comparison with Other Hydroclimate Reconstructions

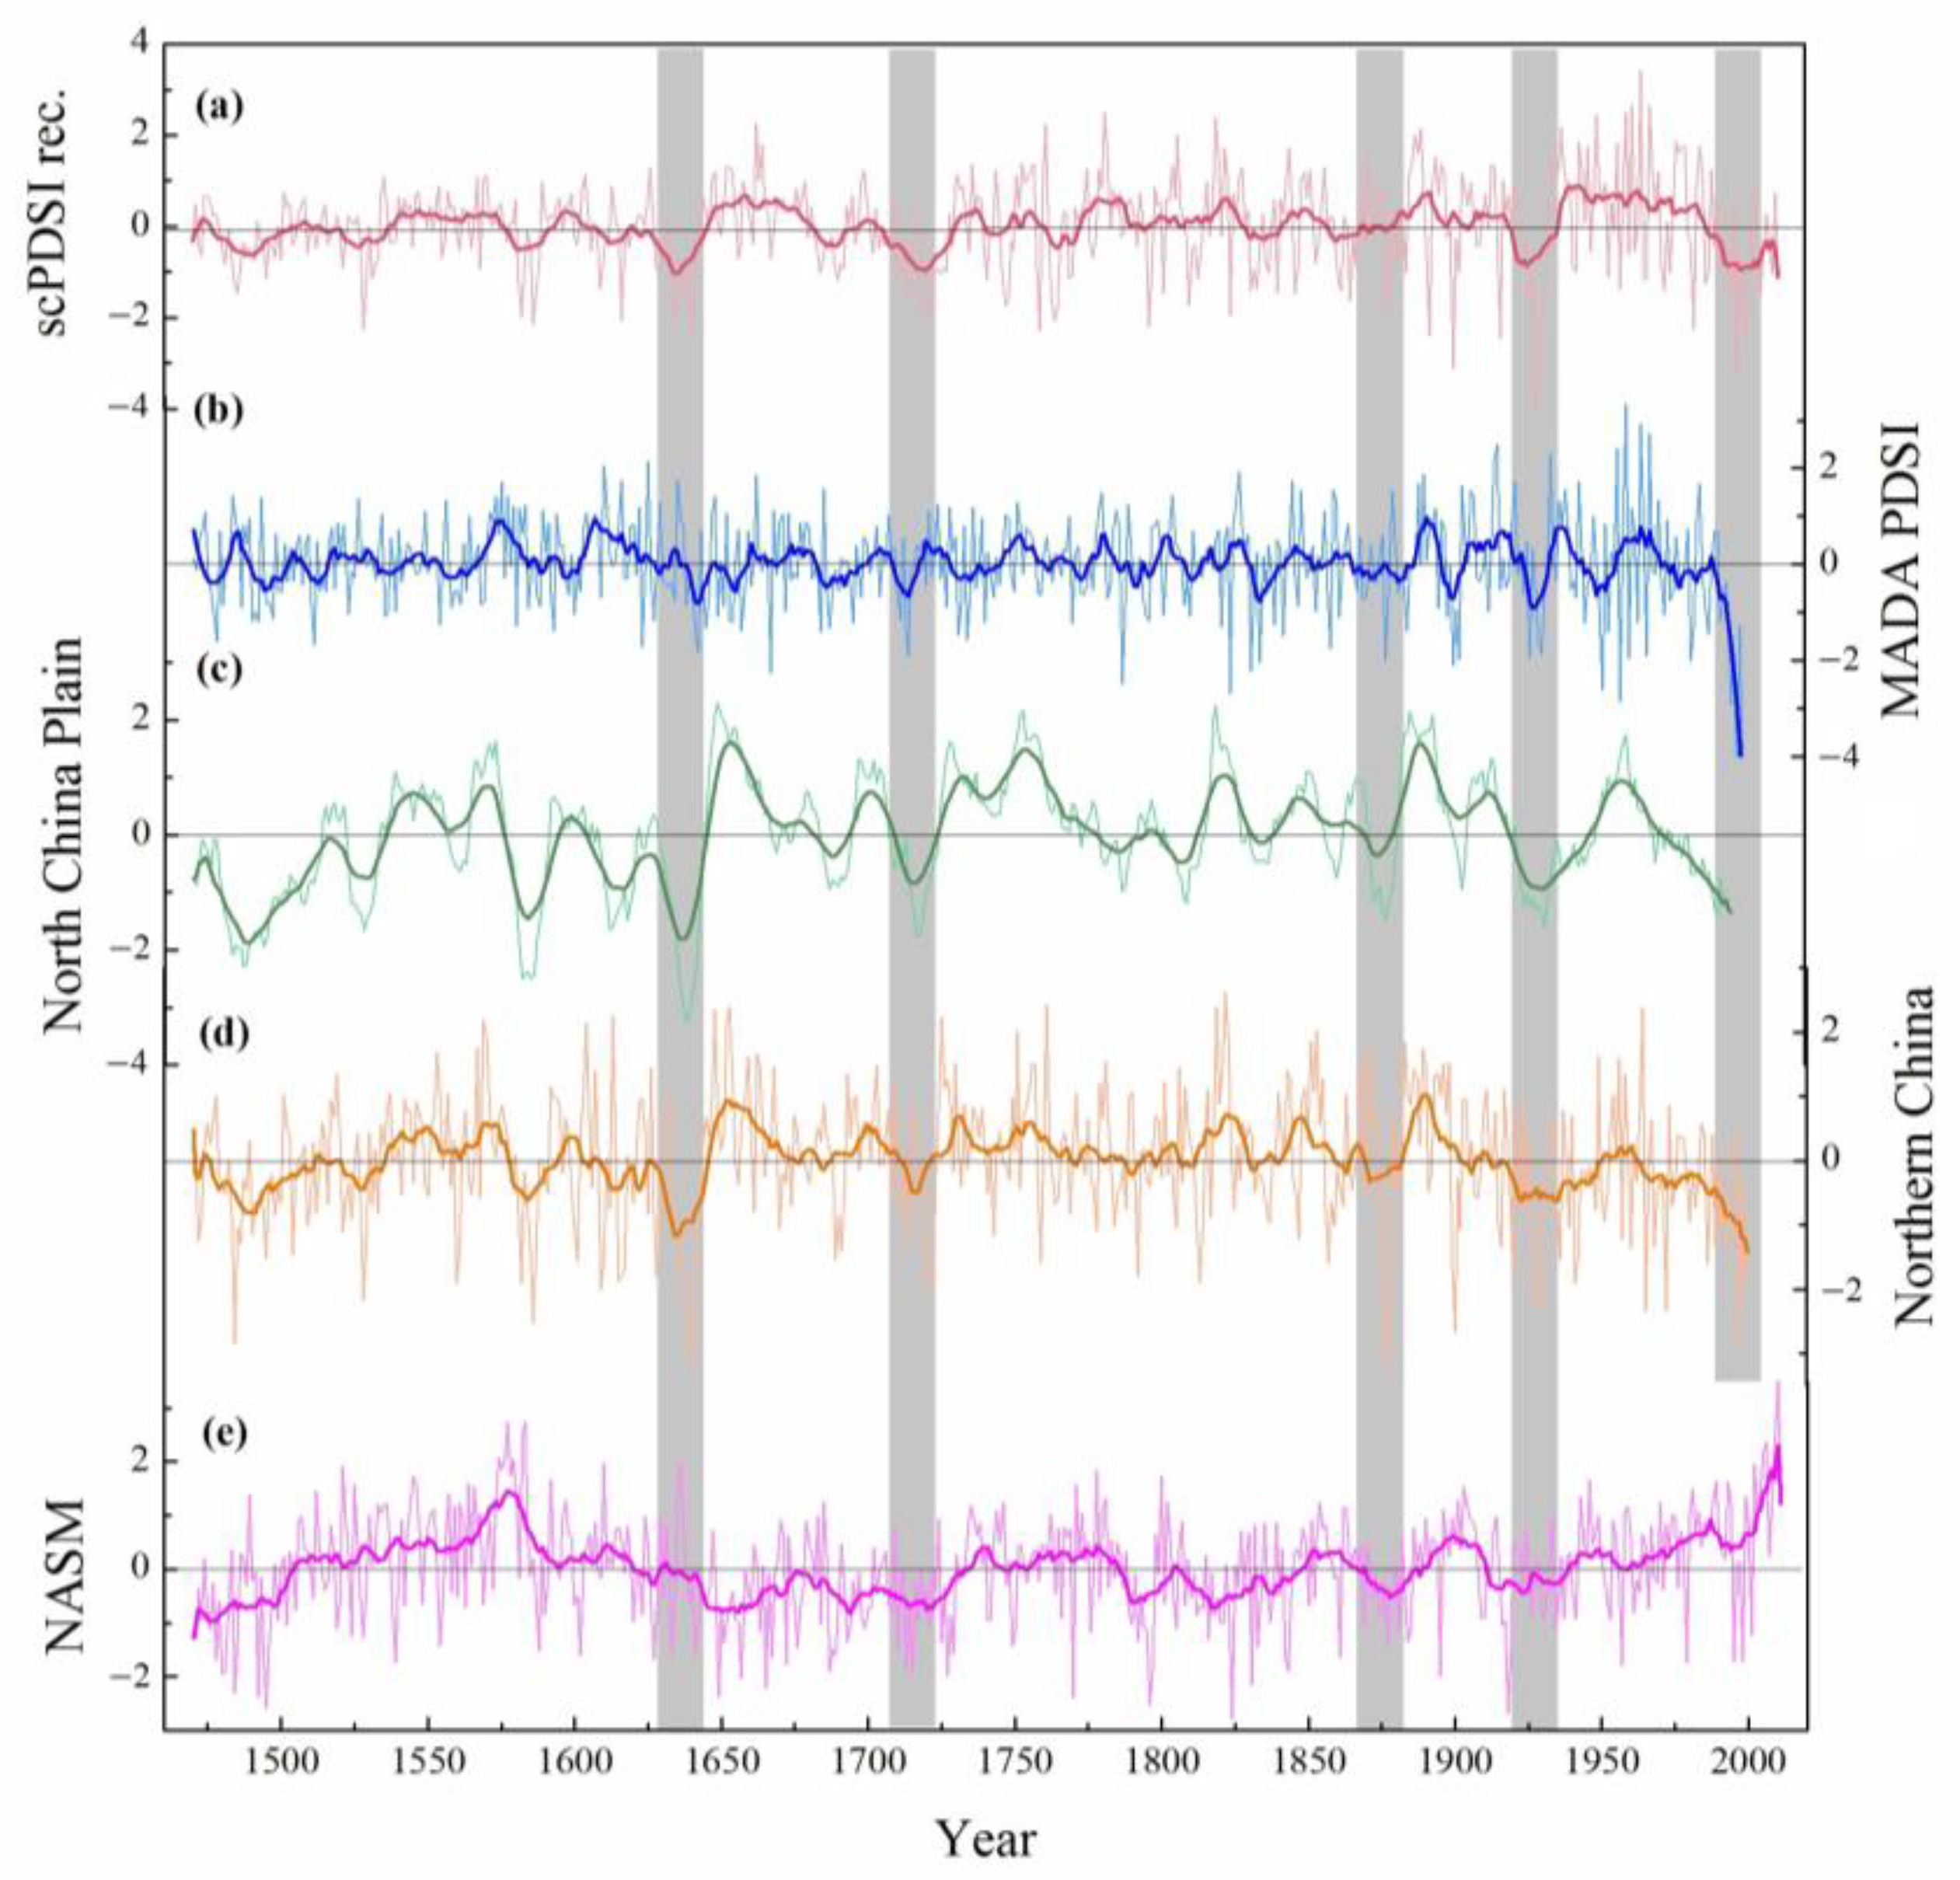
A comparison of our scPDSI reconstruction with the MADA PDSI reconstruction [34] produced a significant correlation coefficient of 0.39 (nyear = 531, p < 0.01) during their common period AD 1470 to 2010. The correlations became stronger (r = 0.44, p < 0.01) and significant at the 99% level after the serials were processed using a 30-year smoothing over the past five centuries. This result suggests that there were similar dry/wet fluctuations identified in each model, particularly during periods of drought (Figure 4a,b). These results also show that our scPDSI reconstruction accurately reproduced low-frequency variations (Figure 4a). Some differences are noted between these two series, such as our reconstruction reflecting drought conditions from AD 1600 to 1625, whereas the MADA PDSI reconstructions indicated a wet period. Such differences might be related to differences in proxy data and the methods employed. Nonetheless, major mega-drought periods were identified in both reconstructions, particularly in AD 1626–1644, 1922–1932, and AD 1985–2000.
Zheng et al. [62] reconstructed the precipitation variability over eastern China (east of 105° E, 25–40° N approximately) for the period AD 501–2000. A strong significant positive relationship was found between our scPDSI reconstruction and precipitation variability of North China Plain (34–40° N approximately; Figure 4c; [62]), a sub-region of eastern China, at annual time scales (r = 0.332, nyear = 542, p < 0.01). A higher correlation was also found (r = 0.565, nyear = 526, p < 0.01) for the 30-year smoothed data. A similar drought/wet variation was shown in these two chronologies (Figure 4a,c) during the past 530 years.
We also compared our scPDSI reconstruction with the precipitation variations of the fringe of the Asian summer monsoon in Northern China (100–120° E, 33–45° N; [63]) from AD 1470 to 2000 (Figure 4d), and the two series were significantly positively correlated with r = 0.601 (nyear = 531, p < 0.01). The dry period in our sequences (Figure 4a) also existed in Northern China (Figure 4d).
Several drought events (e.g., AD 1626–1644, 1701–1727, and AD 1922–1932) presented in our reconstruction are consistent with the results of studies performed adjacent to NCC (Figure 4e; [20]). Such persistent dry conditions likely had a severe impact on society and its economy at the time. For example, the AD 1626–1644 drought identified in NCC may have influenced the collapse of the Ming Dynasty in China [64,65], and well-known droughts recorded in AD 1922–1932 had highly detrimental impacts on agriculture, which in turn caused extensive social disorder, further famine, and led to the death of 10 million people in northern China [66]. A persistent drought disaster was documented in more than 13 provinces in NCC during AD 1876–1884, which was most severe in AD 1876–1878, and was characterized by over 340 days of non-soaking rain in the Shaanxi, Henan, and Shanxi provinces [67]. This period of extreme drought led to large-scale migration of climate refugees, causing a dramatic decrease in the area’s population by approximately 20 million people [68].
The out-of-phase relationship between our reconstruction and the northern fringe of the Asian summer monsoon region (NASM; Figure 4e; [20]) reconstruction was found during the period AD 1850–2011. It was likely modulated by the temperature increment. It is noteworthy that the prolonged drought period recorded from AD 1985 to 2011 occurred in our reconstruction during a period of global warming. This implies that periods of dry conditions in NCC may last for increasingly longer periods in the future as global temperatures continue to rise, although further research is required to validate this hypothesis.

3.3. The Spatial Representation of Our Reconstruction

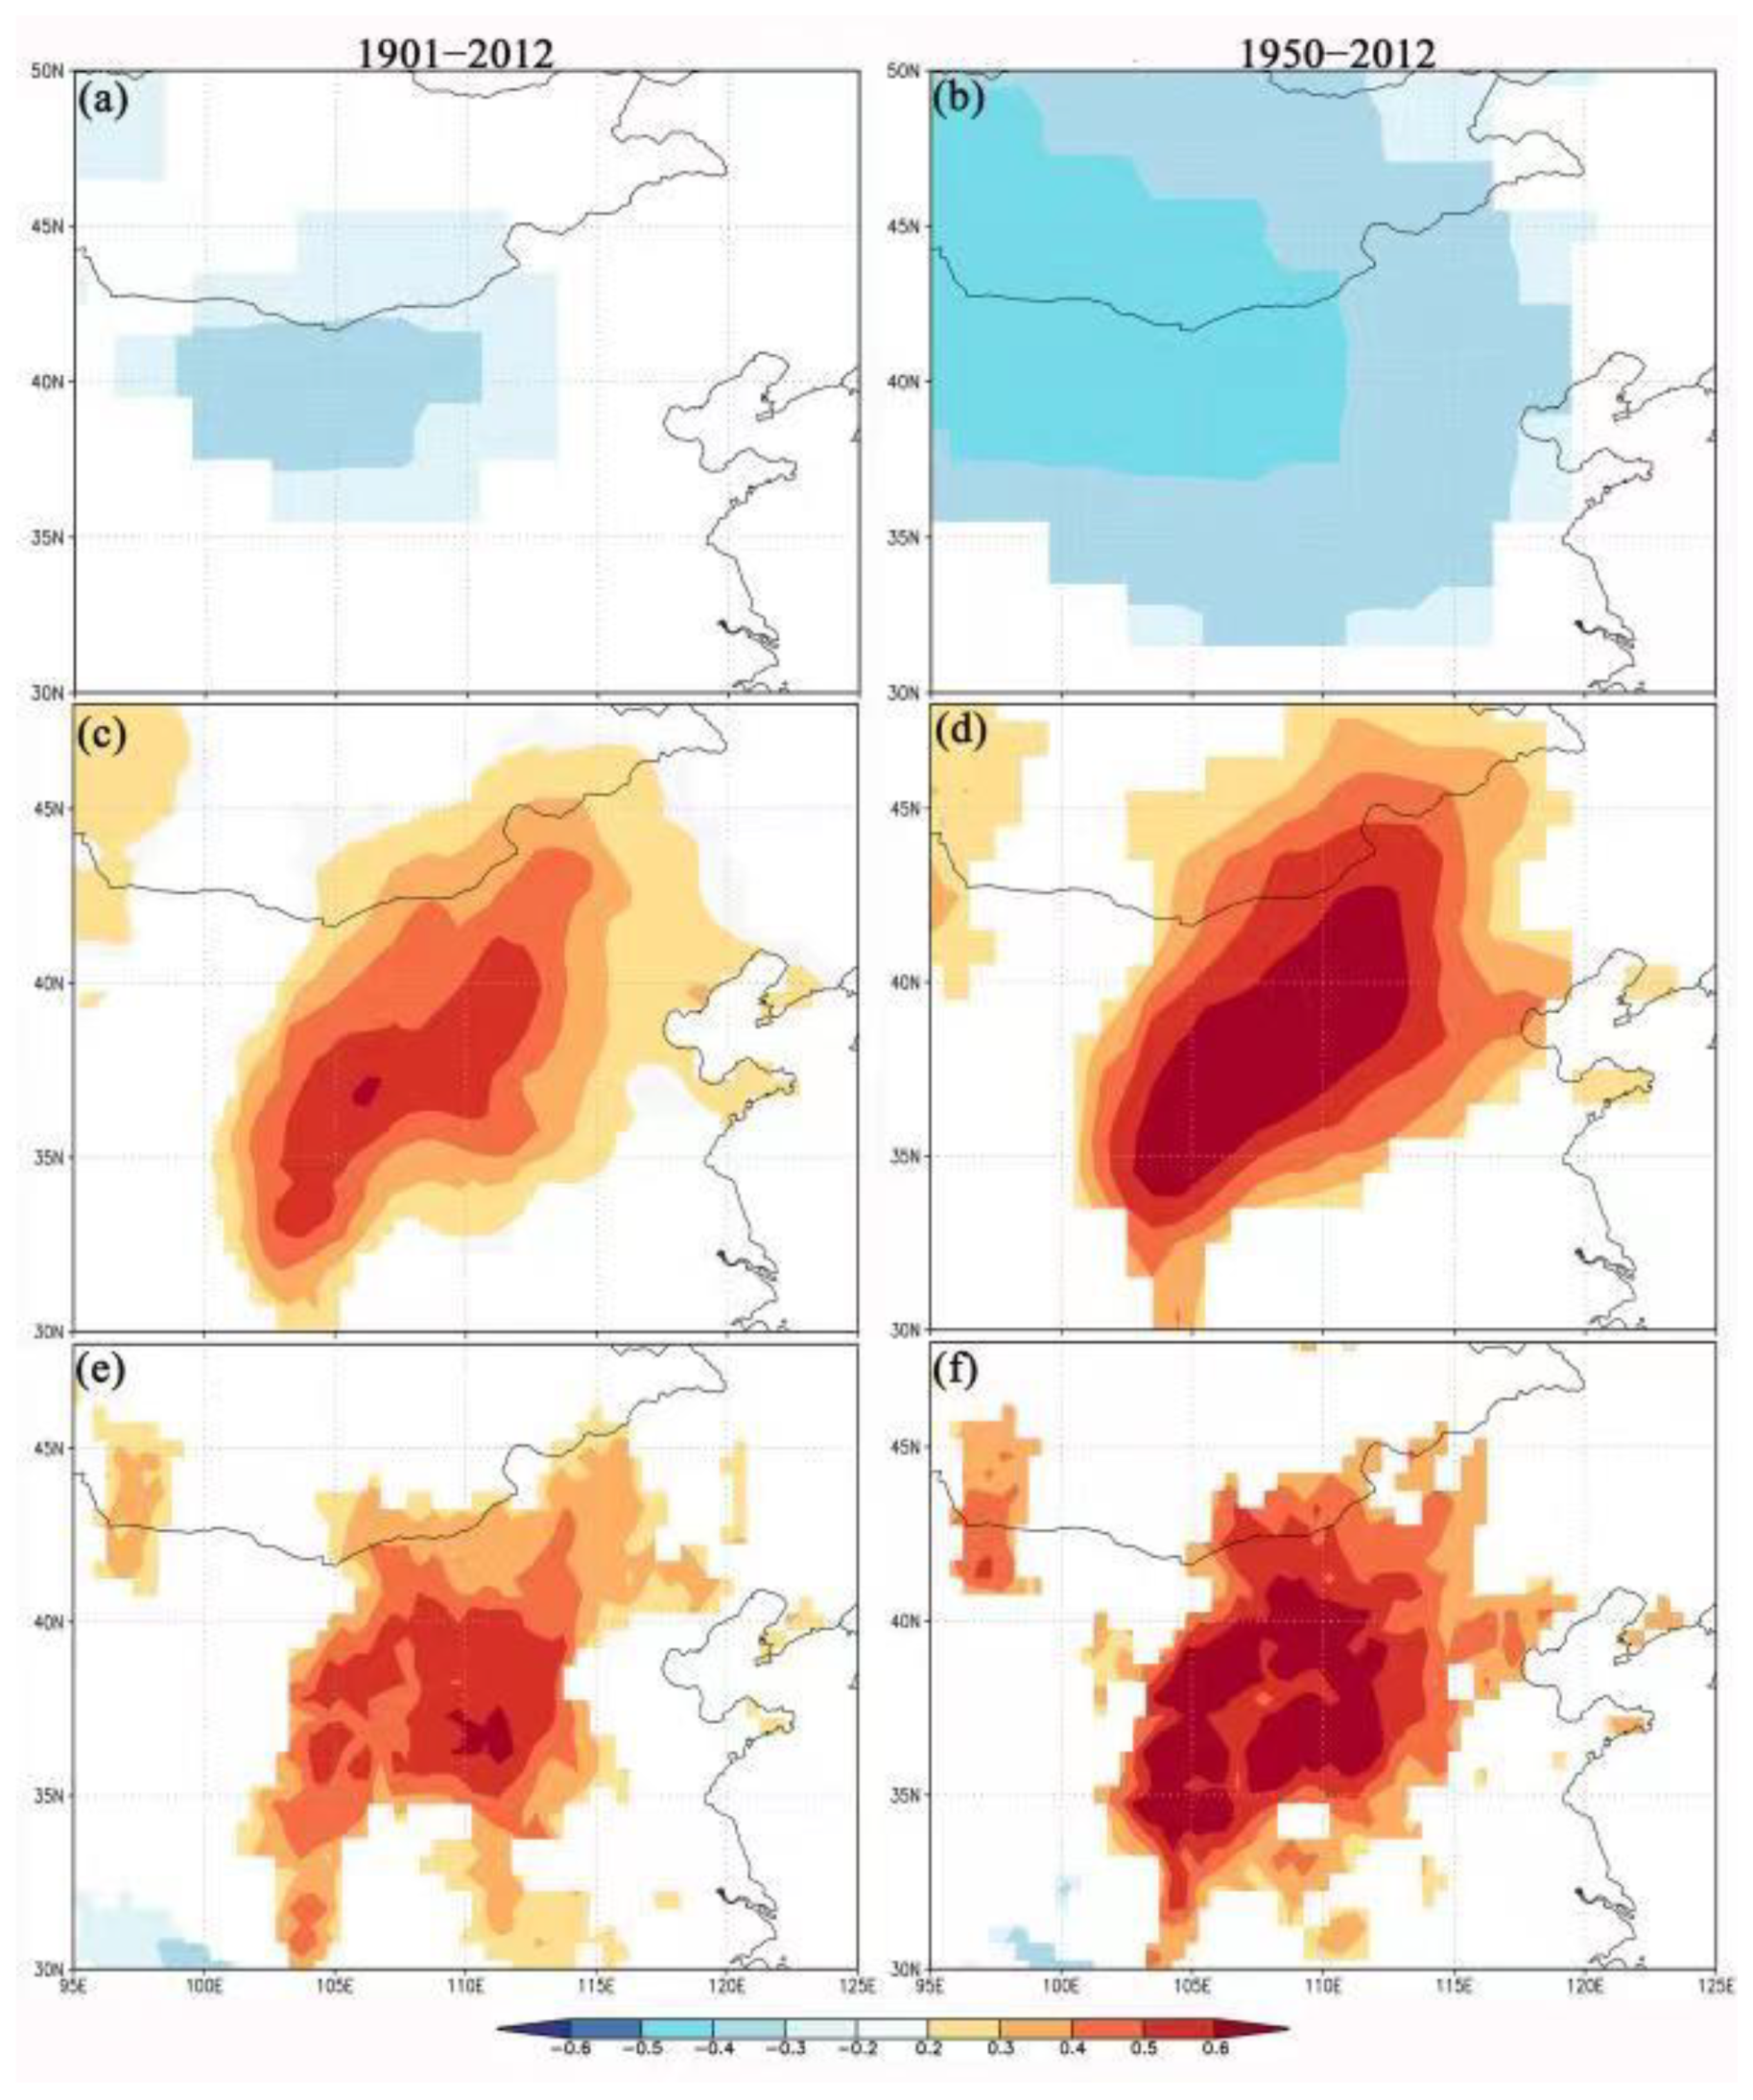
We calculated the spatial correlations between our MJJAS scPDSI reconstruction with temperature, precipitation, and scPDSI from the CRU dataset [32]. This comparison produced significantly (p < 0.1) negative correlations between our reconstruction and CRU temperatures in the period AD 1901–2012 (Figure 5a). The strength of this spatial correlation increased during the recent 60 years of the model, with correlation coefficients ranging from −0.5 to −0.3 (p < 0.1; Figure 5b). There was a robust and positive spatial correlation between our reconstruction with CRU precipitation and scPDSI data, as shown in Figure 5c–f. The spatial correlations in AD 1950–2012 were stronger than those in AD 1901–2012, and correlation coefficients up to ~0.6 (p < 0.1) appeared in our study region (Figure 5c–f). This result suggests that our scPDSI reconstruction can accurately express hydroclimate variability in the NCC region.

3.4. Relationships with Large-Scale Climate Modes

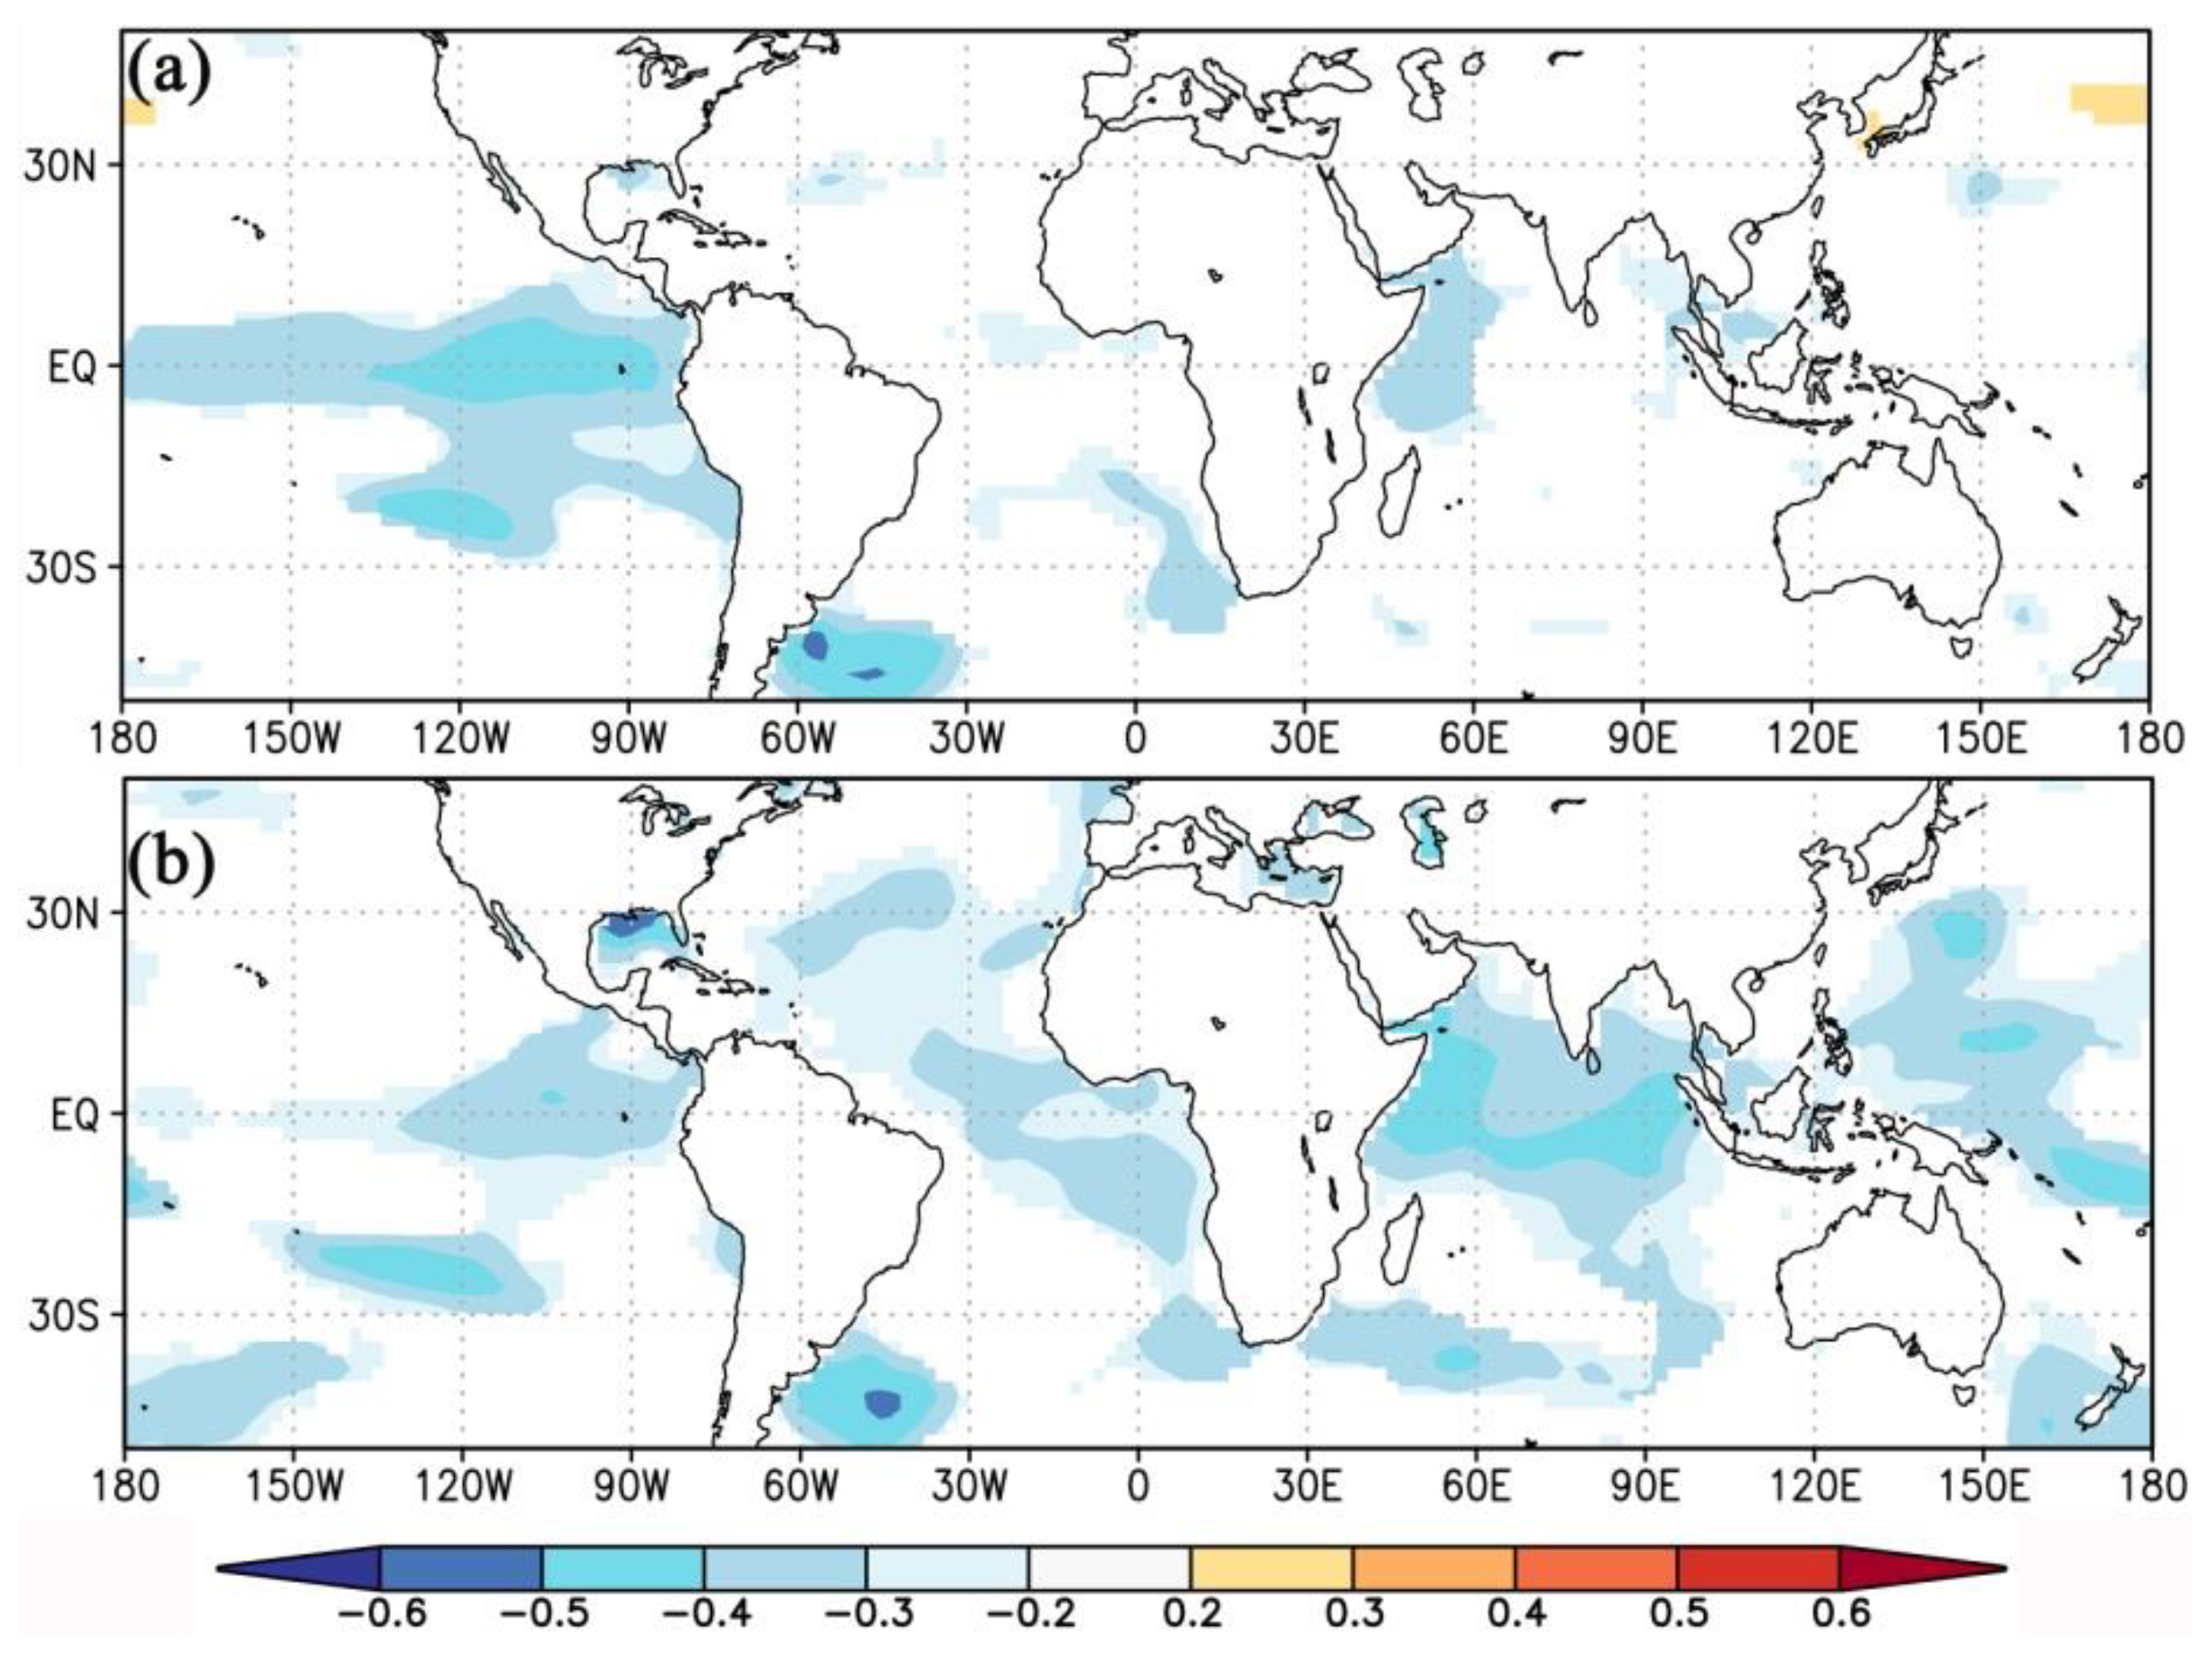
The MTM method was used to investigate the spectral properties of our reconstruction from AD 1470 to 2012 (Figure 3b). Significant spectral peaks were identified with periods of 2–7 years and 24 years at the 99% and 95% levels, respectively. We also found periodicities of 16 years and 78 years with significance at the 90% level. The dominant oscillations of 2–7 years suggest that dry and wet variability over the study region may be associated with the El Niño-Southern Oscillation (ENSO; [69]). Figure 6 shows spatial correlations between our scPDSI reconstruction and sea surface temperature (SST) over their common period. Significant (p < 0.1) negative correlations (r~−0.5) occurred in the eastern equatorial Pacific from AD 1950 to 2012 (Figure 6a), which shows that drought variability over the NCC study region could have been influenced by the ENSO. This is supported by previous studies that have also shown that SST variation in the eastern equatorial Pacific can significantly influence the climate in North China [35,37,44,70].
The Pacific Decadal Oscillation (PDO) has similar characteristics with the ENSO, but occurs at a longer (decadal) time scale [71]. The PDO has two energetic periodicities that last 15–25 years and 50–70 years [71]. The 16-year and 24-year spectral cycles identified in our reconstruction may therefore be likely associated with the PDO. The PDO is known to have been closely related to dry/wet variations within northern China over the last 100 years, with the positive phase of the PDO corresponding to dry conditions in the region and the negative phase corresponding to wet conditions [72]. The spatial correlation results shown here for the 10-year running mean record weaker correlations in the eastern equatorial Pacific region, but still have significantly (p < 0.1) negative values ranging from −0.5 to −0.3 (Figure 6b).
Hurrell et al. [73] reported that significant interannual variability of the NAO has periods of 2–3 and 7–8 years. Based on long-term analysis of tree-ring proxy data [57,74], the reconstructed NAO series also has interdecadal fluctuations with periods of 16–28 years and 50–88 years. These reported NAO cycles agree with the frequencies determined in our scPDSI reconstruction. Previous research has shown that there is out-of-phase variation between the NAO and rainfall in North China [75]. The NAO can significantly impact the intensity of rainfall in Central Asia and North China, with a weaker NAO corresponding to wetter conditions and a stronger NAO corresponding to drier conditions [76]. Based on dendrochronology, Li et al. [77] also showed that drought variability along the eastern margin of the Loess Plateau was related to the North Atlantic SST tripolar pattern.
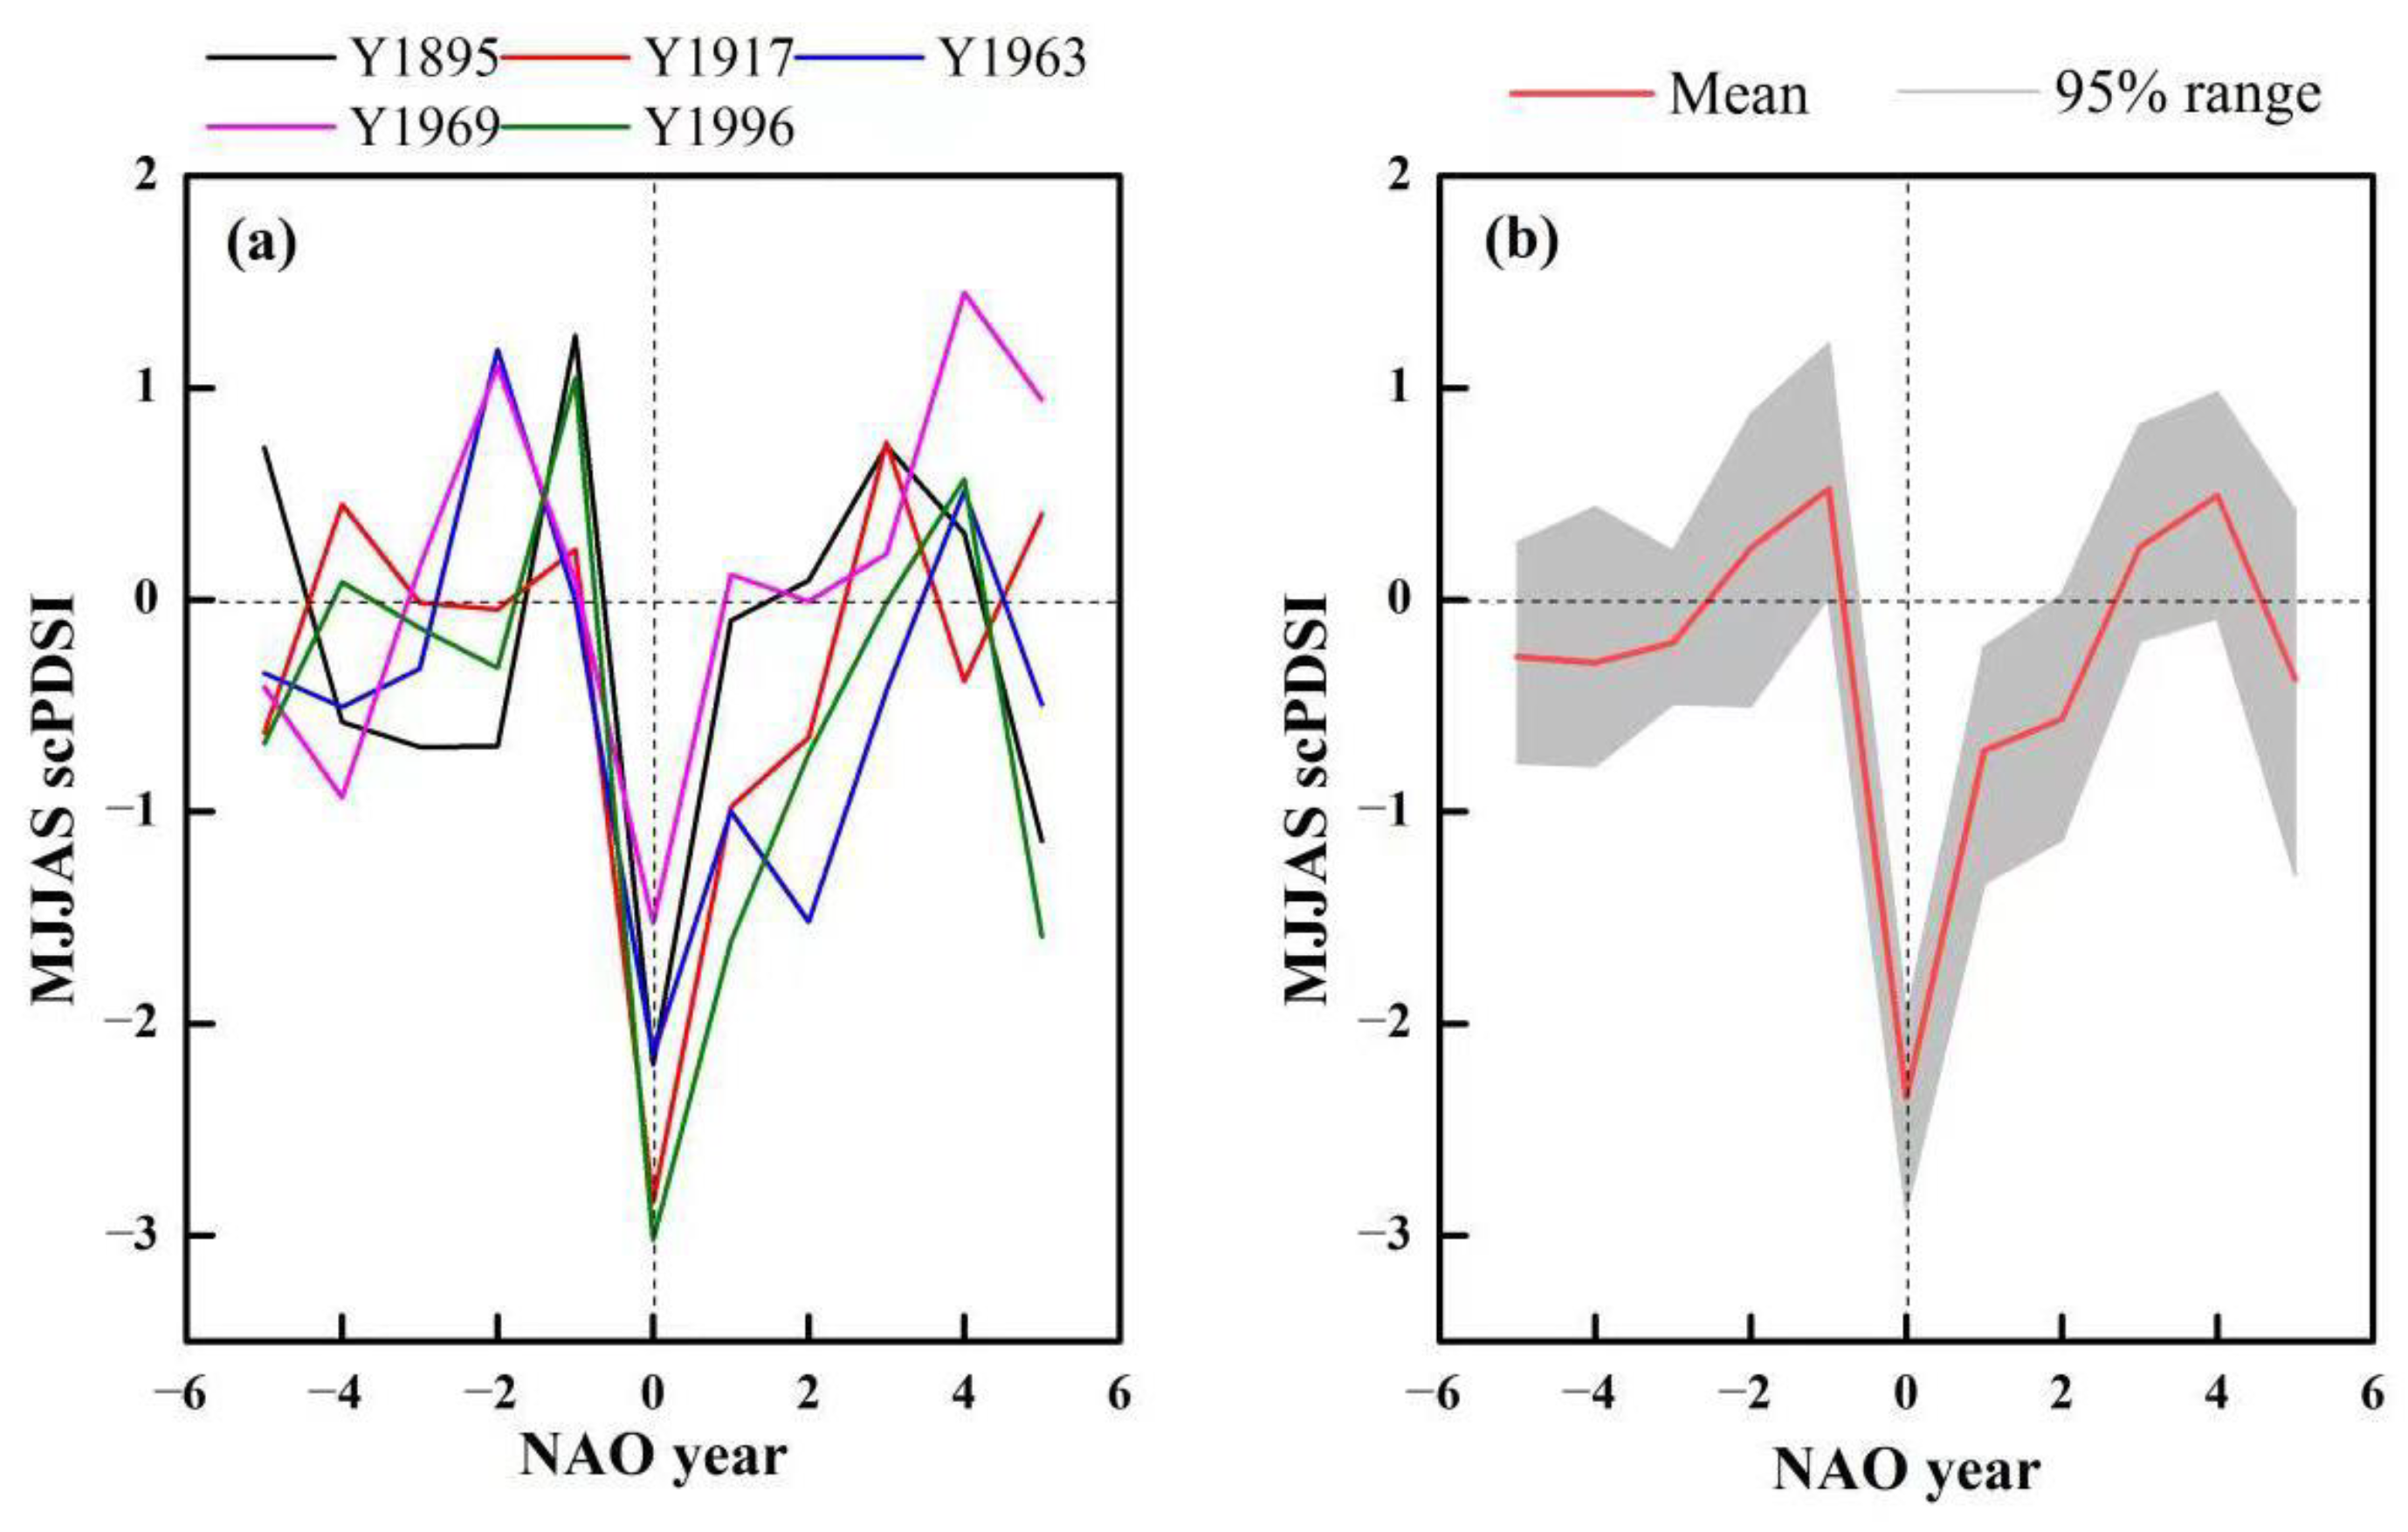
We adopted SEA to determine whether hydroclimate anomalies in our study region were caused by the NAO (Figure 7). In our study, values of NAO data greater than two standard deviations (σ = 1) away from the average were defined as extreme events [78]. The five strongest extreme NAO event years, which specifically occurred in AD 1895, 1917, 1963, 1969, and 1996, were identified and shown in Figure 7a. Our analysis window included up to five years before and after each NAO event year. These results demonstrate that extreme NAO years strongly affect drought variability in the NCC region, and that negative NAO events could cause significantly dry anomalies for the following three years.
In addition, our spatial correlation revealed significant (p < 0.1) negative correlations that varied strongly after producing a 10-year running mean time series for the Atlantic, western equatorial Pacific, and Indian Ocean regions (Figure 6b). Therefore, we calculated the correlation between our scPDSI reconstruction data and precipitation rates in India from June to September during AD 1950–2012. This analysis produced a significant positive correlation coefficient of 0.44 (nyear = 63, p < 0.01), which suggested that moisture convergence in the NCC region may be related to the Indian monsoon. Previous studies have found that North China drought events are linked to tropical Indo-Pacific climate variability [36,79], which can trigger changes in monsoon circulation patterns, Walker circulation, and precipitation over monsoonal Asia [80].

4. Conclusions

In this study, we produced a new MJJAS scPDSI reconstruction based on tree-ring and DWI data. This reconstruction was developed by applying PCR analysis across NCC for the previous 530 years. The reconstruction showed that there were seven extreme dry/wet events that continued for at least 10 years equally. Two of these dry events, which occurred in AD 1701–1727 and AD 1985–2011, represent the longest dry phases since AD 1470. Our data show that the driest year within the study period occurred in AD 1928, which corroborates the results of previous studies, and was associated with significant economic and societal decline. Spatial correlation patterns revealed that our new reconstruction has a significantly negative correlation with temperature, but a significantly positive correlation with precipitation and scPDSI during AD 1901–2012. We also confirm that moisture changes in NCC were modulated by large-scale atmospheric circulation; however, more research is needed to clarify the relationships between large-scale ocean-land circulation and dry/wet changes in this region.

Author Contributions

Conceptualization, S.K., J.W. and J.L.; methodology, S.K. and J.W.; formal analysis, S.K.; data curation, S.K.; writing—original draft preparation, S.K.; writing—review and editing, S.K., J.L. and J.W. All authors have read and agreed to the published version of the manuscript.

Funding

This work was supported by the National Key R&D Program of China, grant number 2020YFA0608401 and the National Natural Science Foundation of China, grant number 42261134537.

Institutional Review Board Statement

Not applicable.

Informed Consent Statement

Not applicable.

Data Availability Statement

The reconstructed warm-season 530-yr scPDSI in North-Central China is available via direction to the authors. CRUTS 4.06 dataset is available at https://catalogue.ceda.ac.uk/uuid/c26a65020a5e4b80b20018f148556681, accessed on 17 March 2023. MADA by Cook et al. 2010 was downloaded at http://www.ncdc.noaa.gov/paleo/pubs/cook2010/cook2010.html, accessed on 17 March 2023.

Conflicts of Interest

The authors declare no conflict of interest.

References

  1. Dai, A. Increasing drought under global warming in observations and models. Nat. Clim. Chang. 2012, 3, 52–58. [Google Scholar] [CrossRef]
  2. Feng, S.; Fu, Q. Expansion of global drylands under a warming climate. Atmos. Chem. Phys. 2013, 13, 10081–10094. [Google Scholar] [CrossRef] [Green Version]
  3. Huang, J.P.; Yu, H.P.; Guan, X.D.; Wang, G.Y.; Guo, R.X. Accelerated dry land expansion under climate change. Nat. Clim. Chang. 2016, 6, 166–171. [Google Scholar] [CrossRef]
  4. Sheffield, J.; Wood, E.F.; Roderick, M.L. Little change in global drought over the past 60 years. Nature 2012, 491, 435–438. [Google Scholar] [CrossRef] [PubMed]
  5. Greve, P.; Orlowsky, B.; Mueller, B.; Sheffield, J.; Seneviratne, S.I. Global assessment of trends in wetting and drying over land. Nat. Geosci. 2014, 7, 716–721. [Google Scholar] [CrossRef]
  6. Yu, M.; Li, Q.; Hayes, M.J.; Svoboda, M.D.; Heim, R.R. Are droughts becoming more frequent or severe in China based on the standardized precipitation evapotranspiration index: 1951–2010? Int. J. Climatol. 2014, 34, 545–558. [Google Scholar] [CrossRef] [Green Version]
  7. Chen, H.; Sun, J. Changes in drought characteristics over China using the standardized precipitation evapotranspiration index. J. Clim. 2015, 28, 281–299. [Google Scholar] [CrossRef]
  8. Jiang, J.; Jiang, D.B.; Lin, Y.H. Changes and projection of dry/wet areas over China. Chin. J. Atmos. Sci. 2017, 41, 43–56. [Google Scholar] [CrossRef]
  9. Wang, W.; Zhu, Y.; Xu, R.; Liu, J. Drought severity change in China during 1961–2012 indicated by SPI and SPEI. Nat. Hazards 2015, 75, 2437–2451. [Google Scholar] [CrossRef]
  10. Trenberth, K.E.; Dai, A.; Schrier, G.V.D.; Jones, P.D.; Barichivich, J.; Briffa, K.R.; Sheffield, J. Global warming and changes in drought. Nat. Clim. Chang. 2014, 4, 17–22. [Google Scholar] [CrossRef]
  11. Zou, X.K.; Zhai, P.M.; Zhang, Q. Variations in droughts over China: 1951–2003. Geophys. Res. Lett. 2005, 32, L04707. [Google Scholar] [CrossRef]
  12. Ma, Z.G.; Fu, C.B.; Yang, Q.; Zheng, Z.Y.; Lü, M.X.; Li, M.X.; Duan, Y.W.; Chen, L. Drying trend in northern China and its shift during 1951–2016. Chin. J. Atmos. Sci. 2018, 42, 951–961. [Google Scholar] [CrossRef]
  13. Ma, Z.G.; Fu, C.B.; Zhou, T.J.; Yan, Z.W.; Li, M.X.; Zheng, Z.Y.; Chen, L.; Lv, M.X. Status and Ponder of Climate and Hydrology Changes in the Yellow River Basin. Bull. Chin. Acad. Sci. 2020, 35, 52–60. [Google Scholar] [CrossRef]
  14. Li, J.B.; Xie, S.P.; Cook, E.R.; Chen, F.H.; Shi, J.F.; Zhang, D.D.; Fang, K.Y.; Gou, X.H.; Li, T.; Peng, J.F.; et al. Deciphering human contributions to Yellow River flow reductions and downstream drying using centuries-long tree ring records. Geophys. Res. Lett. 2019, 46, 898–905. [Google Scholar] [CrossRef]
  15. Yang, B.; Qin, C.; Bräuning, A.; Osborn, T.J.; Trouet, V.; Ljungqvist, F.C.; Esper, J.; Schneider, L.; Grießinger, J.; Büntgen, U.; et al. Long-term decrease in Asian monsoon rainfall and abrupt climate change events over the past 6700 years. Proc. Natl. Acad. Sci. USA 2021, 118, e2102007118. [Google Scholar] [CrossRef]
  16. Fang, K.Y.; Guo, Z.T.; Chen, D.L.; Linderholm, W.H.; Li, J.B.; Zhou, F.F.; Guo, G.Y.; Dong, Z.P.; Li, Y.J. Drought variation of western Chinese Loess Plateau since 1568 and its linkages with droughts in western North America. Clim. Dyn. 2017, 49, 3839–3850. [Google Scholar] [CrossRef] [Green Version]
  17. Liu, Y. Recent anthropogenic curtailing of Yellow River runoff and sediment load is unprecedented over the past 500 years. Chin. Sci. Bull. 2020, 65, 3504–3505. (In Chinese) [Google Scholar] [CrossRef]
  18. Li, Q.; Liu, Y.; Nakatsuka, T.; Song, H.; McCarroll, D.; Yang, Y.; Qi, J. The 225-year precipitation variability inferred from tree-ring records in Shanxi Province, the North China, and its teleconnection with Indian summer monsoon. Glob. Planet Chang. 2015, 132, 11–19. [Google Scholar] [CrossRef] [Green Version]
  19. Li, Q.; Liu, Y.; Nakatsuka, T.; Fang, K.Y.; Song, H.M.; Liu, R.S.; Sun, C.F.; Li, G.; Wang, K. East Asian Summer Monsoon moisture sustains summer relative humidity in the southwestern Gobi Desert, China: Evidence from δ18O of tree rings. Clim. Dyn. 2019, 52, 6321–6337. [Google Scholar] [CrossRef]
  20. Yang, B.; Kang, S.Y.; Ljungqvist, F.C.; He, M.H.; Yan, Z.; Qin, C. Drought variability at the northern fringe of the Asian summer monsoon region over the past millennia. Clim. Dyn. 2014, 43, 845–859. [Google Scholar] [CrossRef]
  21. Yang, B.; Wang, J.L.; Liu, J.J.; He, M.H.; Melvin, T.M.; Osborn, T.J.; Briffa, K.R. A 1556 year-long early summer moisture reconstruction for the Hexi Corridor, Northwestern China. Sci. China Earth Sci. 2019, 62, 953–963. [Google Scholar] [CrossRef]
  22. Chen, F.; Xu, Q.; Chen, J.; Birks, H.J.B.; Liu, J.; Zhang, S.; Jin, L.; An, C.; Telford, R.J.; Cao, X.; et al. East Asian summer monsoon precipitation variability since the last deglaciation. Sci. Rep. 2015, 5, 11186. [Google Scholar] [CrossRef] [PubMed] [Green Version]
  23. Li, J.; Dodson, J.; Yan, H.; Zhang, D.D.; Zhang, X.; Xu, Q.; Lee, H.F.; Pei, Q.; Cheng, B.; Li, C.; et al. Quantifying climatic variability in monsoonal northern China over the last 2200 years and its role in driving Chinese dynastic changes. Quat. Sci. Rev. 2017, 159, 35–46. [Google Scholar] [CrossRef] [Green Version]
  24. Ma, J.; Edmunds, W.M. Groundwater and lake evolution in the Badain Jaran Desert ecosystem, Inner Mongolia. Hydrogeol. J. 2006, 14, 1231–1243. [Google Scholar] [CrossRef]
  25. Zhou, A.; Sun, H.; Chen, F.; Zhao, Y.; An, C.; Dong, G.; Wang, Z.; Chen, J. High-resolution climate change in mid-late Holocene on Tianchi Lake, Liupan Mountain in the Loess Plateau in central China and its significance. Chin. Sci. Bull. 2010, 55, 2118–2121. [Google Scholar] [CrossRef]
  26. Liu, J.B.; Chen, F.H.; Chen, J.H.; Xia, D.S.; Xu, Q.H.; Wang, Z.L.; Li, Y.C. Humid medieval warm period recorded by magnetic characteristics of sediments from Gonghai Lake, Shanxi, North China. Chin. Sci. Bull. 2011, 56, 2464–2474. [Google Scholar] [CrossRef] [Green Version]
  27. Zhang, P.; Cheng, H.; Edwards, R.L.; Chen, F.; Wang, Y.; Yang, X.; Liu, J.; Tan, M.; Wang, X.; Liu, J.; et al. A Test of Climate, Sun, and Culture Relationships from an 1810-Year Chinese Cave Record. Science 2008, 322, 940–942. [Google Scholar] [CrossRef] [Green Version]
  28. Tan, L.; Cai, Y.; An, Z.; Edwards, R.L.; Cheng, H.; Shen, C.C.; Zhang, H. Centennial- to decadal-scale monsoon precipitation variability in the semi-humid region, northern China during the last 1860 years: Records from stalagmites in Huangye Cave. Holocene 2010, 21, 287–296. [Google Scholar] [CrossRef]
  29. Cai, Y.; Tan, L.; Cheng, H.; An, Z.; Edwards, R.L.; Kelly, M.J.; Kong, X.; Wang, X. The variation of summer monsoon precipitation in central China since the last deglaciation. Earth Planet Sci. Lett. 2010, 291, 21–31. [Google Scholar] [CrossRef]
  30. Chen, F.H.; Yu, Z.C.; Yang, M.L.; Ito, E.; Wang, S.; Madsen, D.B.; Huang, X.; Zhao, Y.; Sato, T.; John, B.; et al. Holocene moisture evolution in arid central Asia and its out-of-phase relationship with Asian monsoon history. Quat. Sci. Rev. 2008, 27, 351–364. [Google Scholar] [CrossRef]
  31. Chen, F.H.; Chen, J.H.; Huang, W. A discussion on the westerly dominated climate model in mid-latitude Asia during the modern interglacial period. Earth Sci. Front. 2009, 16, 23–32. (In Chinese) [Google Scholar] [CrossRef]
  32. Harris, I.; Osborn, T.J.; Jones, P.; Lister, D. Version 4 of the CRU TS monthly high-resolution gridded multivariate climate dataset. Sci. Data 2020, 7, 109. [Google Scholar] [CrossRef] [Green Version]
  33. Wells, N.; Goddard, S.; Hayes, M.J. A self-calibrating Palmer Drought Severity Index. J. Clim. 2004, 17, 2335–2351. [Google Scholar] [CrossRef]
  34. Cook, E.R.; Anchukaitis, K.J.; Buckley, B.M.; D’Arrigo, R.D.; Jacoby, G.C.; Wright, W.E. Asian monsoon failure and megadrought during the last millennium. Science 2010, 328, 486–489. [Google Scholar] [CrossRef] [PubMed] [Green Version]
  35. Fang, K.Y.; Gou, X.H.; Chen, F.H.; Liu, C.Z.; Davi, N.; Li, J.B.; Zhao, Z.Q.; Li, Y.J. Tree-ring based reconstruction of drought variability (1615–2009) in the Kongtong Mountain area, northern China. Glob. Planet Chang. 2012, 80–81, 190–197. [Google Scholar] [CrossRef]
  36. Fang, K.Y.; Gou, X.H.; Chen, F.H.; D’Arrigo, R.; Li, J.B. Tree-ring based drought reconstruction for the Guiqing Mountain (China): Linkages to the Indian and Pacific Oceans. Int. J. Climatol. 2010, 30, 1137–1145. [Google Scholar] [CrossRef]
  37. Kang, S.Y.; Yang, B.; Qin, C. Recent tree-growth reduction in north central China as a combined result of a weakened monsoon and atmospheric oscillations. Clim. Chang. 2012, 115, 519–536. [Google Scholar] [CrossRef]
  38. Li, J.B.; Chen, F.H.; Cook, E.R.; Gou, X.H.; Zhang, Y.X. Drought reconstruction for north central China from tree rings: The value of the Palmer drought severity index. Int. J. Climatol. 2007, 27, 903–909. [Google Scholar] [CrossRef]
  39. Dai, J.H.; Shao, X.M.; Cui, H.T.; Ge, Q.S.; Liu, H.Y.; Tang, Z.Y. Reconstruction of Past Eco-Climate by Tree-ring Width Index of Larix chinensis on MT. Taibai. Quatern. Sci. 2003, 23, 428–435. (In Chinese) [Google Scholar]
  40. Kang, S.Y.; Yang, B.; Qin, C.; Wang, J.L.; Shi, F.; Liu, J.J. Extreme drought events in the years 1877–1878, and 1928, in the southeast Qilian Mountains and the air-sea coupling system. Quatern. Int. 2013, 283, 85–92. [Google Scholar] [CrossRef]
  41. Chen, F.; Yuan, Y.J.; Wei, W.S.; Yu, S.L.; Fan, Z.A.; Zhang, R.B.; Shang, H.M.; Zhang, T.W. Reconstruction of Annual Precipitation in Shandan Based Tree-Ring since 1783 A.D. Geogr. Geo-Inf. Sci. 2010, 26, 82–86. [Google Scholar] [CrossRef]
  42. Fang, K.Y.; Gou, X.H.; Chen, F.H.; Yang, M.; Li, J.; He, M.; Zhang, Y.; Tian, Q.; Peng, J. Drought variations in the eastern part of northwest China over the past two centuries: Evidence from tree rings. Clim. Res. 2009, 38, 129–135. [Google Scholar] [CrossRef] [Green Version]
  43. Kang, S.Y.; Bräuning, A.; Ge, H.Y. Tree-ring based evidence of the multi-decadal climatic oscillation during the past 200 years in north-central China. J. Arid Environ. 2014, 110, 53–59. [Google Scholar] [CrossRef]
  44. Liu, Y.; Wang, L.; Li, Q.; Cai, Q.F.; Song, H.M.; Sun, C.F.; Liu, R.S.; Mei, R.C. Asian summer monsoon-related relative humidity recorded by tree ring δ18O during last 205 years. J. Geophys. Res. Atmos. 2019, 124, 9824–9838. [Google Scholar] [CrossRef]
  45. Deng, Y.; Gou, X.H.; Gao, L.L.; Zhao, Z.Q.; Cao, Z.Y.; Yang, M.X. Aridity changes in the eastern Qilian Mountains since AD 1856 reconstructed from tree-rings. Quatern. Int. 2013, 283, 78–84. [Google Scholar] [CrossRef]
  46. Gao, S.Y.; Lu, R.J.; Qiang, M.R.; Eerdun, H.; Zhang, D.; Yuan, C.; Hong, X. Reconstruction of precipitation in the last 140 years from tree ring at south margin of the Tengger Desert, China. Chin. Sci. Bull. 2005, 50, 2487–2492. [Google Scholar] [CrossRef]
  47. Chinese National Meteorological Administration. Yearly Charts of Dryness/Wetness in China for the Last 500-Year Period; Chinese Cartographic Publishing House: Beijing, China, 1981; pp. 321–332. [Google Scholar]
  48. Zhang, D.E.; Liu, C. Continuation (1980–1992) of the yearly charts of dryness/wetness in China for the last 500 years period. Meteorol. Mon. 1993, 19, 41–45. (In Chinese) [Google Scholar]
  49. Zhang, D.E.; Li, X.Q.; Liang, Y.Y. Continuation (1993–2000) of the yearly charts of dryness/wetness in China for the last 500 years period. J. Appl. Meteorol. Sci. 2003, 14, 379–384. [Google Scholar] [CrossRef]
  50. Bai, H.; Dong, A.; Zheng, G. Yearly Charts of Dryness/Wetness in NW China for the Last 500-Year Period (1470–2008); China Meteorological Press: Beijing, China, 2010; pp. 211–223. [Google Scholar]
  51. Schneider, T. Analysis of incomplete climate data: Estimation of mean values and covariance matrices and imputation of missing values. J. Clim. 2001, 14, 853–871. [Google Scholar] [CrossRef]
  52. Cook, E.R.; Woodhouse, C.A.; Eakin, C.M.; Meko, D.M.; Stahle, D.W. Long-term aridity changes in the Western United States. Science 2004, 306, 1015–1018. [Google Scholar] [CrossRef] [Green Version]
  53. Luterbacher, J.; Dietrich, D.; Xoplaki, E.; Grosjean, M.; Wanner, H. European seasonal and annual temperature variability, trends, and extremes since 1500. Science 2004, 303, 1499–1503. [Google Scholar] [CrossRef] [PubMed] [Green Version]
  54. Ortega, P.; Lehner, F.; Swingedouw, D.; Masson-Delmotte, V.; Raible, C.C.; Casado, M.; Yiou, P. A model-tested North Atlantic Oscillation reconstruction for the past millennium. Nature 2015, 523, 71–74. [Google Scholar] [CrossRef] [PubMed]
  55. Wang, J.L.; Yang, B.; Ljungqvist, F.C.; Luterbacher, J.; Osborn, T.J.; Briffa, K.R.; Zorita, E. Internal and external forcing of multidecadal Atlantic climate variability over the past 1200 years. Nat. Geosci. 2017, 10, 512–517. [Google Scholar] [CrossRef] [Green Version]
  56. Wang, J.L.; Yang, B.; Ljungqvist, F.C. Moisture and Temperature Covariability over the Southeastern Tibetan Plateau during the Past Nine Centuries. J. Clim. 2020, 33, 6583–6598. [Google Scholar] [CrossRef]
  57. Cook, E.R.; D’Arrigo, R.D.; Briffa, K.R. The North Atlantic Oscillation and its expression in circum-Atlantic tree-ring chronologies from North America and Europe. Holocene 1998, 8, 9–17. [Google Scholar] [CrossRef]
  58. Mann, M.E.; Lees, J. Robust estimation of background noise and signal detection in climatic time series. Clim. Chang. 1996, 33, 409–445. [Google Scholar] [CrossRef]
  59. Haurwitz, M.W.; Brier, G.W. A critique of the superposed epoch analysis method: Its application to solar-weather relations. Mon. Weath Rev. 1981, 109, 2074–2079. [Google Scholar] [CrossRef]
  60. Van der Schrier, G.; Barichivich, J.; Briffa, K.R.; Jones, P.D. A scPDSI-based global data set of dry and wet spells for 1901–2009. J. Geophys. Res. Atmos. 2013, 118, 4025–4048. [Google Scholar] [CrossRef]
  61. Xiao, S.; Peng, X.; Tian, Q.; Ding, A. Drought variation recorded by growth rings of the shrub Sabina vulgar is in the middle Qilian Mountains, northwest China. Dendrochronologia 2021, 66, 125813. [Google Scholar] [CrossRef]
  62. Zheng, J.Y.; Wang, W.C.; Ge, Q.S.; Man, Z.M.; Zhang, P.Y. Precipitation variability and extreme events in eastern China during the past 1500 years. Terr. Atmos. Ocean Sci. 2006, 17, 579–592. [Google Scholar] [CrossRef] [Green Version]
  63. Kang, S.Y.; Yang, B. Precipitation variability at the northern fringe of the Asian summer monsoon in northern China and its possible mechanism over the past 530 years. Quatern. Sci. 2015, 35, 1185–1193. (In Chinese) [Google Scholar]
  64. Feng, S.; Hu, Q.; Wu, Q.; Mann, M.E. A gridded reconstruction of warm season precipitation for Asia spanning the past half millennium. J. Clim. 2013, 26, 2192–2204. [Google Scholar] [CrossRef] [Green Version]
  65. Zheng, J.; Xiao, L.; Fang, X.; Hao, Z.; Ge, Q.; Li, B. How climate change impacted the collapse of the Ming Dynasty. Clim. Chang. 2014, 127, 169–182. [Google Scholar] [CrossRef]
  66. Deng, Y.T. History of Famine Relief in China; Commercial Press: Beijing, China, 1937; pp. 21–28. [Google Scholar]
  67. Zhang, D.E.; Liang, Y.Y. A long lasting and extensive drought event over China during 1876–1878. Adv. Clim. Chang. Res. 2010, 6, 106–112. [Google Scholar] [CrossRef]
  68. Hao, Z.X.; Zheng, J.Y.; Wu, G.F.; Zhang, X.Z.; Ge, Q.S. 1876–1878 severe drought in North China: Facts, impacts and climatic background. Chin. Sci. Bull. 2010, 55, 3001–3007. [Google Scholar] [CrossRef]
  69. Allan, R.J.; Reason, C.J.C.; Lindesay, J.A.; Ansell, T.J. Protected ENSO episodes and their impacts in the Indian Ocean region. Deep-Sea Res. 2003, 50, 2331–2347. [Google Scholar] [CrossRef]
  70. Zhang, Y.; Tian, Q.H.; Guillet, S.; Stoffel, M. 500-yr precipitation variability in Southern Taihang Mountains, China and its linkages to ENSO and PDO. Clim. Chang. 2017, 144, 419–432. [Google Scholar] [CrossRef]
  71. Mantua, N.J.; Hare, S.R. The Pacific Decadal Oscillation. J. Oceanogr. 2002, 58, 35–44. [Google Scholar] [CrossRef]
  72. Ma, Z.G.; Shao, L.J. Relationship between dry/wet variation and the Pacific Decade Oscillation (PDO) in Northern China during the last 100 year. Chin. J. Atmos. Sci. 2006, 30, 464–474. [Google Scholar] [CrossRef]
  73. Hurrell, J.W.; Van, L.H. Decadal variations in climate associated with the North Atlantic Oscillation. Clim. Chang. 1997, 36, 301–326. [Google Scholar] [CrossRef]
  74. Luterbacher, J.; Schmutz, C.; Gyalistras, D.; Xoplaki, E.; Wanner, H. Reconstruction monthly NAO and EU indices back to AD 1675. Geophy. Res. Lett. 1999, 26, 2745–2748. [Google Scholar] [CrossRef] [Green Version]
  75. Gu, W.; Li, C.Y.; Li, W.J.; Zhou, W.; Johnny, C.L.C. Interdecadal unstationary relationship between NAO and east China’s summer precipitation patterns. Geophys. Res. Lett. 2009, 36, L13702. [Google Scholar] [CrossRef]
  76. Huang, W.; Chen, F.H.; Feng, S.; Cheng, J.H.; Zhang, X.J. Interannual precipitation variations in the mid-latitude Asia and their association with large-scale atmospheric circulation. Chin. Sci. Bull. 2013, 58, 3962–3968. [Google Scholar] [CrossRef] [Green Version]
  77. Li, Q.; Deng, Y.; Wang, S.J.; Gao, L.L.; Gou, X.H. A half-millennium perspective on recent drying in the eastern Chinese Loess Plateau. Catena 2022, 212, 106087. [Google Scholar] [CrossRef]
  78. Jones, P.D.; Tonsson, T.; Wheeler, D. Extension to the North Atlantic oscillation using early instrumental pressure observations from Gibraltar and South-West Iceland. Int. J. Climatol. 1997, 17, 1433–1450. [Google Scholar] [CrossRef]
  79. Li, Y.J.; Wang, S.Y.; Niu, J.J.; Fang, K.Y.; Chao, Y.Y.; Li, X.L.; Li, Y.H. Tree-ring-based reconstruction of drought variability (1792–2011) in the middle reaches of the Fen River, North China. Dendrochronologia 2016, 40, 1–11. [Google Scholar] [CrossRef]
  80. Ummenhofer, C.C.; D’Arrigo, R.D.; Anchukaitis, K.J.; Buckley, B.M.; Cook, E.R. Links between Indo-Pacific climate variability and drought in the Monsoon Asia Drought Atlas. Clim. Dyn. 2013, 40, 1319–1334. [Google Scholar] [CrossRef] [Green Version]
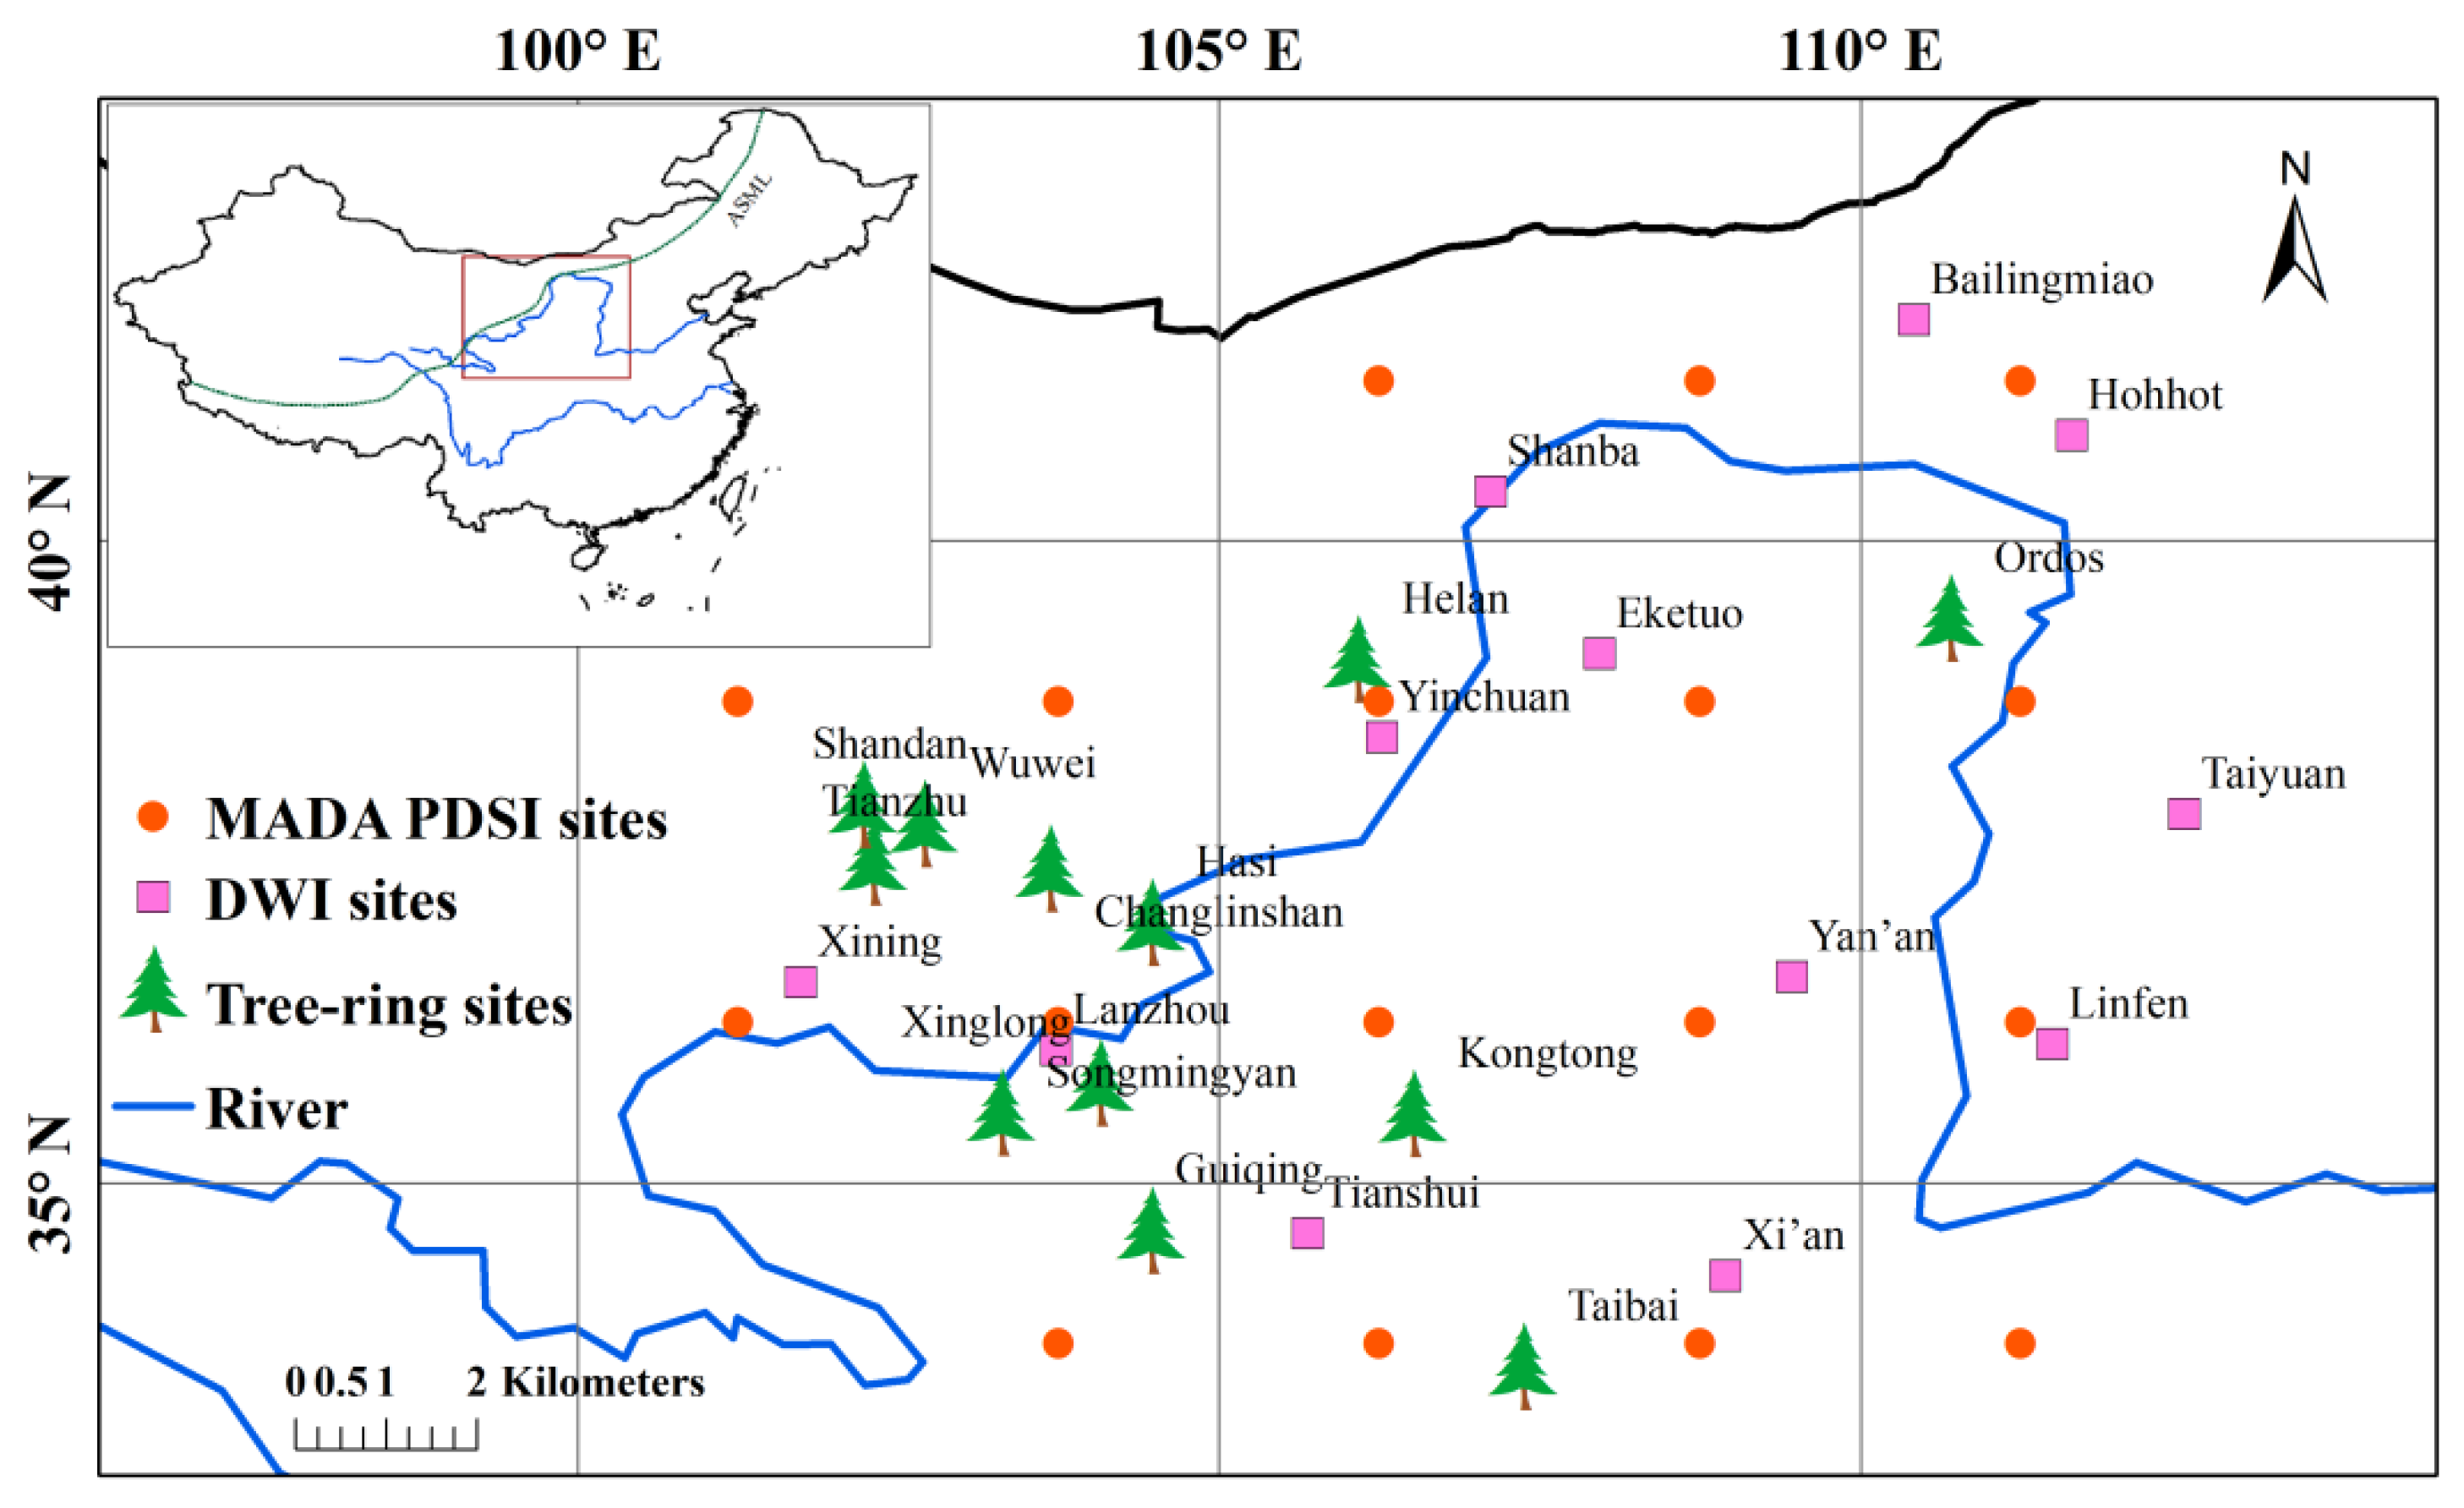
Figure 1. Locations of the 12 tree-ring sites, 12 DWI sites, and 17 MADA PDSI sites across NCC considered in this study. The abbreviation ASML (green line in the small panel) refers to the Asian summer monsoon limit [30,31].
Forests 14 00640 g001
Figure 2. The MJJAS scPDSI reconstruction for NCC region from AD 1470 to 2012. Black and red lines in (a) are the annual reconstruction and 30-year low-pass filter, respectively. Reduction of error (RE), coefficient of efficiency (CE), RMSE, and R2 statistics for each nest are shown in (b). The number of records in ((c), blue) denotes the number of sites where tree-ring chronologies and DWI series, and the number of PCs (red) denotes the number of principal components used in each nest.
Forests 14 00640 g002
Figure 3. Panel (a) shows the scPDSI reconstruction (red line) compared with instrumental MJJAS scPDSI data (black line) over the study region from AD 1950 to 2012. Panel (b) shows the spectral properties of our reconstruction, where the green, red, and blue lines represent the 90%, 95%, and 99% significance levels, respectively.
Forests 14 00640 g003
Figure 4. Comparisons of our scPDSI reconstruction (a) with the MADA PDSI reconstruction ((b), [34]), Northern China Plain precipitation variability ((c), [62]), Northern China precipitation reconstruction ((d), [63]), and NASM drought variability ((e), [20]). Bold curves indicated the application of a 30-year algorithm smoothing during their common period (AD 1470–2010). The common dry periods were shaded in grey.
Forests 14 00640 g004
Figure 5. Spatial correlations between MJJAS scPDSI reconstruction with temperature (a,b), precipitation (c,d), and the instrumental scPDSI (e,f) for the two common periods during AD 1901–2012 and 1950–2012, separately. Statistically significant correlations (p < 0.1) are shown in each panel.
Forests 14 00640 g005
Figure 6. Spatial correlation patterns of (a) our scPDSI reconstruction and (b) 10-year running mean of our scPDSI reconstruction with the concurrent SST for their common period.
Forests 14 00640 g006
Figure 7. Superposed Epoch Analysis (SEA) for the identified extremes. (a) The value of our scPDSI reconstruction, showing 5 NAO events years alongside a 5-year period before and after each NAO event. (b) Our scPDSI reconstruction value with the average of 5 NAO events years for the 10 years surrounding the NAO event. The shaded region represents the 95% significance level.
Forests 14 00640 g007
Table 1. The 12 moisture-limited tree-ring chronologies across NCC. Correlations are shown between tree-ring chronologies and averaged May–June–July–August–September scPDSI data for NCC over the period AD 1901–2012. The results of correlation with scPDSI are marked with one or two asterisks, which indicate significant correlations at the 95% and 99% confidence levels, respectively. Abbreviations are as follows: TRW—tree-ring width.
SiteLat. (°N)Long. (°E)TypePeriod
(AD)
Correlation Coefficient with scPDSIReference
Kongtong35.54106.51TRW1615–20090.377 **[35]
Guiqing34.63104.47TRW1618–20060.313 **[36]
Hasi37.03104.47TRW1698–20120.453 **[37]
Helan39.08106.08TRW1717–19990.296 **[38]
Taibai33.57107.37TRW1740–2004−0.028[39]
Tianzhu37.50102.3TRW1750–20090.197 *[40]
Shandan37.95102.22TRW1783–20060.242 *[41]
Xinglong35.78104.07TRW1794–20020.416 **[42]
Songmingyan35.55103.3TRW1804–20100.296 **[43]
Ordos39.40110.7δ18O1808–2012−0.420 **[44]
Wuwei37.80102.7TRW1856–20090.271 **[45]
Changlinshan37.45103.68TRW1860–20000.281 **[46]
* and ** denote confidence levels at 95% and 99%, respectively.
Disclaimer/Publisher’s Note: The statements, opinions and data contained in all publications are solely those of the individual author(s) and contributor(s) and not of MDPI and/or the editor(s). MDPI and/or the editor(s) disclaim responsibility for any injury to people or property resulting from any ideas, methods, instructions or products referred to in the content.