Article

Transcriptome Analysis of Pecan (Carya illinoinensis) Differentially Expressed Genes in Response to Drought Stress

1
Co-Innovation Center for Sustainable Forestry in Southern China, Nanjing Forestry University, Nanjing 210037, China
2
Collaborative Innovation Center for Efficient and Green Production of Agriculture in Mountainous Areas of Zhejiang Province, College of Horticulture Science, Zhejiang A&F University, Hangzhou 311300, China
3
State Key Laboratory of Crop Genetics and Germplasm Enhancement, Ministry of Agriculture and Rural Affairs Key Laboratory of Biology and Germplasm Enhancement of Horticultural Crops in East China, College of Horticulture, Nanjing Agricultural University, Nanjing 210095, China
*
Author to whom correspondence should be addressed.
Forests 2023, 14(3), 608; https://doi.org/10.3390/f14030608
Submission received: 1 February 2023 / Revised: 15 March 2023 / Accepted: 16 March 2023 / Published: 18 March 2023

Abstract

:
Pecan (Carya illinoinensis) is an economically important nut tree that is greatly affected by drought, limiting its production and distribution. Although the complete genome of the pecan was published several years ago, the molecular basis of the pecan’s response to drought remains unclear. In this study, we analyzed the high-throughput transcriptome data for pecans under 3, 6, 9, 12, and 15 days of drought stress compared with the controls. A total of 12,893 differentially expressed genes (DEGs) were identified under drought stress, with 11,684 of them showing significant changes after 15 d of drought treatment. Among these, 4448 genes were up-regulated while 7226 were down-regulated. The trend analysis revealed that DEGs could be classified into 20 clusters. Surprisingly, the majority of genes (6148) showed a gradual down-regulation, and 3683 genes showed a gradual up-regulation in response to drought. Gene ontology enrichment analysis showed that the DEGs were mainly enriched in biological processes. The KEGG pathway enrichment results indicated that the DEGs were mainly enriched in several pathways, including metabolic pathways, the biosynthesis of secondary metabolites, and plant hormone signal transduction processes. Among the DEGs, 457 protein kinase and 734 transcription factor genes were shown to be drought-responsive and may play key roles in the response to drought, and the expression patterns of selected candidate genes were further validated using quantitative real-time PCR. Collectively, these findings highlighted the multiple processes in pecans under drought stress and provided valuable insights into the further investigation of the functions of drought stress-responsive genes and the molecular basis of the pecan drought stress response.

1. Introduction

The world population is expected to surpass 9 billion by 2050, placing increased pressure on resources such as food, water, and fuel and adding stress to agricultural production [1]. Global warming is causing temperatures to rise, leading to severe soil desertification and declining amounts of arable land. Drought is one of the most widespread environmental stressors, inhibiting plant seed germination, growth, and development and leading to reduced yields worldwide. Plants respond to drought stress through complex processes, including the perception and recognition of stress signals, the activation of adaptive processes, and the alteration of stress-responsive gene expression patterns, which contain thousands of genes [2,3].
The activated defense systems of plants respond to drought by changing the expression levels of stress-responsive genes. The drought resistance process of plants is usually based on the expression of some stress-inducible genes, which are divided into two categories: some encode functional proteins that directly protect plants against environmental stresses, while others encode regulatory proteins, such as protein kinases and transcription factors, which regulate drought response signaling pathways in plants [4]. Many studies have focused on responses to drought stress in model plants; however, due to the limitation of technical conditions, the molecular mechanisms of the drought response in plants are not yet fully understood. Additionally, many drought-resistance-related functional genes have not yet been discovered and studied in depth.
With the rapid development of sequencing technology and reduced costs, plant science research is entering the omics era, and various omics approaches, including genomics, transcriptomics, proteomics, metabolomics, and phenomics, continue to appear in research [5,6]. Transcriptome sequencing (RNA-Seq) provides gene expression information at the RNA level, and it is also a high-throughput technique that enables the study of gene expression patterns in both model and non-model plants [7]. In recent years, transcriptome analysis has proven to be an effective tool in determining the physiological and molecular mechanisms of plants in response to drought stress and identifying key genes. For example, candidate genes that play central roles in the drought response have been identified in maize [8], soybean [9], sorghum [10], rice [11], and other plants using RNA-Seq analysis.
Pecan [Carya illinoinensis (Wangenh.) K. Koch], an economically important nut tree species of the genus Carya that is native to Mexico and the United States has been widely cultivated on six continents [12]. Pecan nuts are an excellent source of unsaturated fatty acids (UFAs), tocopherols, vitamins, starch, and phenolic compounds [13]. In 2020, the production of pecan nuts was 302 million pounds in the USA, with a value of 399 million dollars at https://www.nass.usda.gov/ (accessed on 10 December 2022). Pecan trees are highly sensitive to drought stress, especially during the reproductive period, and sustainable water management may help increase nut productivity and quality [14]. Recently, the availability of the pecan genome has allowed us to understand the molecular mechanisms of drought response pathways [15]. In this study, high-throughput transcriptome sequencing was applied to investigate the gene expression profiles of pecans under drought treatment, and candidate genes were identified through detailed analysis. The findings of this study will be useful for the development of new strategies to enhance drought tolerance in pecan, which is one of the most important nut trees in the world [16]. Additionally, this study may provide valuable insights into the molecular mechanisms of the drought stress response in other nut tree species and crops.

2. Materials and Methods

2.1. Plant Materials, Drought Treatment, and Sample Collection

Pecan seeds were harvested from trees of the genome sequencing cultivar ‘Pawnee’, which were grown in the pecan orchard in Jurong City, China (31°52′47″ N, 119°9′5″ E). The annual mean precipitation in the orchard was 1018.6 mm, and the annual mean temperature was 15.6 °C [17]. One-year-old pecan seedlings propagated from seeds were used as rootstocks, and the commercial cultivar ‘Pawnee’ was applied as the scion. Patch budding was used to obtain grafted pecan seedlings in August. The grafted seedlings were then moved to a growth chamber with a photoperiod of 14 h of light at 24 °C and 10 h of the dark at 22 °C, with a light intensity of 180 μmol m−2 s−1, and the seedlings were well watered. After 12 months, drought treatment was initiated and set at 0 days (control) of drought treatment. Leaf samples were harvested at 0, 3, 6, 9, 12, and 15 days after the start of the drought treatment. The pecan leaf samples were rapidly frozen in liquid nitrogen and stored at −70 °C for further experiments. Each leaf sample was collected from at least three grafted seedlings, and three biological repetitions were used for each time point.

2.2. Measurement of Antioxidant Enzyme Activities

The activity of peroxidase (POD) was measured with a peroxidase assay kit (A084-3, Nanjing Jiancheng Bioengineering Institute, Jiangsu, China) according to the manufacturer’s instructions. Catalase (CAT) activity was evaluated using a catalase assay kit (A007-1, Nanjing Jiancheng Bioengineering Institute, Jiangsu, China).

2.3. RNA Extraction and Quality Assessment

The total RNA was extracted from the pecan leaf samples using the TRIzol kit (Invitrogen, Carlsbad, CA, USA) following the manufacturer’s guidelines. The extracted RNA samples were then treated with RNase-free DNase I (Qiagen, Hilden, Germany) to eliminate genomic DNA contamination. The concentration of RNA was determined using a NanoDrop 2000 spectrophotometer (Thermo Scientific, Wilmington, DE, USA), and its integrity was assessed using the RNA Nano 6000 kit through the Agilent Bioanalyzer 2100 system (Agilent, Santa Clara, CA, USA).

2.4. RNA-Seq Library Construction and Sequencing

The total mRNA from the samples was enriched using oligo(dT) beads, further fragmented into short fragments, and reverse transcribed to cDNA. The cDNA libraries were sequenced by Genedenovo Biotechnology Co. Ltd. (Guangzhou, China) using the Illumina Novaseq 6000 platform.

2.5. Cleaning and Mapping of Sequenced Reads

To obtain high-quality clean reads, raw reads were filtered by FASTP (v0.20.0) software [18]. After quality control, the cleaned reads were then reference-guided and mapped to the genome of the pecan using HISAT software with default parameters [15,19]. Then, the mapped reads were assembled using StringTie (v1.3.1), and the fragments per kilobase per million of reads mapped (FPKM) value was calculated using RSEM (http://deweylab.github.io/RSEM/ (accessed on 1 February 2023)) to quantify gene expression levels [20,21].

2.6. Identification of Differentially Expressed Genes

The differentially expressed genes (DEGs) were identified using the DESeq2 package [22], where genes with a log2 (fold change) of ≤−1 or ≥1 with a false discovery rate (FDR) of less than 0.05 were considered significant. The expression patterns for these DEGs were further classified into various clusters using the Short Time-series Expression Miner (STEM) tool (http://www.cs.cmu.edu/~jernst/stem/ (accessed on 1 February 2023)) with default parameters [23].

2.7. Gene Ontology Annotation and Pathway Enrichment

Gene ontology (GO) is an international gene functional classification system that contains three categories: the biological process, cellular component, and molecular function. The GO term annotations were analyzed using the gene ontology consortium (http://geneontology.org (accessed on 1 February 2023)). The GO system was used to classify the functional annotation of the DEGs, which were based on the pecan genome and mapped onto GO terms, and the online tool omicshare (https://www.omicshare.com/ (accessed on 1 February 2023)) was applied to analyze the GO enrichment results.
Additionally, the Kyoto encyclopedia of genes and genomes (KEGG) classification was carried out (https://www.genome.jp/kegg/ (accessed on 1 February 2023)) [24]. The KEGG pathway enrichment analysis of the DEGs was performed using the KOBAS software, and the KEGG pathways with FDR < 0.05 was considered to be significantly enriched [25].

2.8. Identification of Protein Kinases and Transcription Factors

Protein kinases (PKs) and transcription factors (TFs) among the differentially expressed genes were identified and classified using the online identification and classification website ITAK (http://itak.feilab.net/cgi-bin/itak/index.cgi (accessed on 1 February 2023)) [26]. PK or TF genes with FPKM values less than 5.0 at all time points were excluded [27].

2.9. Quantitative Real-Time PCR Analysis

A quantitative real-time polymerase chain reaction (qRT-PCR) was applied to quantify the expression levels of selected candidate genes in response to drought. The reverse-transcription reactions were performed using the Prime-Script RT Reagent Kit (Takara, Dalian, China) to obtain cDNAs. qRT-PCR analysis was carried out using the TB Green Premix Ex Taq (Takara, Dalian, China) on the 7500 Real-Time PCR system (Applied Biosystems, CA, USA). An actin gene (CIL1155S0051) was used as the internal control for gene expression normalization [28]. The relative quantification of gene expression was performed using the 2−∆∆Ct method [29]. All gene-specific primers were designed using the IDT Primer Quest tool (https://sg.idtdna.com/PrimerQuest/Home/Index (accessed on 1 February 2023)) and are listed in the supplementary material (Supplementary Table S1). Melting curve analyses were used to verify the specificity of the primers (Supplementary Figure S1).

2.10. Subcellular Localization Analysis

To explore the localization of the selected genes, the coding regions of CIL1090S0050 and CIL0893S0173 were amplified by PCR, and the PCR products were cloned upstream of a green fluorescent protein (GFP) gene into the pBWA(V)HS vector, which was driven by the cauliflower mosaic virus 35S promoter. The transient expression of the fluorescent protein was assayed in tobacco using Agrobacterium GV3101. The transformation of the recombinant constructs into tobacco leaf epidermis was performed as described previously [30]. After two days of co-cultivation, the fluorescence signals were detected using a Nikon C2-ER confocal scanning microscope (Nikon, Kyoto, Japan).

2.11. Statistical Analysis

The data are expressed as the means ± SEs (standard error) from at least three independent biological replicates which were analyzed during drought treatment. Significant differences at various time points were analyzed using one-way ANOVA and Duncan’s multiple tests (p < 0.05) with IBM SPSS Statistics version 25 (SPSS Inc., Chicago, IL, USA).

3. Results

3.1. Drought Treatment of Pecan Seedlings, Illumina Sequencing and Assembly

After drought treatment, we found that the leaves of the grafted pecan seedlings were seriously wilted and curled (Figure 1A). The soil moisture content was significantly lower than that of the control and was only 17.14% after 15 days of drought treatment (Supplementary Figure S2). Plants have been found to accumulate reactive oxygen species (ROS), leading to oxidative stress under drought stress. Plants are protected against oxidative stress by antioxidant systems, including POD and CAT, which play key roles in the removal of ROS. We found a significant increase in both POD (Figure 1B) and CAT (Figure 1C) activities after drought treatment.
To investigate the changes in gene expression in pecans under drought stress, the leaf tissue samples of the grafted pecan seedlings were selected for transcriptome analysis, and a total of 18 cDNA libraries were constructed. As a result, 120.5 Gb raw sequencing data were generated, with 34,524,474 to 48,722,556 raw reads per library. After removing low-quality reads, 34,436,808 to 48,545,938 clean reads remained per library, and the percentage of clean reads in all eighteen libraries exceeded 99.6%. The quality parameters denoted high-quality sequencing results with Q30 values ranging from 99.64% to 99.77% (Supplementary Table S2).
Then, the clean reads of each sample were mapped to the pecan reference genome, and 90.80%–95.46% of clean reads from each library were matched, and the GC content ranged from 44.70% to 45.39% (Supplementary Table S2). Over 77% of the aligned sequences were located in exon regions, with intron and intergenic regions accounting for an average of 9.31% and 11.42%, respectively (Supplementary Figure S3). The above results demonstrated the reliability of the sequencing data, indicating that the data collected were suitable for further bioinformatics analysis.

3.2. Identification and Analysis of Differentially Expressed Genes under Drought in Pecan

The DEseq software package was used to screen for differentially expressed genes (DEGs) in pecans under drought stress compared with the control (0 days) with the absolute value of log2 (Fold Change) ≥ 1 and FDR < 0.05. A total of 12,893 DEGs were identified in the pecan response to drought (Supplementary Table S3). The increasing drought severity resulted in an increase of DEG numbers, with 405, 3564, 4671, 6189, and 11,684 DEGs obtained after 3, 6, 9, 12, and 15 days of drought treatment, respectively. Among the DEGs, 189/216 (3 d), 2199/1365 (6 d), 2439/2232 (9 d), 2952/3237 (12 d), and 4448/7226 (15 d) genes were increased/decreased, respectively (Figure 2A). The overlapping regions of DEGs in Figure 2B showed that 50 DEGs were up-regulated and 78 DEGs were down-regulated at all five time points, suggesting that these genes might participate in the response process of drought stress through the up-regulation or down-regulation of their expression levels.
The expression trend analysis of DEGs was also performed, and we found that these genes could be divided into 20 clusters (Supplementary Figure S4). The largest cluster, with 6148 genes, showed a gradually decreasing expression under drought stress (Group 0), while the second largest cluster, with 3683 genes, gradually increased in expression (Group 19) (Supplementary Table S4).

3.3. GO and KEGG Enrichment Analysis of DEGs

To understand the potential functions of DEGs under drought stress, we conducted a GO classification analysis to determine their GO classifications, i.e., cellular component, biological process, and molecular function (Supplementary Figure S5). The highest number of GO functional types was observed after 15 days of treatment. In the biological process category, three GO terms, metabolic process, cellular process, and single organisms, were found in more than 1000 DEGs. In the molecular function category, catalytic activity and binding were the top two functional types, which also existed in over 1000 DEGs.
To further analyze the enriched GO terms of the DEGs, we investigated the top 20 GO terms. Compared to the control, the differentially expressed genes after drought treatment were mainly enriched in various biological processes (BP), including GO:0044710, GO:0044281, GO:0006796, GO:0006793, and GO:0006796 (Supplementary Figure S6). A subset of genes was enriched in molecular functions (MF), including GO:0003824 (catalytic activity), GO:0016740 (transferase activity), and GO:0004672 (protein kinase activity), implying the presence of multiple protein kinase genes among these DEGs. After analyzing the GO enrichment results in the cellular component category, we found that three GO terms were mainly enriched, GO:0031224 (an intrinsic component of membrane), GO:0016020 (membrane), and GO:0044425 (membrane part) (Supplementary Figure S6).
To gain further insight into the pathways involved in the DEGs, we also performed a KEGG enrichment analysis of the DEGs after drought treatment. The 20 most significant pathways based on the q value were selected for enrichment analysis (Supplementary Figure S7 and Figure 3). After drought treatment, compared with the control, five pathways, including metabolic pathways, plant–pathogen interactions, the biosynthesis of secondary metabolites, the MAPK signaling pathway, and the plant hormone signal transduction process, were enriched under drought.

3.4. Analysis of Differentially Expressed Protein Kinases under Drought

Protein kinases play crucial roles in regulating plant responses to various stresses, including drought, by phosphorylating downstream target proteins and activating or inactivating them. In this study, 457 differentially expressed protein kinase genes were identified (Supplementary Table S5) and divided into different families according to the classification method described previously [31]. The 457 PK genes were further classified into 85 families, and 26 families contained only one member (Supplementary Figure S8). Interestingly, these families were divided into two main groups, receptor-like kinases (RLKs) (Supplementary Figure S8A) and non-RLKs (Supplementary Figure S8B), which contained 51 and 34 families, respectively. The RLK group contained 317 members, and three families. Including RLK-Pelle_DLSV (49), RLK-Pelle_LRR-XI-1 (31), and RLK-Pelle_RLCK-VIIa-2 (21), contained more than 20 DEGs. The non-RLK group had 140 members, and CAMK_CDPK and CMAK_CAMKL-CHK1 were the top two families in the non-RLK group, which contained 21 and 12 genes, respectively, indicating that these protein kinase families could play important roles in the pecan response to drought stress.
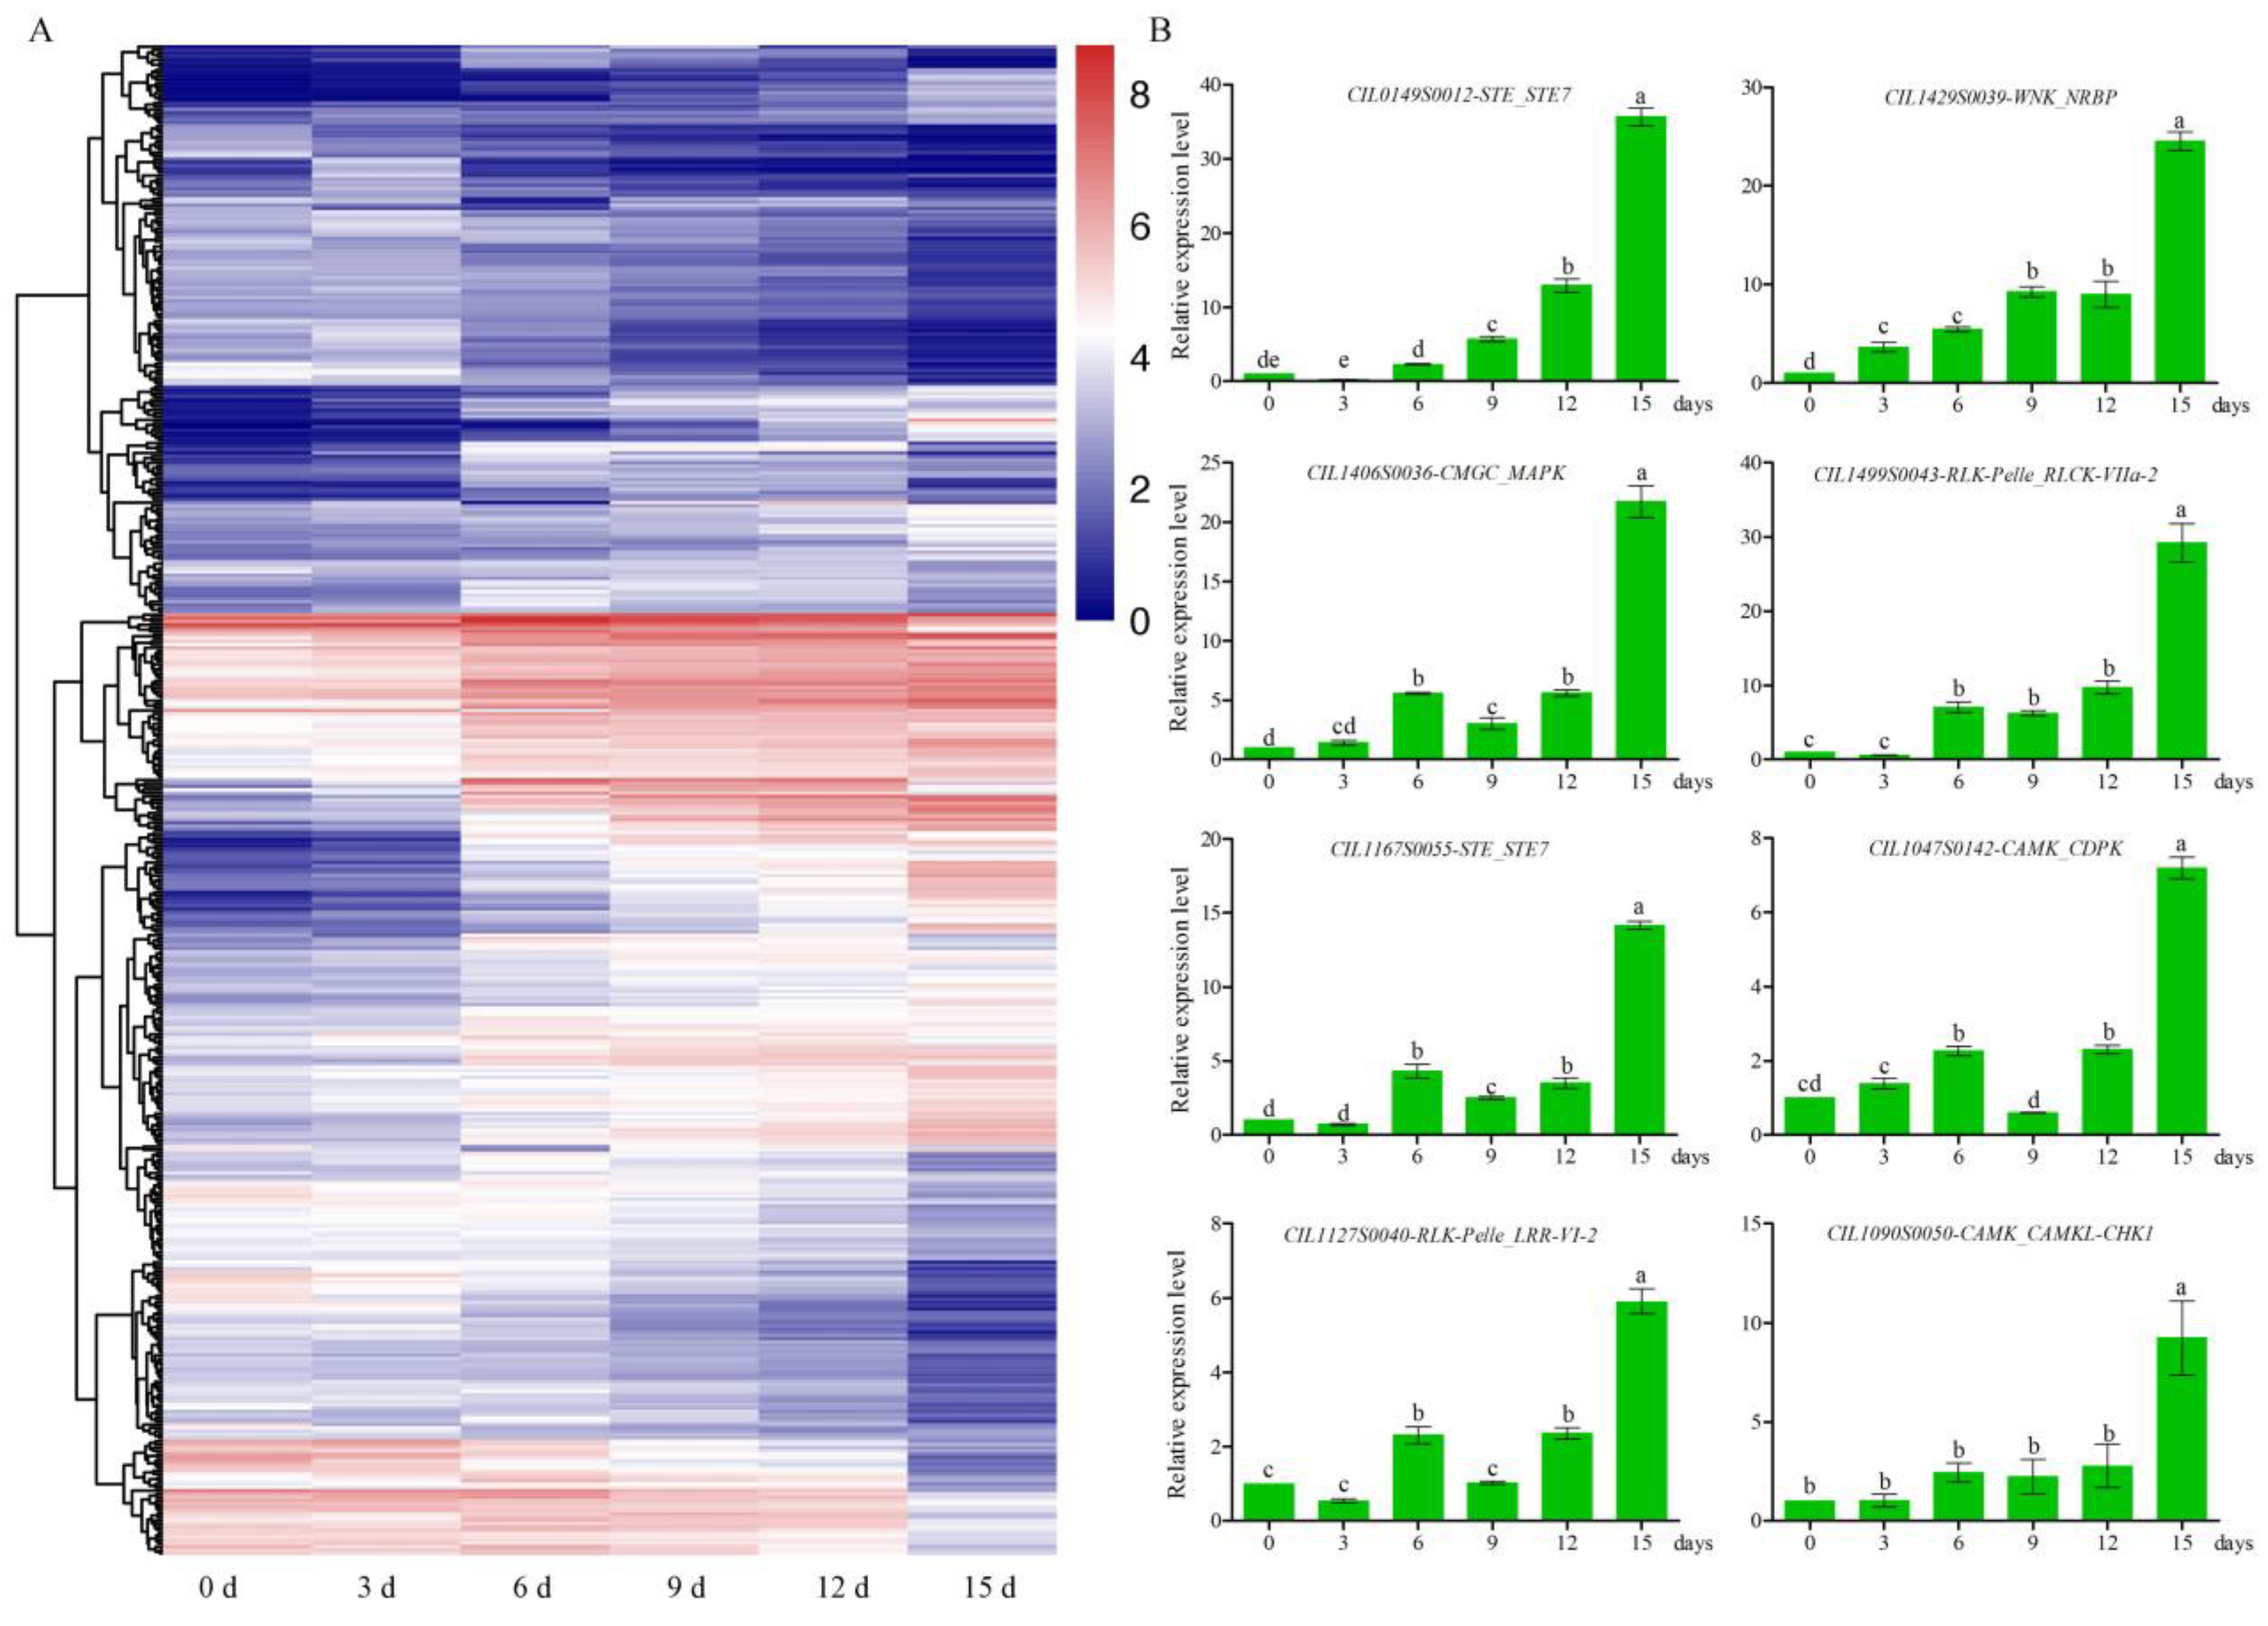
Among the differentially expressed protein kinase genes, most of them were upregulated under drought stress (Figure 4A), and members within different families exhibited various expression patterns (Supplementary Table S5). For example, the expression levels of eight genes in the CAMK_CAMKL-CHK1 family significantly increased under drought; however, the expression levels of the remaining five genes decreased. The majority of these protein kinase genes were significantly up-regulated or down-regulated after 15 days of drought treatment. To validate the RNA-Seq data, eight PK genes from different families with significantly increased expression under drought stress in pecans were selected for qRT-PCR analysis. All eight PK genes were found to be induced by drought, with their highest expression level observed after 15 d of treatment (Figure 4B), and the expression patterns of the eight PK genes were consistent with the RNA-Seq results.
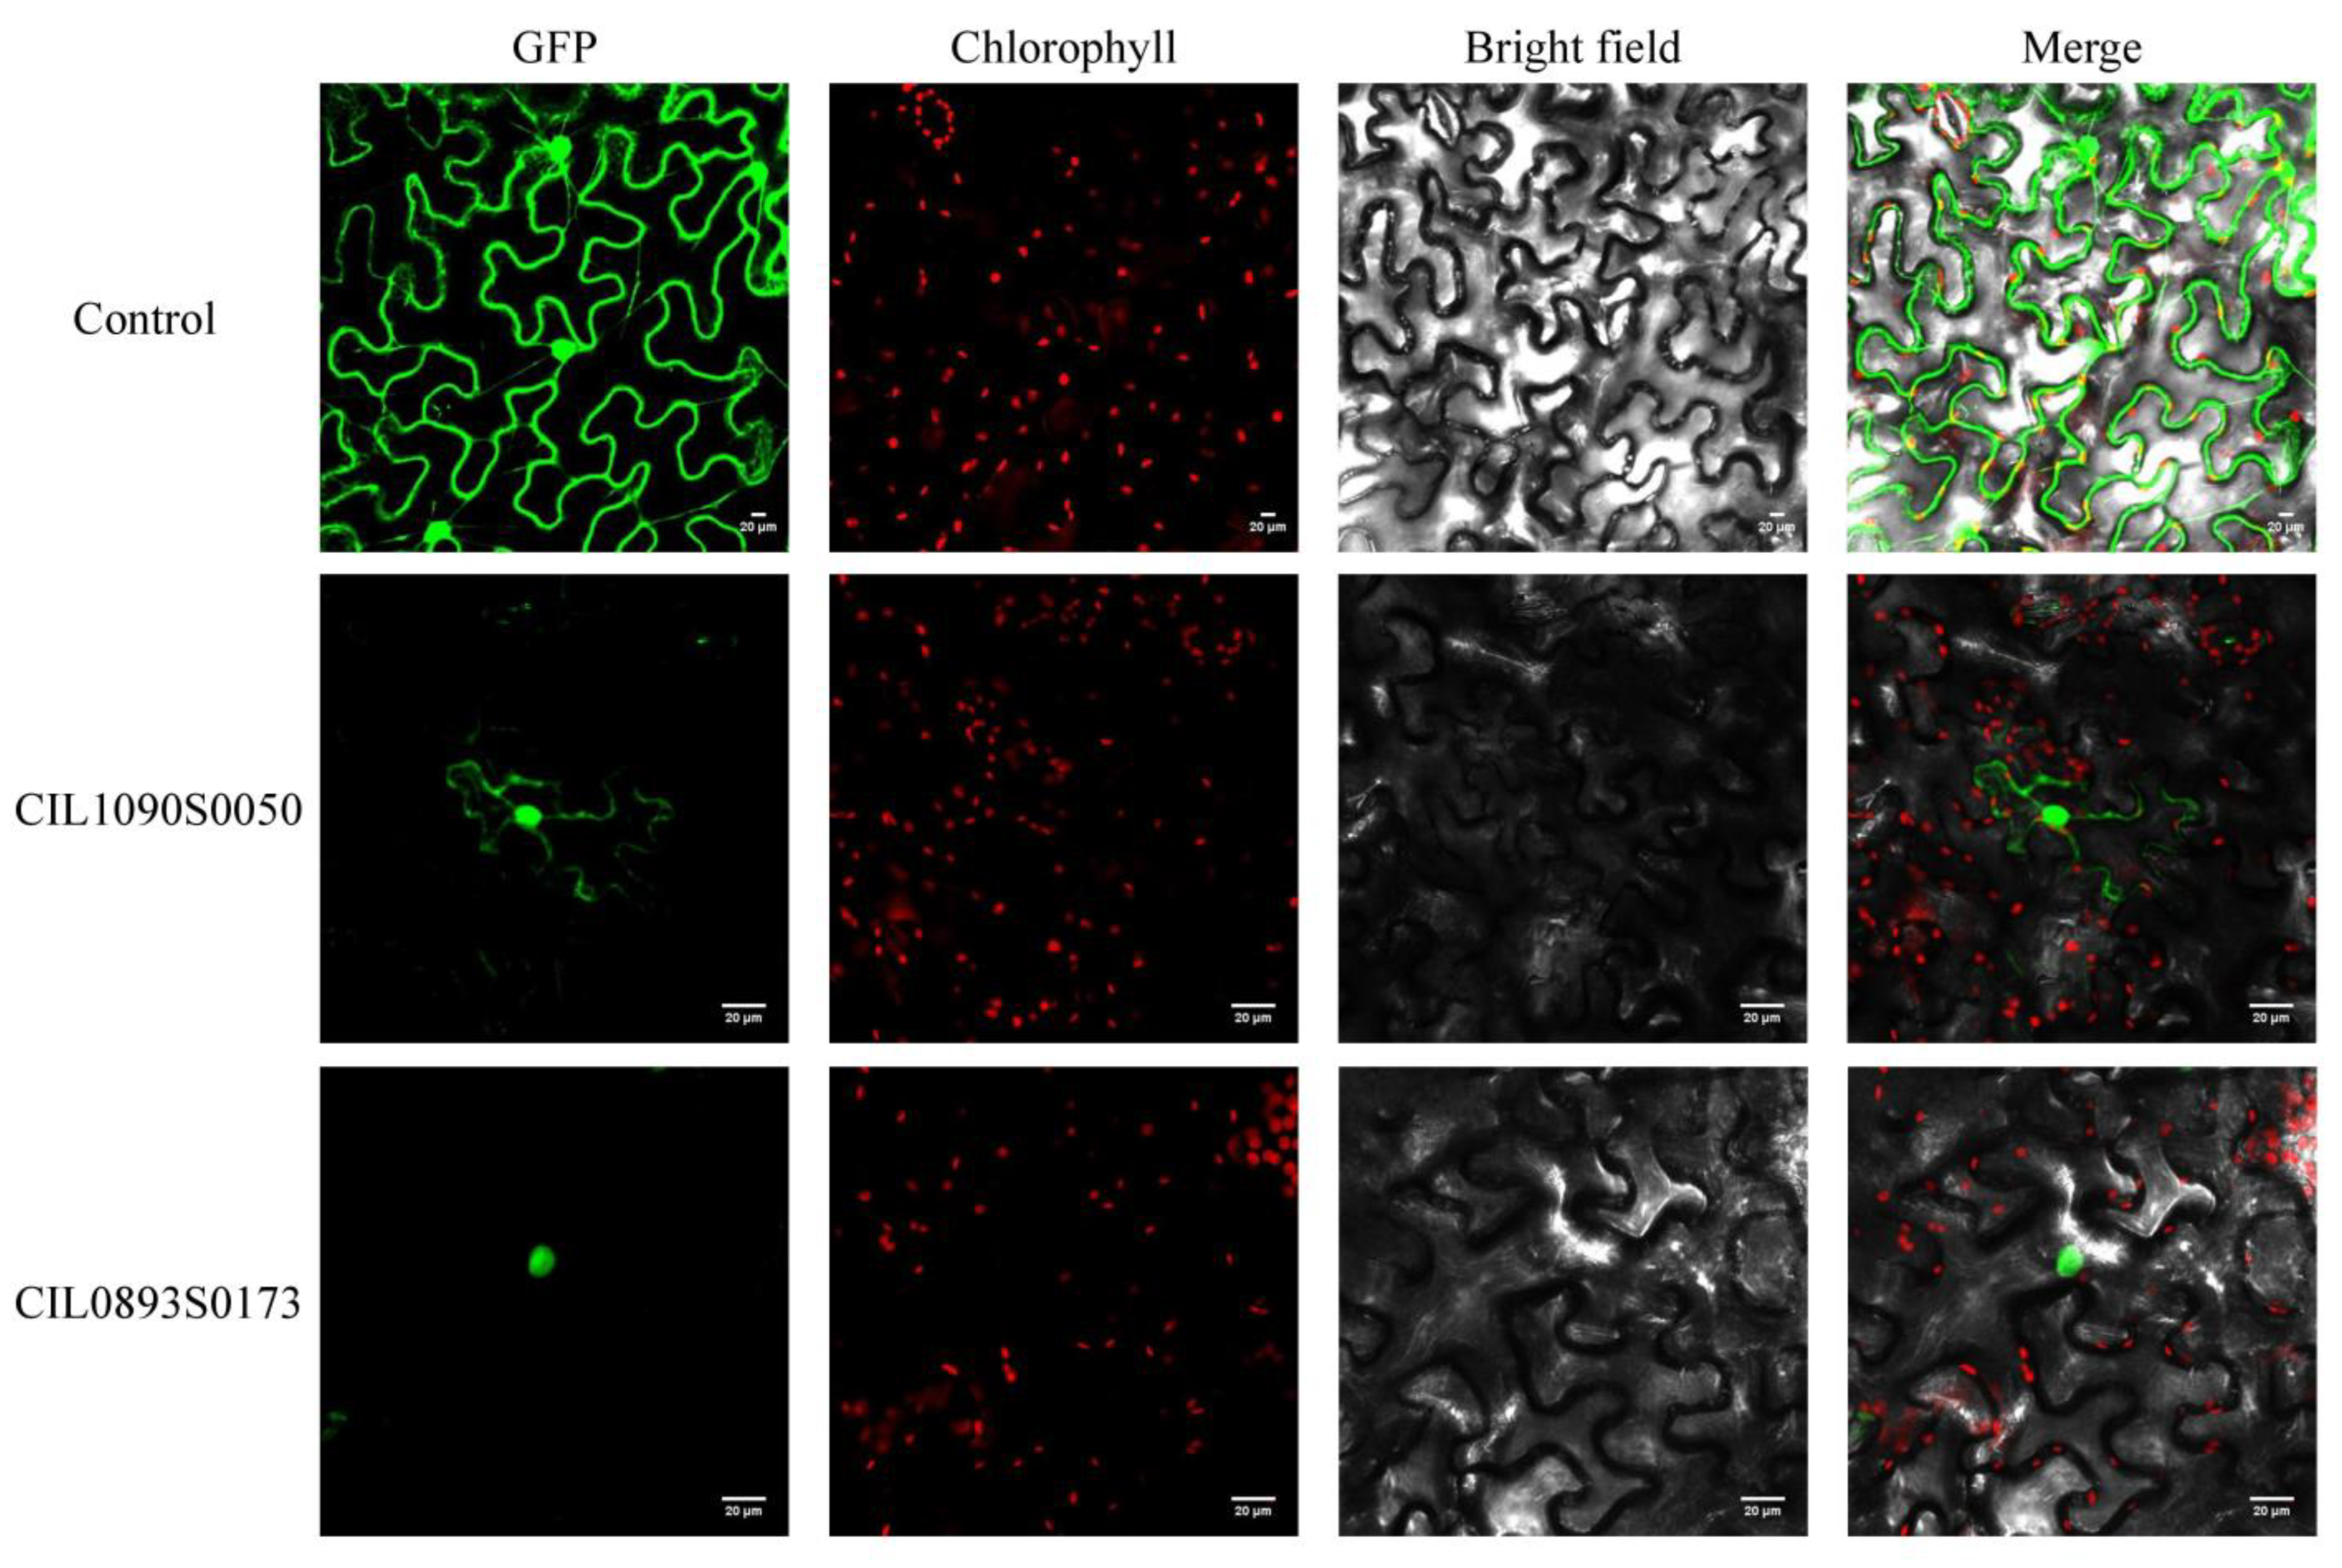
The subcellular localization of a protein can provide insights into its potential function. Based on the expression data, a CAMK_CAMKL-CHK1 gene (CIL1090S0050) was cloned and fused with the GFP (green fluorescent protein) reporter gene. The recombinant construct was transiently expressed in tobacco, and the result revealed that the CIL1090S0050-GFP fusion protein was detected in both the nucleus and cytoplasm, representing that the CIL1090S0050 protein was localized to both the nucleus and cytoplasm (Figure 5).

3.5. Differentially Expressed Transcription Factors in Response to Drought Treatment

Transcription factors (TFs) can specifically bind to the cis-acting elements of target genes to regulate gene expression levels. We identified 734 differentially expressed TF genes from the differentially expressed gene set (Supplementary Table S6), which were further classified into 60 different TF families (Supplementary Figure S9). Twelve TF families contained only one gene; however, six TF families contained more than 40 DEGs, including the MYB (62), WRKY (55), ERF (51), bHLH (47), C2H2 (47), and NAC (45) gene families, suggesting that these TF families could play important roles in the response to drought.
The expression patterns of differentially expressed TF genes were also investigated. Similar to the expression patterns of protein kinase genes, the 734 TF genes exhibited various expression patterns, with most transcription factor genes showing significant differences after 15 d of drought treatment (Figure 6A). Eight TF genes that significantly increased under drought were selected, and their expression levels were validated by qRT-PCR, and the results showed that all of them were up-regulated significantly by drought (Figure 6B). Surprisingly, four TF genes, CIL0984S0056, CIL1078S0094, CIL1444S0032, and CIL1570S0023, were induced more than 500-fold compared with the control at 15 d (Figure 6B). Since over 60 differentially expressed genes were MYB gene family members, we also investigated the subcellular localization information of an MYB gene, CIL0893S0173, by fusing it with GFP. The fluorescence signal of the CIL0893S0173-GFP fusion protein was detected only in the nucleus, indicating that it was localized in the nucleus. No fluorescence was found in the other cell compartments; by contrast, fluorescence was observed throughout the cell in the control (Figure 5).

4. Discussion

Drought is a major environmental stress that affects the geographical distribution of plants in nature [32]. It leads to a series of physiological and biochemical changes in plants, such as stomatal closure, the inhibition of cell growth and photosynthesis, the activation of respiration, and a significant reduction in crop yields, which is a threat to food security in some countries [33,34]. Understanding molecular mechanisms in plant responses to drought is essential when laying the foundation for improving drought tolerance through genetic engineering [35]. Pecan is a commercially important nut tree, and its genome sequence was released in 2019; however, little is known about the molecular mechanisms of the drought stress response in pecans [15]. In recent years, with the rapid development of high-throughput sequencing technologies and the continuous reduction in costs, RNA sequencing technology has been increasingly applied to the study of plant stress responses.

4.1. Enrichment Analysis of Differentially Expressed Genes under Drought Stress in Pecan

Several RNA-Seq databases have been built for pecans, including graft healing, seed development, and in response to salt treatment. However, few transcriptomes have been analyzed for drought response in this valuable nut tree [36,37,38]. In this study, RNA-Seq was used to analyze the changes in transcription in pecans under drought stress. Compared with the control (0 days), 189, 2199, 2439, 2952, and 4448 differentially up-regulated genes, and 216, 1365, 2232, 3237, and 7226 differentially down-regulated genes were identified after 3, 6, 9, 12, and 15 days of drought stress, respectively (Figure 2). Overall, the number of DEGs detected on the 15th day of drought treatment was much higher than on other days, indicating that many drought stress-responsive genes were significantly up-or down-regulated under high drought-stress conditions. After 3, 9, and 12 days of treatment, the numbers of differentially up-regulated and down-regulated genes were similar; however, after 6 days of drought treatment, the number of up-regulated genes was 1.6-fold greater than the number of down-regulated genes. After 15 days of treatment, there were over 2778 differentially down-regulated genes than up-regulated genes, indicating that under severe drought stress, the expression of most genes was suppressed. This phenomenon was also found in a transcriptome study of the woody resurrection plant Myrothamnus flabellifolia, in which 204 up-regulated and 547 down-regulated genes were found during the dehydration stages [3].
The GO enrichment analysis of DEGs showed that most were enriched in various biological processes, indicating that these genes could play important roles in plant drought resistance (Supplementary Figure S6). Abscisic acid (ABA) is an important plant hormone that accumulates rapidly during the plant’s response to stress and participates in physiological processes such as controlling stomatal movement and seed germination [39]. The drought stress response is usually regulated by two pathways, including ABA-dependent and ABA-independent [40]. The KEGG pathway enrichment analysis of DEGs showed that they were enriched in plant hormone signal transduction pathways at most time points, implying that plant hormones, especially ABA, play a role in the plant response to drought stress (Supplementary Figure S7). In Rhododendron pulchrum, most up-regulated plant hormone signaling pathways were observed, especially in ABA signal transduction [32]. The overexpression of a key enzyme in ABA synthesis (NCED) significantly improved drought tolerance in transgenic Arabidopsis [41]. We found that multiple protein kinases and transcription factors were involved in both pathways in response to drought, and 295 TFs and 484 PKs were reported to be involved in the response to drought stress in the woody resurrection plant Myrothamnus flabellifolia [3,13].

4.2. Protein Kinases and Transcription Factors Involved in the Pecan Drought Stress Response

Plant transcription factors and protein kinases participate in various biological processes in plants by regulating gene expression and protein activity [42,43]. In this study, 457 protein kinase genes were identified among the DEGs involved in the drought stress response (Supplementary Table S5). After dividing them into groups and families, we found that these protein kinases were mainly from the CAMK and RLK groups (Supplementary Figure S8). In the non-RLK group, the majority of CAMK group members were differentially up-regulated, especially CAMK_CAMKL-CHK1, CAMK_CDPK, and CAMK_OST1L family genes. Calcium (Ca2+), as a second messenger in organisms, serves a central role in responding to environmental stress, and members of the CAMK group were involved in plant calcium signaling [44]. CAMK_CAMKL-CHK1, also known as the CBL-interacting protein kinase (CIPK) family, is a plant-specific gene family. Many studies have shown that the plant CIPK family can be induced by different stresses, including drought, salt, and chilling [44,45]. CAMK_OST1L, also known as SnRK2, is a protein kinase family that is highly related to the ABA-dependent pathway, and its function in the plant drought stress response has been extensively studied [46]. This is a small plant-specific gene family that is activated by ABA and participates in the regulation of stress response processes, especially drought stress. SnRK2.2, SnRK2.3, and SnRK2.6 in Arabidopsis were involved in the ABA signaling pathway and play important roles in the plant responses to drought stress, growth, and breaking dormancy [47]. Grape SnRK2 gene family analysis revealed that these family members could be induced by various stresses, including drought [48]. The RLK family is one of the largest families in plants, containing hundreds of members [49]. Genetic and phenotypic studies have shown that RLK family members have different functions that are involved in plant growth and stress responses [50]. Transcriptome results under drought stress in jute showed that 19 of the 23 differentially expressed PK genes were RLK family members, most of which were down-regulated [51]. Approximately one-third of rice RLKs were regulated by drought, salt, or cold [52]. An LRR-RLK gene in rice, FON1, was induced by drought and ABA treatment, and the overexpression lines in rice exhibited stronger drought tolerance than RNAi lines [53]. Moreover, the wheat LRK10L1.2 gene functioned in plant drought resistance by closing the stomata [54]. PKs play important roles under drought stress, and the GO analysis results also showed that many DEGs were enriched in protein kinase activity (Supplementary Figure S6).
Transcription factors are involved in the regulation of gene expression and plant stress responses [55]. In this study, a total of 734 differentially expressed transcription factor genes were identified (Supplementary Table S6), which originated from various families, including MYB, WRKY, ERF, bHLH, C2H2, NAC, and other stress-responsive transcription factor families. These TF genes exhibited diverse expression patterns, implying the various roles of transcription factors in response to drought. ERF, WRKY, and NAC family members were significantly up-regulated by the drought and down-regulated after re-watering [32]. Eleven members of the plant-specific GRAS transcription factor family were differentially up-regulated, with OsGRAS23 positively regulating drought tolerance in rice by inducing a stress-responsive gene expression [56]. The families with the most differentially expressed transcription factors were MYB (62), WRKY (55), ERF (51), bHLH (47), C2H2 (47), and NAC (45), and these six transcription factor families were involved in the plant response to drought stress (Supplementary Figure S9) [57,58,59]. The transcriptome analysis of jute drought stress also revealed that the MYB, bZIP, and ERF families had the most differentially expressed members, indicating that this family may play an important role in plant drought resistance [51]. The overexpression of a grape bZIP transcription factor in Arabidopsis positively regulated osmotic stress by increasing ROS scavenging ability [60].

5. Conclusions

In this study, we analyzed the transcriptome data for pecan seedlings under different durations of drought treatment and investigated the molecular mechanisms of the pecan response to drought stress. A total of 12,893 differentially expressed genes were identified, with 11,684 genes showing the most significant differences after 15 days of drought treatment. The GO and KEGG pathway enrichment analysis of DEGs was further explored. Moreover, a total of 457 protein kinases and 734 transcription factors were identified among the DEGs, belonging to 85 PK families and 60 TF families, respectively. Overall, the transcriptome data generated in this study provide a solid foundation for future research, which is aimed at understanding the drought response mechanisms in pecan.

Supplementary Materials

The following supporting information can be downloaded at: https://www.mdpi.com/article/10.3390/f14030608/s1, Figure S1: Melt curves of 16 selected genes; Figure S2: Soil moisture content after drought treatment of pecan; Figure S3: Distribution of reads in different regions of pecan genome; Figure S4: Expression patterns of DEGs under drought stress in pecan; Figure S5: GO classification of differentially expressed genes; Figure S6: GO enrichment analysis of the DEGs in pecan under drought treatment; Figure S7: The top 20 enriched pathways under drought treatment for 3, 6, 9 and 12 d compared to that in control; Figure S8: Classification of differentially expressed protein kinase genes involved in the pecan response to drought; Figure S9: Classification of differentially expressed transcription factor genes involved in pecan response to drought; Table S1: Specific primers of selected genes for qRT-PCR analysis; Table S2: Statistics of transcriptome data from 18 libraries in pecan; Table S3: FPKM expression values of all differentially expressed genes during drought response of pecan; Table S4: Genes in clusters with different expression patterns; Table S5: Differentially expressed PK genes of pecan seedlings in response to drought; Table S6: Differentially expressed TF genes of pecan seedlings in response to drought.

Author Contributions

K.Z. and F.P. conceived this research. K.Z. wrote the manuscript. K.Z., L.W., W.M., P.F. and J.Z. performed the experiments. K.Z., X.H., P.T., G.F. and H.L. performed the data analysis. All authors have read and agreed to the published version of the manuscript.

Funding

This research was supported by the National Key Research and Development Program of China (2021YFD1000403), the China Postdoctoral Science Foundation (2020M681628), and the Postdoctoral Research Funding Program of Jiangsu Province (2020Z219).

Data Availability Statement

Raw RNA sequencing data are available on the National Center for Biotechnology Information (NCBI) Gene Expression Omnibus database with the accession number GSE179336.

Acknowledgments

We appreciate the support of GENEDENOVO Biotechnology Co., Ltd. (Guangzhou, China) for mRNA sequencing support.

Conflicts of Interest

The authors declare no conflict of interest.

References

  1. Godfray, H.C.J.; Beddington, J.R.; Crute, I.R.; Haddad, L.; Lawrence, D.; Muir, J.F.; Pretty, J.; Robinson, S.; Thomas, S.M.; Toulmin, C. Food Security: The challenge of feeding 9 billion people. Science 2010, 327, 812–818. [Google Scholar] [CrossRef] [PubMed] [Green Version]
  2. Boudsocq, M.; Laurière, C. Osmotic signaling in plants. Multiple pathways mediated by emerging kinase families. Plant Physiol. 2005, 138, 1185–1194. [Google Scholar] [CrossRef] [Green Version]
  3. Ma, C.; Wang, H.; Macnish, A.J.; Estrada-Melo, A.C.; Lin, J.; Chang, Y.; Reid, M.S.; Jiang, C.Z. Transcriptomic analysis reveals numerous diverse protein kinases and transcription factors involved in desiccation tolerance in the resurrection plant Myrothamnus Flabellifolia. Hortic. Res. 2015, 2, 15034. [Google Scholar] [CrossRef] [PubMed] [Green Version]
  4. Ding, X.; Li, X.; Xiong, L. Insight into differential responses of upland and paddy rice to drought stress by comparative expression profiling analysis. Int. J. Mol. Sci. 2013, 14, 5214–5238. [Google Scholar] [CrossRef] [Green Version]
  5. Dinakar, C.; Bartels, D. Desiccation tolerance in resurrection plants: New insights from transcriptome, proteome and metabolome analysis. Front. Plant Sci. 2013, 4, 482. [Google Scholar] [CrossRef] [Green Version]
  6. Gapper, N.E.; Giovannoni, J.J.; Watkins, C.B. Understanding development and ripening of fruit crops in an ‘Omics’ era. Hortic. Res. 2014, 1, 14034. [Google Scholar] [CrossRef] [Green Version]
  7. McGettigan, P.A. Transcriptomics in the RNA-Seq era. Curr. Opin. Chem. Biol. 2013, 17, 4–11. [Google Scholar] [CrossRef]
  8. Kakumanu, A.; Ambavaram, M.M.R.; Klumas, C.; Krishnan, A.; Batlang, U.; Myers, E.; Grene, R.; Pereira, A. Effects of drought on gene expression in maize reproductive and leaf meristem tissue revealed by RNA-Seq. Plant Physiol. 2012, 160, 846–867. [Google Scholar] [CrossRef] [PubMed] [Green Version]
  9. Chen, W.; Yao, Q.; Patil, G.B.; Agarwal, G.; Deshmukh, R.K.; Lin, L.; Wang, B.; Wang, Y.; Prince, S.J.; Song, L.; et al. Identification and comparative analysis of differential gene expression in soybean leaf tissue under drought and flooding stress revealed by RNA-Seq. Front. Plant Sci. 2016, 7, 1044. [Google Scholar] [CrossRef] [Green Version]
  10. Fracasso, A.; Trindade, L.M.; Amaducci, S. Drought stress tolerance strategies revealed by RNA-Seq in two sorghum genotypes with contrasting WUE. BMC Plant Biol. 2016, 16, 115. [Google Scholar] [CrossRef]
  11. Silveira, R.D.D.; Abreu, F.R.M.; Mamidi, S.; McClean, P.E.; Vianello, R.P.; Lanna, A.C.; Carneiro, N.P.; Brondani, C. Expression of drought tolerance genes in tropical upland rice cultivars (Oryza Sativa). Genet. Mol. Res. 2015, 14, 8181–8200. [Google Scholar] [CrossRef]
  12. Grauke, L.J.; Wood, B.W.; Harris, M.K. Crop vulnerability: Carya. HortScience 2016, 51, 653–663. [Google Scholar] [CrossRef] [Green Version]
  13. Zhu, K.; Fan, P.; Liu, H.; Zhao, J.; Tan, P.; Mo, Z.; Peng, F. Pecan kinome: Classification and expression analysis of all protein kinases in Carya illinoinensis. For. Res. 2021, 1, 14. [Google Scholar] [CrossRef]
  14. Marco, R.D.; Goldschmidt, R.J.Z.; Herter, F.G.; Martins, C.R.; Mello-Farias, P.C.; Uberti, A. The irrigation effect on nuts’ growth and yield of Carya illinoinensis. An. Acad. Bras. Ciênc 2021, 93, e20181351. [Google Scholar] [CrossRef]
  15. Huang, Y.; Xiao, L.; Zhang, Z.; Zhang, R.; Wang, Z.; Huang, C.; Huang, R.; Luan, Y.; Fan, T.; Wang, J.; et al. The genomes of pecan and Chinese hickory provide insights into Carya evolution and nut nutrition. GigaScience 2019, 8, giz036. [Google Scholar] [CrossRef] [PubMed]
  16. Zhu, K.; Fan, P.; Liu, H.; Tan, P.; Ma, W.; Mo, Z.; Zhao, J.; Chu, G.; Peng, F. Insight into the CBL and CIPK gene families in pecan (Carya illinoinensis): Identification, evolution and expression patterns in drought response. BMC Plant Biol. 2022, 22, 221. [Google Scholar] [CrossRef] [PubMed]
  17. Tang, Y.; Liu, J.; Bao, J.; Chu, G.; Peng, F. Soil type influences rhizosphere bacterial community assemblies of pecan plantations, a case study of eastern China. Forests 2022, 13, 363. [Google Scholar] [CrossRef]
  18. Chen, C.; Chen, H.; Zhang, Y.; Thomas, H.R.; Frank, M.H.; He, Y.; Xia, R. TBtools—An integrative toolkit developed for interactive analyses of big biological data. Mol. Plant 2018, 13, 1194–1202. [Google Scholar] [CrossRef]
  19. Kim, D.; Langmead, B.; Salzberg, S.L. HISAT: A fast spliced aligner with low memory requirements. Nat. Methods 2015, 12, 357–360. [Google Scholar] [CrossRef] [Green Version]
  20. Li, B.; Dewey, C.N. RSEM: Accurate transcript quantification from RNA-Seq data with or without a reference genome. BMC Bioinform. 2011, 12, 323. [Google Scholar] [CrossRef] [Green Version]
  21. Pertea, M.; Kim, D.; Pertea, G.M.; Leek, J.T.; Salzberg, S.L. Transcript-level expression analysis of RNA-Seq experiments with HISAT, StringTie and Ballgown. Nat. Protoc. 2016, 11, 1650–1667. [Google Scholar] [CrossRef]
  22. Love, M.I.; Huber, W.; Anders, S. Moderated estimation of fold change and dispersion for RNA-Seq data with DESeq2. Genome Biol. 2014, 15, 550. [Google Scholar] [CrossRef] [PubMed] [Green Version]
  23. Ernst, J.; Bar-Joseph, Z. STEM: A tool for the analysis of short time series gene expression data. BMC Bioinform. 2006, 7, 191. [Google Scholar] [CrossRef] [Green Version]
  24. Kanehisa, M.; Araki, M.; Goto, S.; Hattori, M.; Hirakawa, M.; Itoh, M.; Katayama, T.; Kawashima, S.; Okuda, S.; Tokimatsu, T.; et al. KEGG for linking genomes to life and the environment. Nucleic Acids Res. 2007, 36, D480–D484. [Google Scholar] [CrossRef]
  25. Xie, C.; Mao, X.; Huang, J.; Ding, Y.; Wu, J.; Dong, S.; Kong, L.; Gao, G.; Li, C.-Y.; Wei, L. KOBAS 2.0: A Web server for annotation and identification of enriched pathways and diseases. Nucleic Acids Res. 2011, 39, W316–W322. [Google Scholar] [CrossRef] [Green Version]
  26. Zheng, Y.; Jiao, C.; Sun, H.; Rosli, H.G.; Pombo, M.A.; Zhang, P.; Banf, M.; Dai, X.; Martin, G.B.; Giovannoni, J.J.; et al. ITAK: A program for genome-wide prediction and classification of plant transcription factors, transcriptional regulators, and protein kinases. Mol. Plant 2016, 9, 1667–1670. [Google Scholar] [CrossRef] [PubMed] [Green Version]
  27. Trapnell, C.; Williams, B.A.; Pertea, G.; Mortazavi, A.; Kwan, G.; van Baren, M.J.; Salzberg, S.L.; Wold, B.J.; Pachter, L. Transcript assembly and quantification by RNA-Seq reveals unannotated transcripts and isoform switching during cell differentiation. Nat. Biotechnol. 2010, 28, 511–515. [Google Scholar] [CrossRef] [Green Version]
  28. Zhu, K.; Fan, P.; Mo, Z.; Tan, P.; Feng, G.; Li, F.; Peng, F. Identification, expression and co-expression analysis of R2R3-MYB family genes involved in graft union formation in pecan (Carya illinoinensis). Forests 2020, 11, 917. [Google Scholar] [CrossRef]
  29. Livak, K.J.; Schmittgen, T.D. Analysis of relative gene expression data using real-time quantitative PCR and the 2−ΔΔCT method. Methods 2001, 25, 402–408. [Google Scholar] [CrossRef]
  30. Zhu, K.; Jin, Q.; Samma, M.K.; Lin, G.; Shen, W. Molecular cloning and characterization of a heme oxygenase1 gene from sunflower and its expression profiles in salinity acclimation. Mol. Biol. Rep. 2014, 41, 4109–4121. [Google Scholar] [CrossRef]
  31. Lehti-Shiu, M.D.; Shiu, S.-H. Diversity, classification and function of the plant protein kinase superfamily. Phil. Trans. R. Soc. B 2012, 367, 2619–2639. [Google Scholar] [CrossRef] [Green Version]
  32. Wang, H.; Mu, K.; Liu, C.; Guo, Y.; Deng, X. Gene expression profiling of Rhododendron pulchrum leaves under drought stress. Tree Genet. Genomes 2020, 16, 58. [Google Scholar] [CrossRef]
  33. Somerville, C.; Briscoe, J. Genetic engineering and water. Science 2001, 292, 2217. [Google Scholar] [CrossRef]
  34. Pieczynski, M.; Wyrzykowska, A.; Milanowska, K.; Boguszewska-Mankowska, D.; Zagdanska, B.; Karlowski, W.; Jarmolowski, A.; Szweykowska-Kulinska, Z. Genomewide identification of genes involved in the potato response to drought indicates functional evolutionary conservation with Arabidopsis plants. Plant Biotechnol. J. 2018, 16, 603–614. [Google Scholar] [CrossRef] [PubMed] [Green Version]
  35. Hasegawa, P.M.; Bressan, R.A.; Zhu, J.-K.; Bohnert, H.J. Plant cellular and molecular responses to high salinity. Annu. Rev. Plant Physiol. Plant Mol. Biol. 2000, 51, 463–499. [Google Scholar] [CrossRef] [PubMed] [Green Version]
  36. Mo, Z.; Feng, G.; Su, W.; Liu, Z.; Peng, F. Transcriptomic analysis provides insights into grafting union development in pecan (Carya illinoinensis). Genes 2018, 9, 71. [Google Scholar] [CrossRef] [PubMed] [Green Version]
  37. Xu, Z.; Ni, J.; Shah, F.A.; Wang, Q.; Wang, Z.; Wu, L.; Fu, S. Transcriptome analysis of pecan seeds at different developing stages and identification of key genes involved in lipid metabolism. PLoS ONE 2018, 13, e0195913. [Google Scholar] [CrossRef]
  38. Zhang, J.; Jiao, Y.; Sharma, A.; Shen, D.; Wei, B.; Hong, C.; Zheng, B.; Pan, C. Transcriptomic analysis reveals potential pathways associated with salt resistance in pecan (Carya illinoensis K. Koch). J. Biotechnol. 2021, 330, 17–26. [Google Scholar] [CrossRef]
  39. Mega, R.; Abe, F.; Kim, J.-S.; Tsuboi, Y.; Tanaka, K.; Kobayashi, H.; Sakata, Y.; Hanada, K.; Tsujimoto, H.; Kikuchi, J.; et al. Tuning water-use efficiency and drought tolerance in wheat using abscisic acid receptors. Nat. Plants 2019, 5, 153–159. [Google Scholar] [CrossRef]
  40. Yoshida, T.; Mogami, J.; Yamaguchi-Shinozaki, K. ABA-dependent and ABA-independent signaling in response to osmotic stress in plants. Curr. Opin. Plant Biol. 2014, 21, 133–139. [Google Scholar] [CrossRef]
  41. Iuchi, S.; Kobayashi, M.; Taji, T.; Naramoto, M.; Seki, M.; Kato, T.; Tabata, S.; Kakubari, Y.; Yamaguchi-Shinozaki, K.; Shinozaki, K. Regulation of drought tolerance by gene manipulation of 9-cis-epoxycarotenoid dioxygenase, a key enzyme in abscisic acid biosynthesis in Arabidopsis: Regulation of drought tolerance by AtNCED3. Plant J. 2001, 27, 325–333. [Google Scholar] [CrossRef] [Green Version]
  42. Hrmova, M.; Hussain, S.S. Plant transcription factors involved in drought and associated stresses. Int. J. Mol. Sci. 2021, 22, 5662. [Google Scholar] [CrossRef] [PubMed]
  43. Chen, X.; Ding, Y.; Yang, Y.; Song, C.; Wang, B.; Yang, S.; Guo, Y.; Gong, Z. Protein kinases in plant responses to drought, salt, and cold stress. J. Integr. Plant Biol. 2021, 63, 53–78. [Google Scholar] [CrossRef] [PubMed]
  44. Zhu, K.; Chen, F.; Liu, J.; Chen, X.; Hewezi, T.; Cheng, Z.-M. Evolution of an intron-poor cluster of the CIPK gene family and expression in response to drought stress in soybean. Sci. Rep. 2016, 6, 28225. [Google Scholar] [CrossRef] [PubMed] [Green Version]
  45. Hrabak, E.M.; Chan, C.W.M.; Gribskov, M.; Harper, J.F.; Choi, J.H.; Halford, N.; Kudla, J.; Luan, S.; Nimmo, H.G.; Sussman, M.R.; et al. The Arabidopsis CDPK-SnRK superfamily of protein kinases. Plant Physiol. 2003, 132, 666–680. [Google Scholar] [CrossRef] [Green Version]
  46. Zhu, J.-K. Abiotic stress signaling and responses in plants. Cell 2016, 167, 313–324. [Google Scholar] [CrossRef] [Green Version]
  47. Fujii, H.; Zhu, J.-K. Arabidopsis mutant deficient in 3 abscisic acid-activated protein kinases reveals critical roles in growth, reproduction, and stress. Proc. Natl. Acad. Sci. USA 2009, 106, 8380–8385. [Google Scholar] [CrossRef] [Green Version]
  48. Liu, J.-Y.; Chen, N.-N.; Cheng, Z.-M.; Xiong, J.-S. Genome-wide identification, annotation and expression profile analysis of SnRK2 gene family in grapevine. Aust. J. Grape Wine Res. 2016, 22, 478–488. [Google Scholar] [CrossRef]
  49. Dievart, A.; Gottin, C.; Périn, C.; Ranwez, V.; Chantret, N. Origin and diversity of plant receptor-like kinases. Annu. Rev. Plant Biol. 2020, 71, 131–156. [Google Scholar] [CrossRef] [Green Version]
  50. Fischer, I.; Diévart, A.; Droc, G.; Dufayard, J.-F.; Chantret, N. Evolutionary dynamics of the Leucine-Rich repeat receptor-like kinase (LRR-RLK) subfamily in angiosperms. Plant Physiol. 2016, 170, 1595–1610. [Google Scholar] [CrossRef] [Green Version]
  51. Yang, Z.; Dai, Z.; Lu, R.; Wu, B.; Tang, Q.; Xu, Y.; Cheng, C.; Su, J. Transcriptome analysis of two species of Jute in response to polyethylene glycol (PEG)- induced drought stress. Sci. Rep. 2017, 7, 16565. [Google Scholar] [CrossRef] [Green Version]
  52. Gao, L.-L.; Xue, H.-W. Global analysis of expression profiles of rice receptor-like kinase genes. Mol. Plant 2012, 5, 143–153. [Google Scholar] [CrossRef] [Green Version]
  53. Ye, Y.; Ding, Y.; Jiang, Q.; Wang, F.; Sun, J.; Zhu, C. The role of Receptor-like protein kinases (RLKs) in abiotic stress response in plants. Plant Cell Rep. 2017, 36, 235–242. [Google Scholar] [CrossRef] [PubMed]
  54. Lim, C.W.; Yang, S.H.; Shin, K.H.; Lee, S.C.; Kim, S.H. The AtLRK10L1.2, Arabidopsis Ortholog of Wheat LRK10, is involved in ABA-mediated signaling and drought resistance. Plant Cell Rep. 2015, 34, 447–455. [Google Scholar] [CrossRef]
  55. Singh, D.; Laxmi, A. Transcriptional regulation of drought response: A tortuous network of transcriptional factors. Front. Plant. Sci. 2015, 6, 895. [Google Scholar] [CrossRef] [Green Version]
  56. Xu, K.; Chen, S.; Li, T.; Ma, X.; Liang, X.; Ding, X.; Liu, H.; Luo, L. OsGRAS23, a rice GRAS transcription factor gene, is involved in drought stress response through regulating expression of stress-responsive genes. BMC Plant Biol. 2015, 15, 141. [Google Scholar] [CrossRef] [PubMed] [Green Version]
  57. Golldack, D.; Lüking, I.; Yang, O. Plant tolerance to drought and salinity: Stress regulating transcription factors and their functional significance in the cellular transcriptional network. Plant Cell Rep. 2011, 30, 1383–1391. [Google Scholar] [CrossRef] [PubMed]
  58. Mizoi, J.; Shinozaki, K.; Yamaguchi-Shinozaki, K. AP2/ERF family transcription factors in plant abiotic stress responses. Biochim. Biophys. Acta 2012, 1819, 86–96. [Google Scholar] [CrossRef]
  59. Baldoni, E.; Genga, A.; Cominelli, E. Plant MYB transcription factors: Their role in drought response mechanisms. Int. J. Mol. Sci. 2015, 16, 15811–15851. [Google Scholar] [CrossRef] [Green Version]
  60. Liu, J.; Chu, J.; Ma, C.; Jiang, Y.; Ma, Y.; Xiong, J.; Cheng, Z.-M. Overexpression of an ABA-Dependent grapevine bZIP transcription factor, VvABF2, enhances osmotic stress in Arabidopsis. Plant Cell Rep. 2019, 38, 587–596. [Google Scholar] [CrossRef]
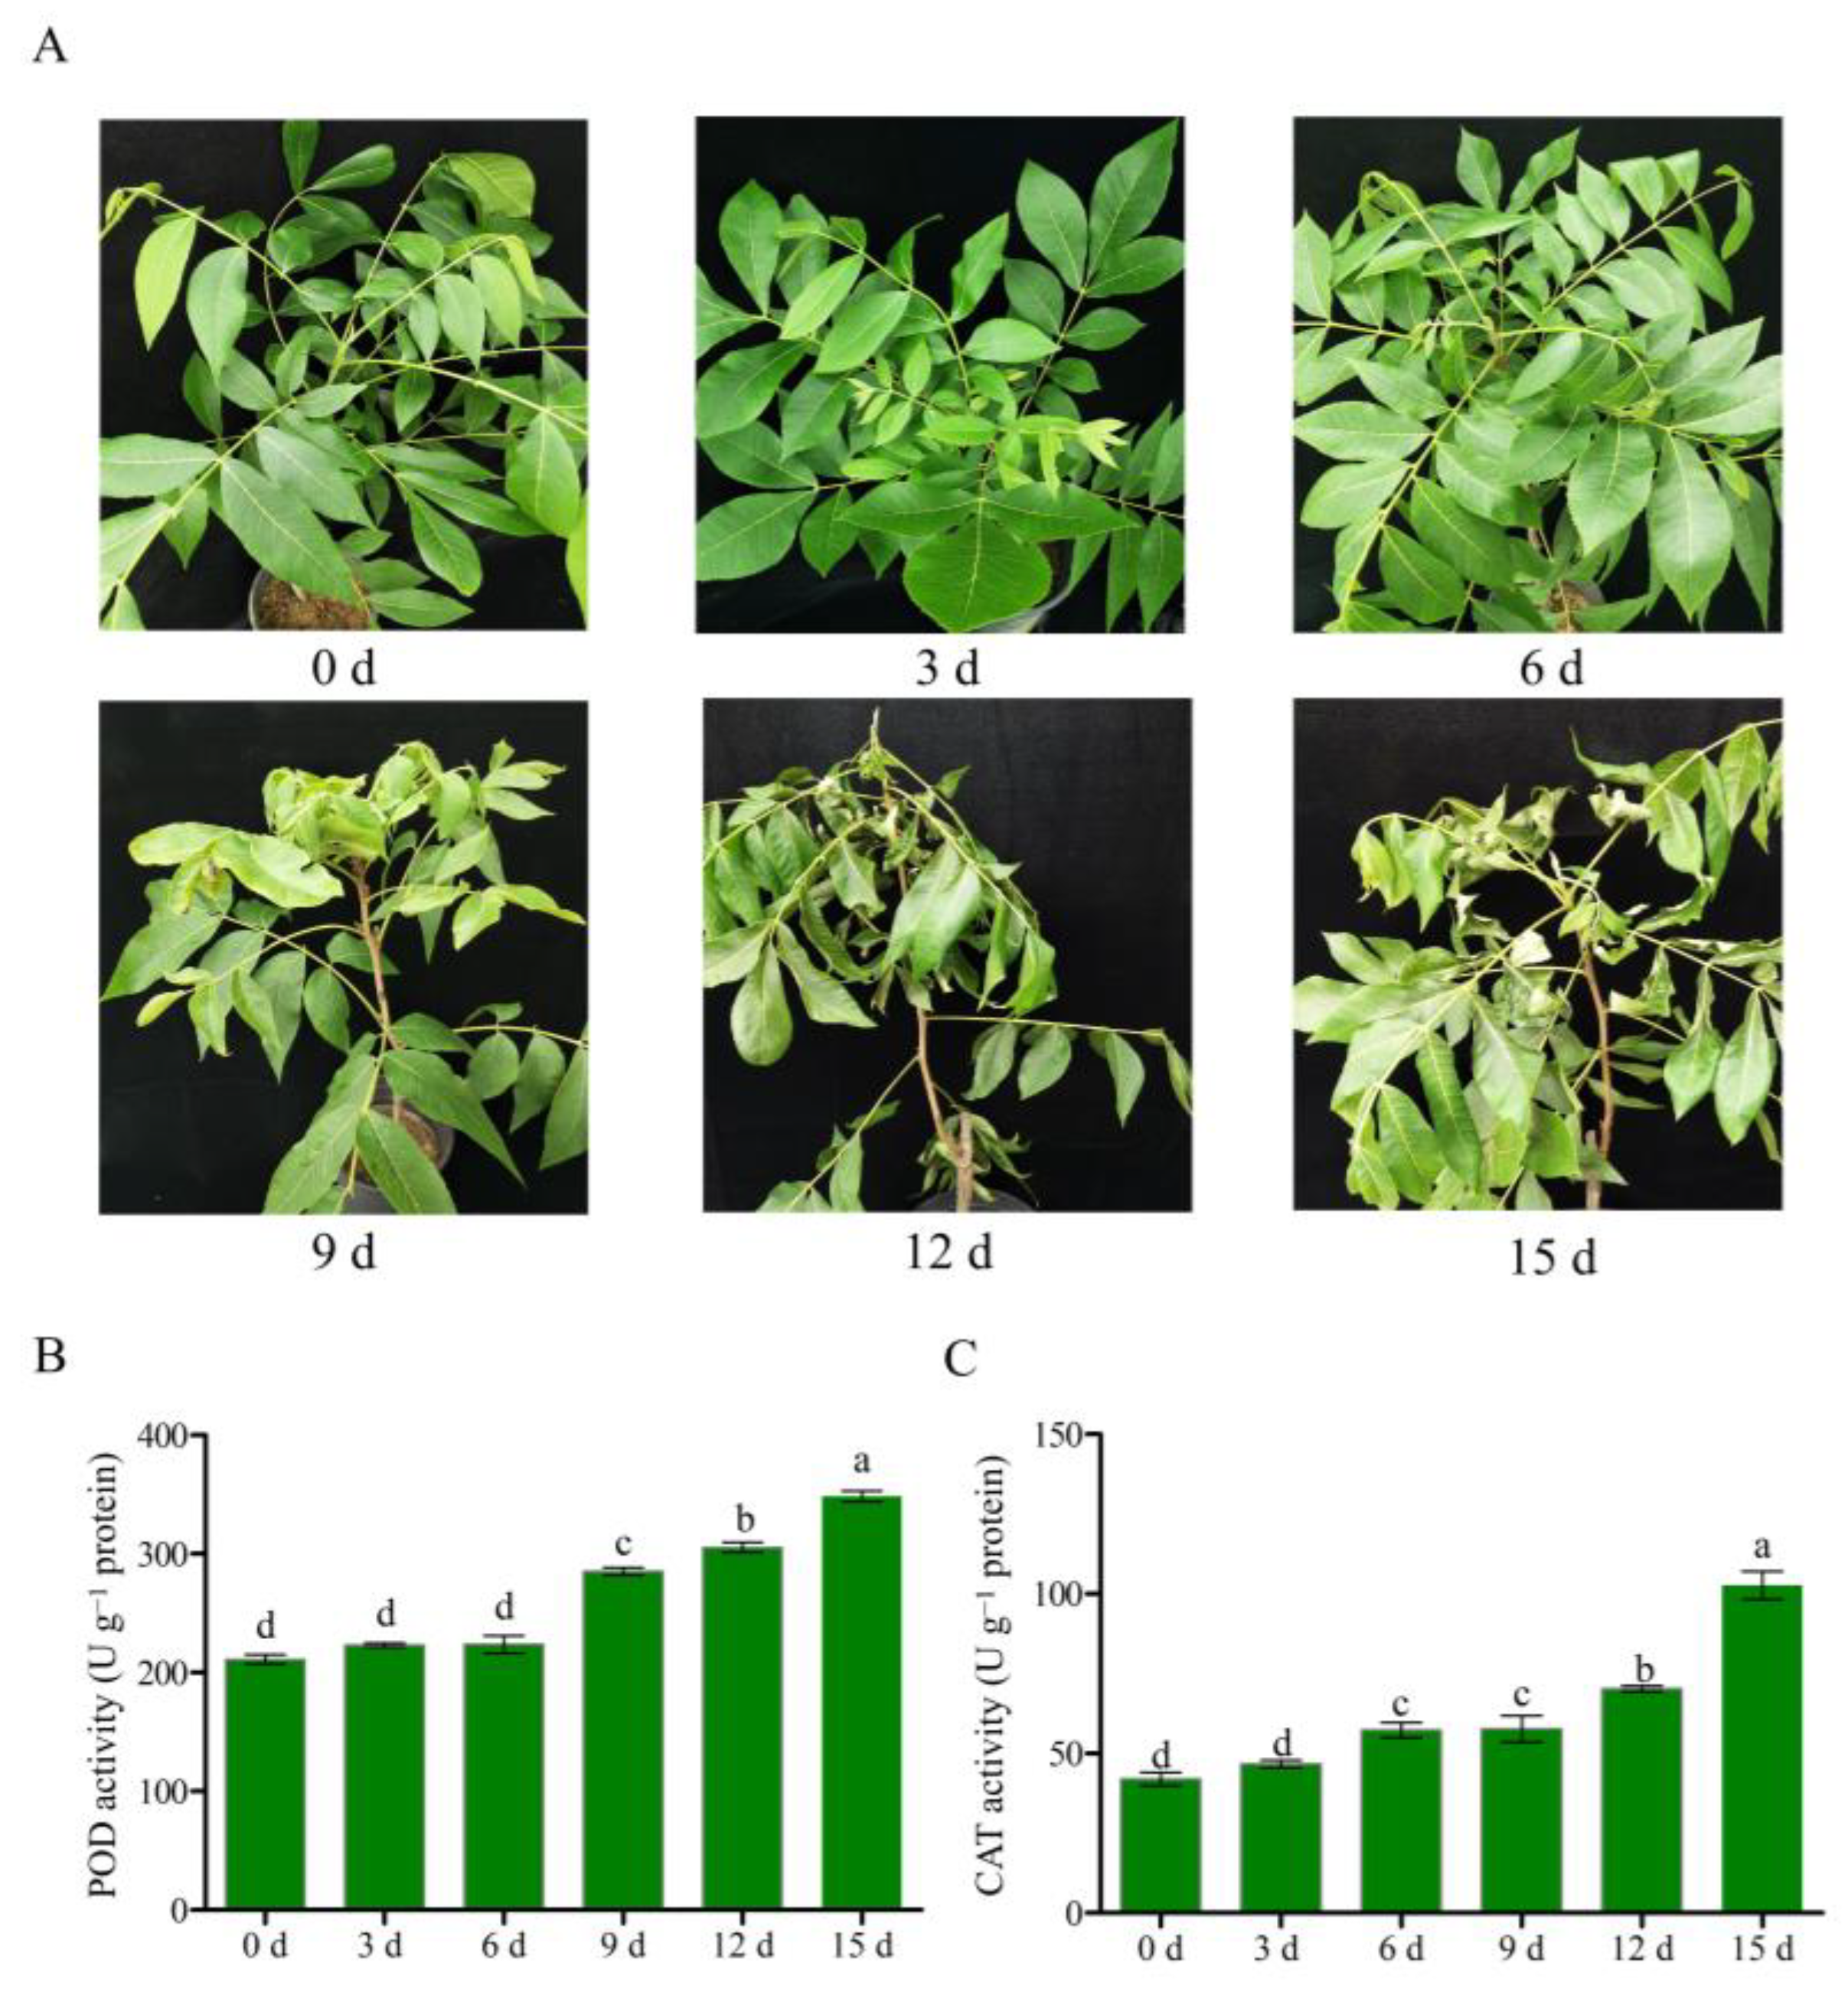
Figure 1. Drought treatment affected the growth of pecan seedlings and the activities of antioxidant enzymes. (A) The phenotype of pecan seedlings under drought stress. POD (B) and CAT (C) activities in pecan seedlings in response to drought. Lowercase letters represent significant differences (p < 0.05) according to Duncan’s multiple range test. Error bars indicate the means ± SEs obtained from three biological replicates.
Forests 14 00608 g001
Figure 2. Statistical results of DEGs in pecan seedlings under drought stress. (A) The numbers of DEGs in the transcriptome sequencing data of pecan seedlings under drought treatment. The red bar indicates up-regulated DEGs, and the green bar indicates down-regulated DEGs. (B) Venn diagram displaying the numbers of overlapping genes at different timepoints.
Forests 14 00608 g002
Figure 3. The top 20 enriched pathways under drought treatment for 15 d compared to that at 0 d. Rich factor represents the ratio of the number of DEGs in the pathway.
Forests 14 00608 g003
Figure 4. Analysis of the expression of drought-responsive differentially expressed PK genes under drought stress. (A) Heatmap for the clustering analyses of differentially expressed PK genes was built based on log2 (FPKM+1) values. The bar on the right indicates the scale of gene expression levels. (B) The validation of the expression levels of selected PK genes in pecans using the qRT-PCR approach. The actin gene was selected as the internal control. Letters represent significant differences according to Duncan’s test (p < 0.05). Error bars indicate the means ± SEs from three biological replicates.
Forests 14 00608 g004
Figure 5. Subcellular localization of two selected genes by the transient expression of a fused fluorescent protein. Control, GFP alone. Bar = 20 μm.
Forests 14 00608 g005
Figure 6. Expression analysis of differentially expressed TF genes under drought stress. (A) The heatmap for the clustering analyses of differentially expressed TFs was built based on log2 (FPKM+1) values, with the bar indicating the scale of gene expression levels. (B) Validation of the selected TF genes in pecans using the qRT-PCR approach. The actin gene was selected as the internal control. Letters represented significant differences according to Duncan’s test (p < 0.05). Error bars indicated the means ± SEs obtained from three biological replicates.
Forests 14 00608 g006
Disclaimer/Publisher’s Note: The statements, opinions and data contained in all publications are solely those of the individual author(s) and contributor(s) and not of MDPI and/or the editor(s). MDPI and/or the editor(s) disclaim responsibility for any injury to people or property resulting from any ideas, methods, instructions or products referred to in the content.