Article

Genome-Wide Identification and Expression Analysis of the HSF Gene Family in Poplar

1
College of Forestry, Shanxi Agricultural University, Jinzhong 030801, China
2
College of Forestry, Inner Mongolia Agricultural University, Hohhot 010018, China
*
Author to whom correspondence should be addressed.
Forests 2023, 14(3), 510; https://doi.org/10.3390/f14030510
Submission received: 11 February 2023 / Revised: 28 February 2023 / Accepted: 2 March 2023 / Published: 4 March 2023
(This article belongs to the Section Genetics and Molecular Biology)

Abstract

:
The Heat Shock Factor (HSF) transcription factor family plays crucial roles in plant growth and development, as well as in protecting against adverse stresses. However, studies on the functions and regulatory mechanisms of the HSF genes are limited in poplar. Here, we identified and classified 30 HSF transcription factors in Populus trichocarpa based on recent genomic data and annotation information and conducted a comprehensive analysis of these proteins, including phylogenetic and physicochemical properties analysis, domain characterization, subcellular localization prediction, cis-acting elements analysis, sequence structure analysis, and chromosomal distribution. Our analysis revealed that segmental duplication events may be the main driving force behind the expansion of the poplar HSF gene family, and we explored the collinearity between poplar HSF genes and those of six other representative species. We also analyzed the tissue-specific and hormonal responses of the HSF genes in poplar and conducted gene co-expression network analysis, which revealed important molecular functions and biological processes related to growth and development, biotic and abiotic stress response, and epigenetic modification. These results provide significant insights into the functions and regulatory mechanisms of the HSF genes in poplar.

1. Introduction

Plants, due to their own sessility, are highly susceptible to stress during the process of growth and development. During long-term adaptation, plants have evolved complex regulatory mechanisms to cope with unfavorable growth conditions, establishing a systematic network of stress regulation and response at the biochemical, physiological, and molecular levels [1,2]. The gene regulatory networks centered on the transcription factors play key roles in multiple important biological processes [3,4]. Among these transcription factors, the HSF family proteins widely participate in plant growth and development, as well as in stress responses.
The HSF transcription factor family is a conserved gene family widely distributed among eukaryotes and prokaryotes [5]. The first HSF protein was cloned and characterized in yeast [6] and the first plant HSF protein was subsequently identified in tomato [7]. These transcription factors were originally defined as transcriptional regulators of HSPs, but a growing number of research has shown that they also participate in many important biological processes [8]. HSF family analysis in Arabidopsis and rice had been completed as early as 2008, with member identification, phylogenetic analysis, protein classification, and expression analysis [9]. As plant genomic information continues to be deciphered and improved, the identification and analysis of the HSF family genes has been performed in more than 30 plant species. Most studies in plants focused on the expression patterns of the HSF family genes during growth and development or under abiotic stresses [10]. In addition, several researchers have revealed the structure, function, and evolution of plant HSF gene family members [11,12]. HSF proteins contain a highly conserved DNA binding domain (DBD) at their N-terminus, composed of a three helical bundle and a four stranded antiparallel ß-sheet, which plays a key role in the precise recognition of, and interaction with, heat stress elements (HSEs, 5′-AGAAnnTTCT-3′) [11]. The oligomerization domain (OD or HR-A/B region), which is linked with the DBD by a stretch of 15–80 amino acids, contains a heptad repeat pattern of hydrophobic amino acid residues and is responsible for the protein-protein interactions during transcriptional activation and is also involved in the nuclear import and export [13]. In the previous study, plant HSF proteins were classified into three groups (A, B, and C) according to the insertion between the HR-A and HR-B regions [11], in which 21 and 7 amino acid residues are inserted between the HR-A and HR-B of the class A and C proteins, respectively [11]. However, similarly to non-plant HSF proteins, there is no amino acid residue insertion between the HR-A and HR-B of the class B proteins [11]. In angiosperms, HSF proteins are further divided into 16 subfamilies (A1-A9, B1-B5, and C1-C2) [8]. Short activator peptide motifs (AHA motifs) located at the C-terminus of the class A HSF proteins mediate their transcriptional activation function, whereas the C-terminus of most class B proteins contains a highly conserved tetrapeptide repression domain (LFGV) [11]. Most HSF members have nuclear localization signals (NLS) and nuclear export signals (NES) at the C-terminal, which play a role in the assembly of the nuclear import complex and the receptor-mediated export complex [13].
In contrast to yeast and Drosophila, which have only one HSF, and vertebrates, which have only three HSFs, the plant HSF family is characterized by high complexity [14]. For example, 21, 25, 52, and 30 HSF proteins have been identified in Arabidopsis, rice, soybean, and maize, respectively [11]. The expansion of the plant HSF family during evolution has been enabled by gene and whole-genome duplications [15]. It has been shown that class B HSF proteins that lack the typical AHA activation domain are the most ancient and face stronger purifying selection pressure during subsequent evolution [8]. During plant evolution, the ancestral function of HSFs was maintained by strong purifying pressure acting on the DNA binding domain, whereas the variable oligomerization domain and motif organization of HSFs underwent functional divergence and gave rise to new subfamilies [8]. Large scale analyses of the HSF transcription factors in plants have identified a larger number of HSF genes in higher plants than in lower plants, and the loss of HSF family genes has been accompanied by whole-genome duplication or whole-genome triplication events during plant evolution [12].
The HSF transcription factors play essential roles during plant growth and development [15]. Arabidopsis hsfa1a/b/d/e quadruple mutant plants are severely stunted, indicating that the HSFA1 gene is required for their normal development [16]. AtHSFA4c is involved in plant root development, and mutating this gene leads to a reduced number of lateral roots in Arabidopsis [17]. HSFB1 represses the genes associated with plant growth, regulating the resource allocation between defense and growth [18]. HSFB2a and HsfB2b are involved in Arabidopsis gametophytic and hypocotyl development, respectively [19,20]. Furthermore, the HSF genes can also respond to biotic and abiotic stresses. The overexpression of HSFA1b in Arabidopsis can enhance its resistance to Pseudomonas bacteria [21]. AtHSFB1 can sense metabolic changes in response to pathogen invasion and plays a key role in the growth-defense transition [18]. OsHsfB4d positively regulates OsHsp18.0-CI expression to enhance rice resistance to Xanthomonas oryzae [22]. The overexpression of HsfA2 in Arabidopsis thaliana increases its tolerance to combined environmental stress, whereas the knockout of this gene decreases the basal and acquired heat tolerance and tolerance to oxidative stress in plants [23]. ZmHsf08 is induced by salt, drought, and abscisic acid treatment, and the overexpression of this gene in maize enhances the plant sensitivity to salt and drought stresses [24]. The overexpression of TrHSFB2a in Arabidopsis reduces the plant tolerance to heat, salt, and drought [25].
Poplar is widely used in greening, afforestation, and production with fast growth, strong adaptability, and excellent material. The genome of Populus trichocarpa was sequenced in 2006 and was the first woody plant to be sequenced [26]. Moreover, P. trichocarpa, with its well-established and efficient genetic transformation and regeneration system, has been a model tree species for the study of gene functions and regulatory mechanisms in woody plants. At present, studies on poplar HSF proteins are few and have focused on the abiotic stress responses. For example, PuHSFA4a improves poplar’s tolerance to excess zinc by regulating ROS production and root development [27]. PeHSF can bind to the promoter of PeWRKY1 to enhance the salt stress tolerance in Populus euphratica [28]. PeHSFA2 can strongly increase the plant heat tolerance by regulating the transcription of the heat shock response genes [29]. Here, we performed a systematic and comprehensive analysis of the poplar HSF family based on the recent genomic database information, including family member identification and classification, phylogenetic analysis, protein characterization, cis-acting element analysis, sequence structure analysis, chromosomal location, gene duplication events analysis, colinearity analysis, and gene expression pattern analysis. In addition, we constructed the gene co-expression networks centered on 30 poplar HSF genes and dissected the molecular functions and biological processes by gene set enrichment analysis. These studies can lay a foundation for analyzing the function of poplar HSF genes and exploring their regulatory mechanism.

2. Materials and Methods

The analysis methods used in this study are summarized in Figure 1.

2.1. Identification and Phylogenetic Analysis of Poplar HSF Family Members

To identify the poplar HSF family members, poplar protein sequences were retrieved using the HSF conserved domain. The amino acid sequences of all the poplar proteins were gained from the Phytozome database (P. trichocarpa v4.1, accession date: 5 December 2022) [26,30]. HSF_DNA-bind (PF00447) was downloaded from the Pfam database (accession date: 5 December 2022) [31]. The candidate proteins were obtained by using hmmsearch (http://www.hmmer.org/, accessed on 5 December 2022) and HSF_DNA-bind to search against the entire poplar protein sequences with a threshold of E-value < 1 × 10⁻⁵. The Pfam and SMART databases (accession date: 5 December 2022) were used for further validation to identify the HSF family members in poplar [31,32].
To explore the taxonomic and phylogenetic relationships among the HSF proteins in poplar, a ML-phylogenetic tree was constructed. The information of Arabidopsis HSF family members refer to previous studies [11]. Amino acid sequences of Arabidopsis and poplar HSF proteins were obtained from the Phytozome database (accession date: 14 December 2022) [26,30,33]. A phylogenetic tree was constructed using TBtools (accession date: 26 February 2023) with the maximum likelihood method and 1000 bootstrap tests [34]. The tree was redrawn and labeled using iTOL v6 (accession date: 26 February 2023) [35]. The HSF proteins were classified according to previous studies [11].

2.2. Protein Characteristics, Cis-Acting Elements and Sequence Structure Analysis

To comprehensively reveal the characteristics of the HSF family members in poplar, the conserved domains, conserved motifs, physicochemical properties, subcellular localization, gene structure, and cis-acting element distribution were analyzed or predicted. The sequences of the conserved domains of the HSF proteins were aligned and visualized using ClustalX 1.83 and WebLogo (accession date: 18 December 2022), respectively [36,37]. The sequence of the oligomerization domain was visualized by BioEdit (accession date: 19 December 2022) [38]. The physicochemical properties of the proteins were predicted using ProtParam (accession date: 20 December 2022) [39]. Using WoLF PSORT (accession date: 2 January 2023) to predict the subcellular localization of the proteins [40].
The genome sequences, coding sequences, and promoter sequences (2000 bp up-stream of the transcription start site) of the poplar HSF genes were extracted from the Phytozome database (accession date: 8 December 2022) [26,30]. The Gene Structure Display Server (accession date: 20 December 2022) was used to visualize the intron/exon structure [41]. The cis-acting elements present in the promoters were analyzed using the PlantCARE database (accession date: 23 December 2022) [42]. MEME (accession date: 28 December 2022) was used to identify the conserved motifs present in the poplar HSF proteins [43], and the results were visualized using TBtools (accession date: 28 December 2022) [34]. The SMART and Pfam databases (accession date: 3 January 2023) were used to annotate the identified motifs [31,32].

2.3. Chromosomal Location and Collinearity Analysis

To explore the reasons for the expansion and selection pressure of the poplar HSF gene family during evolution, the intergenic collinearity was analyzed. Poplar genome annotation files were downloaded from the Phytozome database (accession date: 5 December 2022) [26,30]. TBtools (accession date: 22 December 2022) was used to extract the location information of the genes and to visualize their distribution [34]. The tandem duplication events between the poplar HSF genes were identified using TBtools with MCScanX (accession date: 22 December 2022) [34,44]. TBtools, MCScanX, and BLASTP (accession date: 23 December 2022) were used to analyze the segmental duplication events and collinearity of genes among different species [34,44]. The non-synonymous and synonymous ratios (Ka/Ks) between gene pairs were obtained by use of TBtools (accession date: 4 January 2023) [34].

2.4. Gene Expression Analysis

The life activity processes of plants are often accompanied by the transcriptional regulation of genes. By analyzing the expression patterns of genes, the biological processes in which they may be involved can be explored. The expression data of the poplar HSF genes were downloaded from the Phytozome database (accession date: 23 December 2022) [26,30], including the gene expression in the pre-dormanting bud, early dormanting bud, late dormanting bud, swelling bud, fully open bud, immature leaf, young leaf, the first fully expanded leaf, internode, node, and root tip (SRA accession number: SRX4364819-SRX4364828, SRX4341732-SRX4341736, SRX3181590-SRX3181621, SRX2770567-SRX2770569). In addition, we also collected the gene expression data in response to abscisic acid (10 µM ABA, 3 h), ethylene (10 µM ACC, 3 h), cytokinin (5 µM BAP, 3 h), brassinolide (0.1 µM BL, 3 h), gibberellin (5 µM GA3, 3 h), methyl jasmonate (10 µM meJA, 3 h), auxin (5 µM NAA, 3 h), salicylic acid (100 µM SA, 3 h), and strigolactone (5 µM SL, 3 h) treatments in leaves (SRA accession number: SRX3962958-SRX3962997). All of the above transcriptome data were sequenced using the Illumina HiSeq 2500 platform, and the sequencing depth was basically more than tenfold using the paired-end method. The filtered clean data were aligned to the reference genome (P. trichocarpa v4.1) and the expression levels of the genes were normalized using the FPKM values. TBtools (accession date: 23 January 2023) was used to draw the heatmaps to visualize the gene expression [34].

2.5. Transcriptome Sequencing Analysis

In order to explore the expression of the HSF genes in different tissues during the early growth and development stages of poplar and to analyze their possible roles in the differentiation and formation of plant organs, we performed transcriptome sequencing (RNA-Seq) experiments using poplar tissue culture seedlings. Poplar tissue culture seedlings, grown in the greenhouse (average temperature 25 °C, 16 h light/8 h dark) for one month, were removed from the medium, and the buds, leaves, stems, and roots were immediately collected and frozen in liquid nitrogen. The samples were then sent to Metware Biotechnology Co., Ltd. (Wuhan, China) for cDNA library construction and sequencing. The sequencing method was paired-end 150 bp and the sequencing depth was greater than 15-fold. Three biological replicates were performed, and samples from each biological replicate were harvested from 15 poplar tissue culture seedlings. The expression levels of the genes were normalized using the FPKM values.

2.6. Gene Co-Expression Network Construction and Gene Ontology Enrichment Analyses

In order to reveal the potential biological functions of, and the biological processes involved in, the poplar HSF genes, gene co-expression and functional enrichment analysis were performed. The gene co-expression information was downloaded from the Phytozome database (accession date: 23 December 2022) [26,30]. The genes that were co-expressed with poplar HSF genes were screened, and the gene co-expression networks were visualized using Cytoscape (accession date: 1 January 2023) [45]. Gene set GO enrichment analysis was performed using TBtools (accession date: 1 January 2023) with the default parameters [34].

3. Results

3.1. Identification and Phylogenetic Analysis of Poplar HSF Family Members

By searching all of the poplar protein sequences using HMMER analysis (E-value < 1 × 10⁻⁵) [46], we identified a total of 30 poplar HSF family members. These proteins were subsequently submitted to the Pfam and SMART databases for further validation [31,32]. The results proved that all of the proteins contained highly conserved HSF domains, which were consistent with the structural characteristics of HSF family members. According to the naming rules of HSF proteins in previous studies [11], the identified poplar HSF family members were named PtrHsfA1aPtrHsfC1 (Table S1).
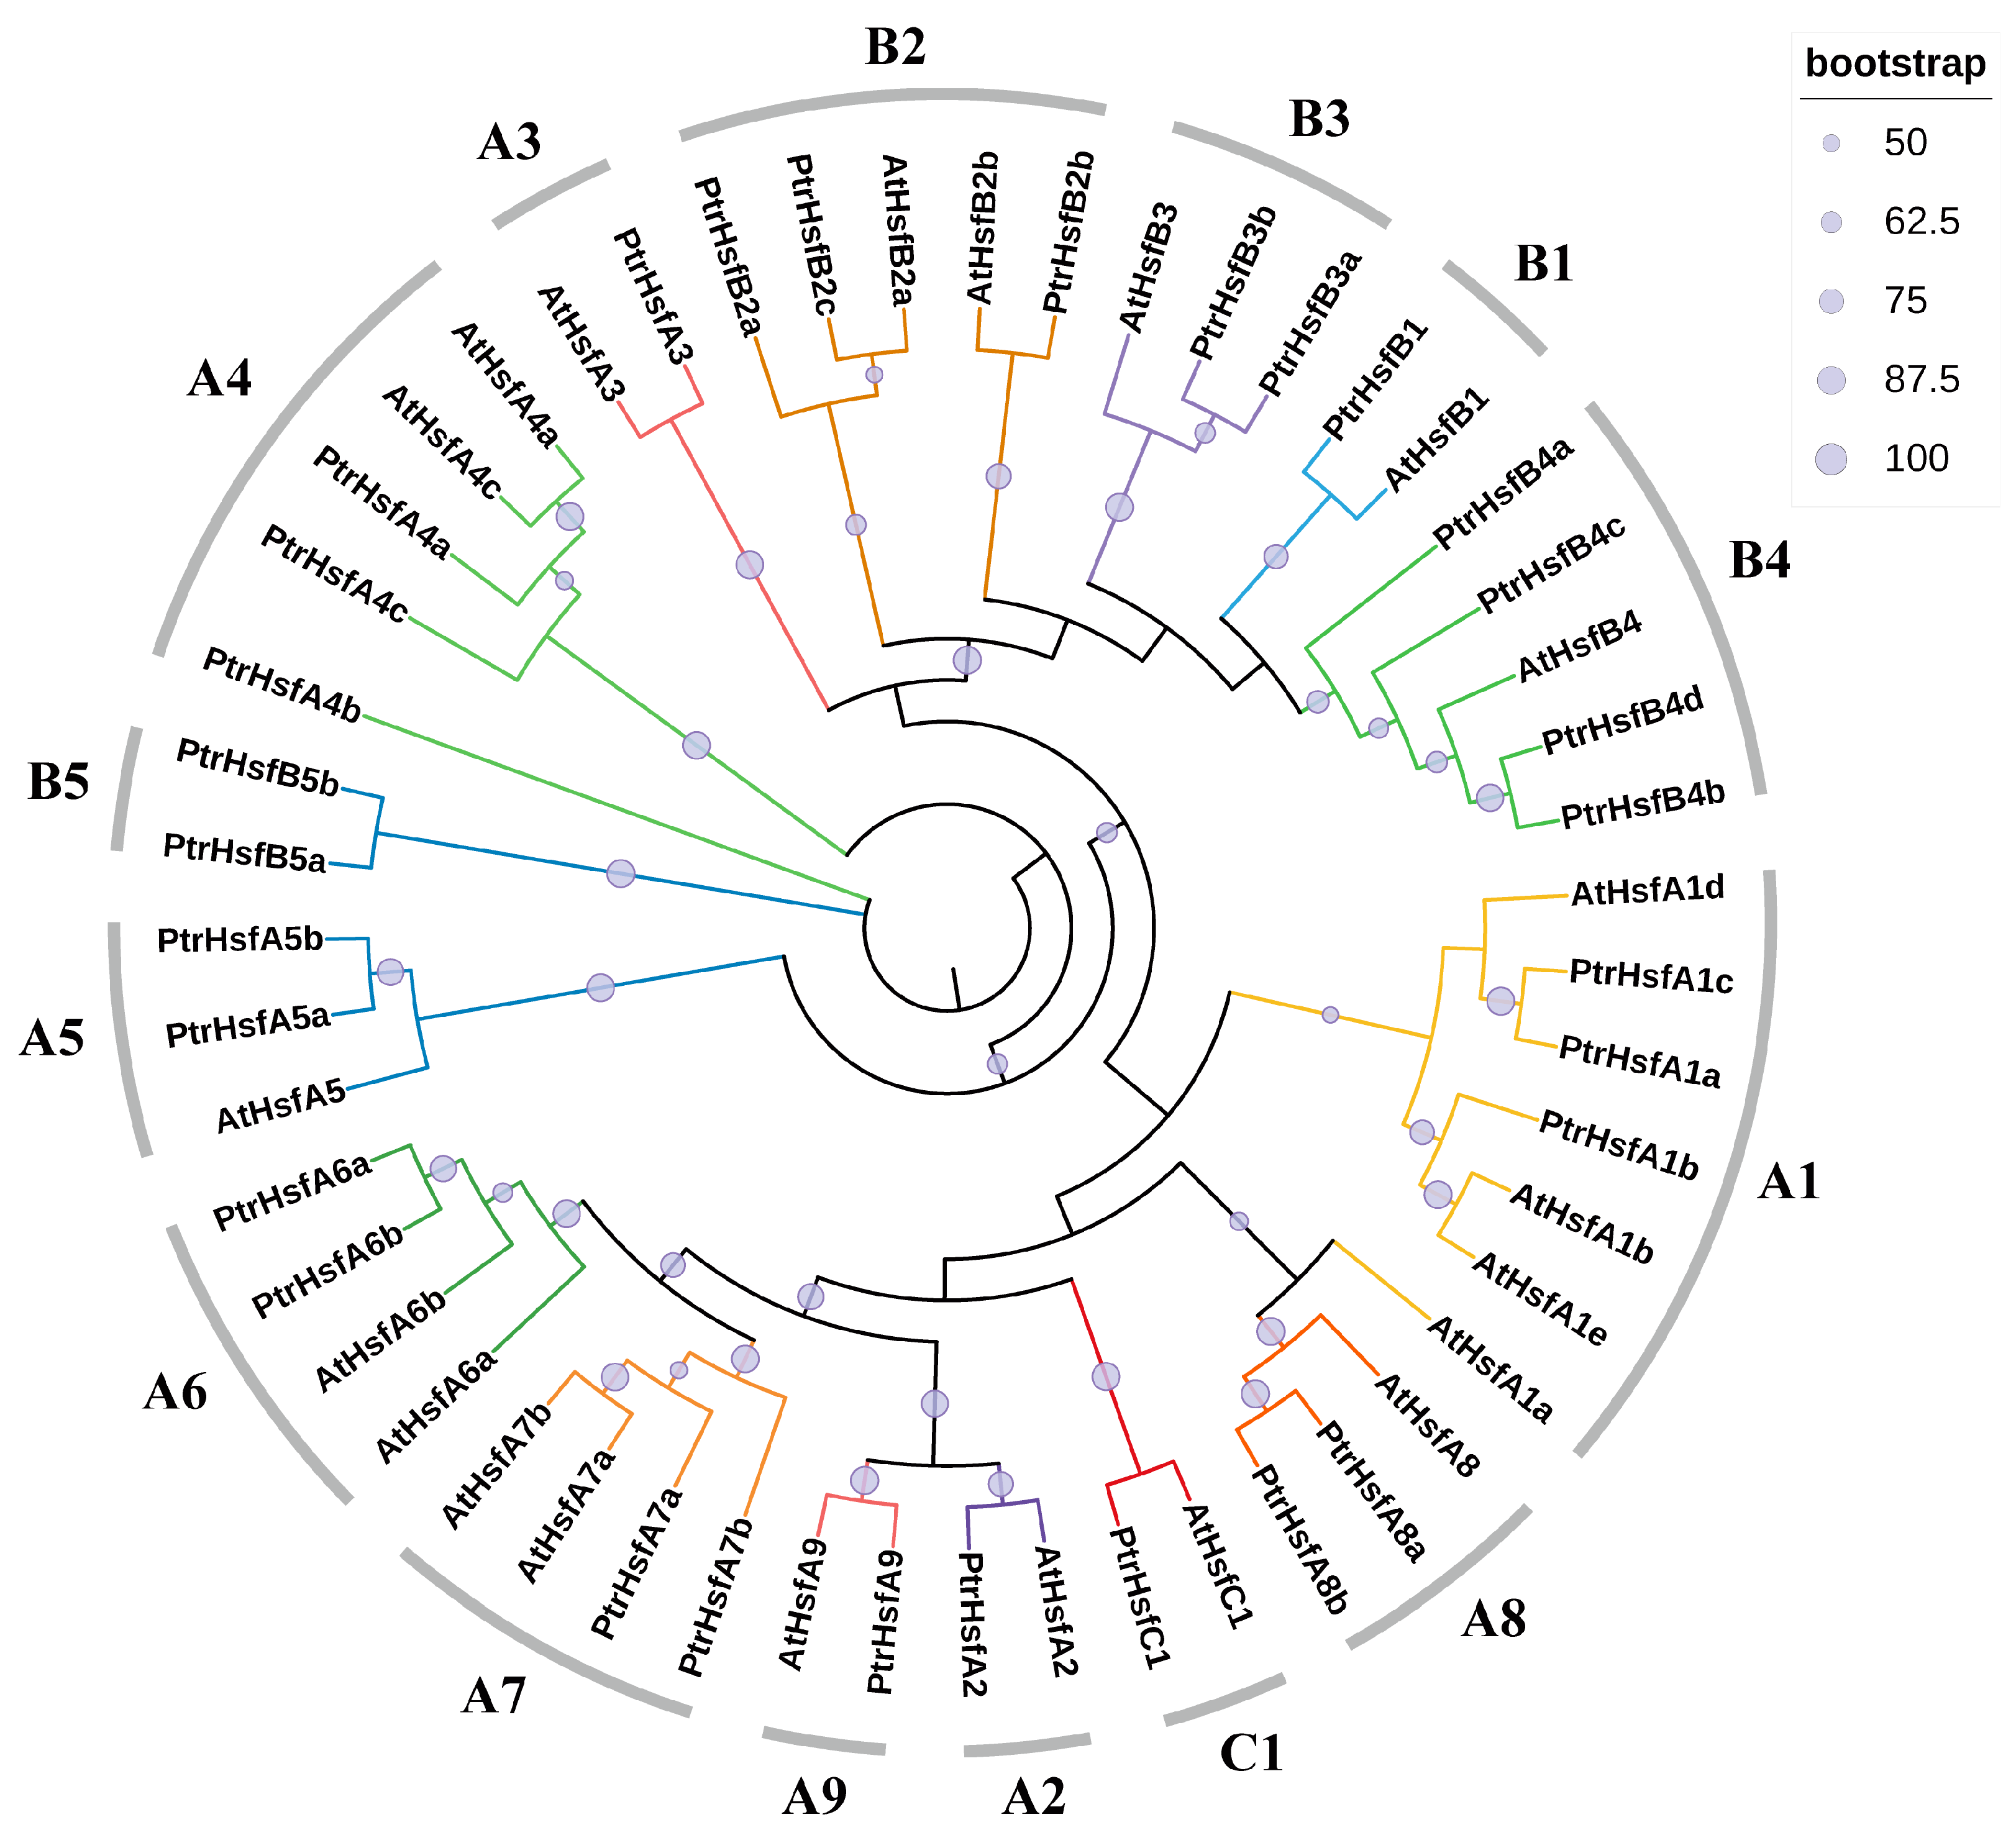
To further confirm the accuracy of the naming for the poplar HSF family members and to clarify the evolutionary relationships among the proteins, a maximum likelihood phylogenetic tree was constructed using the complete protein sequences of poplar and Arabidopsis HSF proteins. The analysis results showed that the 30 proteins were classified into three major groups (A, B, and C), with fifteen minor groups (A1–A9, B1–B5, C1), which were consistent with the naming results (Figure 2). Among them, the number of group A and B proteins is large, with 17 and 12, respectively, whereas group C has only one member.

3.2. Protein Characterization of Poplar HSF Family

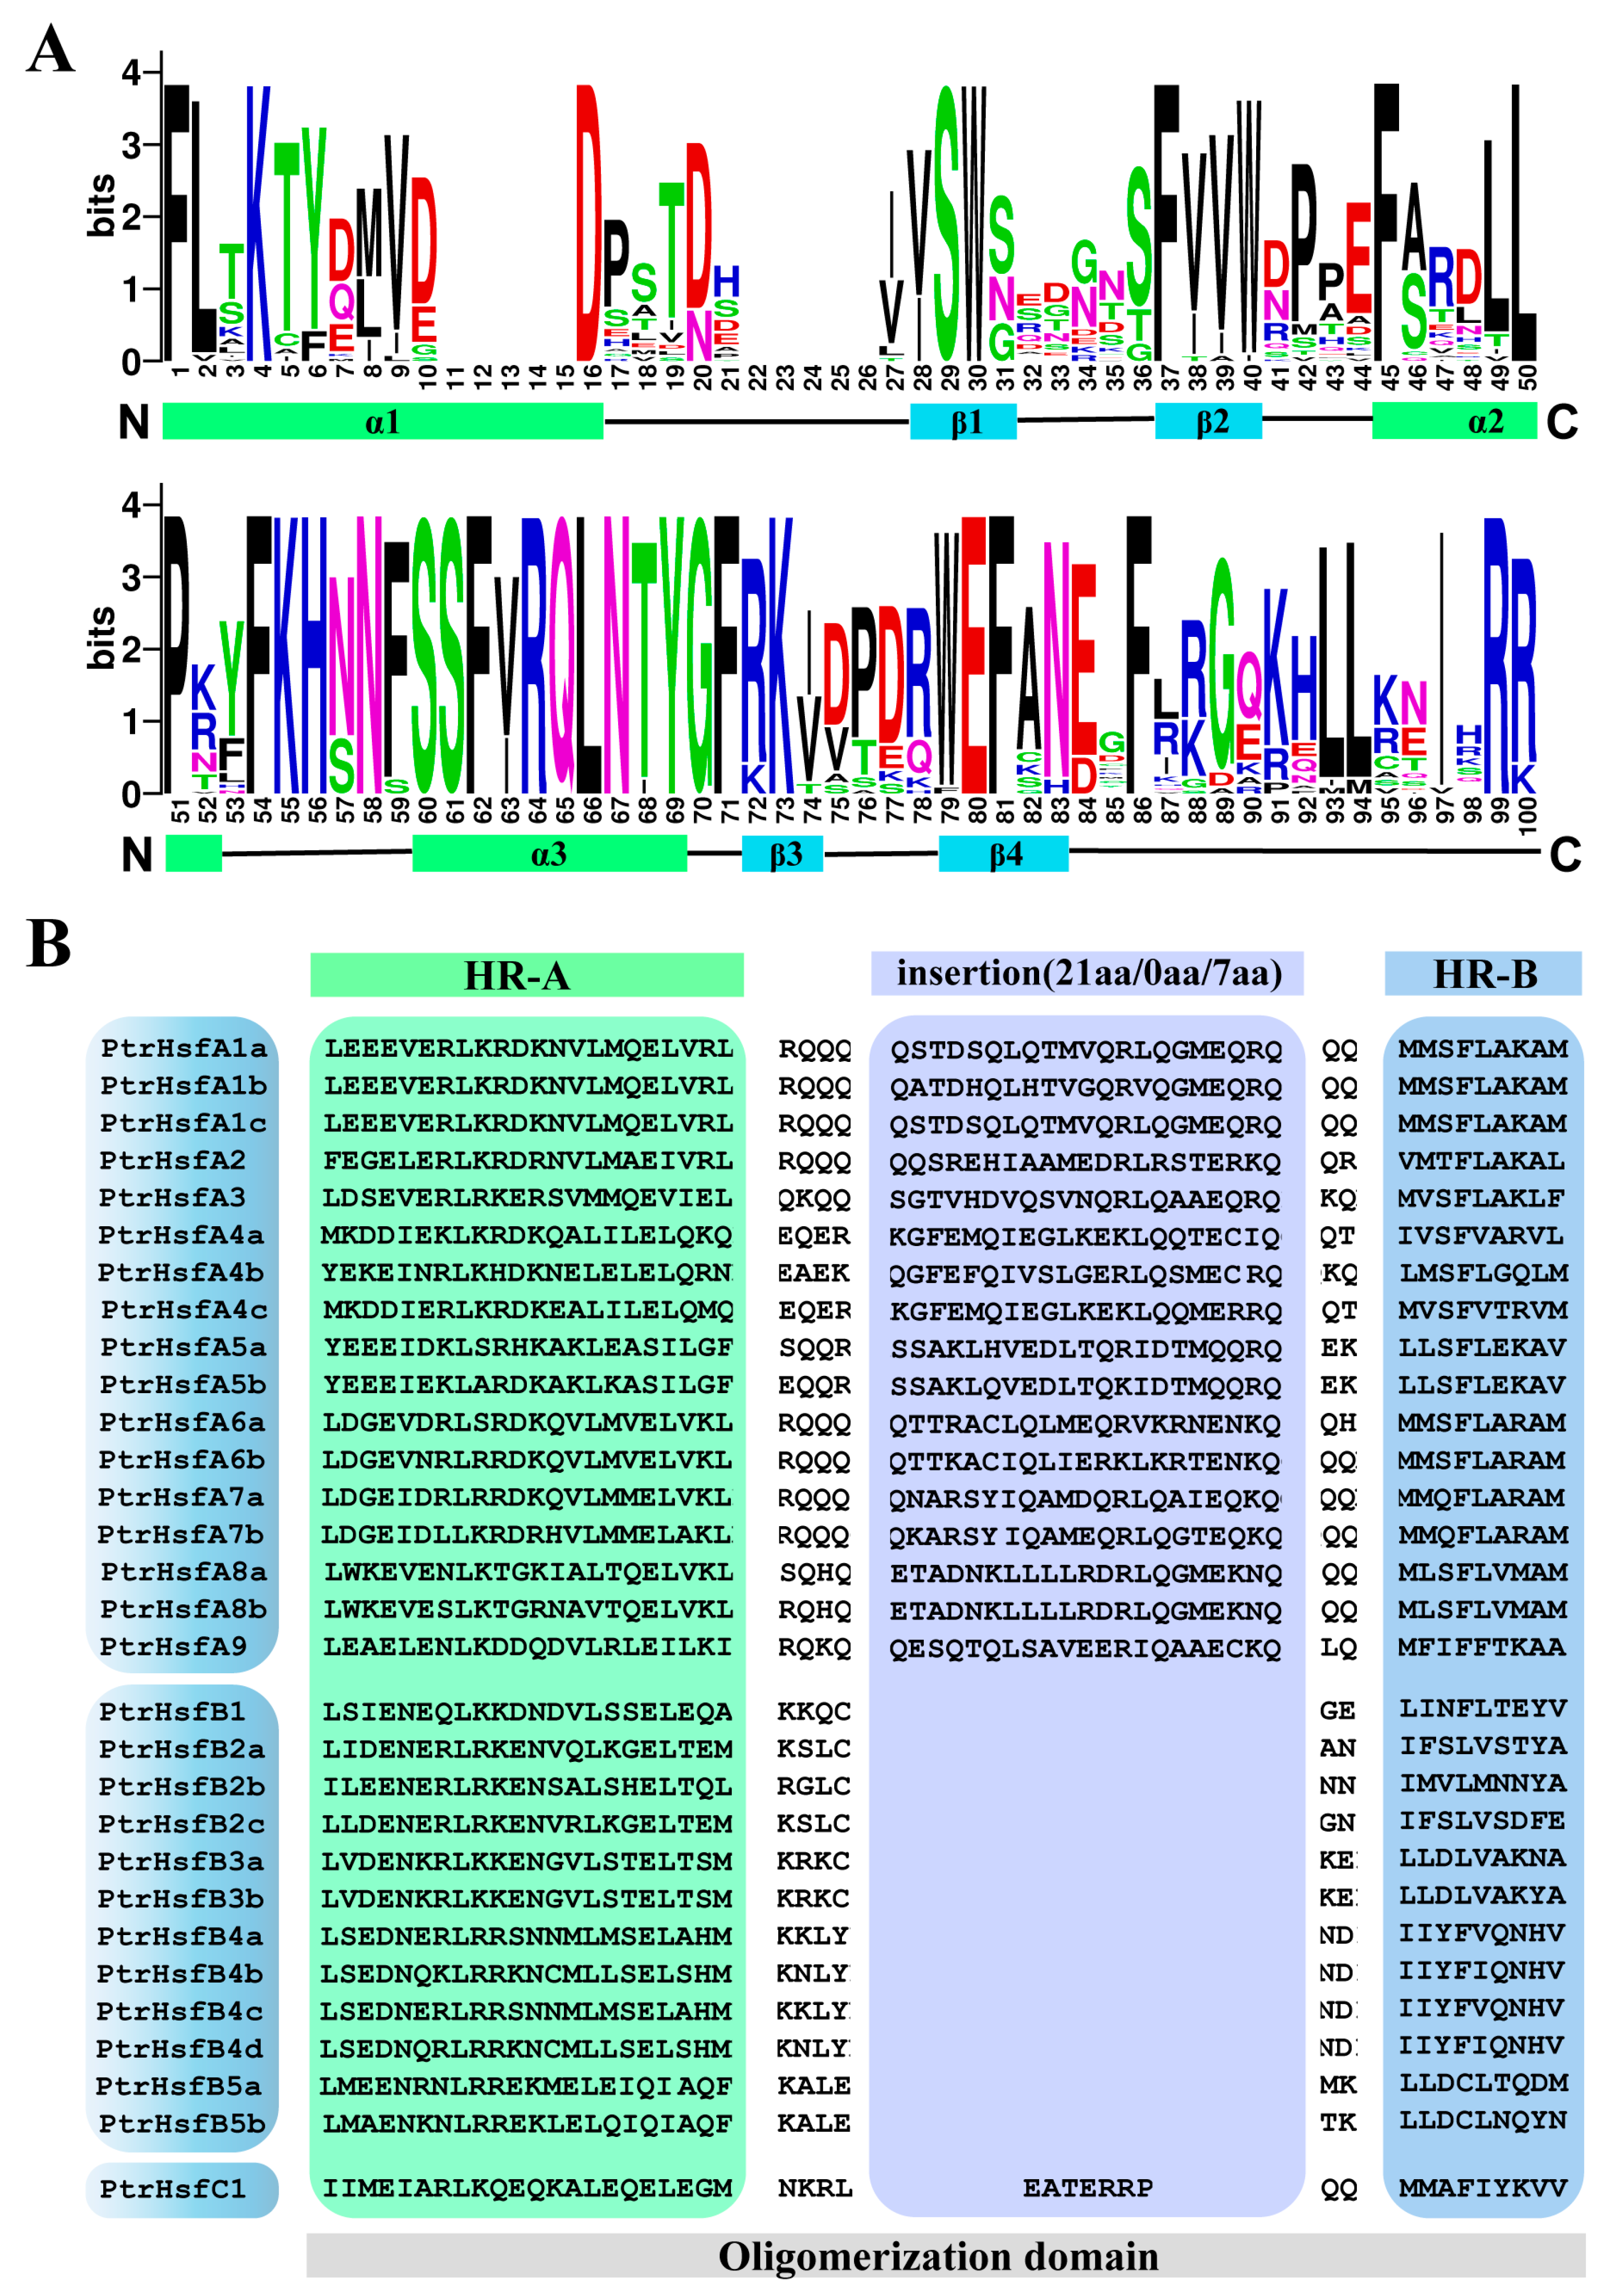
To characterize the poplar HSF proteins, the sequences of the conserved DNA-binding domain (HSF domain) and oligomerization domain of each member were extracted and visualized (Figure 3). Consistent with the findings in other plants, the HSF domain of the poplar HSF family members is similarly composed of three helical bundles (α1, α2 and α3) and four antiparallel ß-Sheets (Figure 3A), playing important roles in the recognition and interaction with HSEs. In addition, different canonical features are present in the oligomerization domain in the different groups of the poplar HSF family (Figure 3B). The HR-A/B region of the oligomerization domain of the group B HSF proteins is compact, without amino acid insertion. In contrast, the oligomerization domains of the group A and C proteins have 21 and 7 amino acid residues inserted, respectively (Figure 3B).
The analysis of the physicochemical properties showed that the members of the poplar HSF family differed greatly in protein length, molecular weight, and theoretical isoelectric point (Table S2). These thirty proteins have an average length of 368.07 amino acids (188–522 aa) and an average molecular weight of 41.45 kDa (22.23–58.19 kDa). Among the various groups, the average length and molecular weight of the group A proteins (433.88 aa, 48.87 kDa) were significantly higher than those of group B (277.25 aa, 31.23 kDa) and group C (339 aa, 37.98 kDa). The theoretical isoelectric points of these proteins range between 4.7 and 9.59, with values less than 7 for both the group A and C proteins, and a large difference for the group B proteins (4.81–9.59). The instability index (II) of these proteins ranges between 37.08 and 66.63, and with the exception of PtrHsfB1, they all had an index greater than 40 and were classified as unstable proteins (Table S2). The aliphatic indexes are 59.58–80.66 (Table S2). The grand average of hydropathicity (GRAVY) of all the proteins was negative (−0.955 to −0.409), indicating that these proteins were hydrophilic (Table S2). The subcellular localization prediction results showed that these proteins were all predicted to localize in the nucleus (Table S2).

3.3. Cis-Acting Elements and Sequence Structure Analysis

Cis-acting elements play an important role in the regulation of gene expression. In order to clarify the distribution of the cis-acting elements on the poplar HSF gene promoter, 2000 bp promoter fragments of each gene were extracted for analysis. The results showed that there were a large number of hormone and stress response elements in the promoter of the poplar HSF genes, such as the auxin-responsive element, gibberellin-responsive element, salicylic acid-responsive element, abscisic acid-responsive element, MeJA-responsive element, low-temperature-responsive element, wound-responsive element, and light-responsive element (Data S1). In addition, several elements involved in drought-inducibility, anaerobic induction, flavonoid biosynthetic genes regulation, zein metabolism regulation, and circadian control were identified (Data S1).
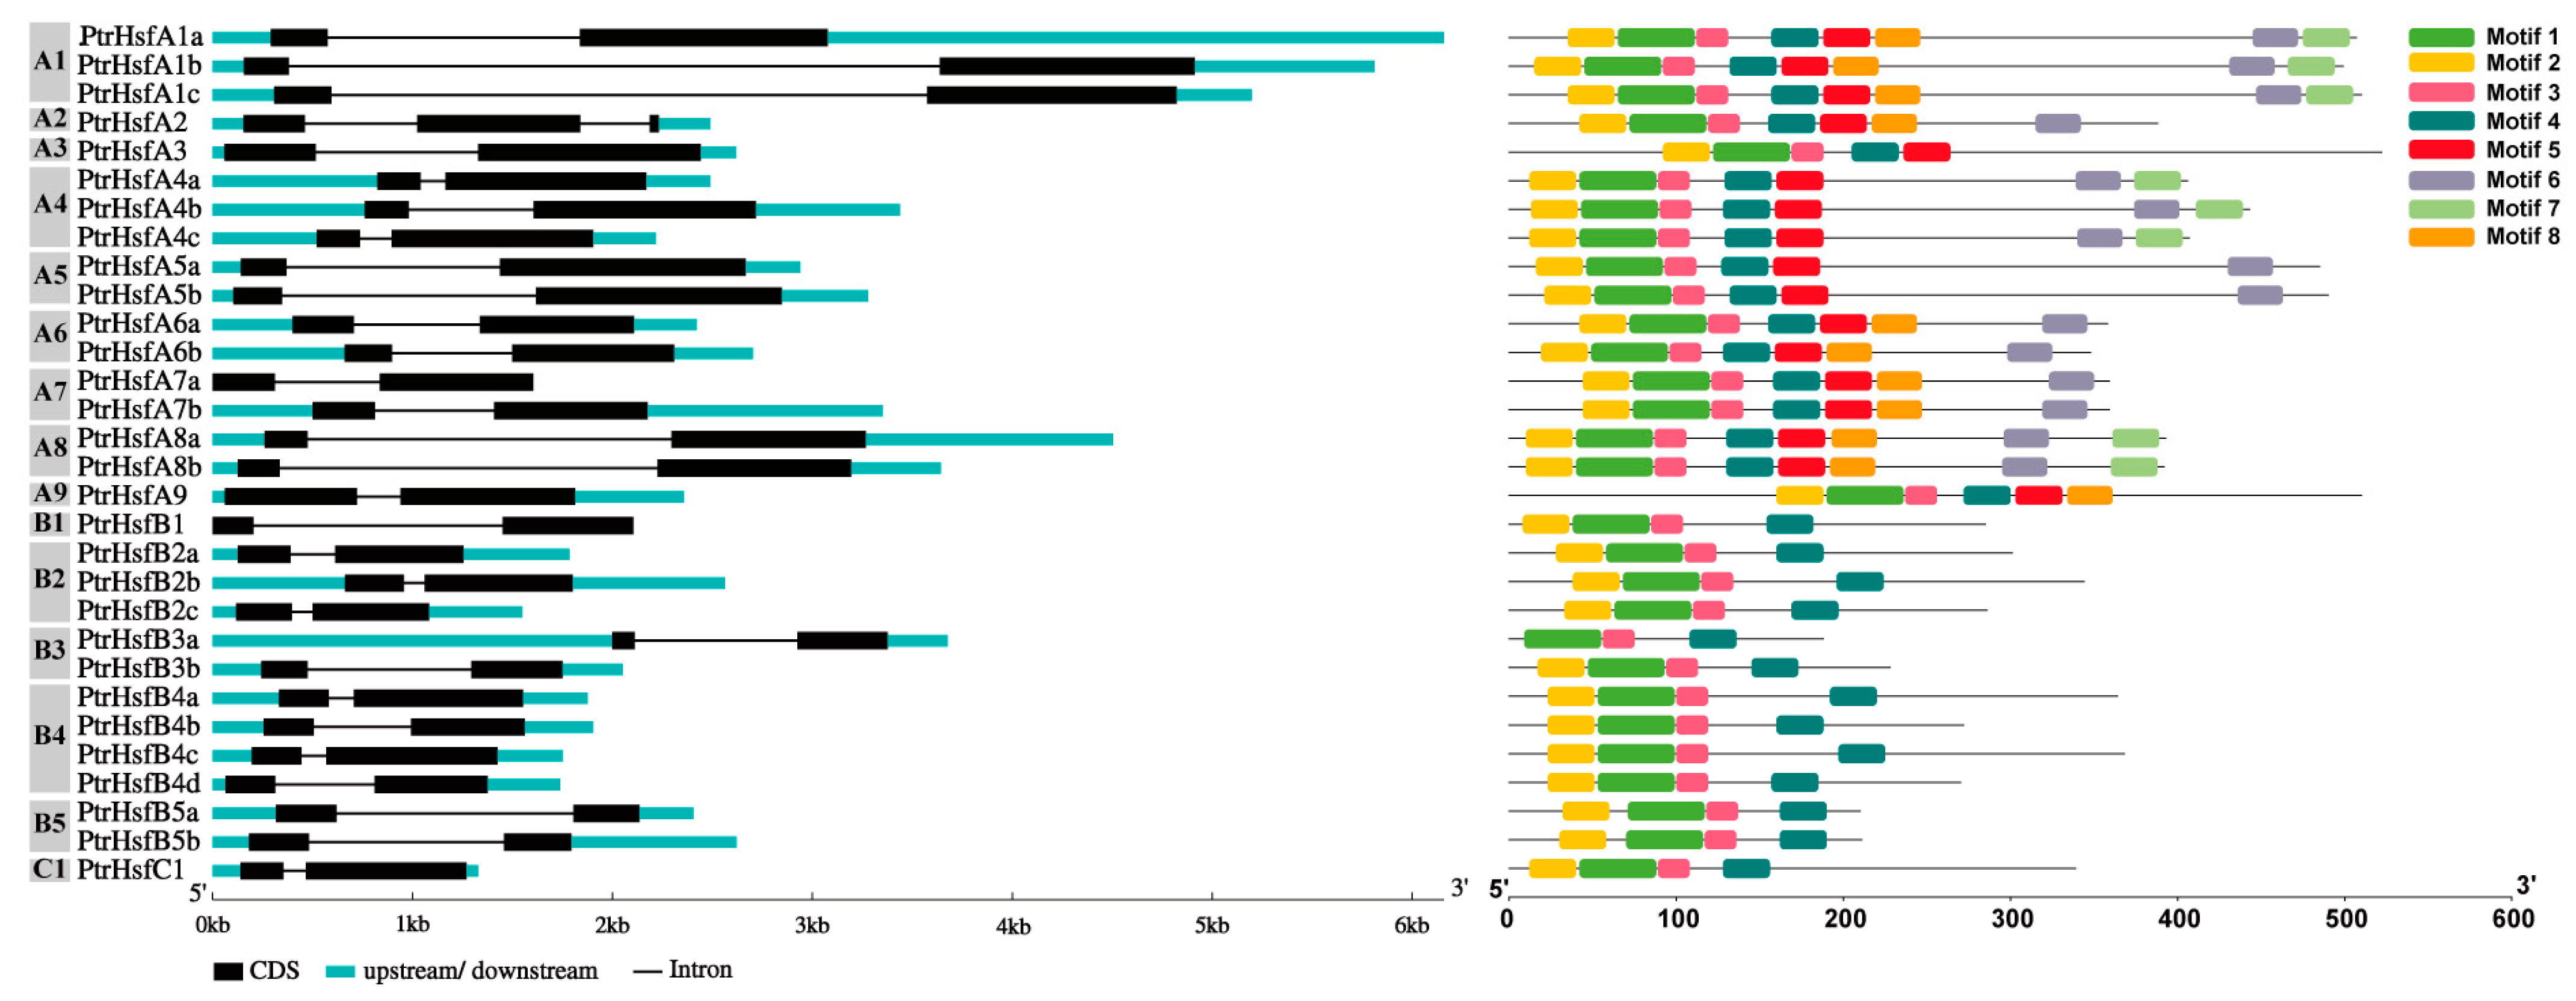
To resolve the sequence features of the poplar HSF members, we analyzed their in-tron/exon structure and motif composition. The results of the gene structure analysis showed that, with the exception of the A2 subgroup gene, which had three exons and two introns, the other HSF genes had only two exons and one intron (Figure 4). Through MEME analysis [43], eight conserved motifs were identified in these proteins (Figure 4). By searching and analyzing in the SMART and Pfam databases [31,32], we found that Motif 1 and Motif 2 were annotated as HSF domain fragments, Motif 4 was annotated as HALZ, and the remaining motifs had no annotation information (Table S3). As expected, all of the proteins contained Motif 1, and 29 of the 30 proteins contained Motif 2 (Figure 4). Motifs 3 and 4 are also distributed in all HSF family proteins (Figure 4), which may be related to the biological functions of HSF proteins. In addition, Motif 5 is only distributed in all group A proteins; Motif 6 is distributed in all group A proteins except subgroups A3 and A9. Motif 8 is distributed in all group A proteins except subgroups A3, A4 and A5. Motif 7 exists only in the proteins of subgroups A1, A4, and A8. The above results suggest that Motifs 5–8 may be associated with specific biological functions of the different subgroups proteins.

3.4. Chromosomal Location and Collinearity Analysis of the HSF Gene Family in Poplar

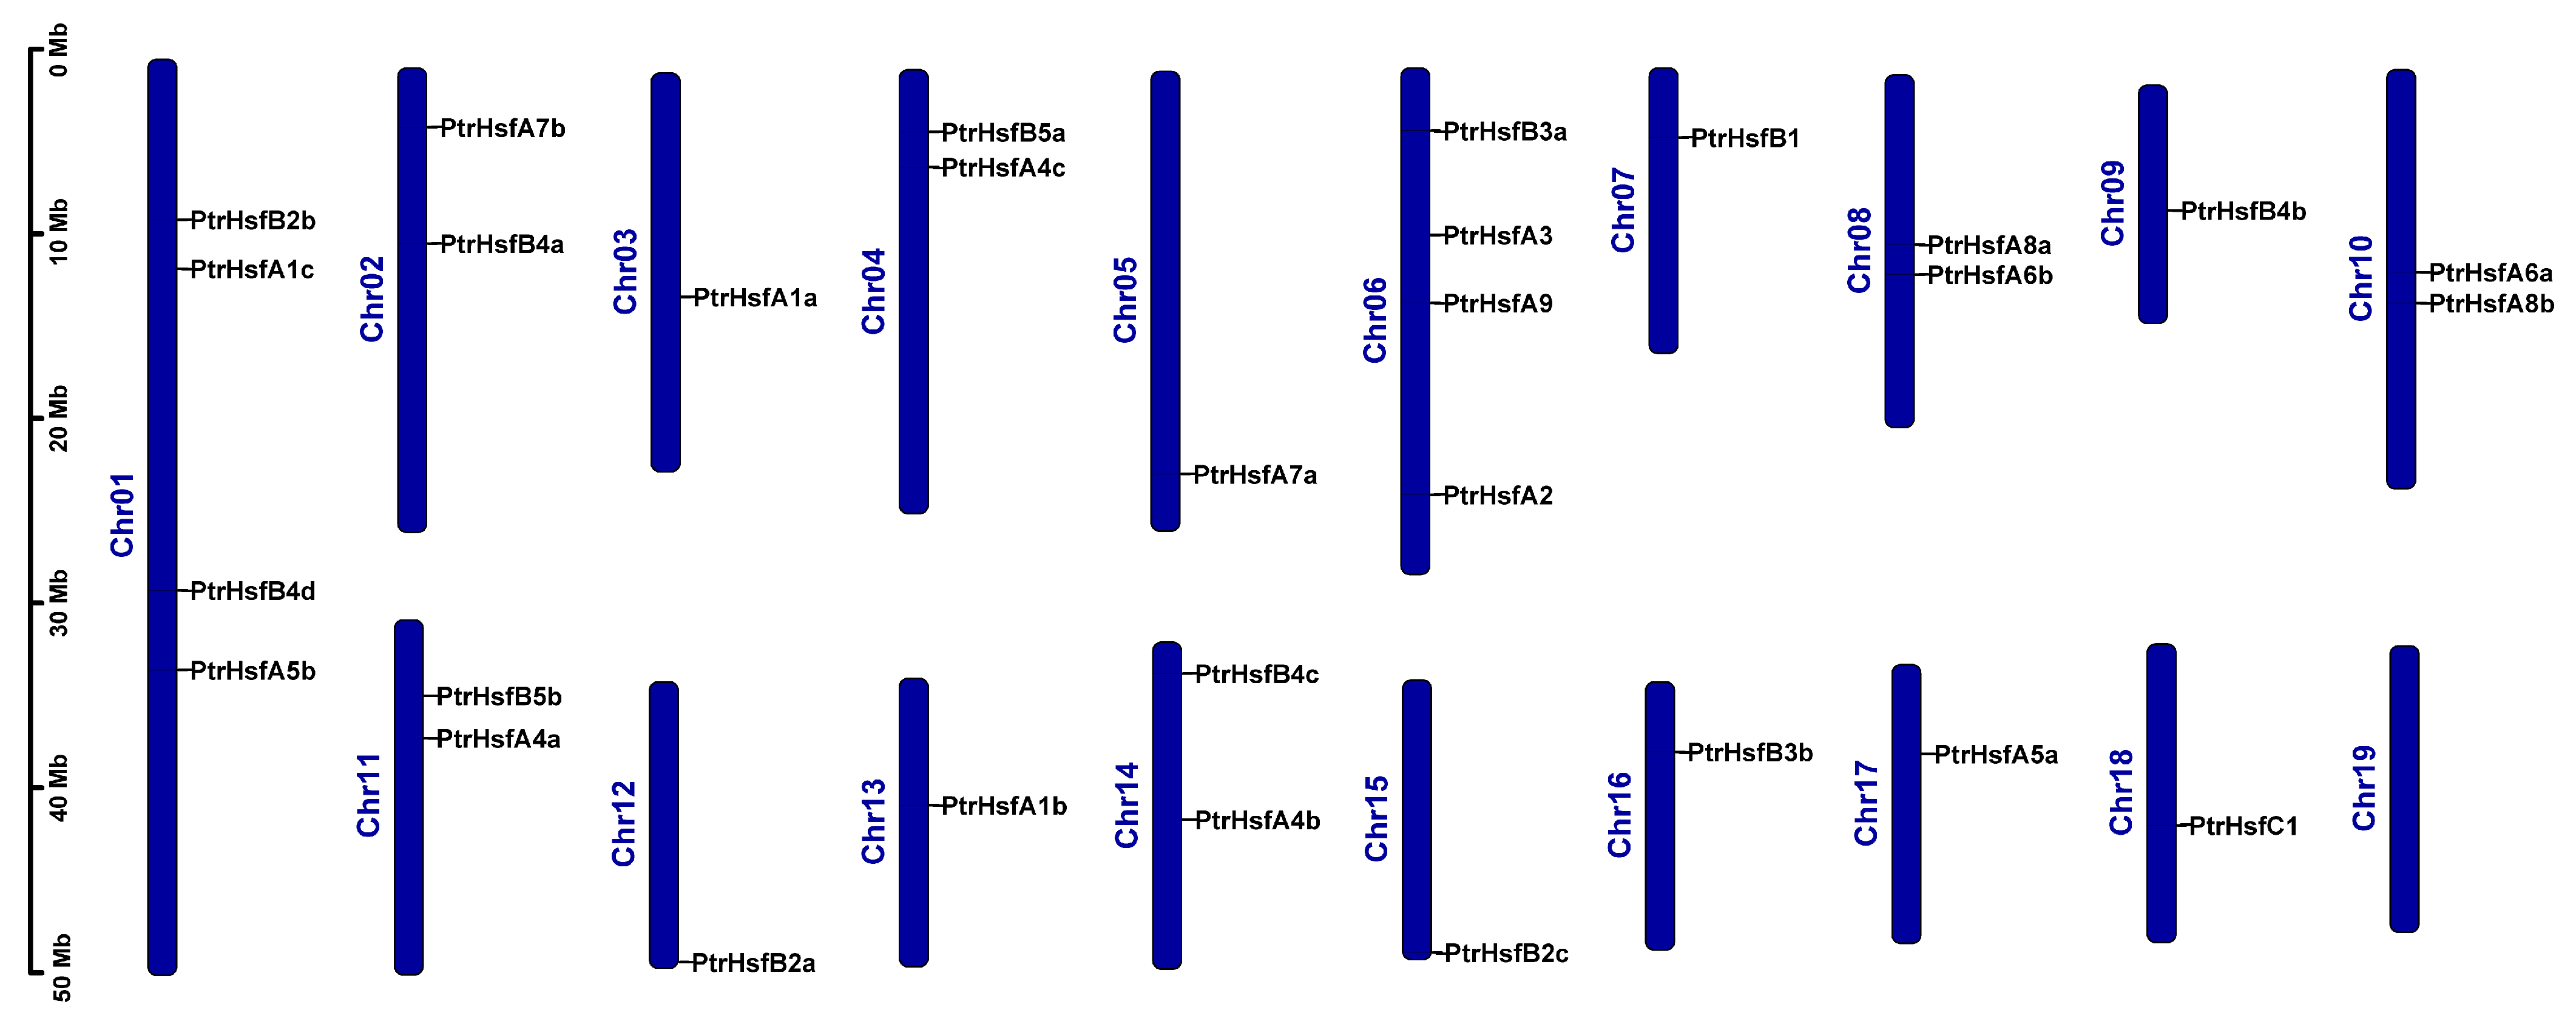
By visualizing the genomic annotation information, we mapped 30 poplar HSF genes onto chromosomes. As shown in Figure 5, these genes were unevenly distributed on 18 chromosomes of poplar, while no gene was distributed on chromosome 19, and the distribution of the genes was independent of the length of chromosomes.
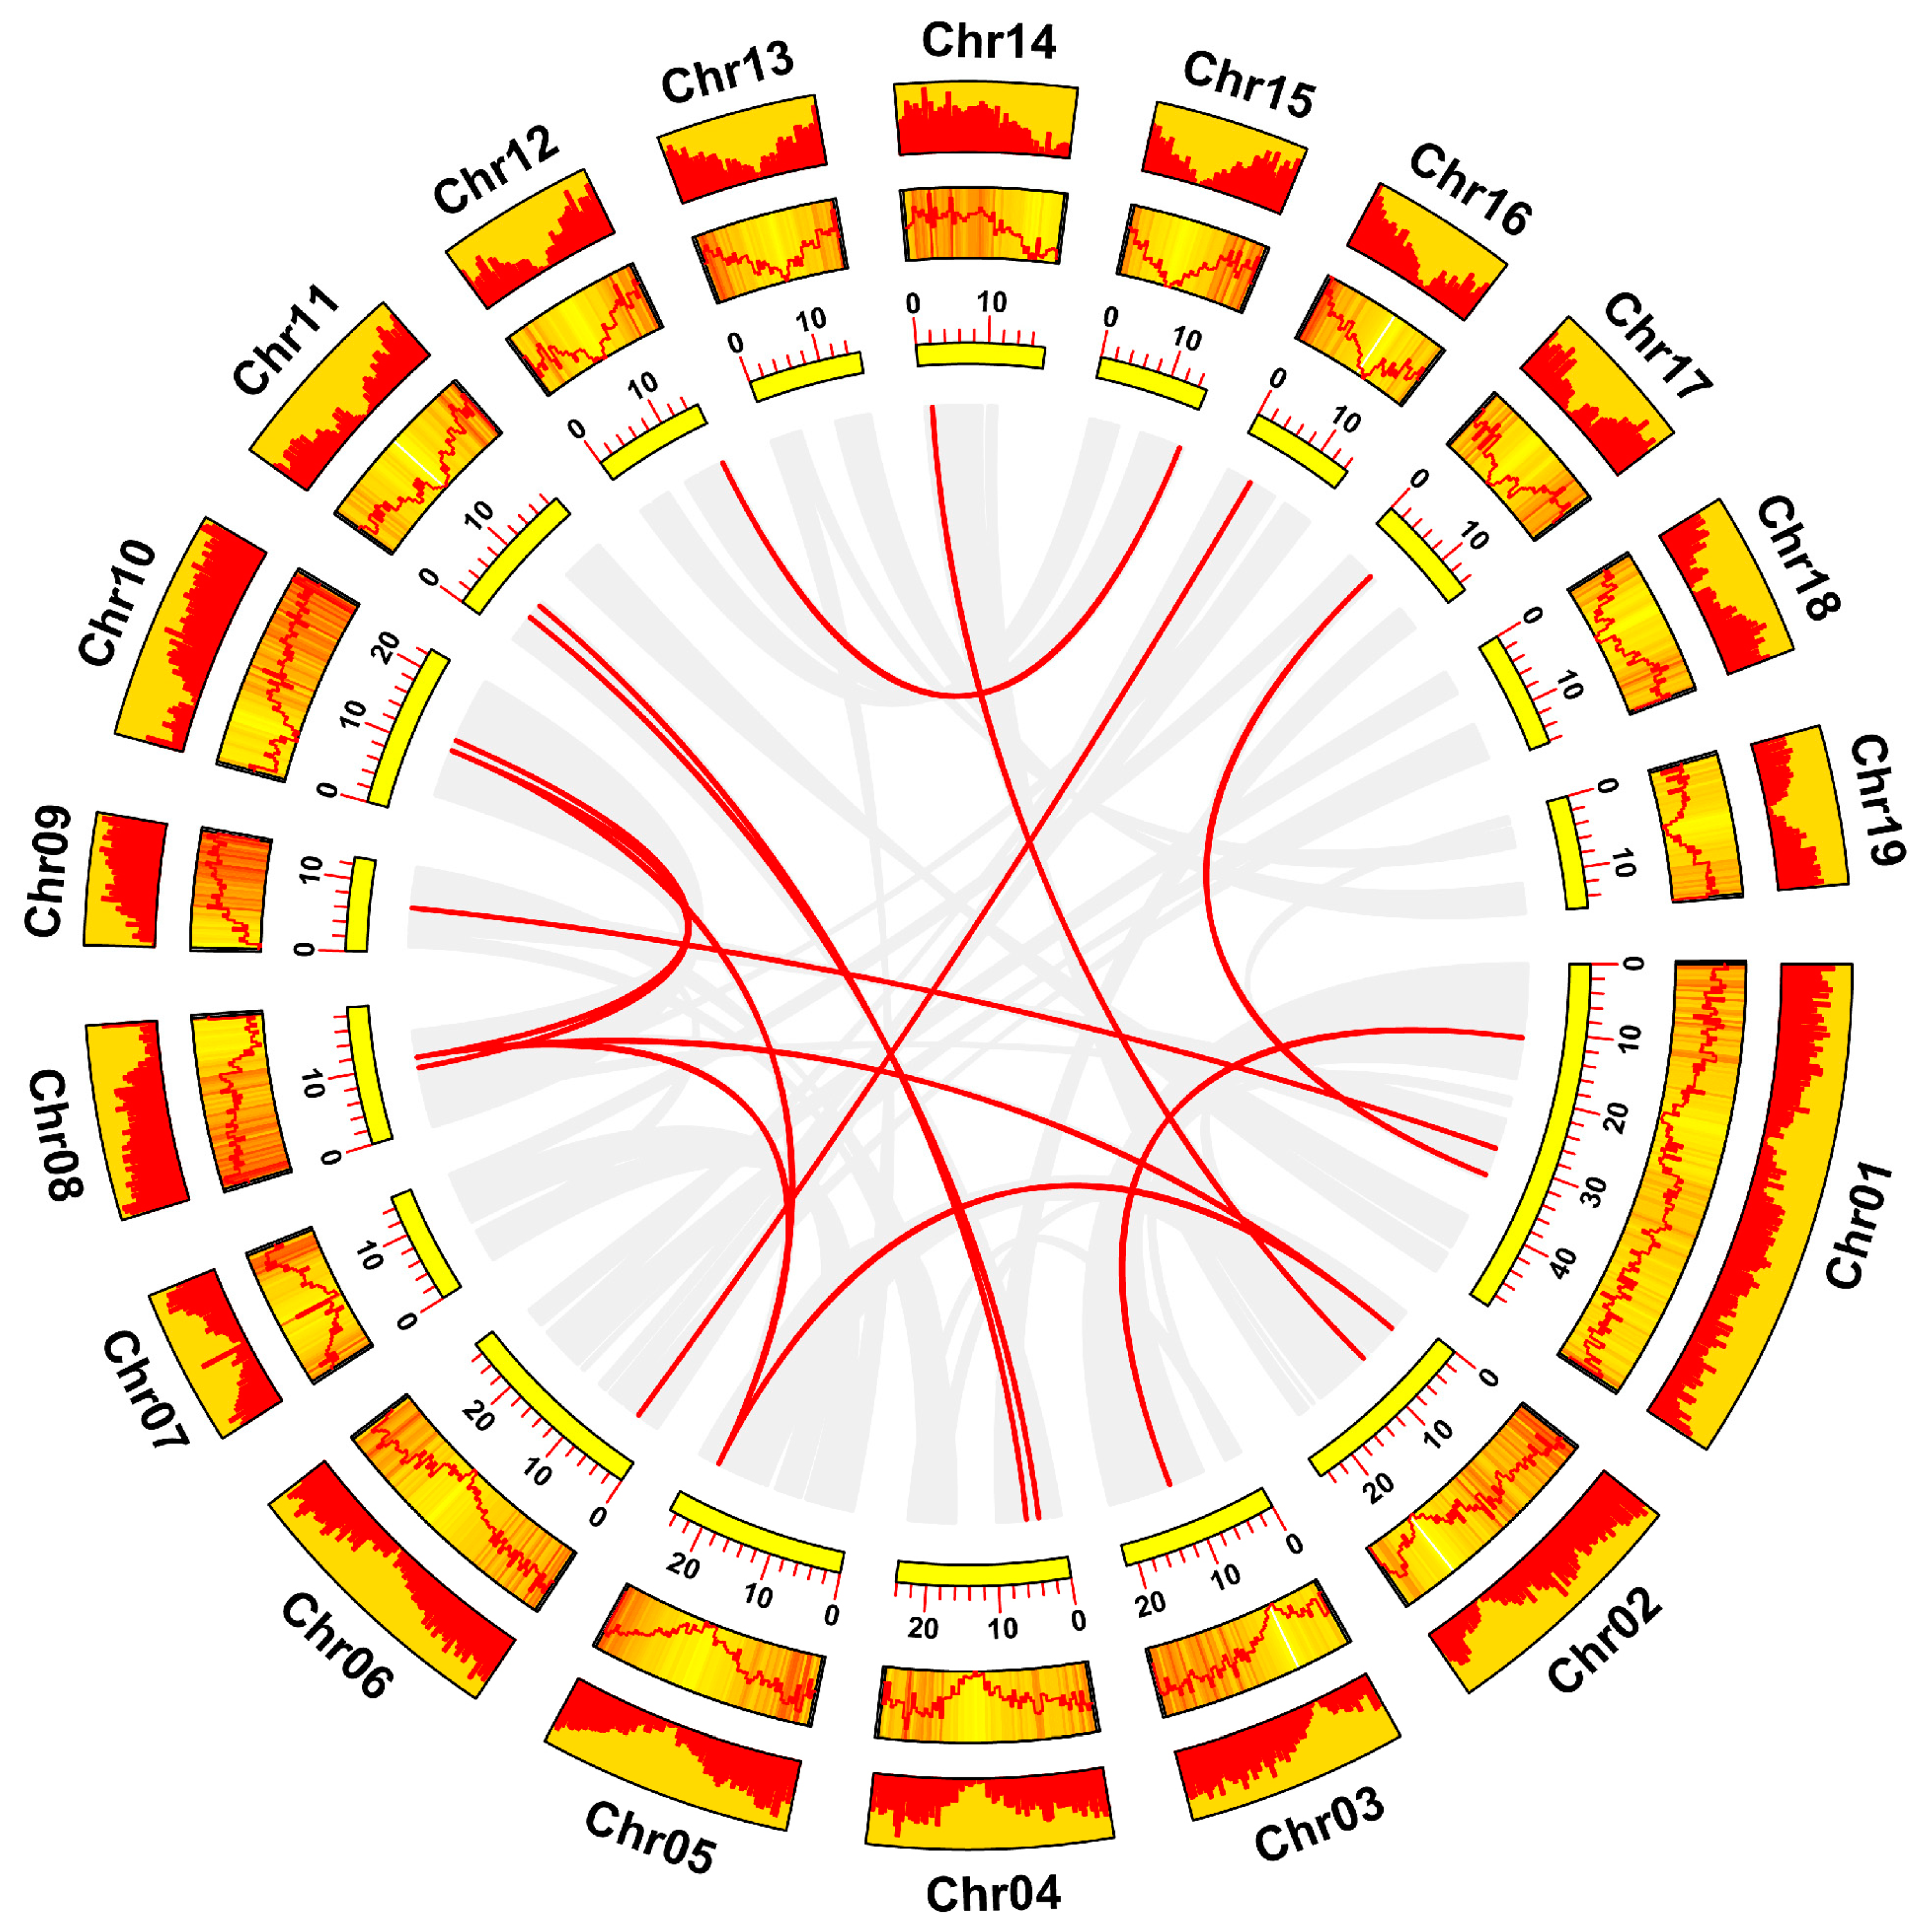
Subsequently, tandem duplication events between the genes were analyzed using TBtools and MCScanX [34,44]. Notably, no tandem duplication event existed among the poplar HSF genes (Figure 5). Then, we explored the segmental duplication events between genes. The results showed that a total of 14 pairs of poplar HSF genes possessed segmental duplication events, involving 15 chromosomes of poplar (Figure 6, Table S4). The above analysis results indicated that segmental duplication events might be one of the main reasons for the expansion of the poplar HSF gene family.
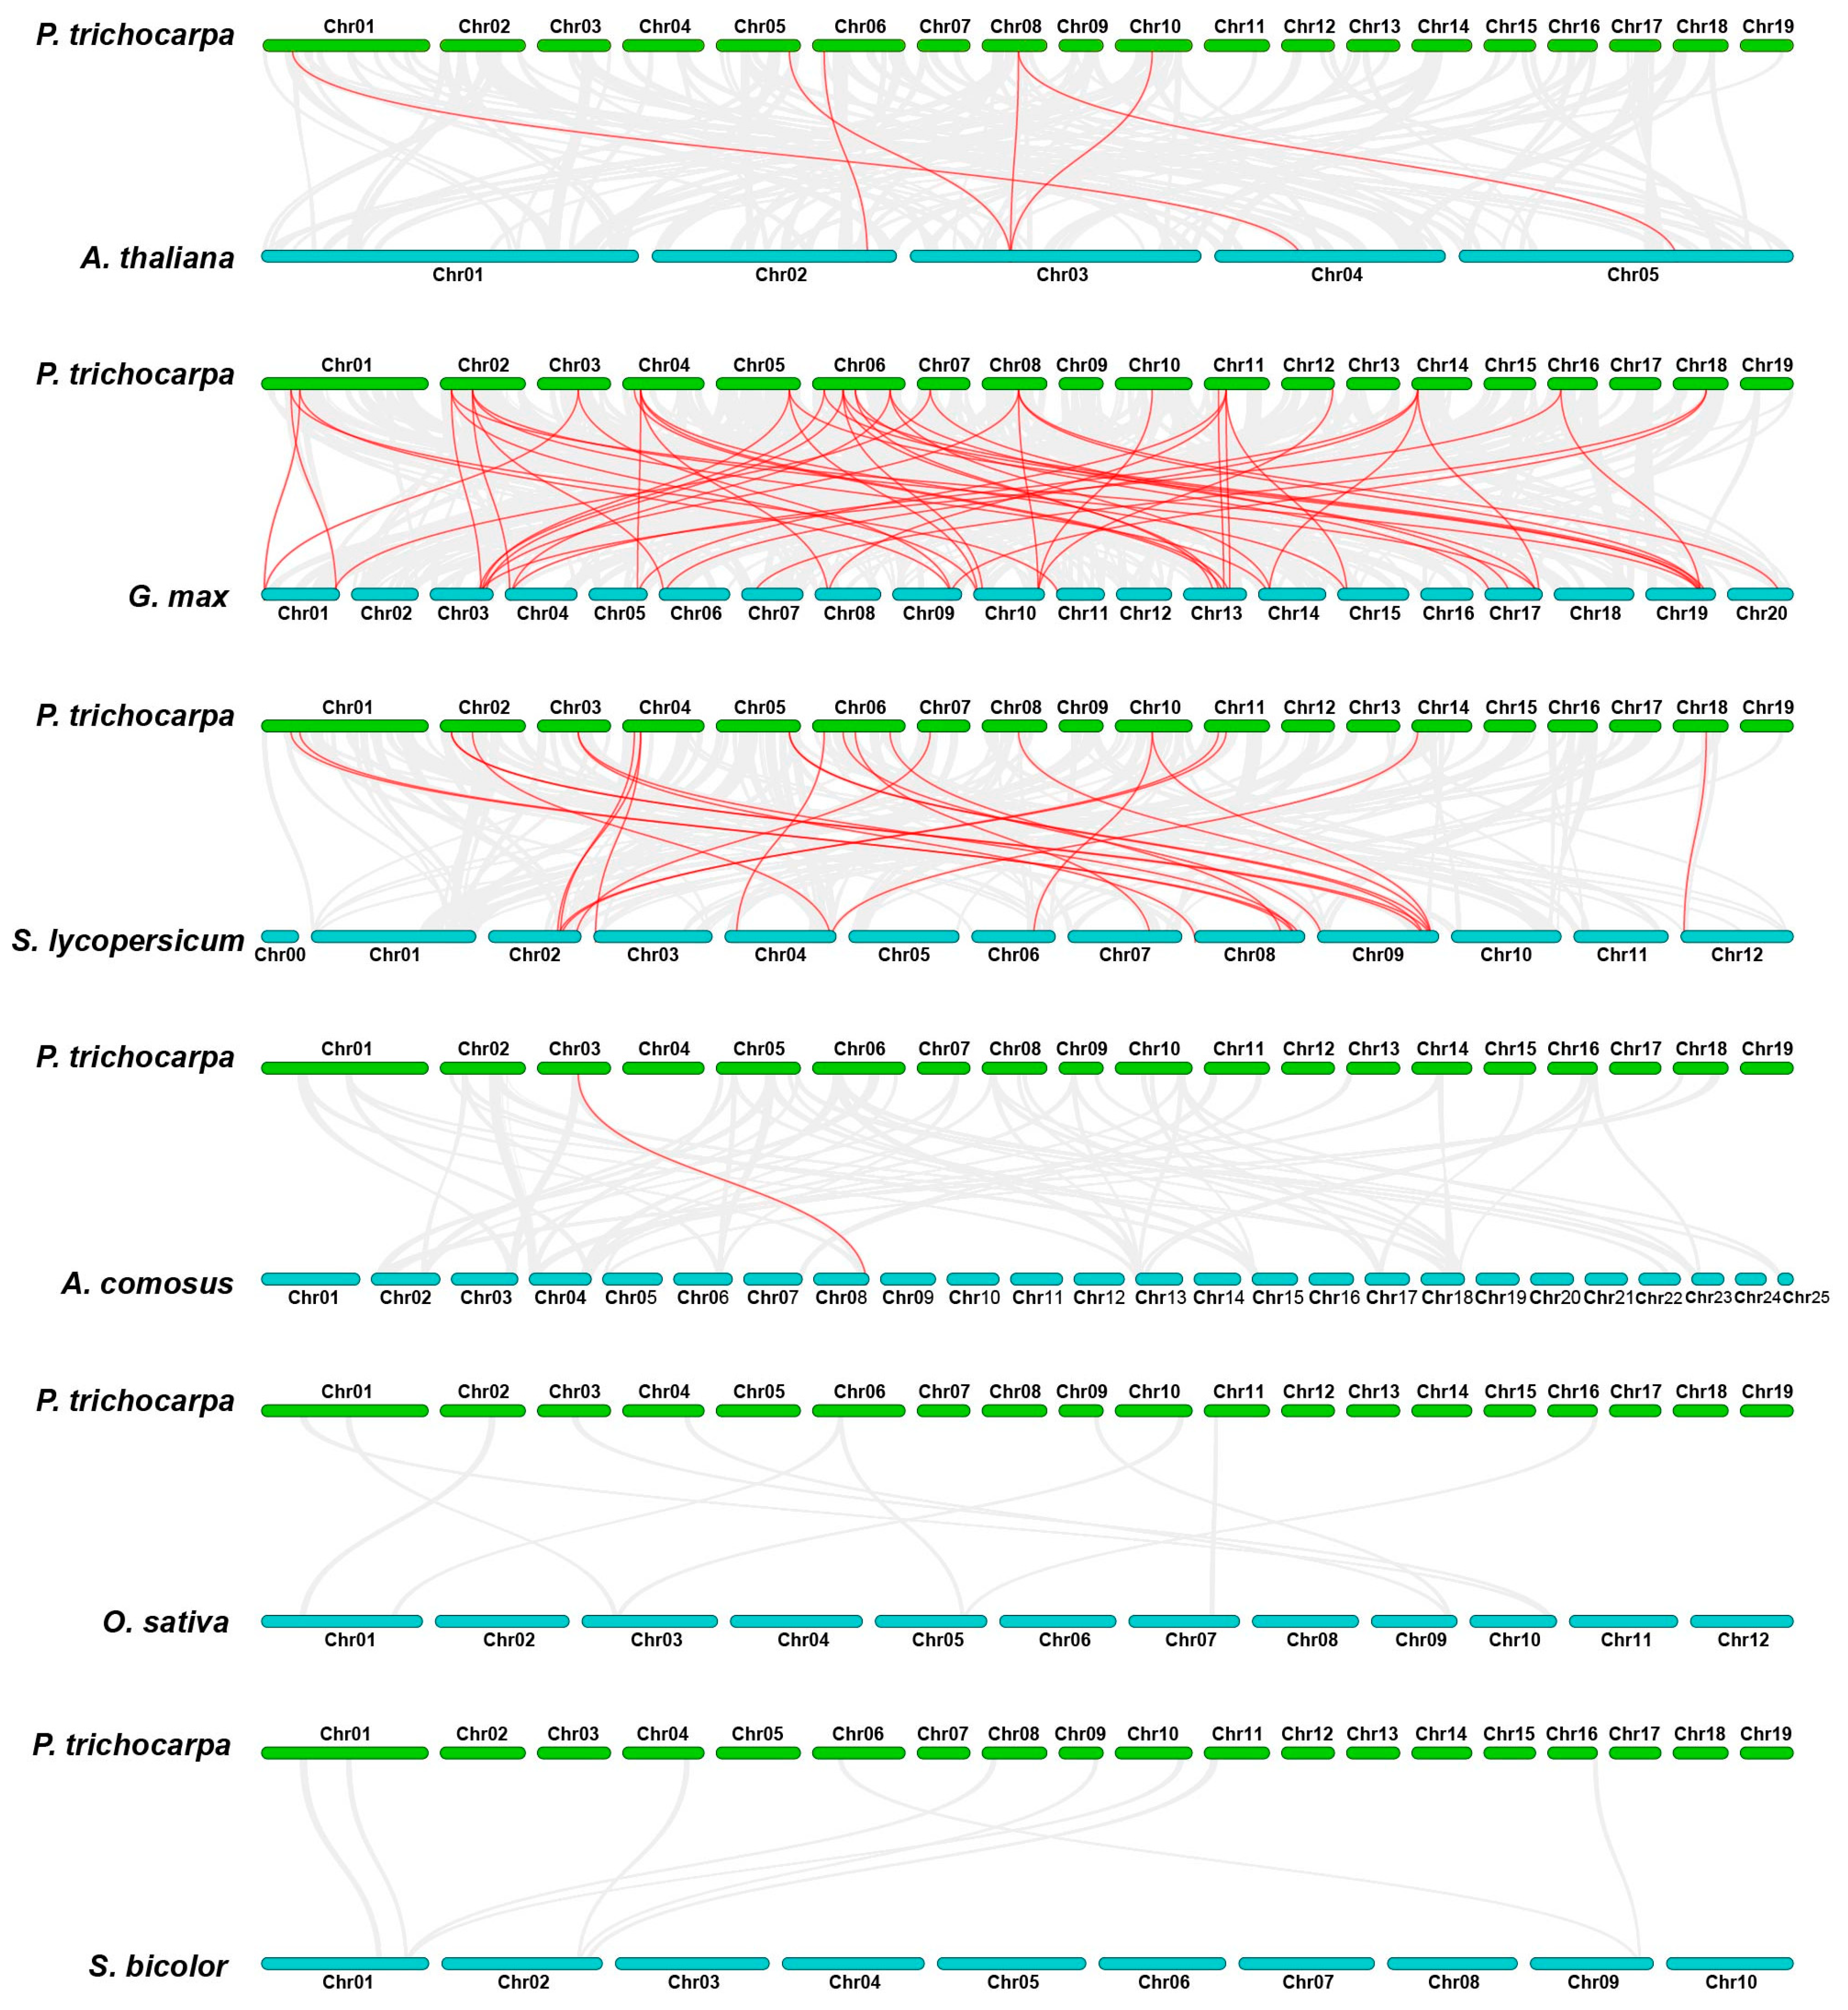
In addition, we also explored the collinearity between the poplar HSF genes and those of six representative species (three monocots: Oryza sativa, Sorghum bicolor, and Ananas comosus; and three dicots: Arabidopsis thaliana, Glycine max, and Solanum lycopersicum). The analysis results showed that a total of 21 poplar HSF genes had collinearity relationships with four Arabidopsis genes, 34 soybean genes, 16 tomato genes, and one pineapple gene (Figure 7, Table S5). However, no gene had a collinear relationship with the poplar HSF genes in rice and sorghum (Figure 7, Table S5). A total of 84 gene pairs with collinearity were identified, among which the maximum number was 53 between poplar and soybean, followed by 24 between poplar and tomato, six between poplar and Arabidopsis, and only one between poplar and pineapple (Figure 7, Table S5). The above results may be due to the close evolutionary relationship between poplar, Arabidopsis, soybean, and tomato as the same dicotyledons. It is noteworthy that a large number of the poplar HSF genes had collinear relationships with two to four genes, especially between poplar and soybean (Table S5). In addition, PtrHsfA1a, which was collinear with the pineapple gene, was also collinear with the genes from soybean and tomato (Table S5). The above results suggest that these genes may play an important role in the evolution of gene families.
To explore the evolutionary constraints of the HSF genes, we used TBtools to calculate the Ka/Ks ratios of the identified gene pairs with segmental duplication and collinearity [34]. The Ka/Ks ratios of all the gene pairs were less than one, except for a few genes with no calculated results (Tables S4 and S5). This result suggests that the HSF gene family may have undergone strong purifying selection pressure during evolution.

3.5. Tissue-Differential Gene Expression of Poplar HSF Genes

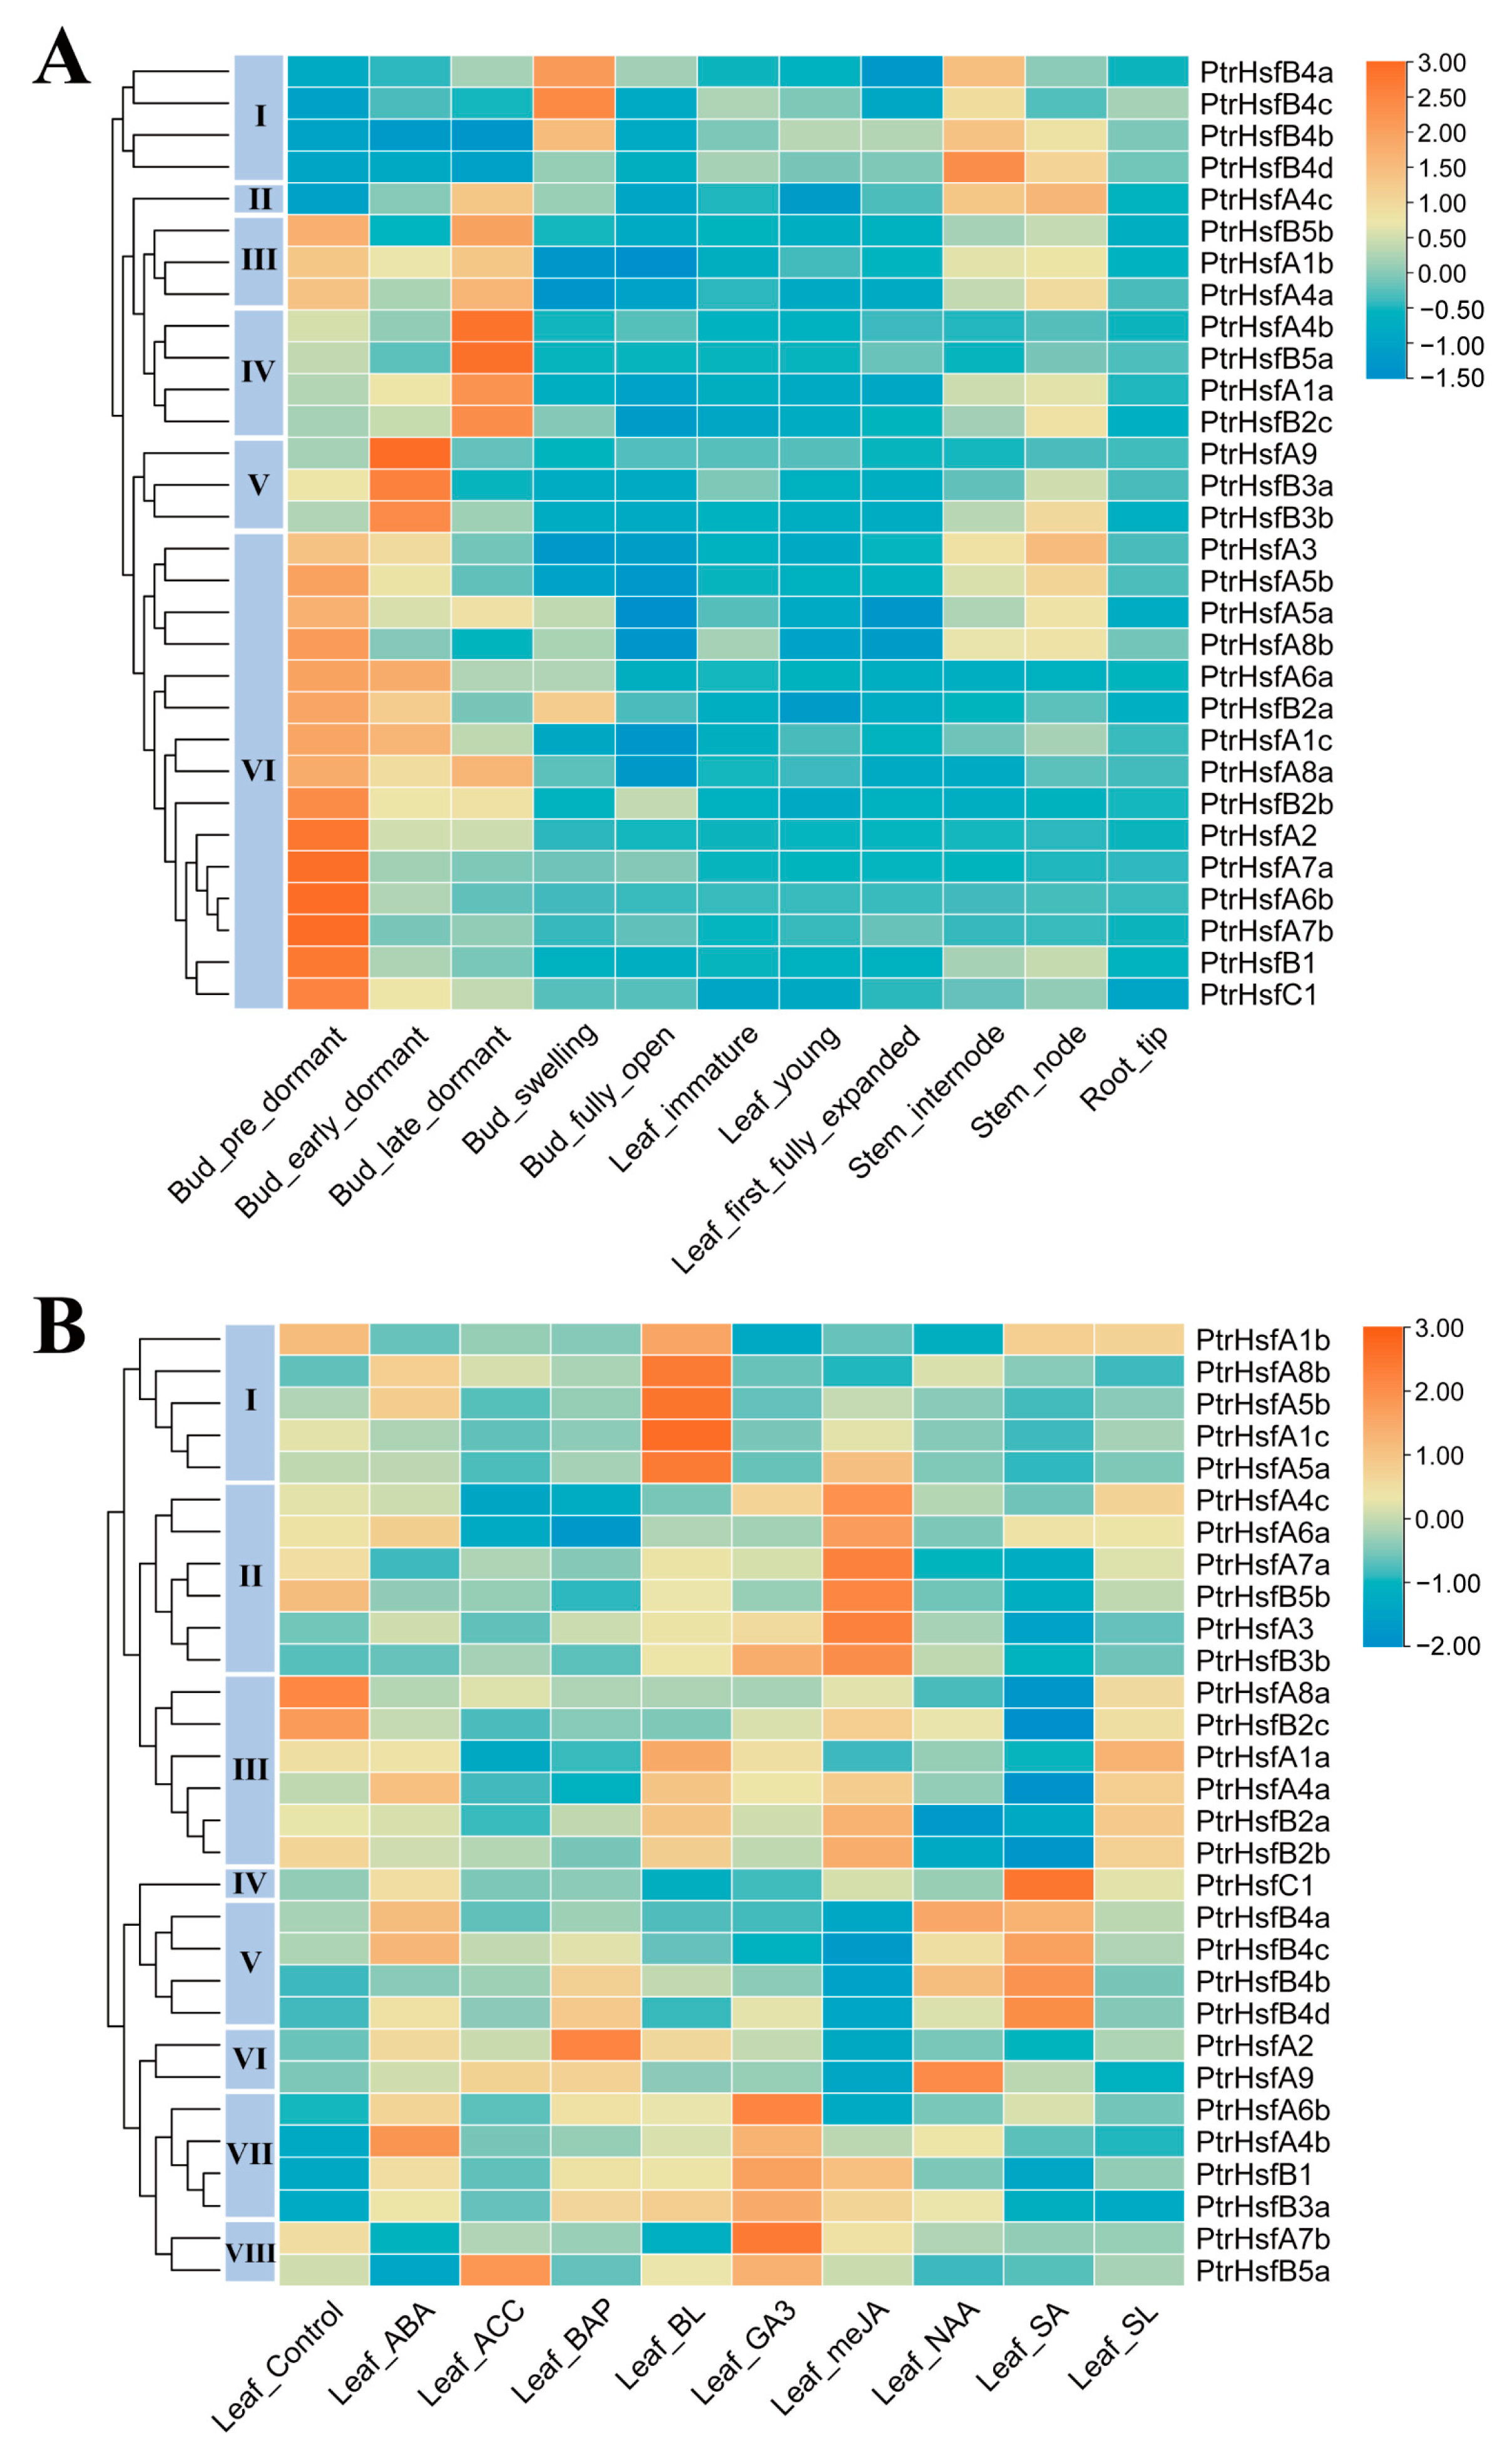
To explore the expression pattern of the HSF genes in different tissues of poplar, we analyzed the expression levels of the HSF genes in the pre-dormanting bud, early dormanting bud, late dormanting bud, swelling bud, fully open bud, immature leaf, young leaf, the first fully expanded leaf, internode, node, and root tip of poplar. Overall, the relative expression levels of the 30 poplar HSF genes were low in the fully open bud, immature leaf, young leaf, first fully expanded leaf, and root tip (Figure 8A). More than half of the genes were expressed at high levels in the pre-dormanting buds. There were also some genes with higher relative expression levels in the dormanting buds. In addition, we also found that some genes in the same subgroup had similar expression patterns, such as PtrHsfB4a, PtrHsfB4b, PtrHsfB4c, and PtrHsfB4d; PtrHsfB3a and PtrHsfB3b; PtrHsfA5a and PtrHsfA5b; PtrHsfA7a and PtrHsfA7b (Figure 8A). By clustering the expression patterns of these genes, we classified them into six groups (Figure 8A). The relative expression level of the genes of the first group was low in the pre-dormanting bud, and high in the swelling bud and internode. In the second group, the expression level of the genes was higher in the stem and late dormanting bud, and lower in the pre-dormanting bud, fully open bud, and young leaf. The third group genes had higher relative expression levels in the pre-dormanting bud and late dormanting bud. The fourth group genes showed higher expression levels in the late dormanting bud. The fifth group genes showed higher expression levels in the early dormanting bud. The genes of the sixth group, with the largest number, had high expression levels in the pre-dormanting bud.

3.6. Gene Expression in Response to Phytohormone

Phytohormones play important roles in regulating plant growth and development and stress responses. In order to explore the responses of the poplar HSF genes to various phytohormones, the expression of these genes under abscisic acid, ethylene, cytokinin, brassinolide, gibberellin, methyl jasmonate, auxin, salicylic acid, and strigolactone treatments was analyzed. In general, different HSF genes showed diverse expression patterns under different phytohormone treatment conditions. Some genes reached high expression levels under the treatments of brassinolide, gibberellin, methyl jasmonate, and salicylic acid; and some genes showed low expression levels under the treatments of methyl jasmonate and salicylic acid (Figure 8B). Through cluster analysis of the expression patterns of the different genes, these 30 genes were divided into eight groups (Figure 8B). The expression level of the genes in the first group was higher under brassinolide treatment. The expression level of the second group genes was higher with methyl jasmonate treatment. The third group genes showed lower expression levels under salicylic acid treatment. The fourth group genes showed higher expression levels under salicylic acid treatment. The fifth group genes showed a low expression level under methyl jasmonate treatment, but displayed an opposite pattern under salicylic acid treatment. The expression level of the sixth group genes was also lower with methyl jasmonate treatment. The seventh group genes showed a low expression level without treatment and a high expression level under gibberellin treatment. The eighth group genes showed a lower expression level under abscisic acid treatment and higher expression levels with gibberellin treatment.

3.7. RNA-Seq Analysis of Poplar HSF Genes during Early Development

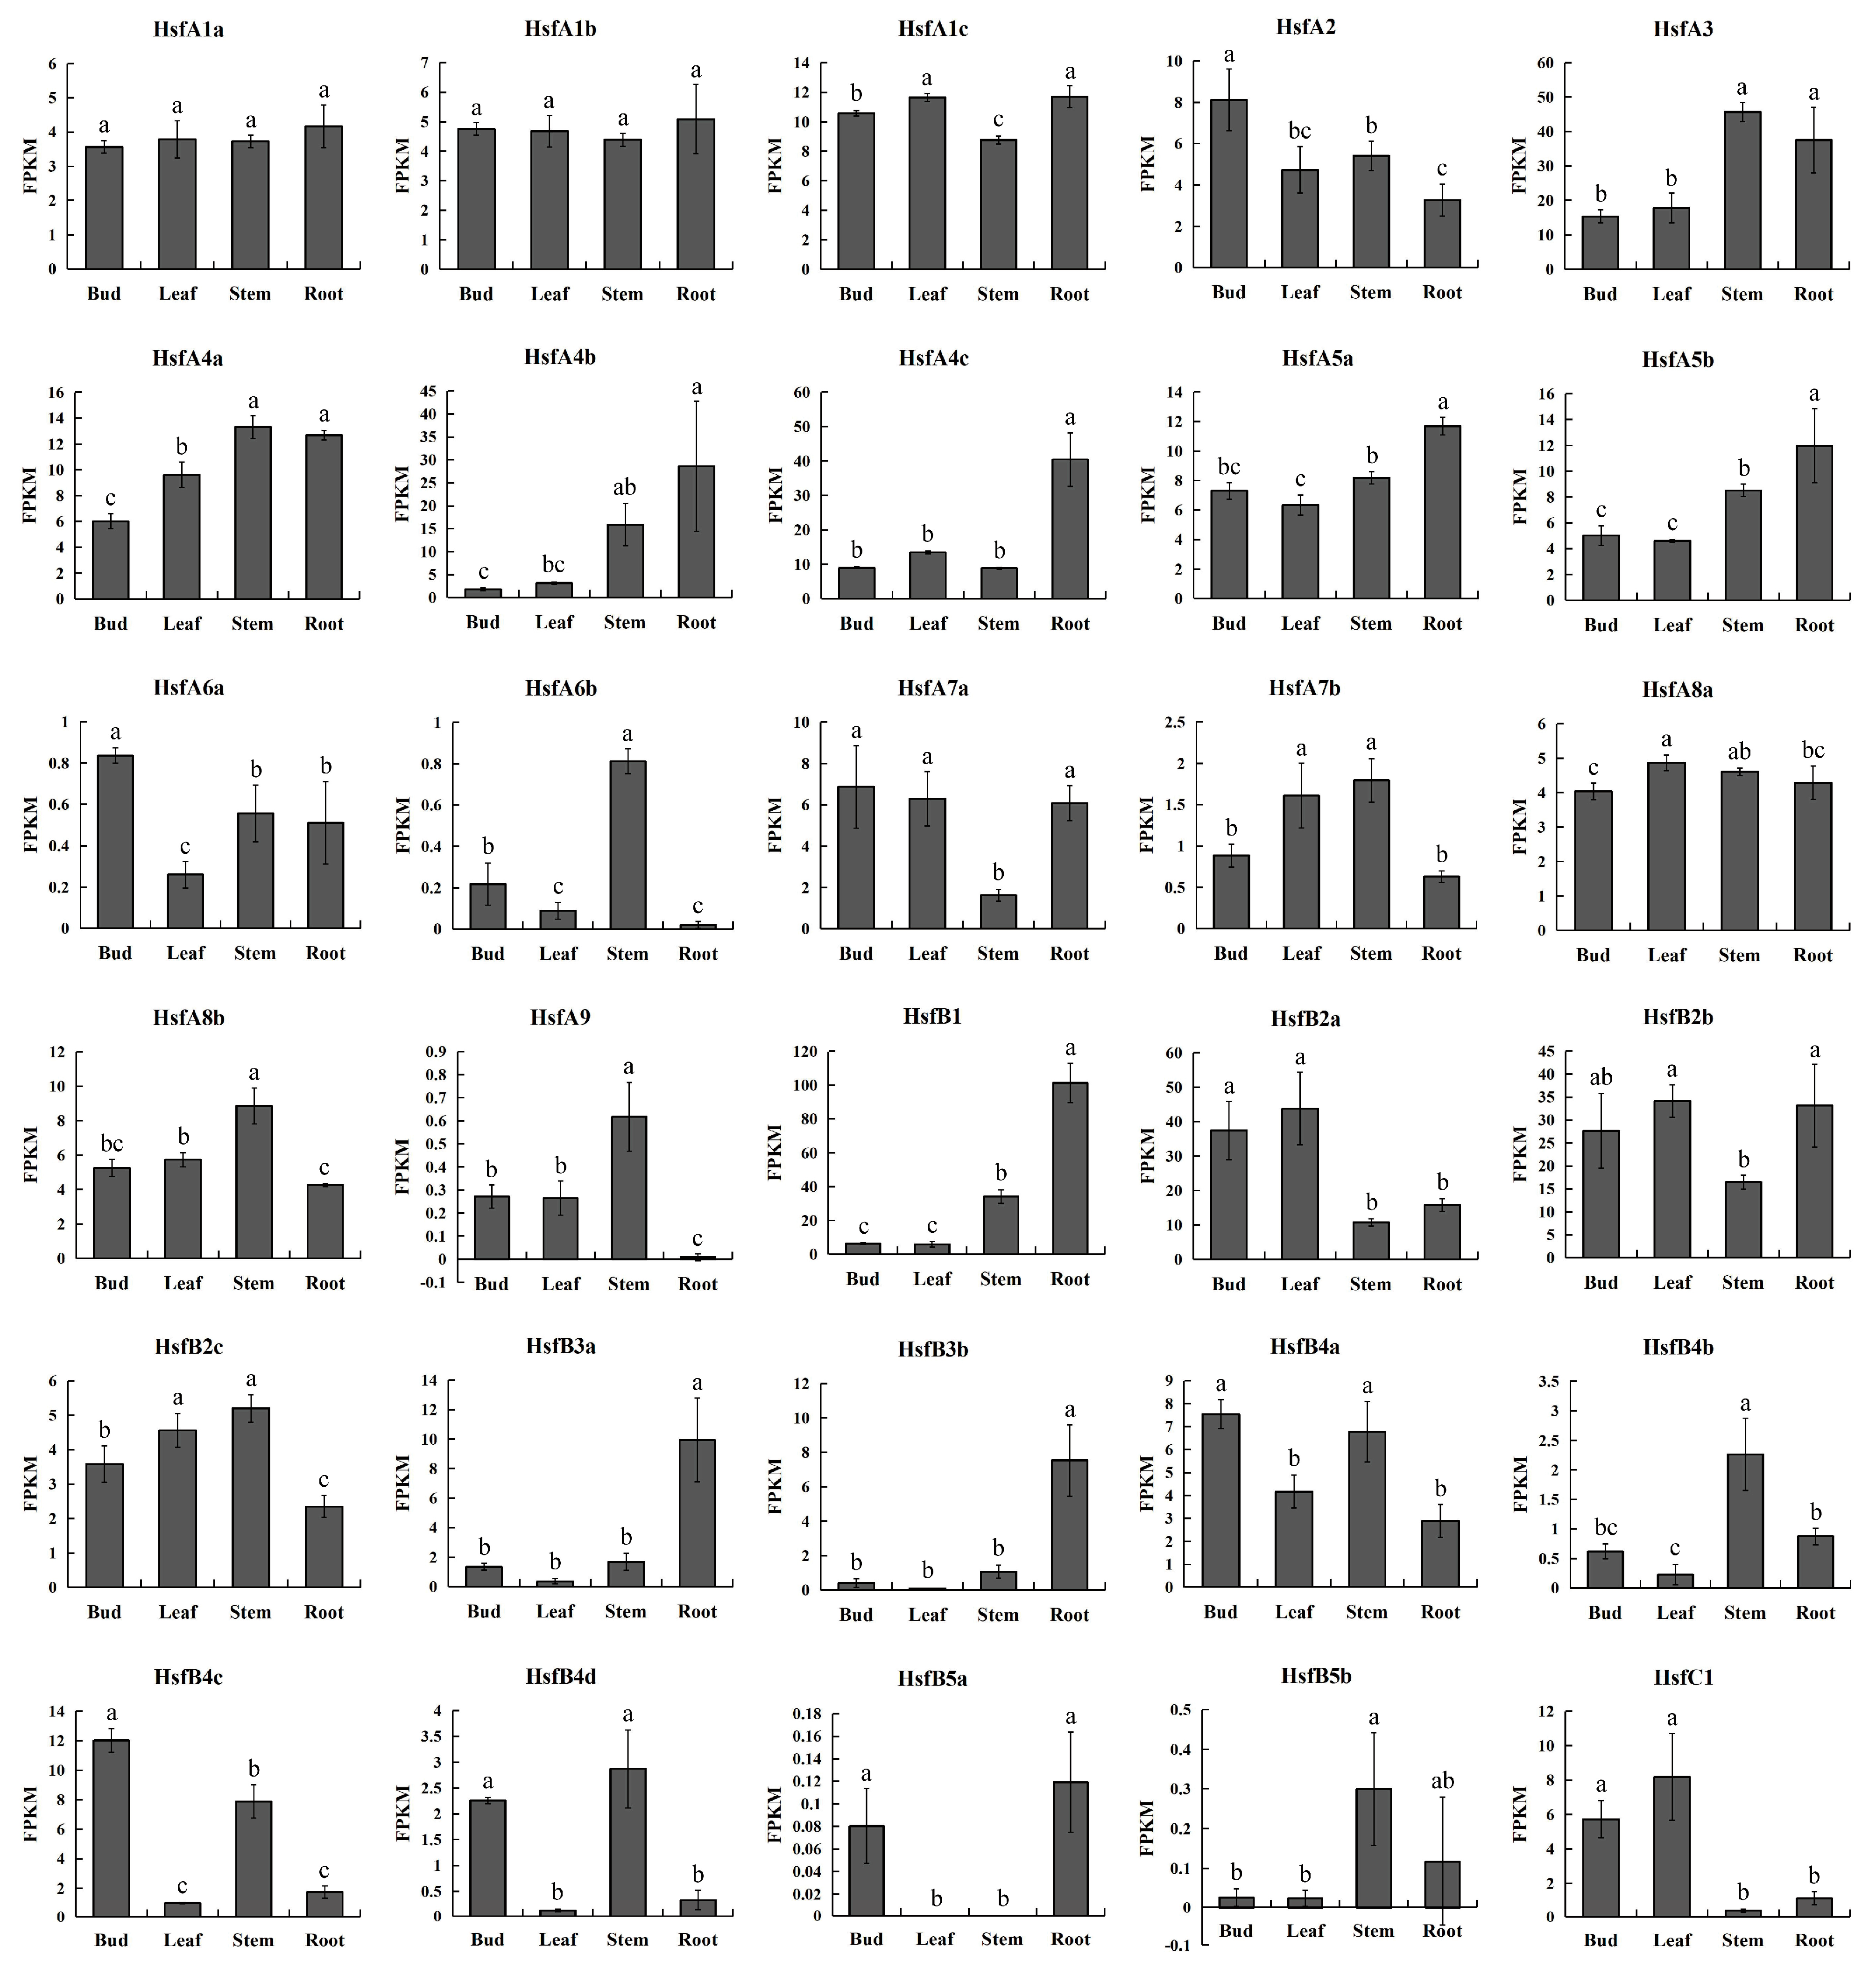
The differentiation and formation of organ tissues in the early developmental stages of plants are closely related to the regulation of gene expression. To explore the potential role of the HSF genes in poplar development, RNA-Seq was used to analyze the gene expression in the buds, leaves, stems, and roots of poplar seedlings. In general, the expression abundance of HsfA3, HsfB2a, and HsfB2b in the four tissues was high, while HsfA6a, HsfA6b, HsfA9, HsfB5a, and HsfB5b were very low in each tissue (Figure 9). Among all of the poplar HSF genes, HsfB2a had the highest expression in the buds and leaves, HsfA3 had the highest expression in the stems, and HsfB1 had the highest expression in the roots (Figure 9). The results of the statistical analysis showed that the expression levels of HsfA1a and HsfA1b in the four tissues were not significantly different, and HsfA4c, HsfA7a, HsfB3a, and HsfB3b were significantly higher or lower in a specific tissue (Figure 9). In addition, we found that the expression of HsfA4b and HsfB1 had a large gradient in different tissues (Figure 9). Notably, some genes located in the same subgroup had similar expression patterns (e.g., HsfA1a and HsfA1b, HsfA5a and HsfA5b, HsfB3a and HsfB3b, HsfB4a and HsfB4d), but some are quite divergent (such as HsfA4a and HsfA4c, HsfA6a and HsfA6b, HsfA7a and HsfA7b, HsfB2a and HsfB2c, HsfB4b and HsfB4c, HsfB5a and HsfB5b), suggesting that there may be synergistic relationships among the HSF subgroup genes and functional divergence may have occurred during evolution. Taken together, these results provide insights into the function of the HSF genes during poplar development.

3.8. Gene Co-Expression Analysis

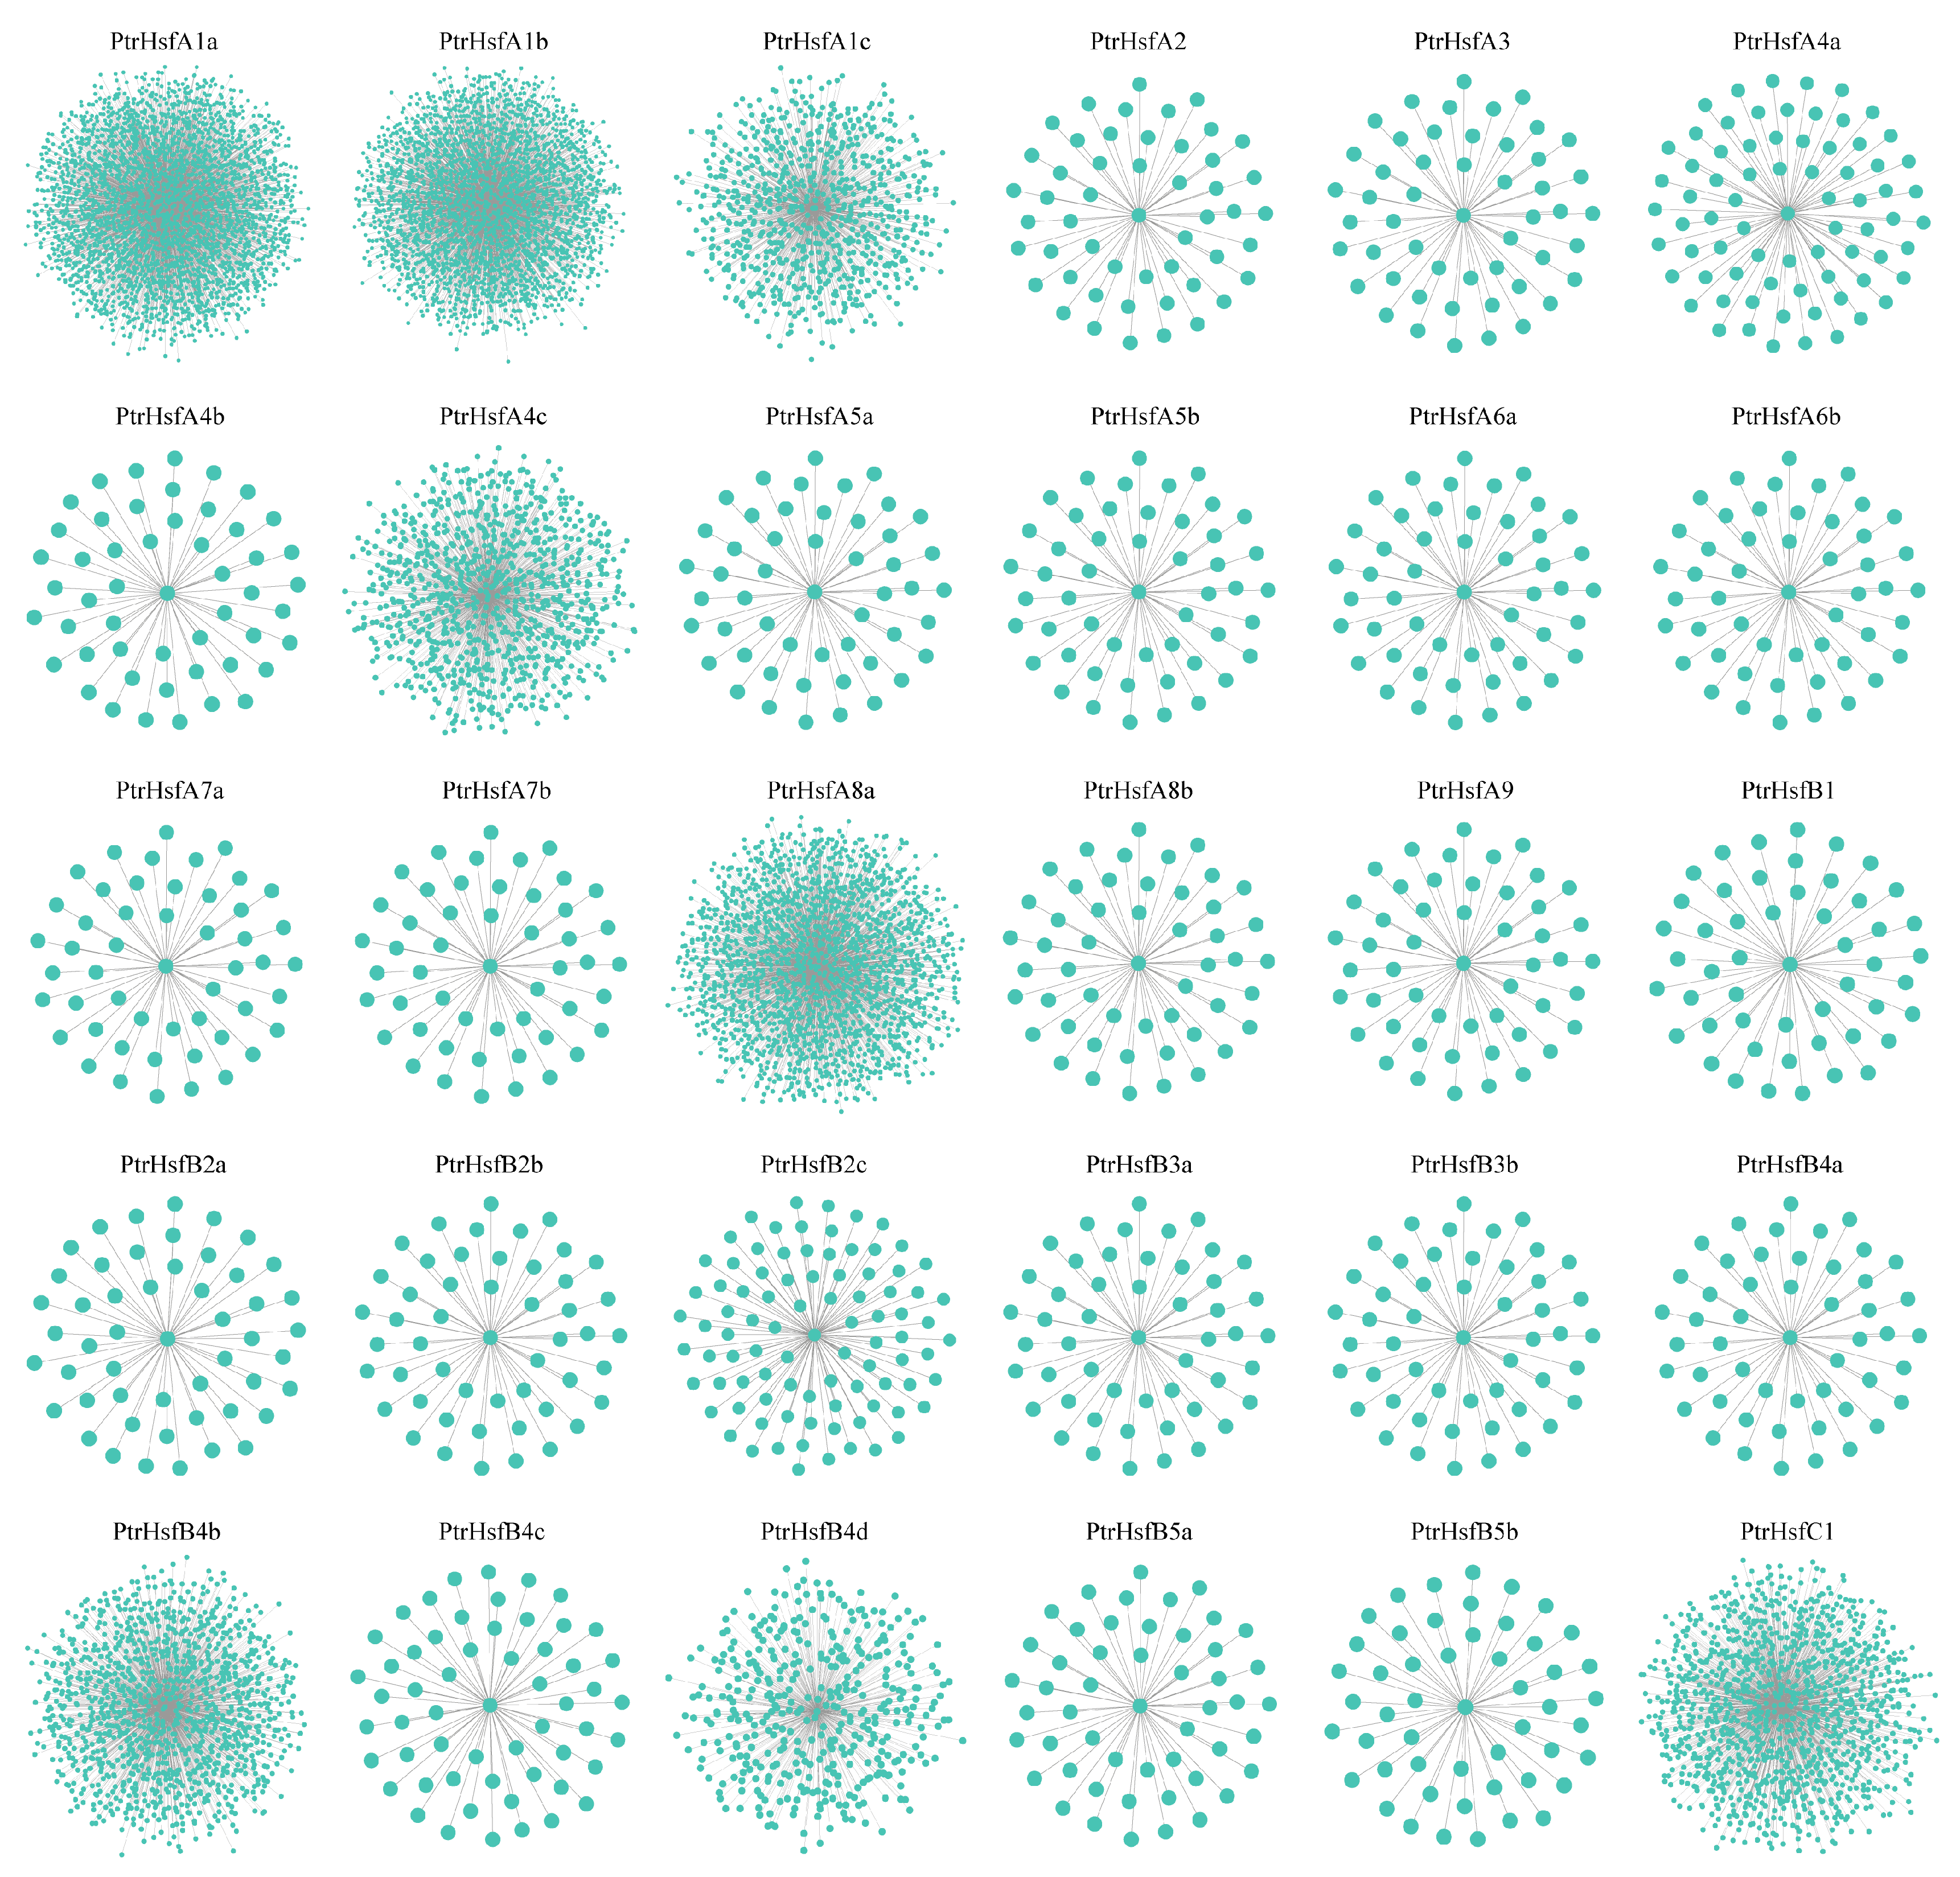
A large number of genes with similar expression patterns can be identified by co-expression analysis, which helps to analyze the biological processes and signaling pathways that the genes are involved in. In this study, we identified the co-expressed genes of all of the poplar HSF family genes, and analyzed the biological processes and molecular functions that they might be involved in. As shown in Figure 10 and Data S2, a total of 30 co-expression networks centered on the poplar HSF genes were obtained. Among these networks, the network centered on PtrHsfA1a, PtrHsfA1b, PtrHsfA1c, PtrHsfA4c, PtrHsfA8a, PtrHsfB4b, and PtrHsfC1 is larger, and contained 2963, 2702, 788, 917, 1887, 1212, and 1205 genes, respectively. The results of the gene set GO enrichment analysis showed that all of the gene sets obtained enrichment data, except the gene set centered on PtrHsfB5a (Data S3). It is noteworthy that many of the gene sets were significantly enriched in the molecular functions and biological processes related to growth and development, biotic and abiotic stress responses, and epigenetic modification (Data S3). For example, the co-expression gene network centered on PtrHsfA1a is significantly enriched in histone methyltransferase activity, ubiquitin-protein transferase activity, histone acetyltransferase activity, ubiquitin protein ligase activity, protein methylation, histone modification, epigenetic regulation of gene expression, methylation, protein ubiquitination, glycosylation, positive regulation of phosphorylation, regulation of response to stimulus, regulation of developmental process, etc. The co-expressed gene network centered on PtrHsfA2 was significantly enriched in response to temperature stimulus, reactive oxygen species, abiotic stimulus, stress, and other biological processes. The co-expressed gene network centered on PtrHsfB1 was significantly enriched in response to bacterium, biotic stim-ulus, external biotic stimulus, and other biological processes. The co-expressed gene network centered on PtrHsfA7a was significantly enriched in biological processes such as embryo development, cell differentiation, and developmental process. These results provide an important reference for understanding the function and regulatory mechanism of the HSF genes in poplar.

4. Discussion

HSF transcription factors are widely distributed in plants and play key roles in the processes of growth and development and in response to stresses [15]. Previous functional studies of poplar HSF genes were limited and focused on the responses to abiotic stresses. Therefore, it is important to use bioinformatics methods to analyze the characteristics of these proteins, clarify their gene expression patterns, and explore their possible molecular functions and the biological processes involved. In the previous study, the researchers identified 30 poplar HSF genes based on the genome of P. trichocarpa v3.1, focusing the analysis on the evolutionary divergence of the duplicated HSF genes in poplar [47]. This study revealed that the poplar Hsf gene family has undergone expansion and evolution through whole-genome duplication through paralogic pair analysis and inferred that the duplicated Hsf genes have undergone subfunctionalization or neofunctionalization during evolution through gene expression pattern analysis [47]. Using correlation analysis and promoter similarity, they explored the possible influence of evolutionary processes on the gene promoter similarity and gene expression [47]. The potential functions of the genes and their evolutionary divergence were also investigated by co-expression network analysis, alternative splicing analysis, single nucleotide polymorphism analysis, and protein structure analysis [47]. In contrast to previous studies that have focused on the evolutionary divergence of poplar HSF genes, we focused on the potential functions and regulatory mechanisms of HSF genes to facilitate the construction of gene regulatory networks. In this study, we used rigorous criteria and the P. trichocarpa v4.1 database to identify a total of 30 members of the poplar HSF transcription factor family, named PtrHsfA1aPtrHsfC1. By them contrasting with the previous identifications, we found that the annotation information of 18 out of the 30 poplar HSF genes had changed in the updated database and that PtrHsfC1 was mapped to chromosome 18 and assigned a new gene ID. Through phylogenetic analysis, these proteins were divided into three groups and 15 subgroups. In contrast to previous studies that focused on the 3D structure and domain distribution of poplar HSF proteins [47], we focused on the composition and characteristics of the domains. The results of sequence characterization showed that, similarly to other plants, the poplar HSF members shared a conserved DNA binding domain composed of three helical bundles (α1, α2, and α3) and four antiparallel ß-sheets. The oligomerization domains of the different groups had typical characteristics, that is, there were 21, zero, and seven amino acid residues inserted in the HR-A/B region of the members of group A, B, and C, respectively. The physicochemical properties of poplar HSF proteins vary greatly, but all of them are predicted to be localized in the nucleus. The results of the gene structure analysis showed that 29 of the 30 HSF genes had only two exons and one intron. Through motif analysis of the proteins, some motifs with an unknown function and specific distribution were found in the poplar HSF proteins, which may be associated with the functional diversity of the HSF proteins.
As the binding and action sites of upstream regulators, the cis-acting elements on gene promoters play an important role in gene regulation. Previous studies have analyzed the promoter similarity between poplar HSF paralogous gene pairs and found that evolutionary processes may lead to differences in the promoter similarity, which in turn directly affect the gene expression similarity [47]. Here, we focused on the element distribution of gene promoters and the biological processes they may participate in. By analyzing the cis-acting elements on the promoters of poplar HSF genes, we found a large number of hormonal and stress responsive elements. Phytohormones synergistically regulate various stages of plant growth and development and play important roles in the processes of the defense against various stresses. Abscisic acid is a hormone that is commonly associated with plant responses to stresses and plays an important role in a variety of plant physiological processes, such as stomatal closure, cuticle wax accumulation, leaf senescence, bud dormancy, seed germination, osmotic regulation, and growth inhibition [48]. Ethylene is a gaseous hormone in plants, which plays an important regulatory role in promoting fruit ripening, cell division and expansion, tissue differentiation, seed germination, root hair formation, flowering, and sex determination. It is also involved in the plant response to stress, such as pathogen infection, salinity, drought, hypoxia, cold, and heat [49]. Cytokinin regulate many of the developmental processes throughout the plant life cycle and play important roles in stress response [50]. Brassinosteroid regulates many important traits, including plant height, leaf angle, grain size, tiller, flowering, and senescence, and plays a role in plant adaptation to the environment [51]. Gibberellin plays an important role in the whole life cycle of flowering plants, promoting cell division and elongation, seed germination, root growth, and flowering [52]. Jasmonic acid plays a key role in all aspects of plant growth, including developmental processes and the defense against pests and pathogens [53]. Auxin is one of the earliest discovered and most extensively studied plant hormones, which not only plays a role in plant development and environmental adaptation, but also acts as an important signaling molecule to coordinate the communication between shoots and roots, different tissues, and even different cells [54]. Salicylic acid can regulate processes such as seed germination, vegetative growth, photosynthesis, respiration, thermogenesis, flower formation, seed production, and senescence, and mediate the plant immune responses and responses to abiotic stresses [55]. Strigolactone can inhibit plant branching, regulate root structure, increase root hair length, inhibit adventitious roots, promote secondary growth, and promote leaf senescence [56]. Therefore, HSF genes may play an important role in multiple stages of poplar growth and development and resistance to stresses.
In contrast to yeast, Drosophila, and vertebrates, which have only a few HSF proteins, the plant HSF family is characterized by a high degree of complexity due to its expansion in evolutionary processes through gene and whole-genome duplications [14,15]. Previous studies have shown that the poplar HSF gene family had expanded and evolved through whole-genome duplication by analyzing the number of HSF proteins in different species, phylogenetic relationships, and the density of collinear blocks in the chromosomal segment [47]. Here, we further reveal the expansion and evolution of poplar HSF family genes by identifying tandem duplication events, segmental duplication events, and collinearity relationships between the genes. Notably, no tandem duplication event was found in the poplar HSF genes, but segmental duplication events had occurred in 14 gene pairs, involving 22 poplar HSF genes and 15 chromosomes. The gene pairs we identified contain ten previously identified paralogous gene pairs and four novel gene pairs possessed segmental duplication events [47]. These results suggest that segmental duplication events may be one of the main reasons for the expansion of the HSF gene family in poplar. In addition, we analyzed the collinearity between the poplar HSF genes and genes from six representative species. The results showed that species with a closer evolutionary relationship tended to have more collinear gene pairs. For example, the number of collinearity gene pairs between poplar and dicots was significantly higher than that between poplar and monocots, especially with soybean, reaching 53. Subsequently, we calculated the Ka/Ks ratio for all of the identified gene pairs and found that all of the values were less than one, indicating that the HSF gene family may have experienced strong purifying selection pressure during evolution.
The biological processes in which genes may be involved can be inferred through the analysis of their expression patterns. Previously, the duplicated poplar HSF genes were shown to have undergone subfunctionalization or neofunctionalization during evolution by analyzing the expression changes and correlation of HSF genes in different tissues and in response to nitrogen nutrition [47]. In this study, we focused on exploring the potential functions of HSF genes in poplar and explored the possible synergistic relationship between the genes through cluster analysis. As we described earlier, phytohormones are widely involved in all stages of plant growth and development and in the biotic and abiotic stress responses. Therefore, we analyzed the expression patterns of poplar HSF genes in different tissues and under different hormone treatments. In addition, we analyzed the expression patterns of poplar HSF genes during early developmental stages by RNA-Seq. These results can provide an important reference for subsequent gene function analysis.
To further explore the biological processes that poplar HSF genes may be involved in, we constructed 30 gene co-expression networks centering on the poplar HSF genes and performed GO enrichment analysis. Compared with the previous analysis using 26 gene sets and ten enrichment results [47], we obtained 29 enrichment results from 30 gene sets, and found more genes that may be involved in specific biological processes. Particularly of note, many gene sets were significantly enriched in the molecular functions and biological processes related to growth and development, biotic and abiotic stress responses, and epigenetic modification. At present, it has been shown that the function of some HSF proteins requires epigenetic modification. GCN5 (histone acetyltransferase gene) mutation can reduce H3K9 and H3K14 acetylation in the core promoter region of the HSFA3 gene and limit its expression level under heat stress [57]. Tomato HsfA1, HsfB1, and HAC1/CBP (histone acetyl transferase) can form a ternary complex to significantly improve the promoter recognition and transcriptional activation efficiency [58]. The accumulation of H3K4 methylation is important for the heat stress response and transcription of heat stress memory, and this modification is HSFA2-dependent [59]. HsfA6a could interact with ubiquitin protein to mediate the transcription of Hsp101 in rice [60]. Therefore, our results lay the foundation for further understanding the functions and regulatory mechanisms of HSF genes in poplar.

5. Conclusions

In the present study, we identified 30 poplar HSF family members based on the latest genome annotation information and stringent criteria, followed by a systematic and comprehensive analysis of the HSF family. The results showed that the poplar HSF proteins were divided into three major groups (15 subgroups), and their DNA-binding domains and oligomerization domains shared similar characteristics with those in other species. The physicochemical properties of these proteins vary widely, but all are predicted to localize in the nucleus. The large number of hormone and stress response elements distributed on the gene promoters implies that these genes may play roles in multiple biological processes. The differences in the composition of the protein motifs among the different subgroups suggest that there may be functional differentiation of these proteins. The analysis results showed that no tandem duplication events occurred between the HSF genes distributed in 18 poplar chromosomes, but 14 gene pairs possessed segmental duplication events, implying that segmental duplication events may have been a major cause of the expansion of the poplar HSF gene family. A large number of colinear gene pairs were identified among the different species, which may provide a reference for future comparative genomics. In addition, through gene expression and co-expression network analysis, we obtained a large number of genes with tissue differential expression and hormone response, revealing important molecular functions and biological processes related to growth and development, biotic and abiotic stress responses, and epigenetic modifications.

Supplementary Materials

The following supporting information can be downloaded at: https://www.mdpi.com/article/10.3390/f14030510/s1, Table S1: Accession number and gene name of poplar HSF family members; Table S2: Physicochemical properties and subcellular localization of poplar HSF proteins; Table S3: Annotations of HSF protein sequence motifs; Table S4: Segmentally duplicated poplar HSF gene pairs; Table S5: List of syntenic gene pairs; Data S1: Cis-acting elements distributed on poplar HSF gene promoters; Data S2: Co-expression gene sets; Data S3: Go enrichment analysis of co-expressed gene sets.

Author Contributions

S.W. designed the research and modified the manuscript. K.Z. conducted data analysis and wrote the manuscript. Y.H. conducted the guidance of the discussion. H.D., L.Z., J.H. and X.J. conducted data analysis. All authors have read and agreed to the published version of the manuscript.

Funding

This research was funded by the Opening Project of State Key Laboratory of Tree Genetics and Breeding (K2022103), the Natural Science Foundation of Shanxi Province (202103021223150, 20210302123425), the Project of Science and Technology Innovation Fund of Shanxi Agricultural University (2021BQ107), the Biobreeding Project of Shanxi Agricultural University (YZGC140), the Excellent Doctoral Program of Shanxi Province (SXBYKY2022054).

Data Availability Statement

All of the data generated or analyzed during this study are included in this published article and its supplementary information files.

Conflicts of Interest

The authors declare no conflict of interest.

References

  1. Lu, X.; Zhang, X.; Duan, H.; Lian, C.; Liu, C.; Yin, W.; Xia, X. Three stress-responsive NAC transcription factors from Populus euphratica differentially regulate salt and drought tolerance in transgenic plants. Physiol. Plant. 2018, 162, 73–97. [Google Scholar] [CrossRef] [PubMed] [Green Version]
  2. Liu, Z.; Xie, Q.; Tang, F.; Wu, J.; Dong, W.; Wang, C.; Gao, C. The ThSOS3 Gene Improves the Salt Tolerance of Transgenic Tamarix hispida and Arabidopsis thaliana. Front. Plant Sci. 2020, 11, 597480. [Google Scholar] [CrossRef] [PubMed]
  3. Liu, Z.Y.; Li, X.P.; Zhang, T.Q.; Wang, Y.Y.; Wang, C.; Gao, C.Q. Overexpression of ThMYB8 mediates salt stress tolerance by directly activating stress-responsive gene expression. Plant Sci. 2021, 302, 110668. [Google Scholar] [CrossRef] [PubMed]
  4. Lei, X.; Liu, Z.; Xie, Q.; Fang, J.; Wang, C.; Li, J.; Wang, C.; Gao, C. Construction of two regulatory networks related to salt stress and lignocellulosic synthesis under salt stress based on a Populus davidiana × P. bolleana transcriptome analysis. Plant Mol. Biol. 2022, 109, 689–702. [Google Scholar] [CrossRef]
  5. Li, X.T.; Feng, X.Y.; Zeng, Z.; Liu, Y.; Shao, Z.Q. Comparative Analysis of HSF Genes From Secale cereale and its Triticeae Relatives Reveal Ancient and Recent Gene Expansions. Front. Genet. 2021, 12, 801218. [Google Scholar] [CrossRef]
  6. Sorger, P.K.; Pelham, H.R.B. Yeast heat shock factor is an essential DNA-binding protein that exhibits temperature-dependent phosphorylation. Cell 1988, 54, 855–864. [Google Scholar] [CrossRef]
  7. Scharf, K.D.; Rose, S.; Zott, W.; Schöffl, F.; Nover, L.; Schöff, F. Three tomato genes code for heat stress transcription factors with a region of remarkable homology to the DNA-binding domain of the yeast HSF. EMBO J. 1990, 9, 4495–4501. [Google Scholar] [CrossRef] [PubMed]
  8. Wang, X.; Shi, X.; Chen, S.; Ma, C.; Xu, S. Evolutionary Origin, Gradual Accumulation and Functional Divergence of Heat Shock Factor Gene Family with Plant Evolution. Front. Plant Sci. 2018, 9, 71. [Google Scholar] [CrossRef] [Green Version]
  9. Guo, J.; Wu, J.; Ji, Q.; Wang, C.; Luo, L.; Yuan, Y.; Wang, Y.; Wang, J. Genome-wide analysis of heat shock transcription factor families in rice and Arabidopsis. J. Genet. Genom. 2008, 35, 105–118. [Google Scholar] [CrossRef]
  10. Zhang, J.; Li, Y.; Jia, H.-X.; Li, J.-B.; Huang, J.; Lu, M.-Z.; Hu, J.-J. The heat shock factor gene family in Salix suchowensis: A genome-wide survey and expression profiling during development and abiotic stresses. Front. Plant Sci. 2015, 6, 748. [Google Scholar] [CrossRef] [Green Version]
  11. Scharf, K.D.; Berberich, T.; Ebersberger, I.; Nover, L. The plant heat stress transcription factor (Hsf) family: Structure, function and evolution. Biochim. Biophys. Acta 2012, 1819, 104–119. [Google Scholar] [CrossRef]
  12. Yu, T.; Bai, Y.; Liu, Z.; Wang, Z.; Yang, Q.; Wu, T.; Feng, S.; Zhang, Y.; Shen, S.; Li, Q.; et al. Large-scale analyses of heat shock transcription factors and database construction based on whole-genome genes in horticultural and representative plants. Hortic. Res. 2022, 9, uhac035. [Google Scholar] [CrossRef] [PubMed]
  13. Zhang, M.; Wang, Z.; Jian, S. Functional Characterization of Heat Shock Factor (CrHsf) Families Provide Comprehensive Insight into the Adaptive Mechanisms of Canavalia rosea (Sw.) DC. to Tropical Coral Islands. Int. J. Mol. Sci. 2022, 23, 12357. [Google Scholar] [CrossRef] [PubMed]
  14. von Koskull-Döring, P.; Scharf, K.D.; Nover, L. The diversity of plant heat stress transcription factors. Trends Plant Sci. 2007, 12, 452–457. [Google Scholar] [CrossRef]
  15. Andrási, N.; Pettkó-Szandtner, A.; Szabados, L. Diversity of plant heat shock factors: Regulation, interactions, and functions. J. Exp. Bot. 2021, 72, 1558–1575. [Google Scholar] [CrossRef] [PubMed]
  16. Yoshida, T.; Ohama, N.; Nakajima, J.; Kidokoro, S.; Mizoi, J.; Nakashima, K.; Maruyama, K.; Kim, J.M.; Seki, M.; Todaka, D.; et al. Arabidopsis HsfA1 transcription factors function as the main positive regulators in heat shock-responsive gene expression. Mol. Genet. Genom. 2011, 286, 321–332. [Google Scholar] [CrossRef] [PubMed]
  17. Fortunati, A.; Piconese, S.; Tassone, P.; Ferrari, S.; Migliaccio, F. A new mutant of Arabidopsis disturbed in its roots, right-handed slanting, and gravitropism defines a gene that encodes a heat-shock factor. J. Exp. Bot. 2008, 59, 1363–1374. [Google Scholar] [CrossRef] [PubMed] [Green Version]
  18. Pajerowska-Mukhtar, K.M.; Wang, W.; Tada, Y.; Oka, N.; Tucker, C.L.; Fonseca, J.P.; Dong, X. The HSF-like transcription factor TBF1 is a major molecular switch for plant growth-to-defense transition. Curr. Biol. 2012, 22, 103–112. [Google Scholar] [CrossRef] [PubMed] [Green Version]
  19. Kolmos, E.; Chow, B.Y.; Pruneda-Paz, J.L.; Kay, S.A. HsfB2b-mediated repression of PRR7 directs abiotic stress responses of the circadian clock. Proc. Natl. Acad. Sci. USA 2014, 111, 16172–16177. [Google Scholar] [CrossRef] [PubMed] [Green Version]
  20. Wunderlich, M.; Gross-Hardt, R.; Schöffl, F. Heat shock factor HSFB2a involved in gametophyte development of Arabidopsis thaliana and its expression is controlled by a heat-inducible long non-coding antisense RNA. Plant Mol. Biol. 2014, 85, 541–550. [Google Scholar] [CrossRef] [Green Version]
  21. Bechtold, U.; Albihlal, W.S.; Lawson, T.; Fryer, M.J.; Sparrow, P.A.C.; Richard, F.; Persad, R.; Bowden, L.; Hickman, R.; Martin, C.; et al. Arabidopsis HEAT SHOCK TRANSCRIPTION FACTORA1b overexpression enhances water productivity, resistance to drought, and infection. J. Exp. Bot. 2013, 64, 3467–3481. [Google Scholar] [CrossRef] [Green Version]
  22. Yang, W.; Ju, Y.; Zuo, L.; Shang, L.; Li, X.; Li, X.; Feng, S.; Ding, X.; Chu, Z. OsHsfB4d Binds the Promoter and Regulates the Expression of OsHsp18.0-CI to Resistant Against Xanthomonas Oryzae. Rice 2020, 13, 28. [Google Scholar] [CrossRef]
  23. Nishizawa-Yokoi, A.; Nosaka, R.; Hayashi, H.; Tainaka, H.; Maruta, T.; Tamoi, M.; Ikeda, M.; Ohme-Takagi, M.; Yoshimura, K.; Yabuta, Y.; et al. HsfA1d and HsfA1e Involved in the Transcriptional Regulation of HsfA2 Function as Key Regulators for the Hsf Signaling Network in Response to Environmental Stress. Plant Cell Physiol. 2011, 52, 933–945. [Google Scholar] [CrossRef] [Green Version]
  24. Wang, J.; Chen, L.; Long, Y.; Si, W.; Cheng, B.; Jiang, H. A Novel Heat Shock Transcription Factor (ZmHsf08) Negatively Regulates Salt and Drought Stress Responses in Maize. Int. J. Mol. Sci. 2021, 22, 11922. [Google Scholar] [CrossRef] [PubMed]
  25. Iqbal, M.Z.; Jia, T.; Tang, T.; Anwar, M.; Ali, A.; Hassan, M.J.; Zhang, Y.; Tang, Q.; Peng, Y. A Heat Shock Transcription Factor TrHSFB2a of White Clover Negatively Regulates Drought, Heat and Salt Stress Tolerance in Transgenic Arabidopsis. Int. J. Mol. Sci. 2022, 23, 12769. [Google Scholar] [CrossRef]
  26. Tuskan, G.A.; Difazio, S.; Jansson, S.; Bohlmann, J.; Grigoriev, I.; Hellsten, U.; Putnam, N.; Ralph, S.; Rombauts, S.; Salamov, A. The genome of black cottonwood, Populus trichocarpa (Torr. & Gray). Science 2006, 313, 1596–1604. [Google Scholar]
  27. Zhang, H.; Yang, J.; Li, W.; Chen, Y.; Lu, H.; Zhao, S.; Li, D.; Wei, M.; Li, C. PuHSFA4a Enhances Tolerance To Excess Zinc by Regulating Reactive Oxygen Species Production and Root Development in Populus. Plant Physiol. 2019, 180, 2254–2271. [Google Scholar] [CrossRef] [Green Version]
  28. Shen, Z.; Yao, J.; Sun, J.; Chang, L.; Wang, S.; Ding, M.; Qian, Z.; Zhang, H.; Zhao, N.; Sa, G.; et al. Populus euphratica HSF binds the promoter of WRKY1 to enhance salt tolerance. Plant Sci. 2015, 235, 89–100. [Google Scholar] [CrossRef] [PubMed]
  29. Li, H.-G.; Yang, Y.; Liu, M.; Zhu, Y.; Wang, H.-L.; Feng, C.-H.; Niu, M.-X.; Liu, C.; Yin, W.; Xia, X. The in vivo performance of a heat shock transcription factor from Populus euphratica, PeHSFA2, promises a prospective strategy to alleviate heat stress damage in poplar. Environ. Exp. Bot. 2022, 201, 104940. [Google Scholar] [CrossRef]
  30. Goodstein, D.M.; Shu, S.; Howson, R.; Neupane, R.; Hayes, R.D.; Fazo, J.; Mitros, T.; Dirks, W.; Hellsten, U.; Putnam, N.; et al. Phytozome: A comparative platform for green plant genomics. Nucleic Acids Res. 2012, 40, D1178–D1186. [Google Scholar] [CrossRef]
  31. El-Gebali, S.; Mistry, J.; Bateman, A.; Eddy, S.R.; Luciani, A.; Potter, S.C.; Qureshi, M.; Richardson, L.J.; Salazar, G.A.; Smart, A.; et al. The Pfam protein families database in 2019. Nucleic Acids Res. 2019, 47, D427–D432. [Google Scholar] [CrossRef]
  32. Letunic, I.; Bork, P. 20 years of the SMART protein domain annotation resource. Nucleic Acids Res. 2018, 46, D493–D496. [Google Scholar] [CrossRef]
  33. Lamesch, P.; Berardini, T.Z.; Li, D.; Swarbreck, D.; Wilks, C.; Sasidharan, R.; Muller, R.; Dreher, K.; Alexander, D.L.; Garcia-Hernandez, M.; et al. The Arabidopsis Information Resource (TAIR): Improved gene annotation and new tools. Nucleic Acids Res. 2012, 40, D1202–D1210. [Google Scholar] [CrossRef]
  34. Chen, C.; Chen, H.; Zhang, Y.; Thomas, H.R.; Frank, M.H.; He, Y.; Xia, R. TBtools: An Integrative Toolkit Developed for Interactive Analyses of Big Biological Data. Mol. Plant 2020, 13, 1194–1202. [Google Scholar] [CrossRef]
  35. Letunic, I.; Bork, P. Interactive Tree Of Life (iTOL) v5: An online tool for phylogenetic tree display and annotation. Nucleic Acids Res. 2021, 49, W293–W296. [Google Scholar] [CrossRef]
  36. Thompson, J.D.; Gibson, T.J.; Plewniak, F.; Jeanmougin, F.; Higgins, D.G. The CLUSTAL_X windows interface: Flexible strategies for multiple sequence alignment aided by quality analysis tools. Nucleic Acids Res. 1997, 25, 4876–4882. [Google Scholar] [CrossRef] [PubMed] [Green Version]
  37. Crooks, G.E.; Hon, G.; Chandonia, J.M.; Brenner, S.E. WebLogo: A sequence logo generator. Genome Res. 2004, 14, 1188–1190. [Google Scholar] [CrossRef] [PubMed] [Green Version]
  38. Hall, T.A. Bioedit: A user-friendly biological sequence alignment editor and analysis program for Windows 95/98/ NT. Nucleic Acids Symp. Ser. 1999, 41, 95–98. [Google Scholar]
  39. Gasteiger, E.; Hoogland, C.; Gattiker, A.; Duvaud, S.e.; Wilkins, M.R.; Appel, R.D.; Bairoch, A. Protein Identification and Analysis Tools on the ExPASy Server. In The Proteomics Protocols Handbook; Walker, J.M., Ed.; Humana Press: Totowa, NJ, USA, 2005; pp. 571–607. [Google Scholar]
  40. Horton, P.; Park, K.J.; Obayashi, T.; Fujita, N.; Harada, H.; Adams-Collier, C.J.; Nakai, K. WoLF PSORT: Protein localization predictor. Nucleic Acids Res. 2007, 35, W585–W587. [Google Scholar] [CrossRef] [Green Version]
  41. Hu, B.; Jin, J.; Guo, A.Y.; Zhang, H.; Luo, J.; Gao, G. GSDS 2.0: An upgraded gene feature visualization server. Bioinformatics 2015, 31, 1296–1297. [Google Scholar] [CrossRef] [PubMed] [Green Version]
  42. Lescot, M.; Déhais, P.; Thijs, G.; Marchal, K.; Moreau, Y.; Van de Peer, Y.; Rouzé, P.; Rombauts, S. PlantCARE, a database of plant cis-acting regulatory elements and a portal to tools for in silico analysis of promoter sequences. Nucleic Acids Res. 2002, 30, 325–327. [Google Scholar] [CrossRef] [PubMed]
  43. Bailey, T.L.; Boden, M.; Buske, F.A.; Frith, M.; Grant, C.E.; Clementi, L.; Ren, J.; Li, W.W.; Noble, W.S. MEME SUITE: Tools for motif discovery and searching. Nucleic Acids Res. 2009, 37, W202–W208. [Google Scholar] [CrossRef] [PubMed]
  44. Wang, Y.; Tang, H.; Debarry, J.D.; Tan, X.; Li, J.; Wang, X.; Lee, T.H.; Jin, H.; Marler, B.; Guo, H.; et al. MCScanX: A toolkit for detection and evolutionary analysis of gene synteny and collinearity. Nucleic Acids Res. 2012, 40, e49. [Google Scholar] [CrossRef] [PubMed] [Green Version]
  45. Shannon, P.; Markiel, A.; Ozier, O.; Baliga, N.S.; Wang, J.T.; Ramage, D.; Amin, N.; Schwikowski, B.; Ideker, T. Cytoscape: A software environment for integrated models of biomolecular interaction networks. Genome Res. 2003, 13, 2498–2504. [Google Scholar] [CrossRef] [PubMed]
  46. Mistry, J.; Finn, R.D.; Eddy, S.R.; Bateman, A.; Punta, M. Challenges in homology search: HMMER3 and convergent evolution of coiled-coil regions. Nucleic Acids Res. 2013, 41, e121. [Google Scholar] [CrossRef] [PubMed] [Green Version]
  47. Liu, B.; Hu, J.; Zhang, J. Evolutionary Divergence of Duplicated Hsf Genes in Populus. Cells 2019, 8, 438. [Google Scholar] [CrossRef] [PubMed] [Green Version]
  48. Chen, K.; Li, G.-J.; Bressan, R.A.; Song, C.-P.; Zhu, J.-K.; Zhao, Y. Abscisic acid dynamics, signaling, and functions in plants. J. Integr. Plant Biol. 2020, 62, 25–54. [Google Scholar] [CrossRef] [PubMed] [Green Version]
  49. Zhao, H.; Yin, C.-C.; Ma, B.; Chen, S.-Y.; Zhang, J.-S. Ethylene signaling in rice and Arabidopsis: New regulators and mechanisms. J. Integr. Plant Biol. 2021, 63, 102–125. [Google Scholar] [CrossRef]
  50. Zürcher, E.; Müller, B. Cytokinin Synthesis, Signaling, and Function—Advances and New Insights. Int. Rev. Cell Mol. Biol. 2016, 324, 1–38. [Google Scholar] [CrossRef]
  51. Tong, H.; Chu, C. Functional Specificities of Brassinosteroid and Potential Utilization for Crop Improvement. Trends Plant Sci. 2018, 23, 1016–1028. [Google Scholar] [CrossRef]
  52. Sun, T.P. The molecular mechanism and evolution of the GA-GID1-DELLA signaling module in plants. Curr. Biol. 2011, 21, R338–R345. [Google Scholar] [CrossRef] [Green Version]
  53. Wan, S.; Xin, X.F. Regulation and integration of plant jasmonate signaling: A comparative view of monocot and dicot. J. Genet. Genom. 2022, 49, 704–714. [Google Scholar] [CrossRef]
  54. Yu, Z.; Zhang, F.; Friml, J.; Ding, Z. Auxin signaling: Research advances over the past 30 years. J. Integr. Plant Biol. 2022, 64, 371–392. [Google Scholar] [CrossRef]
  55. Rivas-San Vicente, M.; Plasencia, J. Salicylic acid beyond defence: Its role in plant growth and development. J. Exp. Bot. 2011, 62, 3321–3338. [Google Scholar] [CrossRef] [PubMed] [Green Version]
  56. Chesterfield, R.J.; Vickers, C.E.; Beveridge, C.A. Translation of Strigolactones from Plant Hormone to Agriculture: Achievements, Future Perspectives, and Challenges. Trends Plant Sci. 2020, 25, 1087–1106. [Google Scholar] [CrossRef] [PubMed]
  57. Hu, Z.; Song, N.; Zheng, M.; Liu, X.; Liu, Z.; Xing, J.; Ma, J.; Guo, W.; Yao, Y.; Peng, H.; et al. Histone acetyltransferase GCN5 is essential for heat stress-responsive gene activation and thermotolerance in Arabidopsis. Plant J. 2015, 84, 1178–1191. [Google Scholar] [CrossRef] [Green Version]
  58. Bharti, K.; von Koskull-Döring, P.; Bharti, S.; Kumar, P.; Tintschl-Körbitzer, A.; Treuter, E.; Nover, L. Tomato Heat Stress Transcription Factor HsfB1 Represents a Novel Type of General Transcription Coactivator with a Histone-Like Motif Interacting with the Plant CREB Binding Protein Ortholog HAC1[W]. Plant Cell 2004, 16, 1521–1535. [Google Scholar] [CrossRef] [Green Version]
  59. Zhao, J.; Lu, Z.; Wang, L.; Jin, B. Plant Responses to Heat Stress: Physiology, Transcription, Noncoding RNAs, and Epigenetics. Int. J. Mol. Sci. 2021, 22, 117. [Google Scholar] [CrossRef]
  60. Singh, G.; Sarkar, N.K.; Grover, A. Hsp70, sHsps and ubiquitin proteins modulate HsfA6a-mediated Hsp101 transcript expression in rice (Oryza sativa L.). Physiol. Plant. 2021, 173, 2055–2067. [Google Scholar] [CrossRef] [PubMed]
Figure 1. Framework diagram for the analysis of this study.
Forests 14 00510 g001
Figure 2. Dendrogram of poplar and Arabidopsis HSF proteins. The dendrogram was constructed using TBtools with the maximum likelihood method and 1000 bootstrap tests. Each class of proteins is marked by a specific color.
Forests 14 00510 g002
Figure 3. Visualization of the DNA binding domains and oligomerization domain of poplar HSF proteins. (A) DNA binding domains. The degree of conservation of each position sequence is indicated by the height of the letter pile at that position. (B) Oligomerization domain.
Forests 14 00510 g003
Figure 4. DNA structure and protein motifs of poplar HSF family members. Exons and the 5’ UTR/3’ UTR are shown in black and cyan bars. Black lines indicate introns. Different motifs are represented by boxes with specific colors. The proteins were ranked according to their classification.
Forests 14 00510 g004
Figure 5. Chromosomal distribution and tandem duplication events identification of poplar HSF genes. No tandem duplication event occurred between genes.
Forests 14 00510 g005
Figure 6. Collinearity analysis among poplar HSF genes. Chromosomes 01–19 of poplar are represented by yellow rectangles. The lines, heatmaps, and histograms in orange rectangles represent gene density on chromosomes. Gray lines indicate all collinearity blocks in the poplar genome, and red lines between chromosomes indicate gene pairs with segmental duplication.
Forests 14 00510 g006
Figure 7. Collinearity analysis between the poplar HSF genes and the genes of six other plant species. Gray lines indicate collinearity blocks that are homologous to other genomes in poplar. The red lines represent gene pairs with collinearity relationships.
Forests 14 00510 g007
Figure 8. Poplar HSF gene expression analysis in different tissues and hormonal responses. (A) Heatmap of HSF gene expression in different tissues of poplar. (B) Heatmap of HSF gene expression in response to different phytohormones in poplar leaves.
Forests 14 00510 g008
Figure 9. RNA-Seq analysis of poplar HSF genes during early development. The bud, leaf, stem, and root tissues of one-month-old poplar tissue culture seedlings were collected for sequencing. Gene expression was standardized using FPKM. Error bars are standard deviations from the biologic replicates. Different lowercase letters represent significant differences between groups (One-way ANOVA, p < 0.05).
Forests 14 00510 g009
Figure 10. TF-centered co-expression networks of 30 poplar HSF genes. Dots represent genes, and lines indicate genes with co-expression relationships.
Forests 14 00510 g010
Disclaimer/Publisher’s Note: The statements, opinions and data contained in all publications are solely those of the individual author(s) and contributor(s) and not of MDPI and/or the editor(s). MDPI and/or the editor(s) disclaim responsibility for any injury to people or property resulting from any ideas, methods, instructions or products referred to in the content.