Article

Water Retention Capacity of Leaf Litter According to Field Lysimetry

1
Department of Agriculture, Forestry and Bioresources, Seoul National University, Seoul 08826, Republic of Korea
2
Research Institute of Agriculture and Life Sciences, Seoul National University, Seoul 08826, Republic of Korea
3
Interdisciplinary Program in Agricultural and Forest Meteorology, Seoul National University, Seoul 08826, Republic of Korea
4
National Center for AgroMeteorology, Seoul National University, Seoul 08826, Republic of Korea
*
Author to whom correspondence should be addressed.
Forests 2023, 14(3), 478; https://doi.org/10.3390/f14030478
Submission received: 8 February 2023 / Revised: 21 February 2023 / Accepted: 24 February 2023 / Published: 27 February 2023
(This article belongs to the Special Issue Forest Ecohydrology: From Theory to Practice)

Abstract

:
The water retention capacity of forest leaf litter was estimated through lysimeter measurements under field conditions. Six lysimeters were placed in Pinus koraiensis and Quercus acutissima forests and filled with the surrounding leaf litter to represent the effects of litter type on the water retention capacity. Two years of measurements for rainfall and litter weight have been conducted in all lysimeters at 30 min intervals. Field measurements showed that P. koraiensis litter stored more water during rainfall periods than did Q. acutissima litter. As a result, immediately after the cessation of rainfall, 1.82 mm and 3.00 mm of water were retained per unit mass of Q. acutissima and P. koraiensis litter, respectively. Following rainfall, after the gravitational flow had entirely drained, the remaining water adhered to the litter was estimated to be 1.66 ± 1.72 mm and 2.72 ± 2.82 mm per unit mass per rainfall event for Q. acutissima and P. koraiensis litter, respectively. During the study period, approximately 83.7% of incident rainfall drained into the uppermost soil layer below the Q. acutissima litter, whereas 84.5% of rainfall percolated through the P. koraiensis litter. The moisture depletion curves indicated that 50% of the water retained in the Q. acutissima and P. koraiensis litter was lost via evaporation within 27 h and 90 h after the cessation of rainfall, respectively. This study demonstrated the water retention storage of leaf litter and its contribution to the water balance over floor litter according to litter and rainfall characteristics. The results also proved that lysimetry is a reliable method to quantify the variation of litter moisture under natural conditions.

1. Introduction

Forests occupy approximately 63% of the land area of the Republic of Korea. The national forest restoration project led to an increase in the volume of forests from 7.3 m3/ha in 1955 to 165.2 m3/ha in 2020 [1], thereby contributing to the development of a thick layer of leaf litter on the forest floors. Fallen leaves resting on the underlying mineral soil are the source of most plant nutrients and provide habitats for a great diversity of organisms. Hydrologically, leaf litter on the forest floor acts as a porous interface between mineral soil and ambient air and influences the processes of subsurface runoff, overland flow, and soil erosion [2,3]. Leaf litter also influences the physical properties of soils, thereby increasing the ability of water to infiltrate into the soil [2,4].
Rainfall partitioning occurring on the forest floor is a minor but fundamental component of the water balance in forest watersheds [4]. A small amount of rainwater is temporarily captured by the surface of leaf litter, and the retained water is lost via evaporation within a few hours or days after the rainfall. When the amount of intercepted water exceeds the threshold, known as the water retention capacity, water percolates into the soil along litter funnels under the influence of gravity [2,5]. These hydrological processes repeatedly occur during successive rainfall events.
Leaf litter intercepts rainfall much in the same way as canopy interception. The extent of rainfall retained in the litter layer is highly related to the litter’s ability of water absorption. Where water retention storage is small, less water is available for evaporation, but more water reaches the upper soil layer for runoff. Water retention capacity also plays a major role in predicting the ignition and spread rate of forest fires [2,3,4].
The water retention capacity of litter differs among leaf types [6,7,8]. Owing to the large size and curved shape of the leaves, broadleaf litter has an advantage in storing water on the leaf surface during rainfall [9]. Conversely, the low porosity of the needle shape of coniferous litter contributes to high water retention within the litter as a consequence of the greater resistance of the packed litter to the percolation of water [10]. Considerably more water is required to completely saturate thicker needle litter [11] before it moves into the soil underneath.
Numerous attempts have been made to continuously measure the water retention storage of floor litter over the past couple of decades. According to Helvey and Patric [11], these methods may categorize into laboratory and field experiments. A detailed review of measuring techniques can be found in Gerrits and Savenije [12].
Several laboratory experiments have been conducted to analyze the water dynamics of leaf litter as it relates to retention and drainage capacity [9,10,13,14]. These experiments have provided a reliable estimation; however, accuracy is limited by several factors. First, the hydrologic response of leaf litter under simulated rainfall in a lab likely differs from that under real incidents of rainfall. Further, inconsistencies in data from natural rainfall events can be attributed to spatial and temporal variations, which would not occur in a lab setting. In addition, the relatively short duration and high intensity of artificial rainfall in laboratory studies cannot completely saturate the leaf accumulation, thereby leading to low measurements of water retention capacity [10], which may be inaccurate.
To overcome some of the drawbacks of laboratory experiments, field lysimeters have recently been employed in experimental forest hydrology. This device was designed to measure the weight of the litter within a certain time interval. Schaap and Bouten [15] developed a concrete lysimeter equipped with a load cell sensor. The present study is based on a field experiment conducted by Gerrits et al. [16], similar to that of Schaap and Bouten [15], to measure the weight of the litter layer. Lysimetric techniques are scalable and suitable for directly quantifying the water budget of a forest floor through changes in litter weight over the shortest intervals, but the challenges of using this tool include high manufacturing and operational costs [17].
Forests can retain a significant amount of rainfall via foliage, branches, stems, and leaf litter. Although the litter layer can store only a few millimeters of water, water absorption and depletion processes of litter can result in a considerable reduction of rainfall reaching to soil surface. However, the role of litter on rainfall interception and retention remains unclear and may even be disregarded in many hydrological studies because it is commonly considered a minor process and has practical difficulties in making accurate measurements [8,13]. Therefore, an accurate understanding of how rainfall is partitioned over the floor litter can provide a better perspective on rainfall interception and evaporation processes.
The objectives of this study were to measure the water stored in the litter layer under natural conditions and to examine the effects of litter type and rainfall amount on the water balance of the litter layer. In this study, six lysimeters were placed in deciduous and coniferous forests, and litter weight was measured during the experimental period. The reliable estimation of water retention capacity can contribute to understanding the hydrologic processes of the forest floor litter layer and can be utilized to predict fire ignition potential based on fuel moisture variation.

2. Materials and Methods

2.1. Study Area

This study was conducted between November 2015 and November 2017 in the Mt. Taehwa University Forest (TUF) of Seoul National University, located approximately 30 km southeast of the Seoul capital area (N37°18′–20′, E127°17′–20′) (Figure 1). The TUF encompasses a 796-ha mountain forest at a latitude ranging from 150 m to 644 m above sea level. The climate of the TUF is characterized as temperate, with hot wet summers and cold dry winters. The mean monthly temperature ranges from −3.3 °C in January to 25.2 °C in August, according to the most recent 30-year data (1991–2020). The mean annual precipitation is 1308 mm, most of which falls in the summer season between June and September [18].
The TUF comprises 496 ha of natural deciduous forest and 300 ha of the coniferous plantation, with the remaining being composed of mixed forest. The dominant tree species in the deciduous forest include Quercus acutissima, Quercus variabilis, and Quercus mongolica, and the plantation forest comprises Pinus koraiensis and Larix kaempferi. The bedrock underneath the TUF is composed largely of weathered granite, and the soil texture is primarily sandy loam according to USDA classification. There has been no record of fire in the TUF over the last few decades. A detailed description of the TUF is provided by Im et al. [19].

2.2. Data Collection

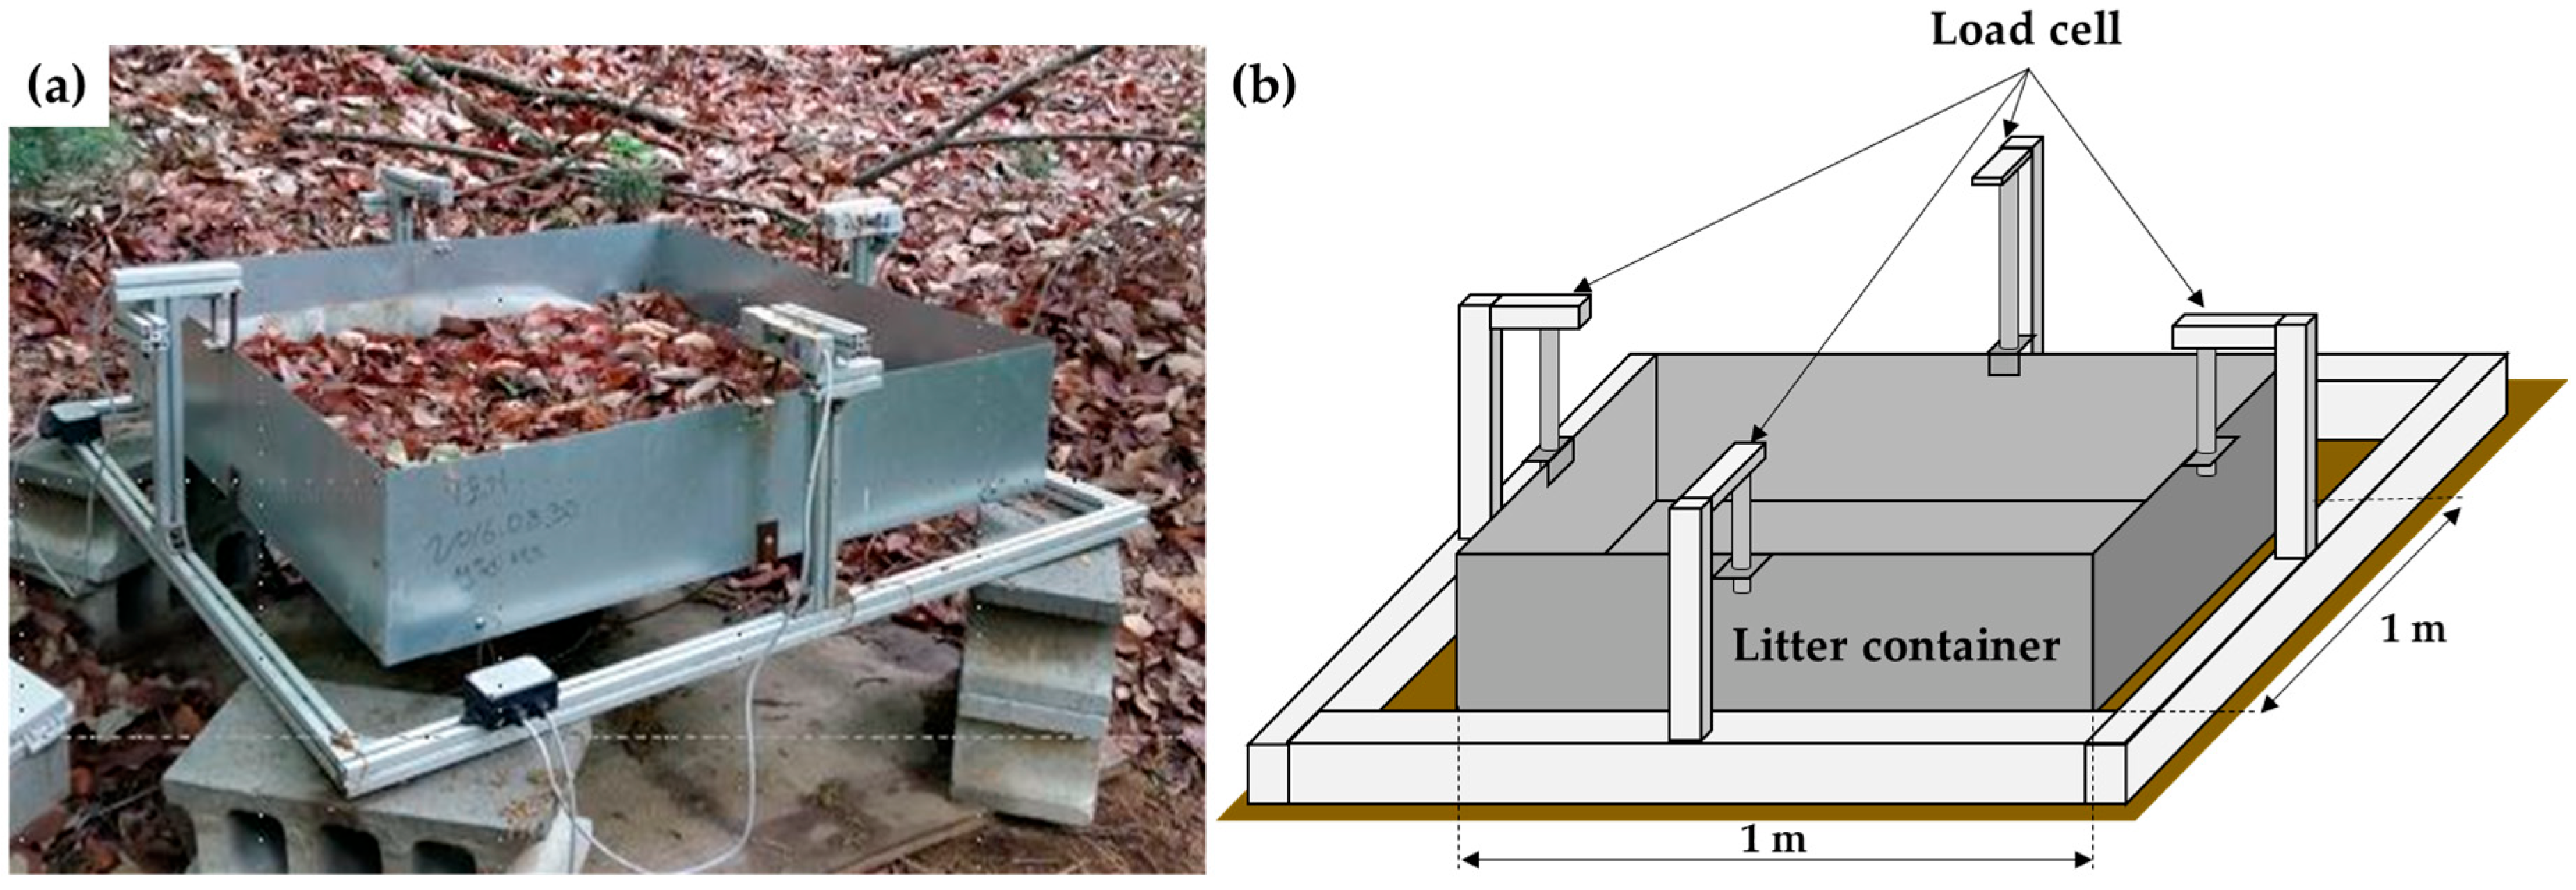
Field lysimeters were used to measure the amount of water retained in the litter layer within each forest (Figure 2). The lysimeter comprises an aluminum container, a steel frame, a load cell, and a data storage device. The square litter container has a surface area of 1 m2 with a permeable wire mesh bottom that allows excess water to drain easily into the underlying soil. Four load cells (BCL-5L, CAS, Korea) were embedded between the container and the steel frame to measure the container weight at 1 min intervals. The container weight, recorded in grams, was averaged over 30 measurements to calculate the variation in litter weight every 30 min.
Each lysimeter was placed in a gap area where other species or understory vegetation were completely absent and filled with the surrounding leaf litter. Three lysimeters, TBK1, TBK2, and TBK3, were located in Q. acutissima forest, while three, TCK1, TCK2, and TCK3, were placed in P. koraiensis plantation forest that was planted in 1964 (Figure 1). A description of each forest is presented in Table 1. The broadleaf litter lysimeters were set up in a 34-year-old Q. acutissima forest with an average tree diameter (n = 12) at breast height (DBH) of 24.1 ± 8.5 cm (mean ± std. dev) and an average tree height of 13.6 ± 3.3 m. The needle litter lysimeters were set up in a P. koraiensis plantation with an average DBH of 33.2 ± 4.5 cm and an average tree height of 18.4 ± 1.5 m.
The physical characteristics of the leaf litter used in the lysimeter experiment are also presented in Table 1. The uneven distribution of leaf size and shape can influence the water retention capacity of the leaf litter [9,10]. Therefore, samples of litter in 10 locations near each lysimeter were collected in a zipper storage bag and immediately moved to the laboratory for analysis. Surface area parameters of the litter were extracted from scanned image data using the LeafArea R package [20]. Litter samples were put into a drying oven for 24 h to obtain the oven-dry weight. Similar to the characteristics of most Q. acutissima, individual leaves in the deciduous samples tended to be broad and round-tooth shaped, and they were, on average, 155.1 ± 22.0 mm long and 41.2 ± 7.5 mm wide at their widest point. The leaves in the P. koraiensis litter samples had a noticeably needle-shaped surface, with an average length of 84.9 ± 16.1 mm. The oven-dry weight of Q. acutissima litter was lower than that of P. koreiensis litter.
Prior to weighing the lysimeters, all lysimeter containers were filled with fallen leaves, which were obtained from random locations in the study area with as little disturbance to their accumulation as possible. Litter load in each lysimeter approximately corresponded to the litter accumulated on a 1 m × 1 m area adjacent to each lysimeter location. The undecomposed litters were carefully collected on the ground surface, avoiding leaves with obvious symptoms of pathogen or herbivore attack or with a decomposed entity. After litter collection, decomposed organic matter and twigs were manually removed prior to piling the litter in the lysimeter container.
The water retention capacity of leaf litter can be assessed per unit of dry weight. The oven-drying method is the simplest and most commonly adopted technique for determining the oven-dried weight of the litter; however, as this direct measurement requires destructive sampling, we decided not to utilize it in this study to maintain an intact litter structure as much as possible. Alternatively, the dry weight of litter samples was indirectly estimated by multiplying the air-dried litter weight by the ratio of the weights of air-dried and oven-dried litter, which were obtained from the 10 litter samples collected near each lysimeter. Table 2 shows the variation in litter weight within the forest, which may be attributed to the varying thickness and consolidation of litter accumulation.
Gross rainfall was measured at KoFlux towers that were located in an open field adjacent to each site (approximately 100 m from each site). The characteristics of the rainfall events between November 2015 and November 2017 are presented in Table 2. Some of the observations were missing values owing to equipment failures, power outages, or severe weather conditions. Therefore, 99 rainfall events were selected for TBK1, 70 for TBK2, and 85 for TBK3. In the coniferous forest, 91, 80, and 87 rainfall events were used for the analyses of TCK1, TCK2, and TCK3, respectively. Evaporation was derived from the eddy covariance flux measurements of the KoFlux towers. A more detailed explanation of the eddy covariance method can be found in Kang et al. [21].

2.3. Estimation of Water Balance Parameters

To understand the hydrologic behavior of leaf litter, the water retention capacity and free drainage were estimated from lysimeter measurements. The term retention capacity refers to the ability of the leaf litter surface to store water and is expressed by the maximum and minimum retention [9,10]. The maximum retention is the maximum volume of water held on the litter during a rainfall event, and this value is obtained just before the rainfall stops. The minimum retention is quantified as the amount of water stored in the leaf litter after drainage (or gravitational flow) completely ceases. This value represents the inherent ability of litter to retain water owing to surface tension and adhesive force [10,13].
The water retained in the litter layer was later depleted via evaporation after rainfall, which was characterized by a litter moisture depletion curve [10]. The depletion curve is the lower part of the falling limb of a litter moisture curve and provides the length of time required to achieve a certain weight of litter moisture, assuming no further rainfall. Litter moisture depletion is a drying process that can be expressed as a simple exponential form [10,22],
S t = S m x e a t = S m x k t
where S t is the retention storage at time t (mm), S m x is the maximum retention storage after the cessation of rainfall (mm), t represents the elapsed time (h), and k is the depletion constant (= e a ).
The depletion constant k represents the time-dependent decline of litter moisture and determines the line of best fit through litter moisture measurements with time. The drying of litter did not occur in a uniform manner across the experiments. Thus, a representative k value for each litter type was obtained by averaging over all rainfall events.
As no drainage data were available in this study, drainage outflow from the litter layer was indirectly determined from the difference in litter weight over a duration of 30 min. During a rainfall event, evaporation typically occurs at a rate of 0.1 to 0.5 mm/h because the ambient air near the litter surface is closely saturated [23,24]. Therefore, evaporation loss can be disregarded in the calculation of free drainage during rainfall. During the rainfall period, the free drainage for a duration of 30 min can be calculated as follows:
D t = R t S t ,   where   S t = S t S t 1
where D t   and   R t are the amounts of water in the litter drainage and rainfall at time t (mm/30 min), respectively. S t implies the change in litter moisture for a duration of 30 min.
When the rain ceases, the evaporation process gradually recovers. Therefore, drainage can be estimated as follows:
D t = S t E t ,   for   S t > E t
D t = 0 ,                 for   S t E t
where E t is the amount of evaporative loss for a duration of 30 min (mm/30 min).

2.4. Statistical Analysis

Tests for normality must be checked before full statistical analysis can be conducted. Because the data didn’t follow normal distribution due to high skewness and heterogeneous variance, differences among treatments were tested using the Kruskal–Wallis test. Bonferroni correction was also applied to minimize the alpha inflation when assessing the treatment effects. Two litter types were designed in this study to evaluate the effects of litter and rainfall on the water retention capacity with three lysimeters. Differences were considered statistically significant at p < 0.05. All statistical analyses were performed using the R statistical package, version 4.2.0 (22 April 2022) [25].

3. Results

3.1. Water Retention Capacity of Leaf Litter

The water retention capacity of the leaf litter was estimated from the litter lysimeter measurements and is presented in Table 3. For the entire period of measurement (Table 2), the maximum retention capacity (mean ± std. dev) of the Q. acutissima litter (1.69 ± 1.28 mm for TBK1, 1.46 ± 1.33 mm for TBK2, and 1.67 ± 1.57 mm for TBK3) was equivalent to 3.07 ± 2.23, 1.16 ± 1.06, and 1.23 ± 1.16 mm per unit litter mass (kg/m2), respectively. The maximum retention capacity in the P. koraiensis litter (1.75 ± 1.79 mm for TCK1, 1.90 ± 1.79 for TCK2, and 2.01 ± 1.99 mm for TCK3) was equivalent to 2.04 ± 2.08 mm, 4.13 ± 3.89 mm, and 3.46 ± 3.42 mm per unit litter mass (kg/m2), respectively, which was higher than that of the Q. acutissima leaf litter. This demonstrated that more rainfall was retained in needle litter than in broadleaf litter, regardless of rainfall amount, and this result was consistent with the finding of Li et al. [10]. Maximal water retention depends on the development of free drainage in the litter layer during rainfall events [9]. Needle litter forms an extremely dense accumulation that obstructs the dispersion and percolation of rainfall. However, in broadleaf litter such as that of Q. acutissima, biomat flow can be developed in the litter layer that allows water to move laterally and vertically [26].
In contrast to the previous laboratory experiments, where gravitational water was readily drained within a short period (approximately 30 min) after rainfall cessation [9,10], this in situ study demonstrated that water continued to drain out of litter samples beyond 30 min after rainfall ended. Therefore, the lowest, nearly asymptotic water retention was considered in this study as the minimum retention [10]. The minimum retention varied, ranging from 1.35 ± 1.32 mm (TBK2) to 1.56 ± 1.47 mm (TBK3) in broadleaf litter and from 1.58 ± 1.75 mm (TCK1) to 1.97 ± 1.90 mm (TCK3) in needle litter. The average values of minimum retention were 1.66 mm and 2.72 mm per unit mass for Q. acutissima and P. koraiensis litters, respectively. No significant differences were observed in retention among the groups with different litter weights (p = 0.1912); however, a statistically significant difference was observed between litter types (p < 0.01).
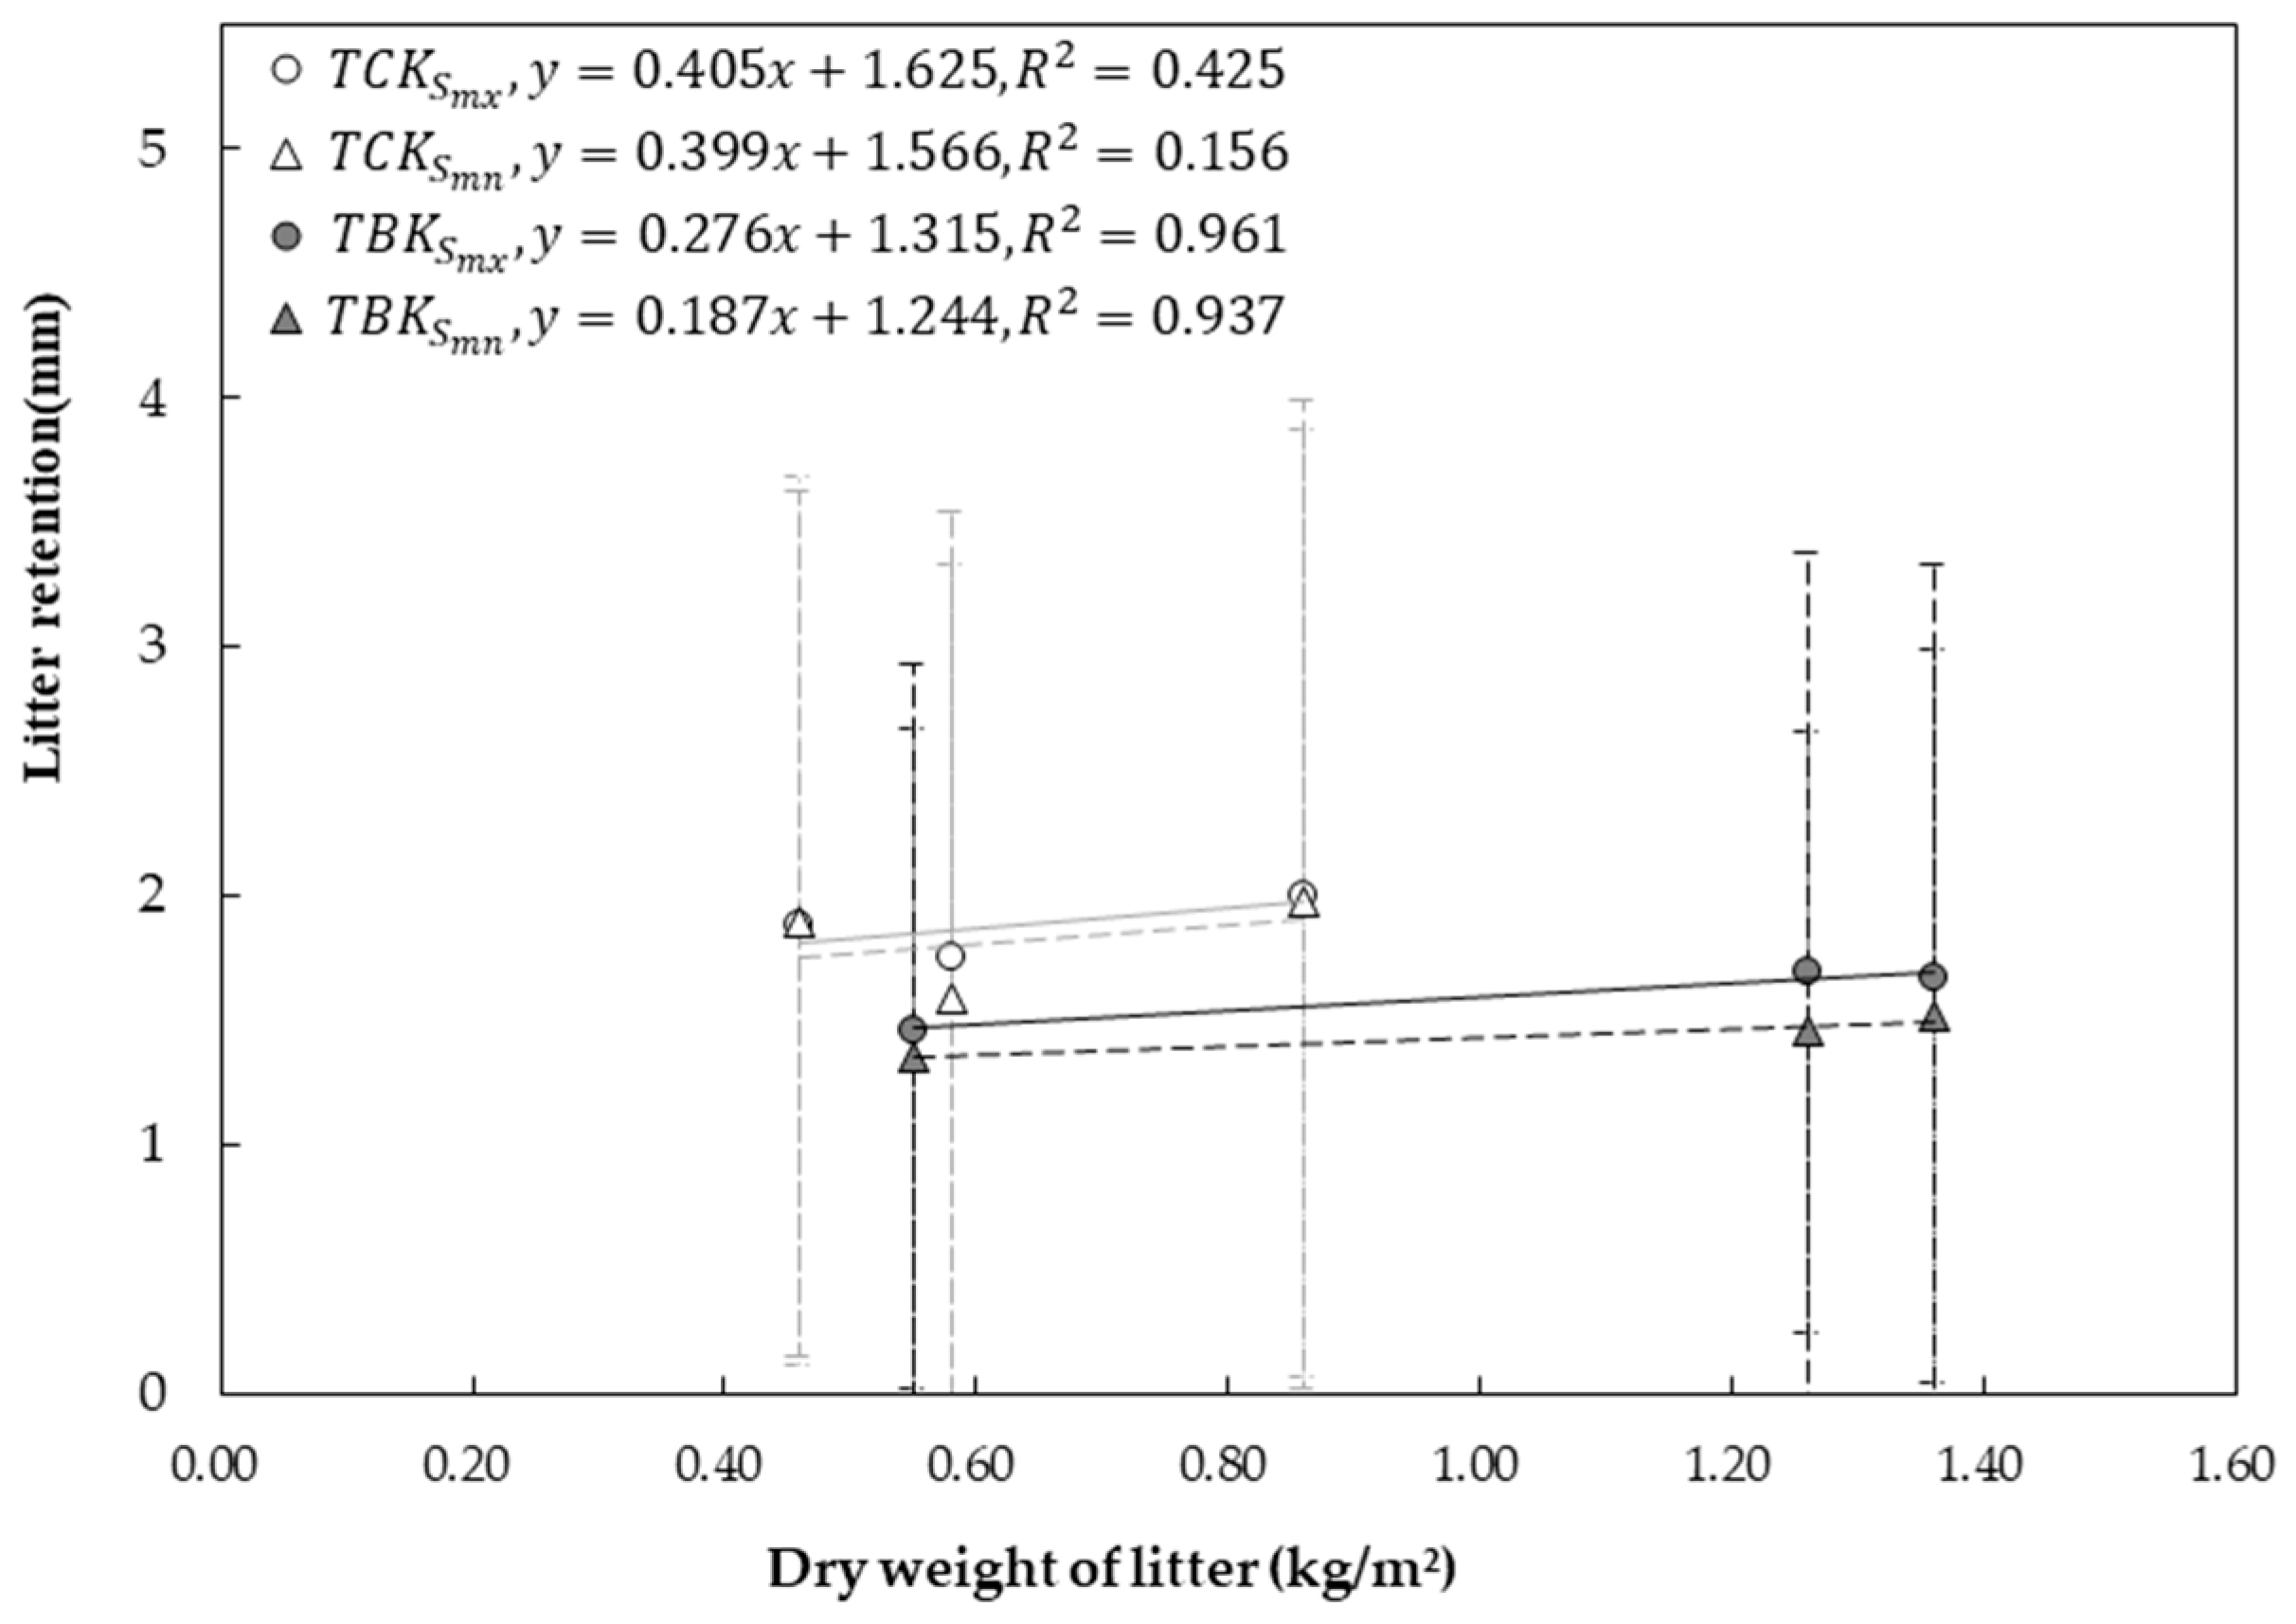
According to previous studies [9,10], the water retention capacity of litter depends on litter mass, regardless of its thickness. The relationship between retention and litter mass is shown in Figure 3. The coefficients of determination for linear relationship were also presented in Figure 3, implying a measure of how well linear regression represents the measurements. As expected, both the maximum and minimum retention values increased linearly as litter mass increased. The maximum retention value increased considerably in the P. koraiensis litter, whereas it tended to change only slightly in the Q. acutissima litter. As shown in Figure 3, all lysimeter measurements presented a linear relationship between minimum retention and litter mass, with slope coefficients of 0.187 for Q. acutissima and 0.399 for P. koraiensis litter. This implies that a stronger adhesive force, which can resist the vertical movement of pore water, exists among the elements of the needle litter compared to that of the broadleaf litter. The difference in maximum water retention between litter types was small because it is controlled by rainfall intensity. Unlike the maximum retention values, the minimum retention values exhibited high variability between litter types. There were significant differences in both maximum and minimum retention storages between broadleaf and needle litters (p < 0.01).
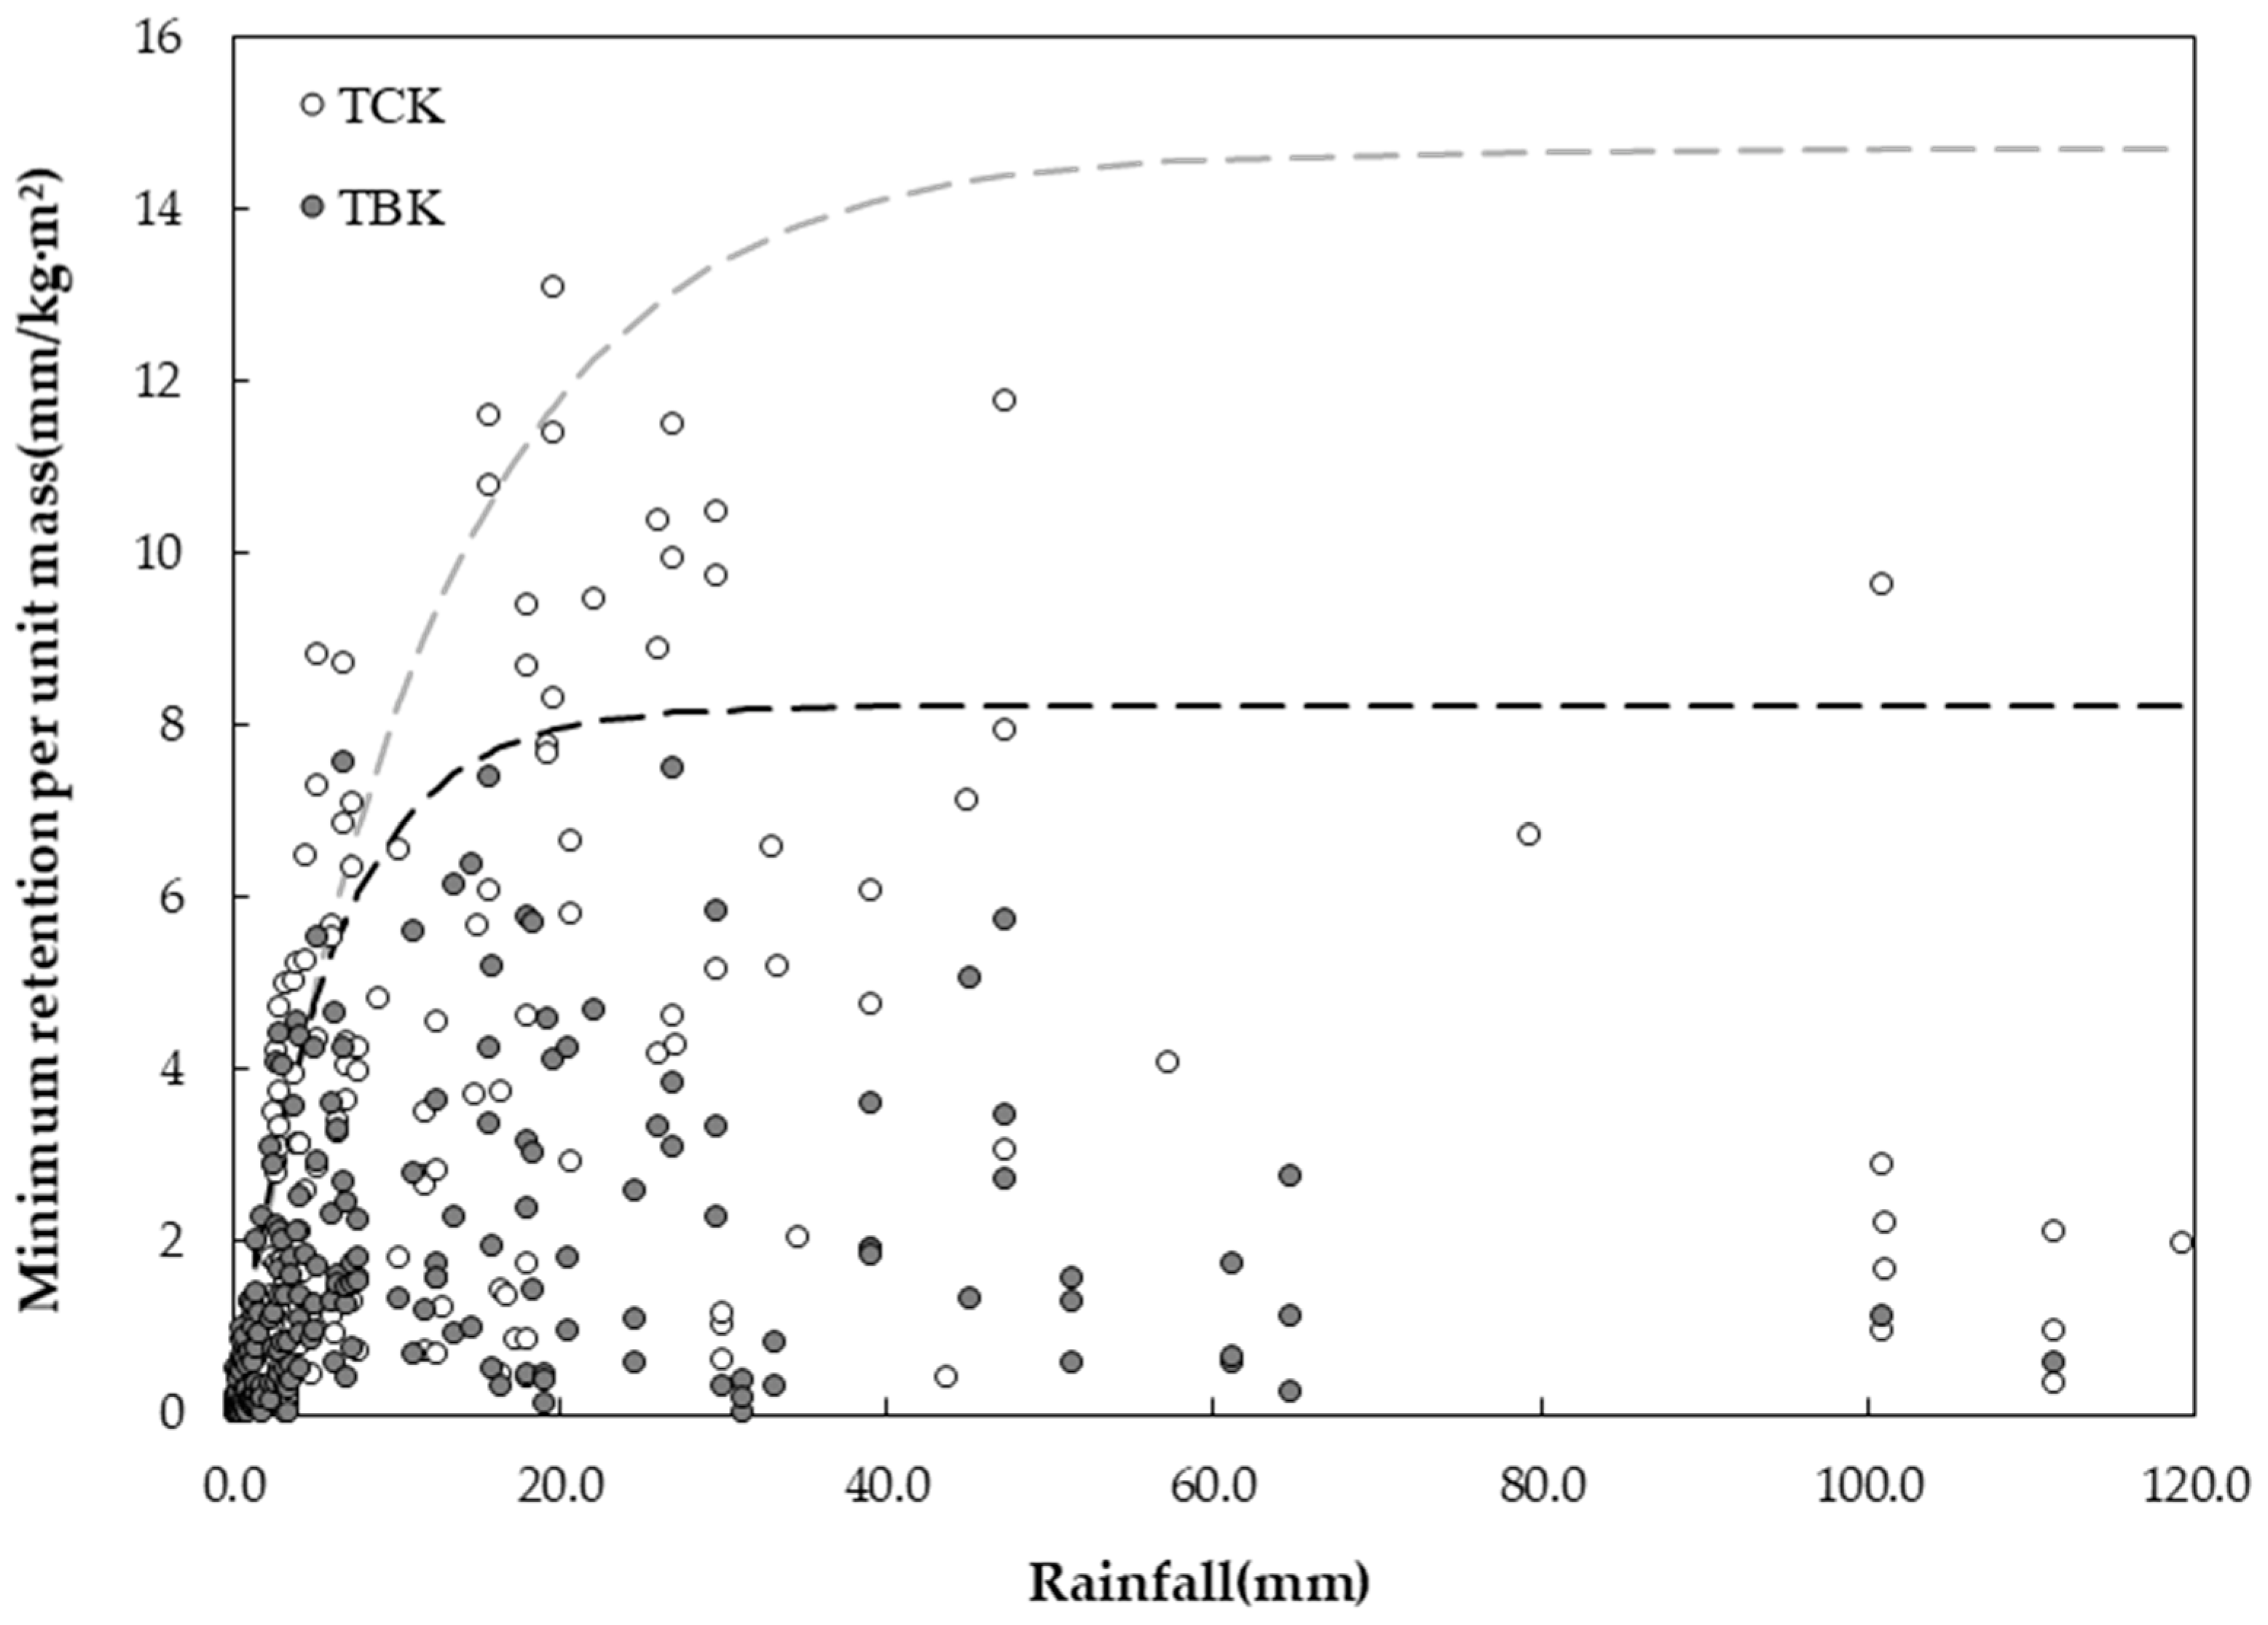
As shown in Figure 4, the high variability in the minimum retention capacity within litter type was likely due to natural variability in rainfall intensity and duration. The minimum retention capacity as a percentage of rainfall could be as high as 80% during light rainfalls (<10 mm), and it became no more than 20% in cases where rainfall amount was >30 mm. The minimum retention capacity of broadleaf litter was higher than that of needle litter for light rainfall events (<20 mm) but could be low for heavy rainfalls. Broadleaf litter can easily capture water with large, curve-shaped surfaces when rainfall does not exceed the storage capacity [9,10]. Compared to Q. acutissima litter, P. koraiensis litter formed a relatively dense barrier layer owing to its smaller physical dimensions and lower porosity. Thus, the strong adhesion and surface tension of water molecules in the P. koraiensis layer caused a reduction in water movement through the litter layer for heavy rainfalls [10].
The percentage of rainfall retained by litter decreased as rainfall amount increased. The logarithmic relationship between retention capacity and rainfall for broadleaf (Equation (5)) and needle (Equation (6)) litter can be expressed as:
Log S m n = 3.461 0.043   R t o t   mm   R 2 = 0.600
and
Log S m n = 3.173 0.027   R t o t   mm   R 2 = 0.407 ,
respectively, where log( S m n ) is the natural log of the minimum water retention (%) and R t o t is the total amount of rainfall (mm). The derived relationships between water retention and rainfall amount were statistically significant (p < 0.01) and had residual standard errors of 1.159 and 0.604 for the broadleaf and needle litters, respectively.
For heavy rainfall with a long duration, the retention capacity reaches the potential value regardless of rainfall amount because the initial abstraction by litter is satisfied, and litter can be completely saturated. Figure 4 shows the upper boundary of the minimum retention value under natural conditions. The upper envelope curve (Figure 4) was fitted using the Aston curve [25]. The potential values of minimum retention per unit mass (kg/m2) can be expressed as follows,
S m n , p = 14.705 1 e 0.081 R t o t   for   needle   litter
S m n , p = 8.226 1 e 0.173 R t o t   for   broadleaf   litter
respectively, where S m n , p is the potential (maximum) values of minimum retention per unit mass of litter (mm/kg/m2).
The minimum retention value increased exponentially with light rainfall but approached asymptotic boundaries when rainfall exceeded 30 mm. This phenomenon was similar to the findings of Sato et al. [9], Li et al. [10], and others [27]. Light rainfall produced greater retention potential in broadleaf litter than in needle litter. The influence of rainfall on retention capacity was not significant in heavy rainfall events, although the capacity slightly increased as rainfall increased. Figure 4 indicates that the upper envelope for minimum retention was 8.226 mm per unit mass for Q. acutissima litter and 14.705 mm for P. koraiensis litter.

3.2. Litter Moisture Depletion Curve

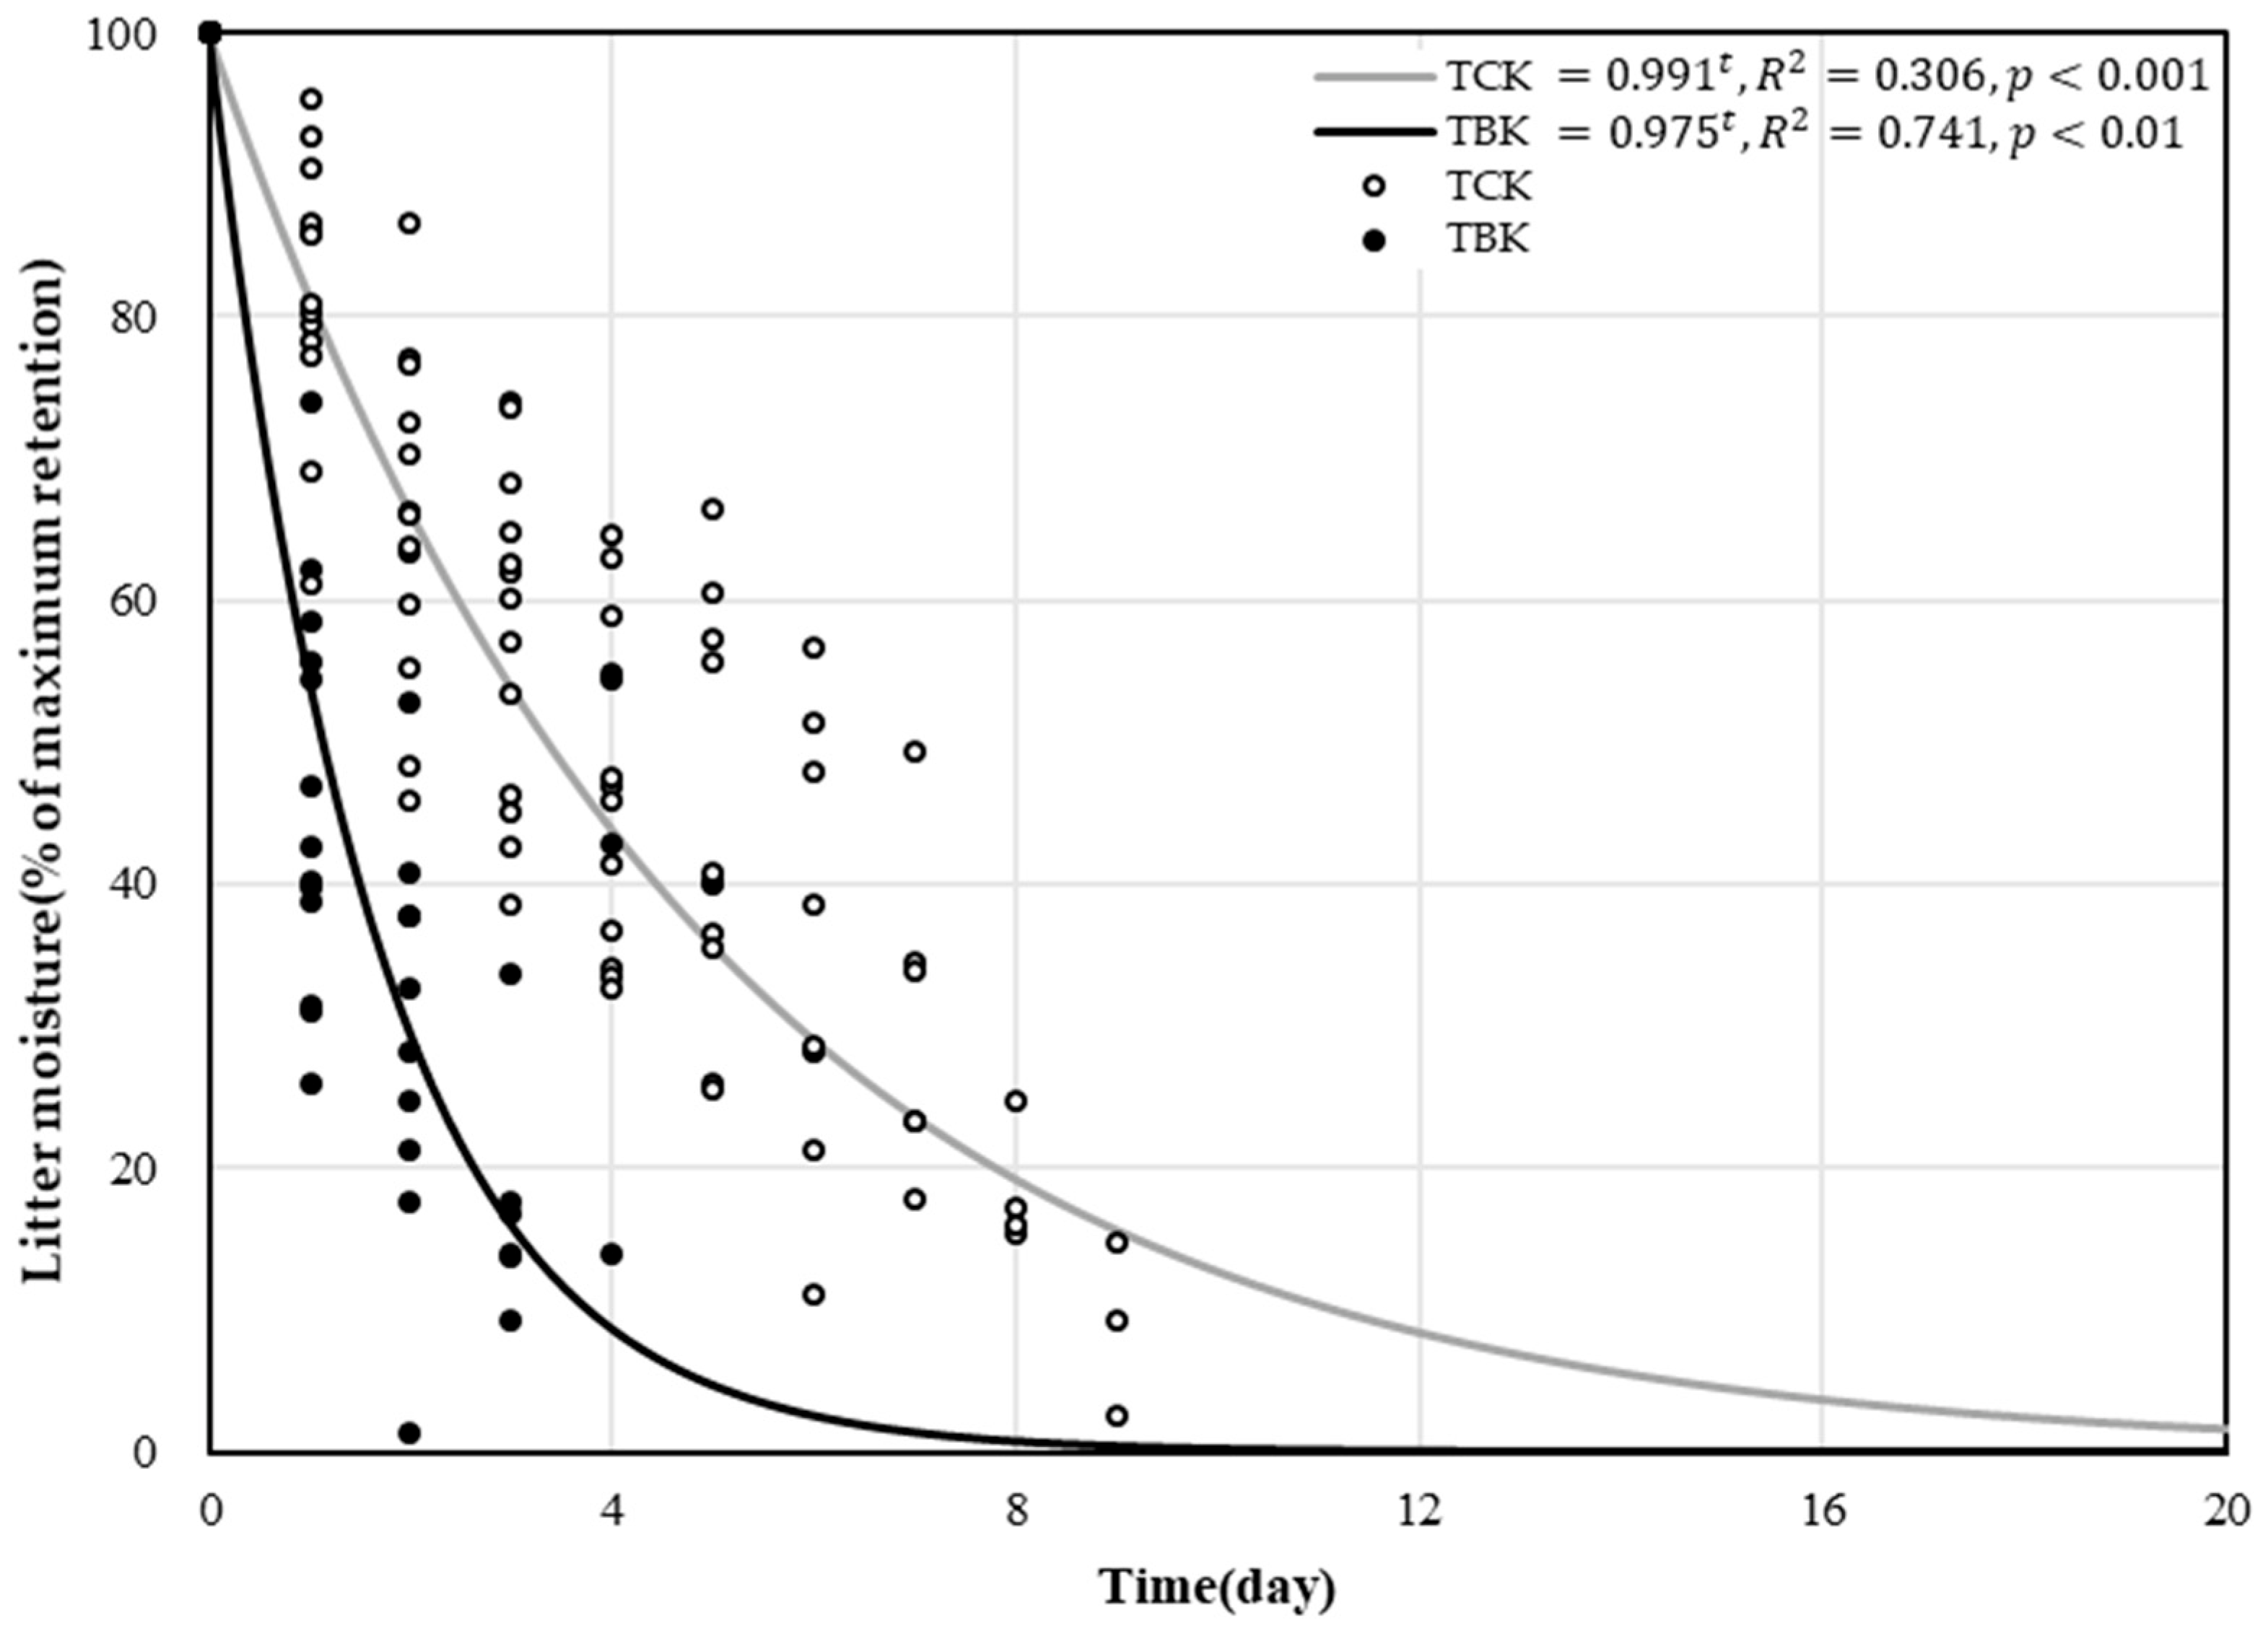
In this study, a moisture depletion curve was plotted for each litter type. As shown in Figure 5, a simple exponential relationship was observed in the water depletion curve of the leaf litter, implying that average k values for broadleaf and needle litters were 0.975 and 0.991, respectively.
The litter drainage led to the decline in litter moisture content immediately after rain stopped, and as time elapsed, water absorbed by the litter asymptotically approached the minimum retention value of the litter. Figure 5 shows that half of the water retained in the Q. acutissima litter was depleted within approximately 1.1 days (27 h) after the cessation of rainfall. Over 3.8 days (90 h), the remaining moisture was slowly extracted from the Q. acutissima litter layer, which then reached approximately 10% of its maximum retention value. Water depletion in P. koraiensis litter followed a similar pattern to that in the broadleaf litter, depleting 50% and 90% of its maximum retention value within 3.4 days (80 h) and 11.2 days (268 h), respectively.

3.3. Water Balance Analysis for Rainfall Periods

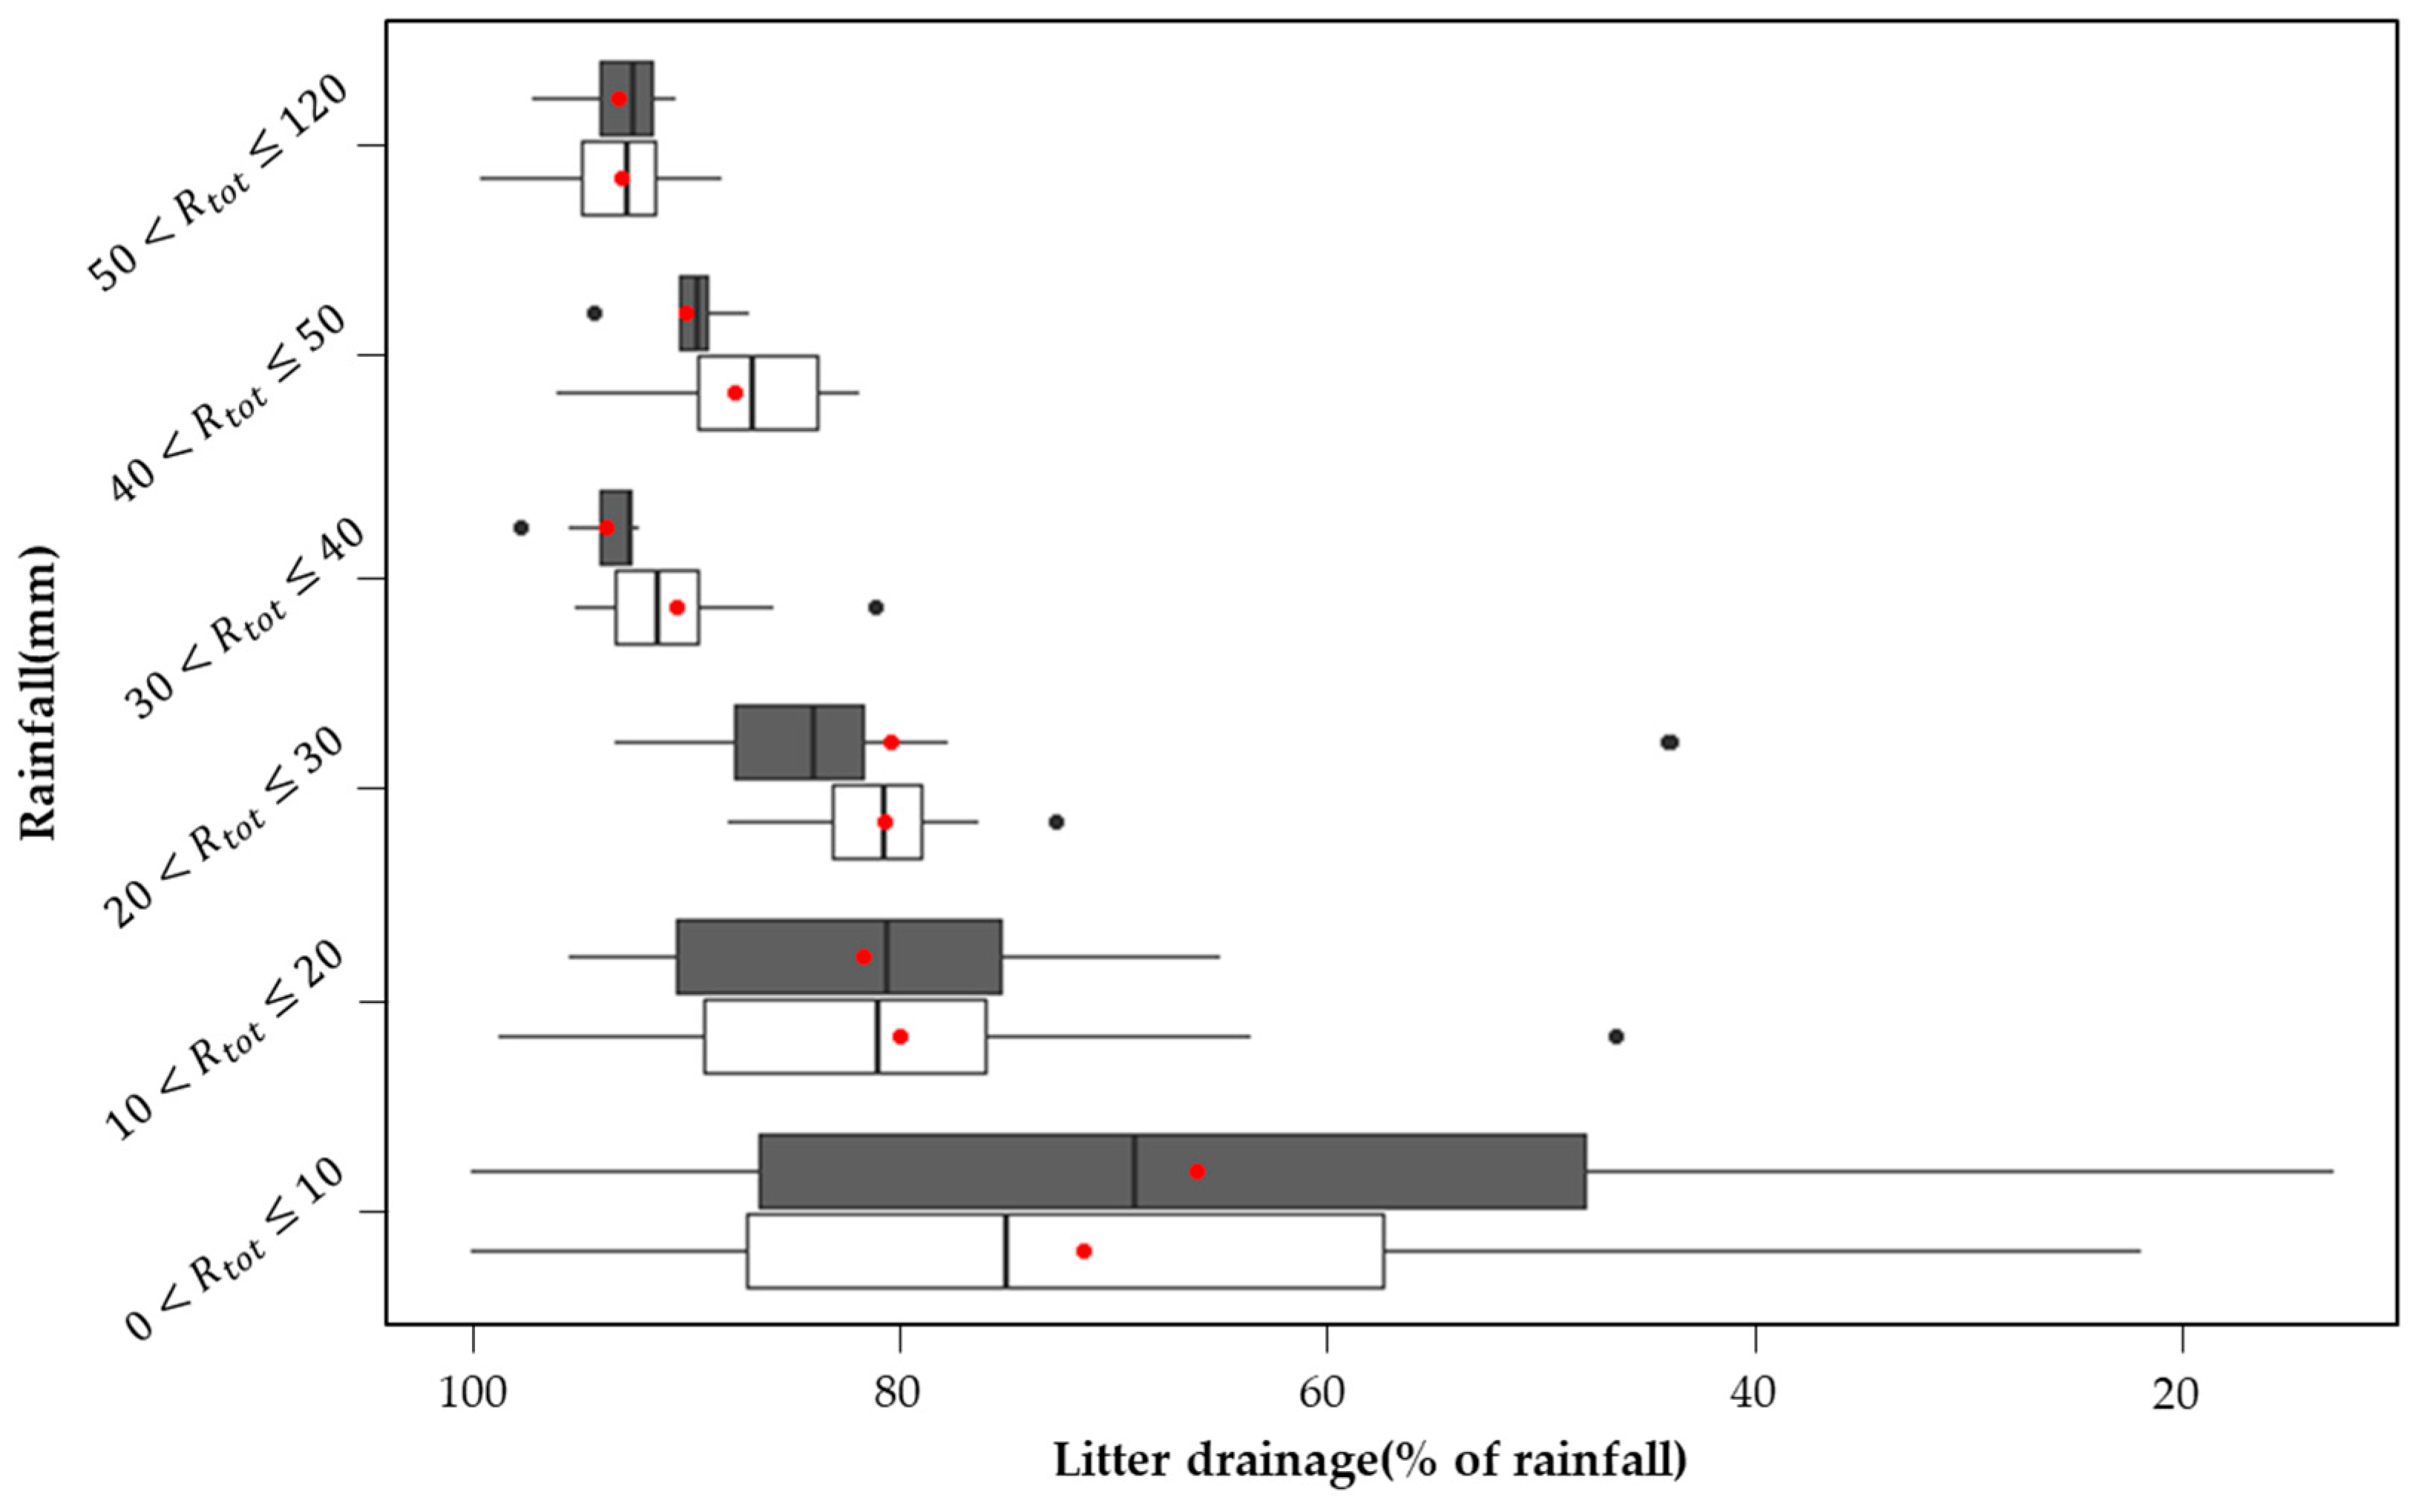
This study revealed an increase in litter weight due to water retention and a decrease due to evaporation loss. The water balance for rainfall periods was analyzed, and the total rainfall was partitioned into litter retention, evaporation loss, and free drainage, as presented in Table 4. Because there were no significant differences among lysimeters within litter type, the average values across three lysimeters within each litter type were calculated. Regardless of rainfall amount, approximately 83.7% of incoming rainfall drained from the Q. acutissima litter into the uppermost soil layer, whereas 84.5% of rainfall percolated through the P. koraiensis litter.
After litter drainage was complete, the remaining water retained in the litter layer was available for evaporation or retention. Evaporation losses during the depletion periods accounted for 5.2% of total rainfall in the broadleaf litter layer and 1.6% in the needle litter layer. Naturally, some retained water was not entirely lost via evaporation and contributed to the antecedent moisture of the litter for subsequent rainfall events. When lysimeter measurements were considered, the portion of total rainfall retained within the litter layer after the completion of litter drainage was 11.1% in the Q. acutissima litter and 14.0% in the P. koraiensis litter.
This was attributable to the physical properties of the litter, as reported in previous studies [10,28]. A horizontally oriented and densely compacted needle litter layer retains more water than curved and loosely compacted broadleaf litter layer. However, a relatively stronger adhesion and surface tension in needle litter can resist the evaporation of water from the litter surface and consequently enhance litter drainage, compared to broadleaf litter.
As shown in Figure 6, litter drainage varied with rainfall amount. For light rainfall of less than 10 mm, 25% and 32% of rainfall was intercepted or evaporated by the Q. acutissima and P. koraiensis litters, respectively, resulting in a decrease in the amount of rainfall reaching the mineral soil. The portion of rainfall that drained increased as the rainfall increased. These findings correspond with those of previous studies [10,23].

4. Discussion

The water balance of leaf litter was analyzed based on lysimeter measurements. In this study, total rainfall was partitioned into three components: retention, evaporation loss, and litter drainage. Water balance analysis revealed a proportionately greater amount of litter drainage due to lower water retention of leaf litter. The water retention values observed at the end of a rainfall period fell within the range of interception storage reported by Li et al. [10]. The amount of water retained is dependent on the initial moisture content of the litter prior to rainfall. Leaf litter that is very dry will retain a larger proportion of the rainfall arriving on the litter layer, and that which is close to the saturation point will retain very little additional moisture. The influence of antecedent moisture conditions on water dynamics in the litter layer was not quantitatively considered in this study.
Water retention per unit mass of leaf litter has been reported by previous studies based on laboratory experiments. Sato et al. [9] reported that the maximum water retention levels of Lithocarpus edulis (broadleaf litter) and Cryptomeria japonica (needle litter) were 1.56 mm and 1.59 mm, respectively, and the minimum retention of L. edulis and C. japonica were 1.53 mm and 0.81 mm, respectively. Li et al. [10] reported that the average maximum retention of broadleaf litter ranged from 3.96–6.56 mm for Q. variabilis and 5.26–6.25 mm for Q. acutissima; however, the values for needle litter ranged from 0.35–0.43 mm for Abies holophylla and 1.65–2.47 mm for Pinus strobus. Putuhena and Cordery [13] reported that the maximum and minimum water retention of pine litter was 1.25 mm and 0.97 mm, respectively. Compared to previous results measured in laboratories, the water retention values derived from the in situ lysimeter experiments in this study are within the same order of magnitude but exhibit wide variation due to the high variability of natural rainfall.
According to the lysimeter measurements in this study, water retention capacity was 10%–15% of the rainfall for storm periods. Other studies also published the water retention of gross rainfall or annual value for different litter types as follows: 8%–12% for mixed oak stands in India [29], 8%–16% for Quercus petraea, 12.1% for Pinus patula, 8.5% for Eucalyptus grandis, and 6.6% for Acacia mearnsii in South Africa [30]. Gerrits et al. [16] found litter interception to be as high as 22% in a beech forest and 18% in needle leaf litter in a cedar forest, while Helvey and Patric [11] found litter interception to be 15%–34% in a poplar stand in the USA. Comparison of the current study with these past studies is limited due to differences in climate conditions, tree species, litter mass, and methods of measurement.
Litter drainage was indirectly calculated as the difference between the amount of rainfall and the amount of water retained in the leaf litter. This concept is valid only if the evaporation loss is neglected for shorter durations. Even if this condition is not satisfied, it leads to a small discrepancy in almost all instances because the evaporation rate is too small to have a substantial impact on the drainage calculation for a very short period [24,31].
The gravimetric method is the most widely used technique for the moisture determination of litter [6,7], where litter samples are transported to the laboratory for experimental measurements. Although this is a very simple and accurate method, it disturbs the samples and requires 12–24 h to dry in an oven to weigh the litter sample under dry conditions. Therefore, the gravimetric method is not applicable to continuously measure the water partitioning in field conditions. A field lysimeter is the best solution to quantify litter interception and retention under natural conditions [12]. Because the experiment is executed in the original environment, litter samples are less disturbed compared to the gravimetric method.
Naturally, some biological and pathological changes could have occurred during the measurement period [32,33]. Decomposition can modify the physical characteristics of leaf litter, resulting in a change in its weight [34], which would influence the hydrologic processes in the litter by reducing its water retention capacity and resisting water penetration into the layer. In this study, litter decomposition was not considered because it was the intent of the experiment to obtain moisture measurements from relatively undisturbed litter samples. Litter-decomposing fungi are also known to have higher water resistance (hydrophobicity) due to fungal mycelia [33], although they have rarely been observed in litter samples.

5. Conclusions

The water retention capacity of leaf litter was estimated from lysimeter measurements taken over a duration of 30 min. Regardless of rainfall characteristics, needle litter had a greater capacity to retain rainfall than broadleaf litter did. During the experiment, approximately 1.66 ± 1.72 mm per rainfall event was stored per unit mass (kg/m2) of broadleaf litter after rainfall, while 2.72 ± 2.82 mm of rainfall reaching needle litter was retained per unit mass (kg/m2). Approximately 83.7% of incident rainfall drained into the uppermost soil layer below the Q. acutissima litter, whereas 84.5% of rainfall percolated through the P. koraiensis litter. The depletion curves indicated that the water retained in the Q. acutissima litter was more easily lost via evaporation than the P. koraiensis litter.
The duration and intensity of rainfall are known to affect litter water retention capacity. Most previous studies have been conducted under limited conditions, where the short duration and/or high intensity of artificial rainfall might lead to an underestimation of the retention capacity of litter, likely due to the litter accumulation not being thoroughly wetted prior to the simulated rainfall. On the contrary, as this study was conducted under natural rainfall conditions, it resulted in a higher variation in retention capacity, likely due to the variation in rainfall. Practically, the upper envelope curves derived from lysimetry experiments can provide the upper boundary of the retention capacity, reflecting the effect of rainfall characteristics under natural conditions.
This lysimetry experiment has some limitations. First, evaporation from the litter layer has not been measured but can be derived in this study. It would require intensive field experiments where hydrological components such as rainfall, evaporation, percolation, and drainage are measured simultaneously. Second, litter decomposition as a result of fungal and soil faunal activity also occurs over time. Changes in the physical traits of leaf litter can affect hydrological function; however, this phenomenon was not considered in the current study. Therefore, long-term measurements are required to accurately understand the hydrological role of leaf litter, considering spatial and temporal variations in production, accumulation, and decomposition.
This study highlighted the litter retention and evaporation processes. However, relatively little is known on water dynamics occurring on the forest floor. Biomat flow likely follows preferential flow paths through the litter layer. Further research can be directed to the clear understanding of how biomat flow influences the residence time of water within the layer, time to litter saturation, and, in consequence, the water retention capacity of litter.

Author Contributions

Conceptualization, T.K. and S.I.; methodology, T.K. and S.I.; software, J.K. and J.L.; validation, T.K., J.K. and J.L.; investigation, J.K., J.P. and J.L.; resources, H.S.K.; data curation, T.K. and J.P.; writing—original draft preparation, T.K.; writing—review and editing, S.I. and H.S.K.; visualization, J.K. and J.L.; supervision, S.I.; project administration, S.I.; funding acquisition, S.I. All authors have read and agreed to the published version of the manuscript.

Funding

This study was carried out with the support of ‘R&D Program for Forest Science Technology (Project No. 2021343C10-2323-CD01)’ provided by Korea Forest Service (Korea Forestry Promotion Institute).

Data Availability Statement

Not applicable.

Acknowledgments

We acknowledge the Forest Ecophysiology Laboratory of Seoul National University, Korea, for providing the experimental data, and also thankful for the support of the Mt. Taehwa Seoul National University Forest.

Conflicts of Interest

The authors declare no conflict of interest.

References

  1. Korea Forest Service. Statistical Yearbook of Forestry 2021; Korea Forest Service: Daejeon, Republic of Korea, 2021; pp. 40–41. [Google Scholar]
  2. Dunkerley, D. Percolation through leaf litter: What happens during rainfall events of varying intensity? J. Hydrol. 2015, 525, 737–746. [Google Scholar] [CrossRef]
  3. Gomyo, M.; Kuraji, K. Effect of the litter layer on runoff and evapotranspiration using the paired watershed method. J. For. Res. 2016, 21, 306–313. [Google Scholar] [CrossRef]
  4. Gavazzi, M.J.; Sun, G.; McNulty, S.G.; Treasure, E.A.; Wightman, M.G. Canopy rainfall interception measured over ten years in a coastal plain loblolly pine (Pinus taeda L.) plantation. Trans. ASABE 2016, 59, 601–610. [Google Scholar]
  5. Guevara-Escobar, A.; González-Sosa, E.; Véliz-Chávez, C.; Ventura-Ramos, E.; Ramos-Salinas, M. Rainfall interception and distribution patterns of gross precipitation around an isolated Ficus benjamina tree in an urban area. J. Hydrol. 2007, 333, 532–541. [Google Scholar] [CrossRef]
  6. Bernard, J.M. Forest floor moisture capacity of the New Jersey pine barrens. J. Ecol. 1963, 44, 574–576. [Google Scholar] [CrossRef]
  7. Reynolds, J.F.; Knight, D.H. The magnitude of snowmelt and rainfall interception by litter in lodgepole pine and spruce-fir forests in Wyoming. Northwest Sci. 1973, 47, 50–60. [Google Scholar]
  8. Rosalem, L.M.; Wendland, E.C.; Anache, J.A. Understanding the water dynamics on a tropical forest litter using a new device for interception measurement. Ecohydrology 2019, 12, e2058. [Google Scholar] [CrossRef]
  9. Sato, Y.; Kumagai, T.O.; Kume, A.; Otsuki, K.; Ogawa, S. Experimental analysis of moisture dynamics of litter layers—The effects of rainfall conditions and leaf shapes. Hydrol. Process. 2004, 18, 3007–3018. [Google Scholar] [CrossRef]
  10. Li, Q.; Lee, Y.E.; Im, S. Characterizing the interception capacity of floor litter with rainfall simulation experiments. Water 2020, 12, 3145. [Google Scholar] [CrossRef]
  11. Helvey, J.; Patric, J. Canopy and litter interception of rainfall by hardwoods of eastern United States. Water Resour. Res. 1965, 1, 193–206. [Google Scholar] [CrossRef] [Green Version]
  12. Gerrits, A.M.J.; Savenije, H.H.G. Forest floor interception. In Forest Hydrology and Biogeochemistry; Ecological Studies 216; Levia, D.F., Carlyle-Moses, D., Tanaka, T., Eds.; Springer: New York, NY, USA, 2011; p. 423.407. [Google Scholar]
  13. Putuhena, W.M.; Cordery, I. Estimation of interception capacity of the forest floor. J. Hydrol. 1996, 180, 283–299. [Google Scholar] [CrossRef]
  14. Li, X.; Niu, J.; Xie, B. Study on hydrological functions of litter layers in North China. PLoS ONE 2013, 8, e70328. [Google Scholar] [CrossRef]
  15. Schaap, M.; Bouten, W. Forest floor evaporation in a dense Douglas fir stand. J. Hydrol. 1997, 193, 97–113. [Google Scholar] [CrossRef]
  16. Gerrits, A.; Savenije, H.; Hoffmann, L.; Pfister, L. New technique to measure forest floor interception–an application in a beech forest in Luxembourg. Hydrol. Earth Syst. Sci. 2007, 11, 695–701. [Google Scholar] [CrossRef] [Green Version]
  17. Beeson, R.C. Weighing lysimeter systems for quantifying water use and studies of controlled water stress for crops grown in low bulk density substrates. Agric. Water Manag. 2011, 98, 967–976. [Google Scholar] [CrossRef]
  18. Korea Meteorological Administration. Available online: https://data.kma.go.kr (accessed on 13 December 2022).
  19. Im, S.; Lee, W.S.; Kim, H.; Seoul National University Forests. Developing a Network of Long-Term Research Field Stations to Monitor Environmental Changes and Ecosystem Responses in Asian Forests, 1st ed.; Kamata, N., Kuraji, K., Owari, T., Guan, B.T., Eds.; The University of Tokyo Forests Press: Tokyo, Japan, 2019; Volume 1, pp. 39–50. [Google Scholar]
  20. Katabuchi, M. LeafArea: An R package for rapid digital image analysis of leafarea. Ecol. Res. 2015, 30, 1073–1077. [Google Scholar] [CrossRef]
  21. Kang, M.; Kim, J.; Lee, S.-H.; Kim, J.; Chun, J.-H.; Cho, S. Changes and improvements of the standardized eddy covariance data processing in KoFlux. Korean J. Agric. For. Meteorol. 2018, 20, 5–17. [Google Scholar]
  22. Yang, H.; Choi, H.T.; Lim, H. Applicability assessment of estimation methods for baseflow recession constants in small forest catchments. Water 2018, 10, 1074. [Google Scholar] [CrossRef] [Green Version]
  23. Semago, W.T.; Nash, A.J. Interception of precipitation by a hardwood forest floor in the Missouri Ozarks. Univ. Mo. Agr. Exp. Stan. Res. Bull. 1962, 796, 1–31. [Google Scholar]
  24. Gash, J.H.; Lloyd, C.; Lachaud, G. Estimating sparse forest rainfall interception with an analytical model. J. Hydrol. 1995, 170, 79–86. [Google Scholar] [CrossRef]
  25. R Core Team. R: A Language and Environment for Statistical Computing; R Foundation for Statistical Computing: Vienna, Austria, 2022; Available online: https://www.R-project.org/ (accessed on 11 November 2022).
  26. Gerke, K.; Sidle, R.; Mallants, D.; Valisyev, R.; Karsanine, M.; Skvortsova, E.; Korost, D. Biomat Flow: From Field Experiments with Dyes to Pore-scale Modelling of Transport Properties and Flow Models. In Proceedings of the AGU Fall Meeting, San Francisco, CA, USA, 9–13 December 2013; p. 274313. [Google Scholar]
  27. Aston, A.R. Rainfall interception by eight small trees. J. Hydrol. 1979, 42, 383–396. [Google Scholar] [CrossRef]
  28. Sato, Y.; Otsuki, K.; Ogawa, S. Estimation of the Litter interception Loss in the Evergreen Forest. J. Jpn. Soc. Hydrol. Water Resour. 2003, 16, 640–651. [Google Scholar] [CrossRef] [Green Version]
  29. Pathak, P.C.; Pandey, A.N.; Singh, J.S. Apportion of rainfall in central Himalayan forests (India). J. Hydrol. 1985, 76, 319–332. [Google Scholar] [CrossRef]
  30. Bulcock, H.H.; Jewitt, G.P.W. Field data collection and analysis of canopy and litter interception in commercial forest plantation in the KwaZulu-Natal Midlands, South Africa. Hydrol. Earth Syst. Sci. 2012, 16, 3717–3728. [Google Scholar] [CrossRef] [Green Version]
  31. Pereira, F.; Gash, J.; David, J.; Valente, F. Evaporation of intercepted rainfall from isolated evergreen oak trees: Do the crowns behave as wet bulbs? Agric. For. Meteorol. 2009, 149, 667–679. [Google Scholar] [CrossRef] [Green Version]
  32. Gosz, J.R.; Likens, G.E.; Bormann, F.H. Nutrient release from decomposing leaf and branch litter in the Hubbard Brook Forest, New Hampshire. Ecol. Monogr. 1973, 43, 173–191. [Google Scholar] [CrossRef]
  33. Cha, J.Y.; Im, S.; Lee, S.Y.; Ohga, S. Diversity of Fungal Species Isolated from Litter-mycelial Mats in the Litter Layer of a Korean Deciduous Forest. J. Fac. Agric. Kyushu Univ. 2011, 56, 237–241. [Google Scholar] [CrossRef]
  34. Matthews, S. The water vapour conductance of Eucalyptus litter layers. Agric. For. Meteorol. 2005, 135, 73–81. [Google Scholar] [CrossRef]
Figure 1. Locations of lysimeters in the Mt. Taehwa University Forest (TUF), Korea.
Forests 14 00478 g001
Figure 2. Litter lysimeter (a) and schematic diagram of the lysimeter (b).
Forests 14 00478 g002
Figure 3. Variation in water retention with litter amount.
Forests 14 00478 g003
Figure 4. Variation in minimum water retention with rainfall and the corresponding envelope curve.
Forests 14 00478 g004
Figure 5. Depletion curve of litter moisture after the cessation of rainfall.
Forests 14 00478 g005
Figure 6. Variation in litter drainage with rainfall.
Forests 14 00478 g006
Table 1. Tree and leaf litter characteristics.
ForestTree Sample (n = 12) Leaf Sample
Tree
Species
DBH
(cm)
Height
(m)
nLength
(mm)
Width
(mm)
Dry
Weight
(kg/m2)
DeciduousQ. acutissima24.1 ± 8.513.6 ± 3.367155.1 ± 22.041.2 ± 7.50.09 ± 0.02
ConiferousP. koraiensis33.2 ± 1.518.4 ± 1.560084.9 ± 16.10.8 ± 0.10.18 ± 0.02
Table 2. Characteristics of rainfall and leaf load at each lysimeter location.
LysimeterLitter Load (kg/m2) 1Rainfall Data
Air-DriedOven-DriedNo. EventAmount
(mm)
Duration
(h)
Intensity 2
(mm/h)
TBK11.421.26999.19 ± 13.995.14 ± 5.463.54 ± 4.77
TBK20.620.55709.68 ± 14.595.55 ± 5.643.55 ± 4.96
TBK31.521.368511.76 ± 19.905.91 ± 6.074.17 ± 5.77
TCK10.940.589113.06 ± 22.366.88 ± 7.723.70 ± 5.79
TCK20.750.468011.57 ± 22.135.36 ± 5.584.22 ± 6.58
TCK31.400.868712.55 ± 24.655.32 ± 6.024.49 ± 7.03
1 Weight of litter piled in the lysimeter container; 2 1-h maximum intensity for a rainfall event.
Table 3. Water retention in leaf litter per rainfall event.
LysimeterMaximum Retention
Storage (mm)
Minimum Retention
Storage (mm)
TBK11.69 ± 1.281.46 ± 1.21
TBK21.46 ± 1.331.35 ± 1.32
TBK31.67 ± 1.571.56 ± 1.47
TCK11.75 ± 1.791.58 ± 1.75
TCK21.90 ± 1.791.89 ± 1.74
TCK32.01 ± 1.991.97 ± 1.90
Table 4. Water balance analysis for rainfall periods.
LysimeterRainfallWaterEvaporationLitter
Amount (mm) 1Retention (mm)Loss (mm)Drainage (mm)
TBK1836.0103.3 (12.4%) 251.9 (6.2%)680.8 (81.4%)
TBK2774.684.9 (11.0%)33.5 (4.3%)656.2 (84.7%)
TBK31023.3103.2 (10.1%)52.3 (5.1%)867.8 (84.8%)
TCK11292.5166.3 (12.9%)25.5 (2.0%)1100.7 (85.2%)
TCK2809.8120.8 (14.9%)12.2 (1.5%)676.8 (83.6%)
TCK21066.8152.4 (14.3%)14.4 (1.3%)900.0 (84.4%)
1 Rainfall events used for lysimeter measurements are included; 2 Parentheses indicate the portion of rainfall amount.
Disclaimer/Publisher’s Note: The statements, opinions and data contained in all publications are solely those of the individual author(s) and contributor(s) and not of MDPI and/or the editor(s). MDPI and/or the editor(s) disclaim responsibility for any injury to people or property resulting from any ideas, methods, instructions or products referred to in the content.