

An Agent-Based Model of a Sustainable Forest Operation in a Theoretical Lowland Dipterocarp Forest Modeled after Mount Makiling Forest Reserve, Philippines

 ,
,
Abstract
1. Introduction
1.1. Agent-Based Modeling
1.2. Forest Management Regimes
2. Materials and Methods
2.1. Model Description
2.1.1. Overview
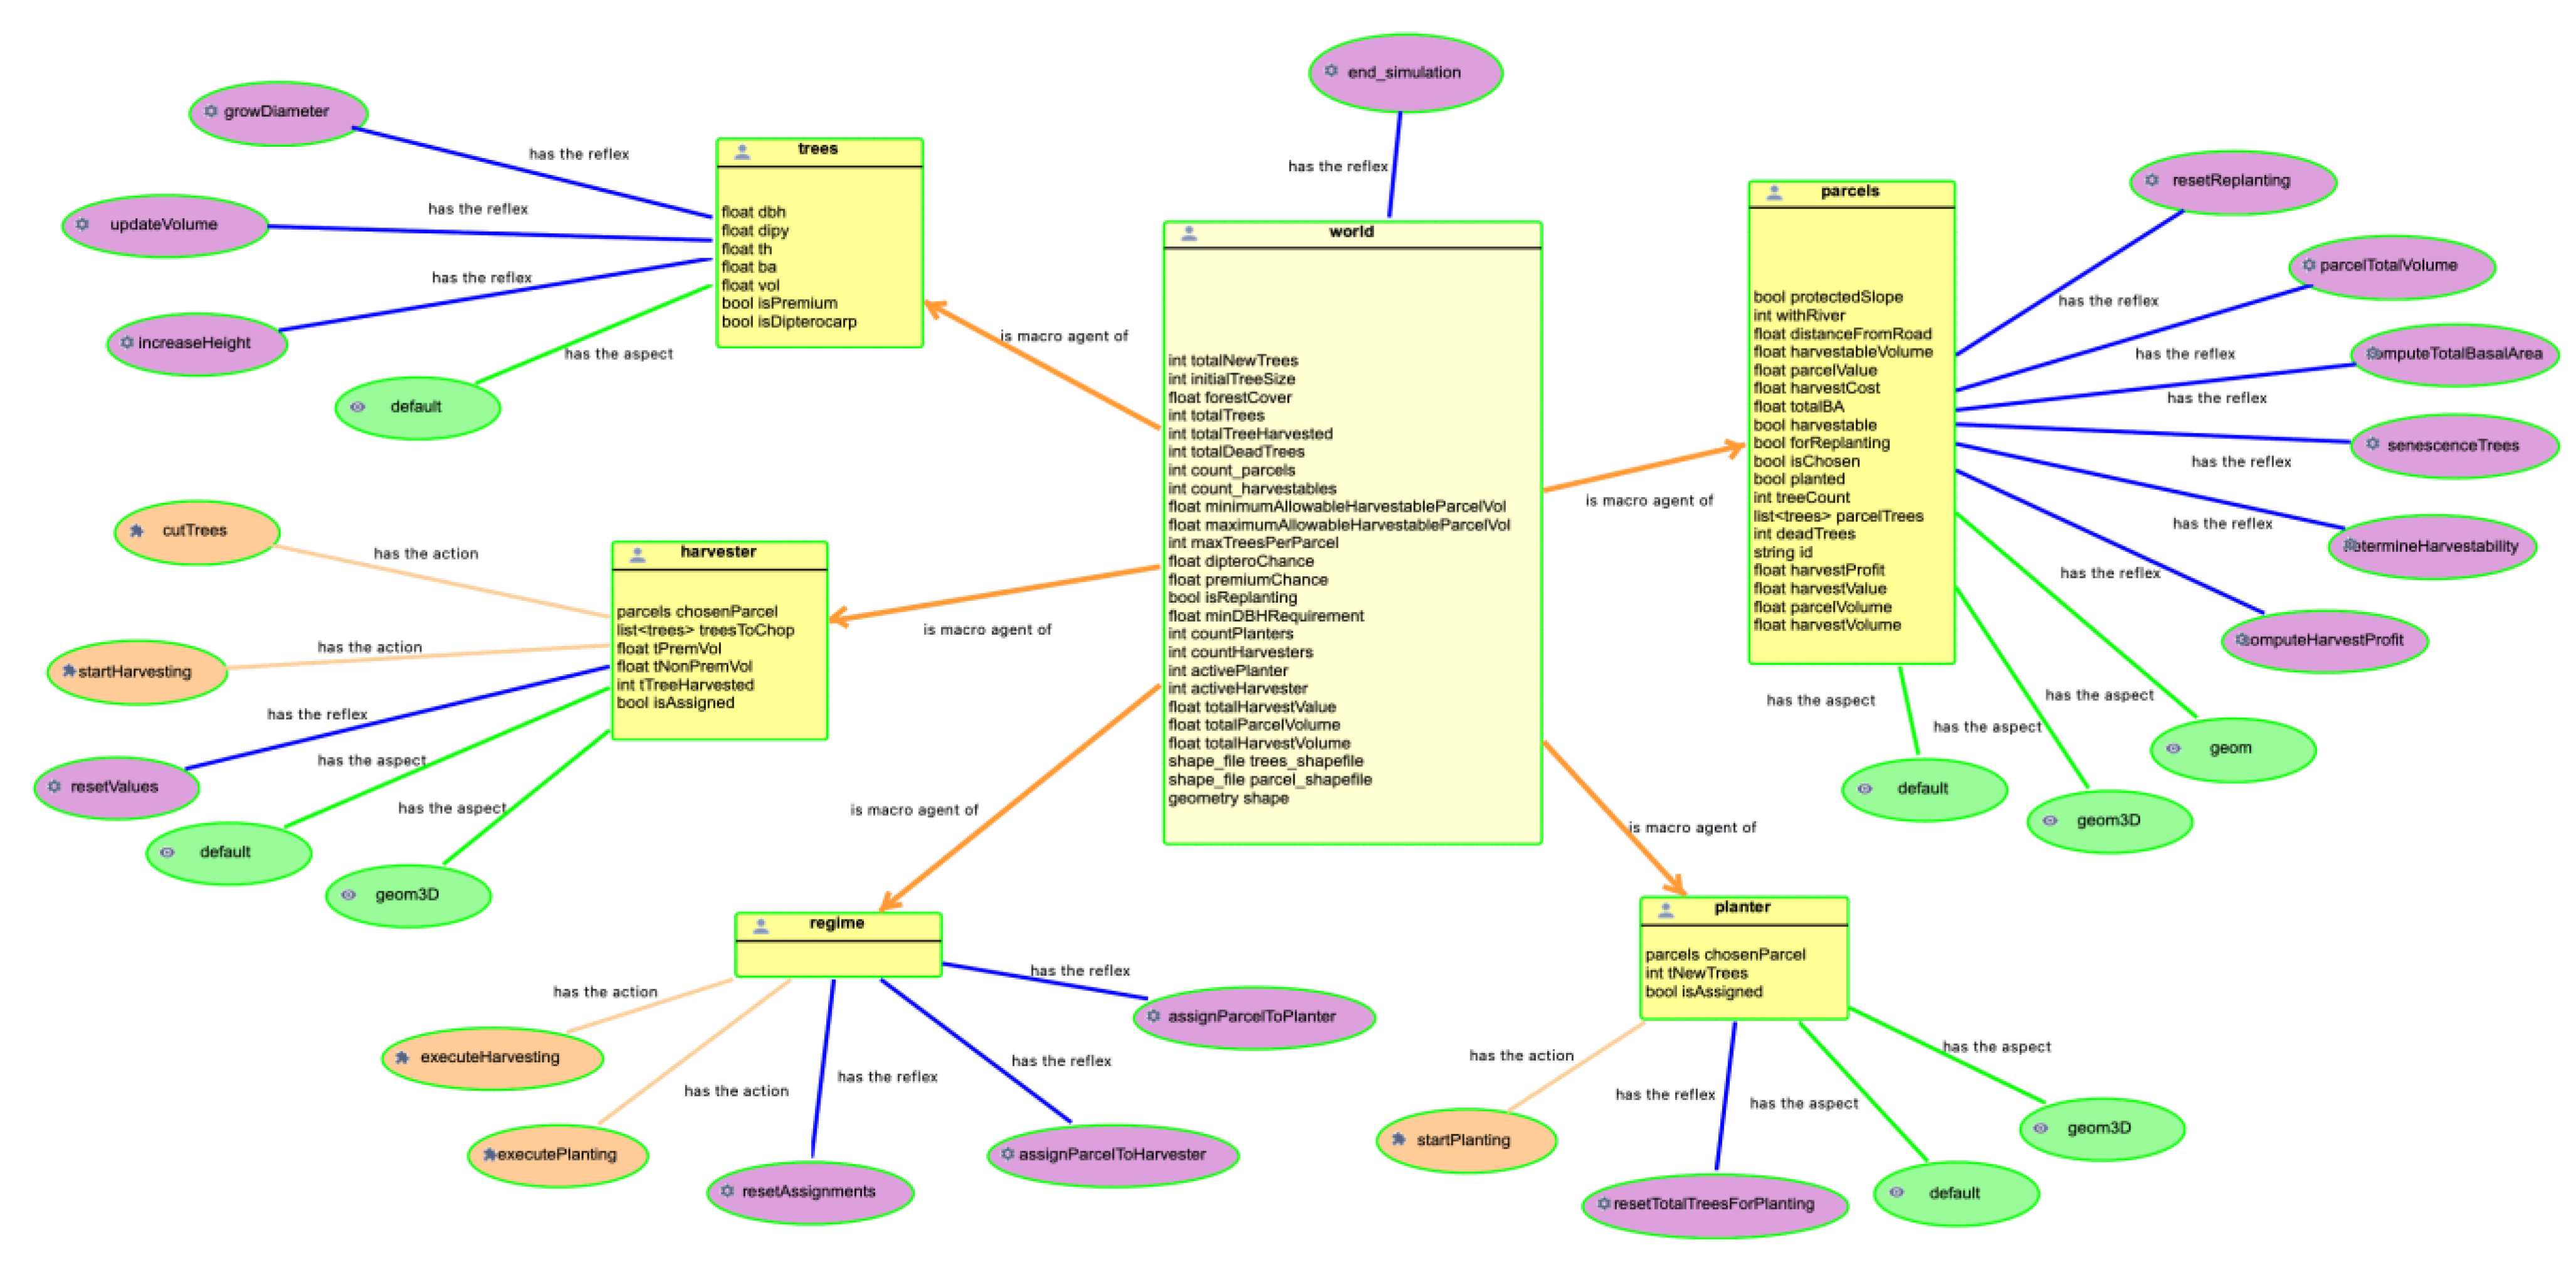
Entities
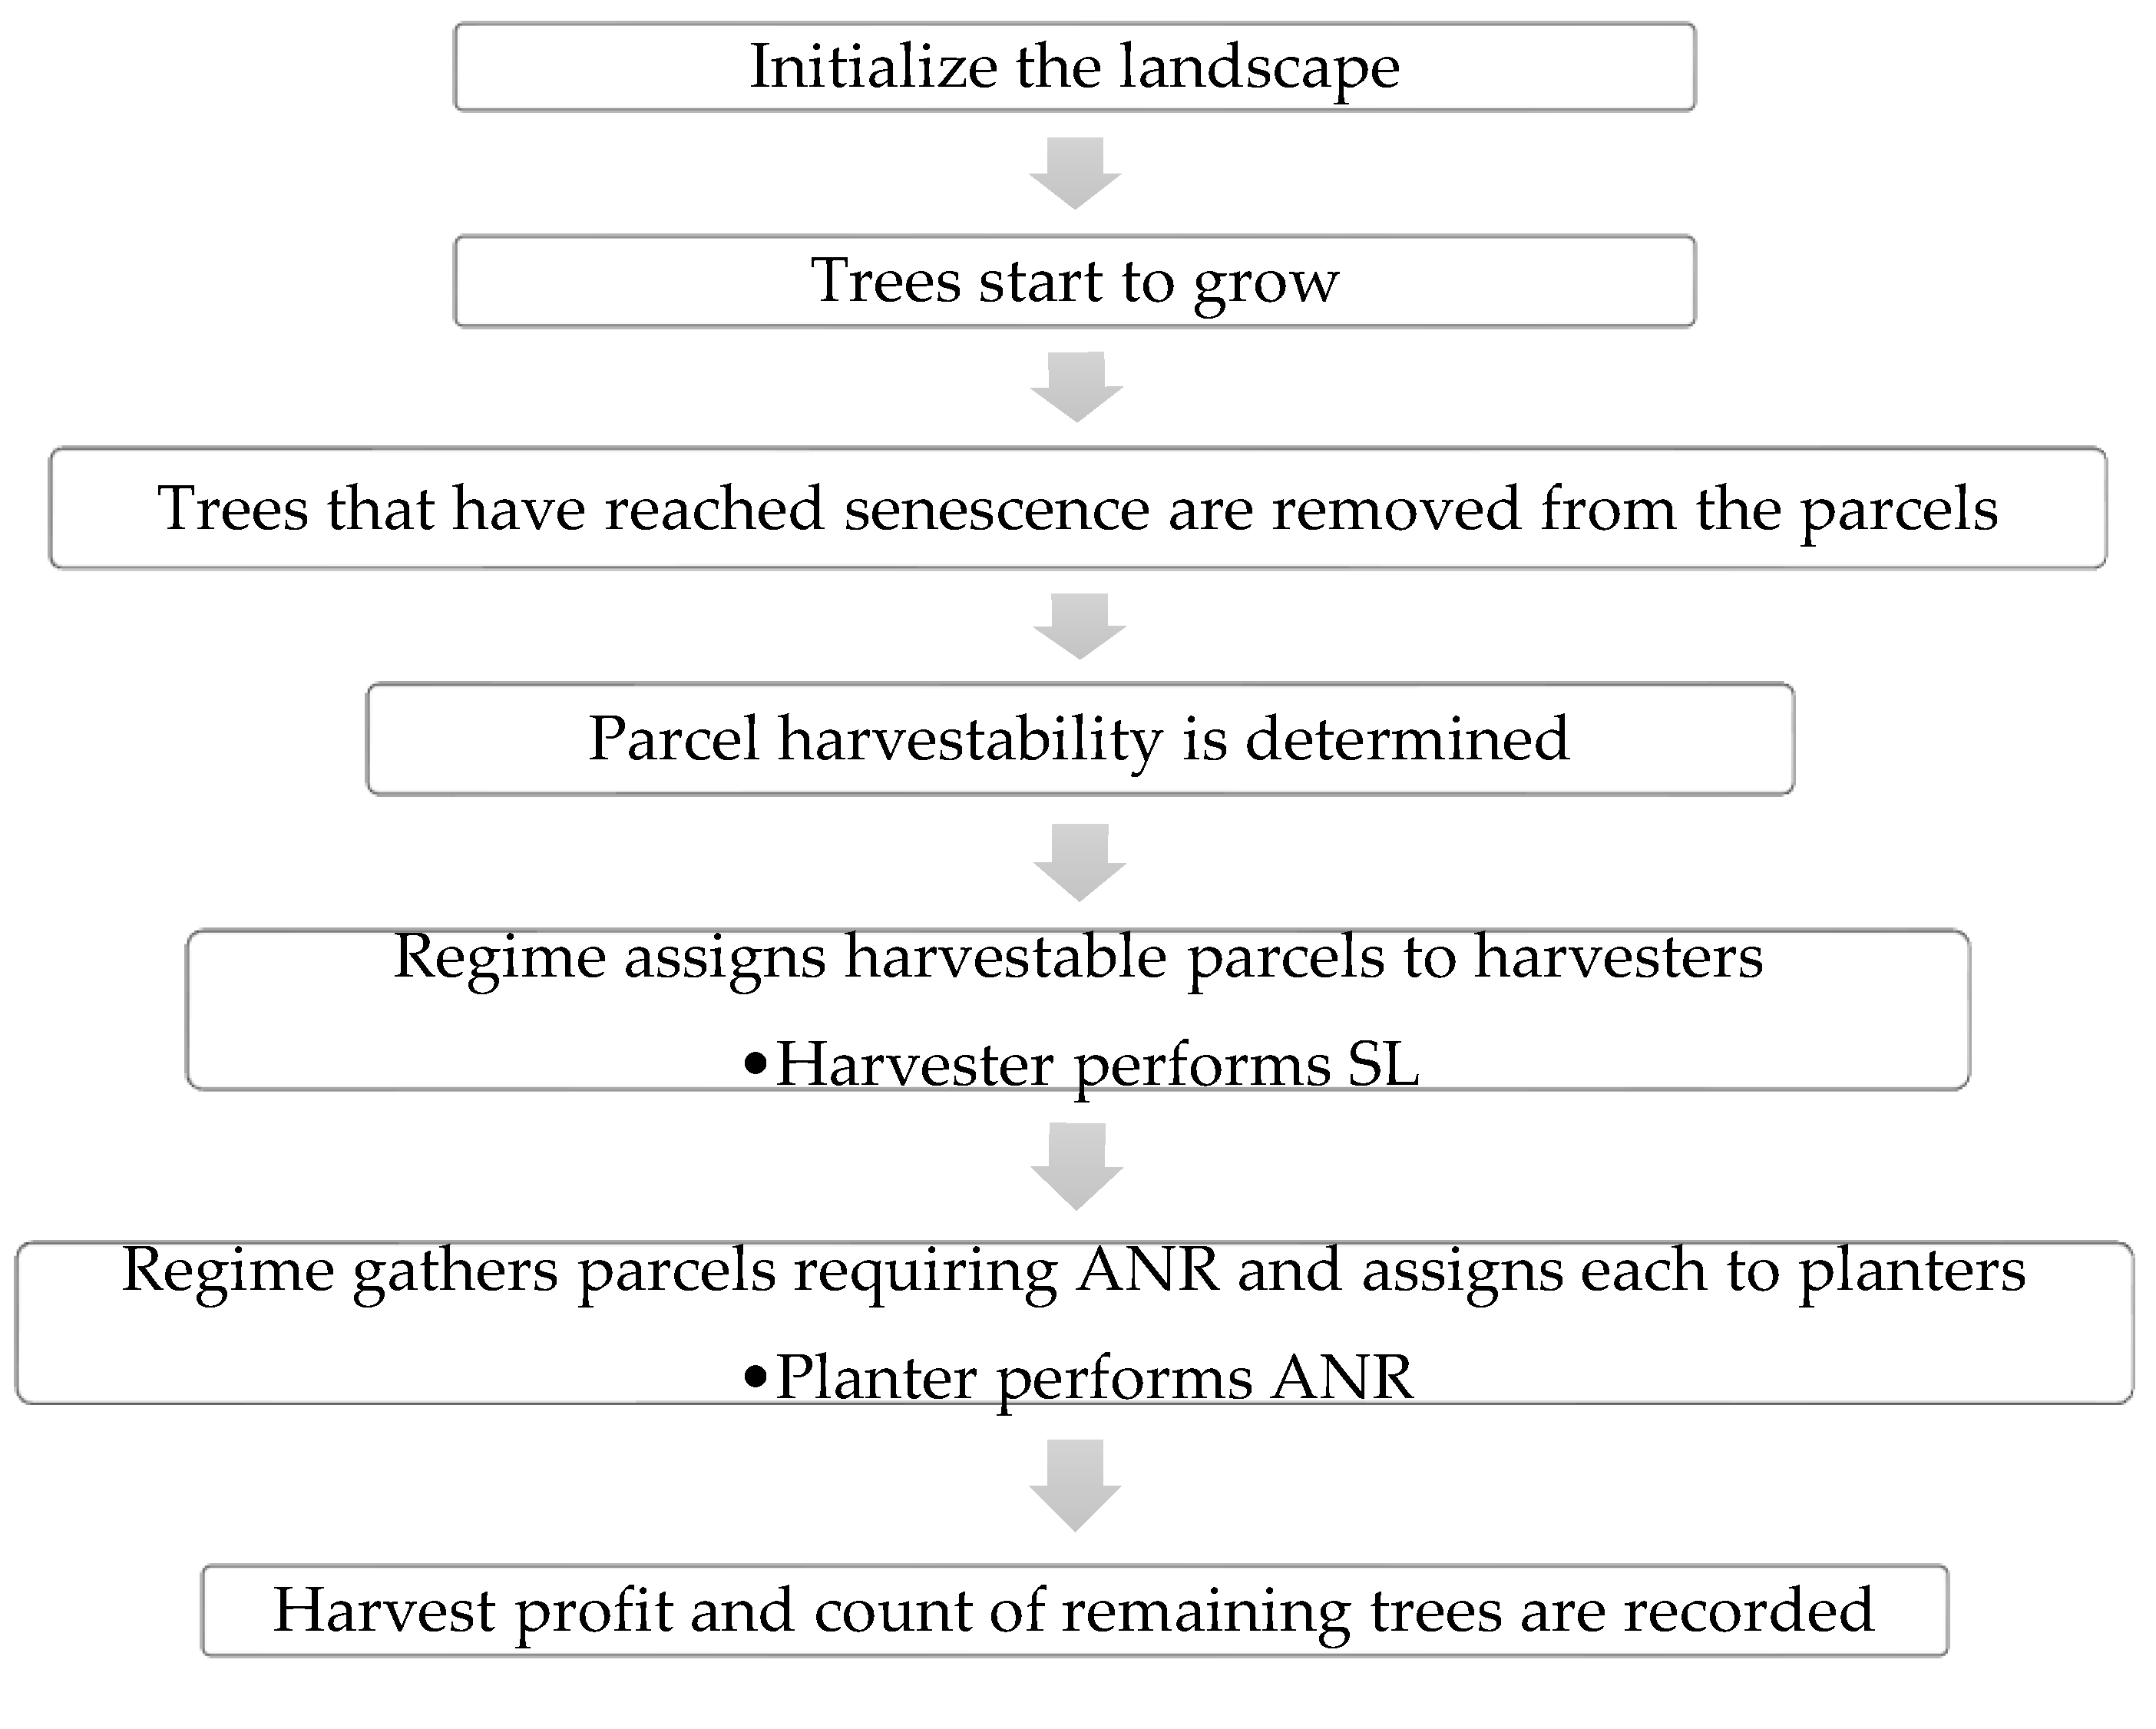
Process Overview and Scheduling
2.1.2. Design Concepts
2.1.3. Implementation Details
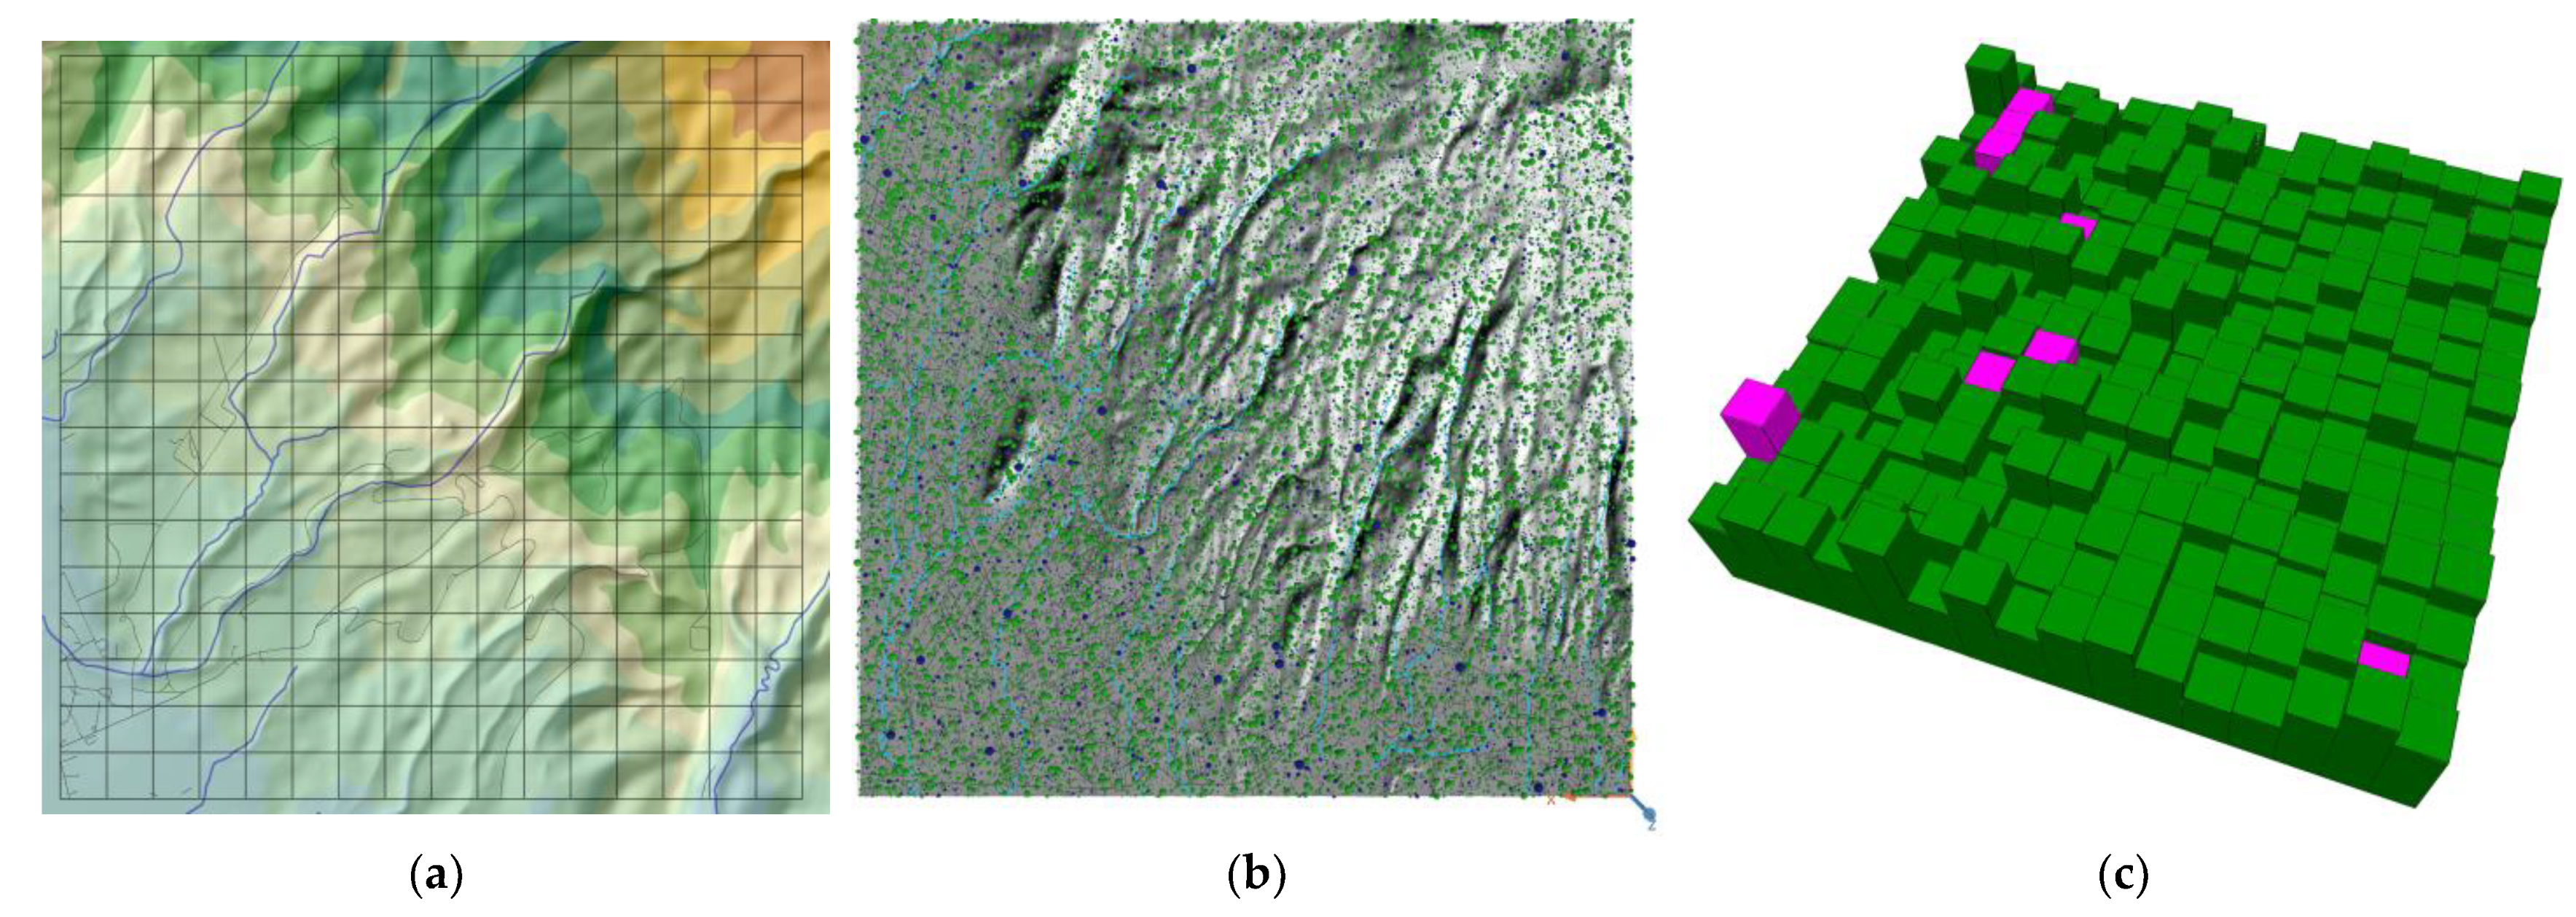
Initialization
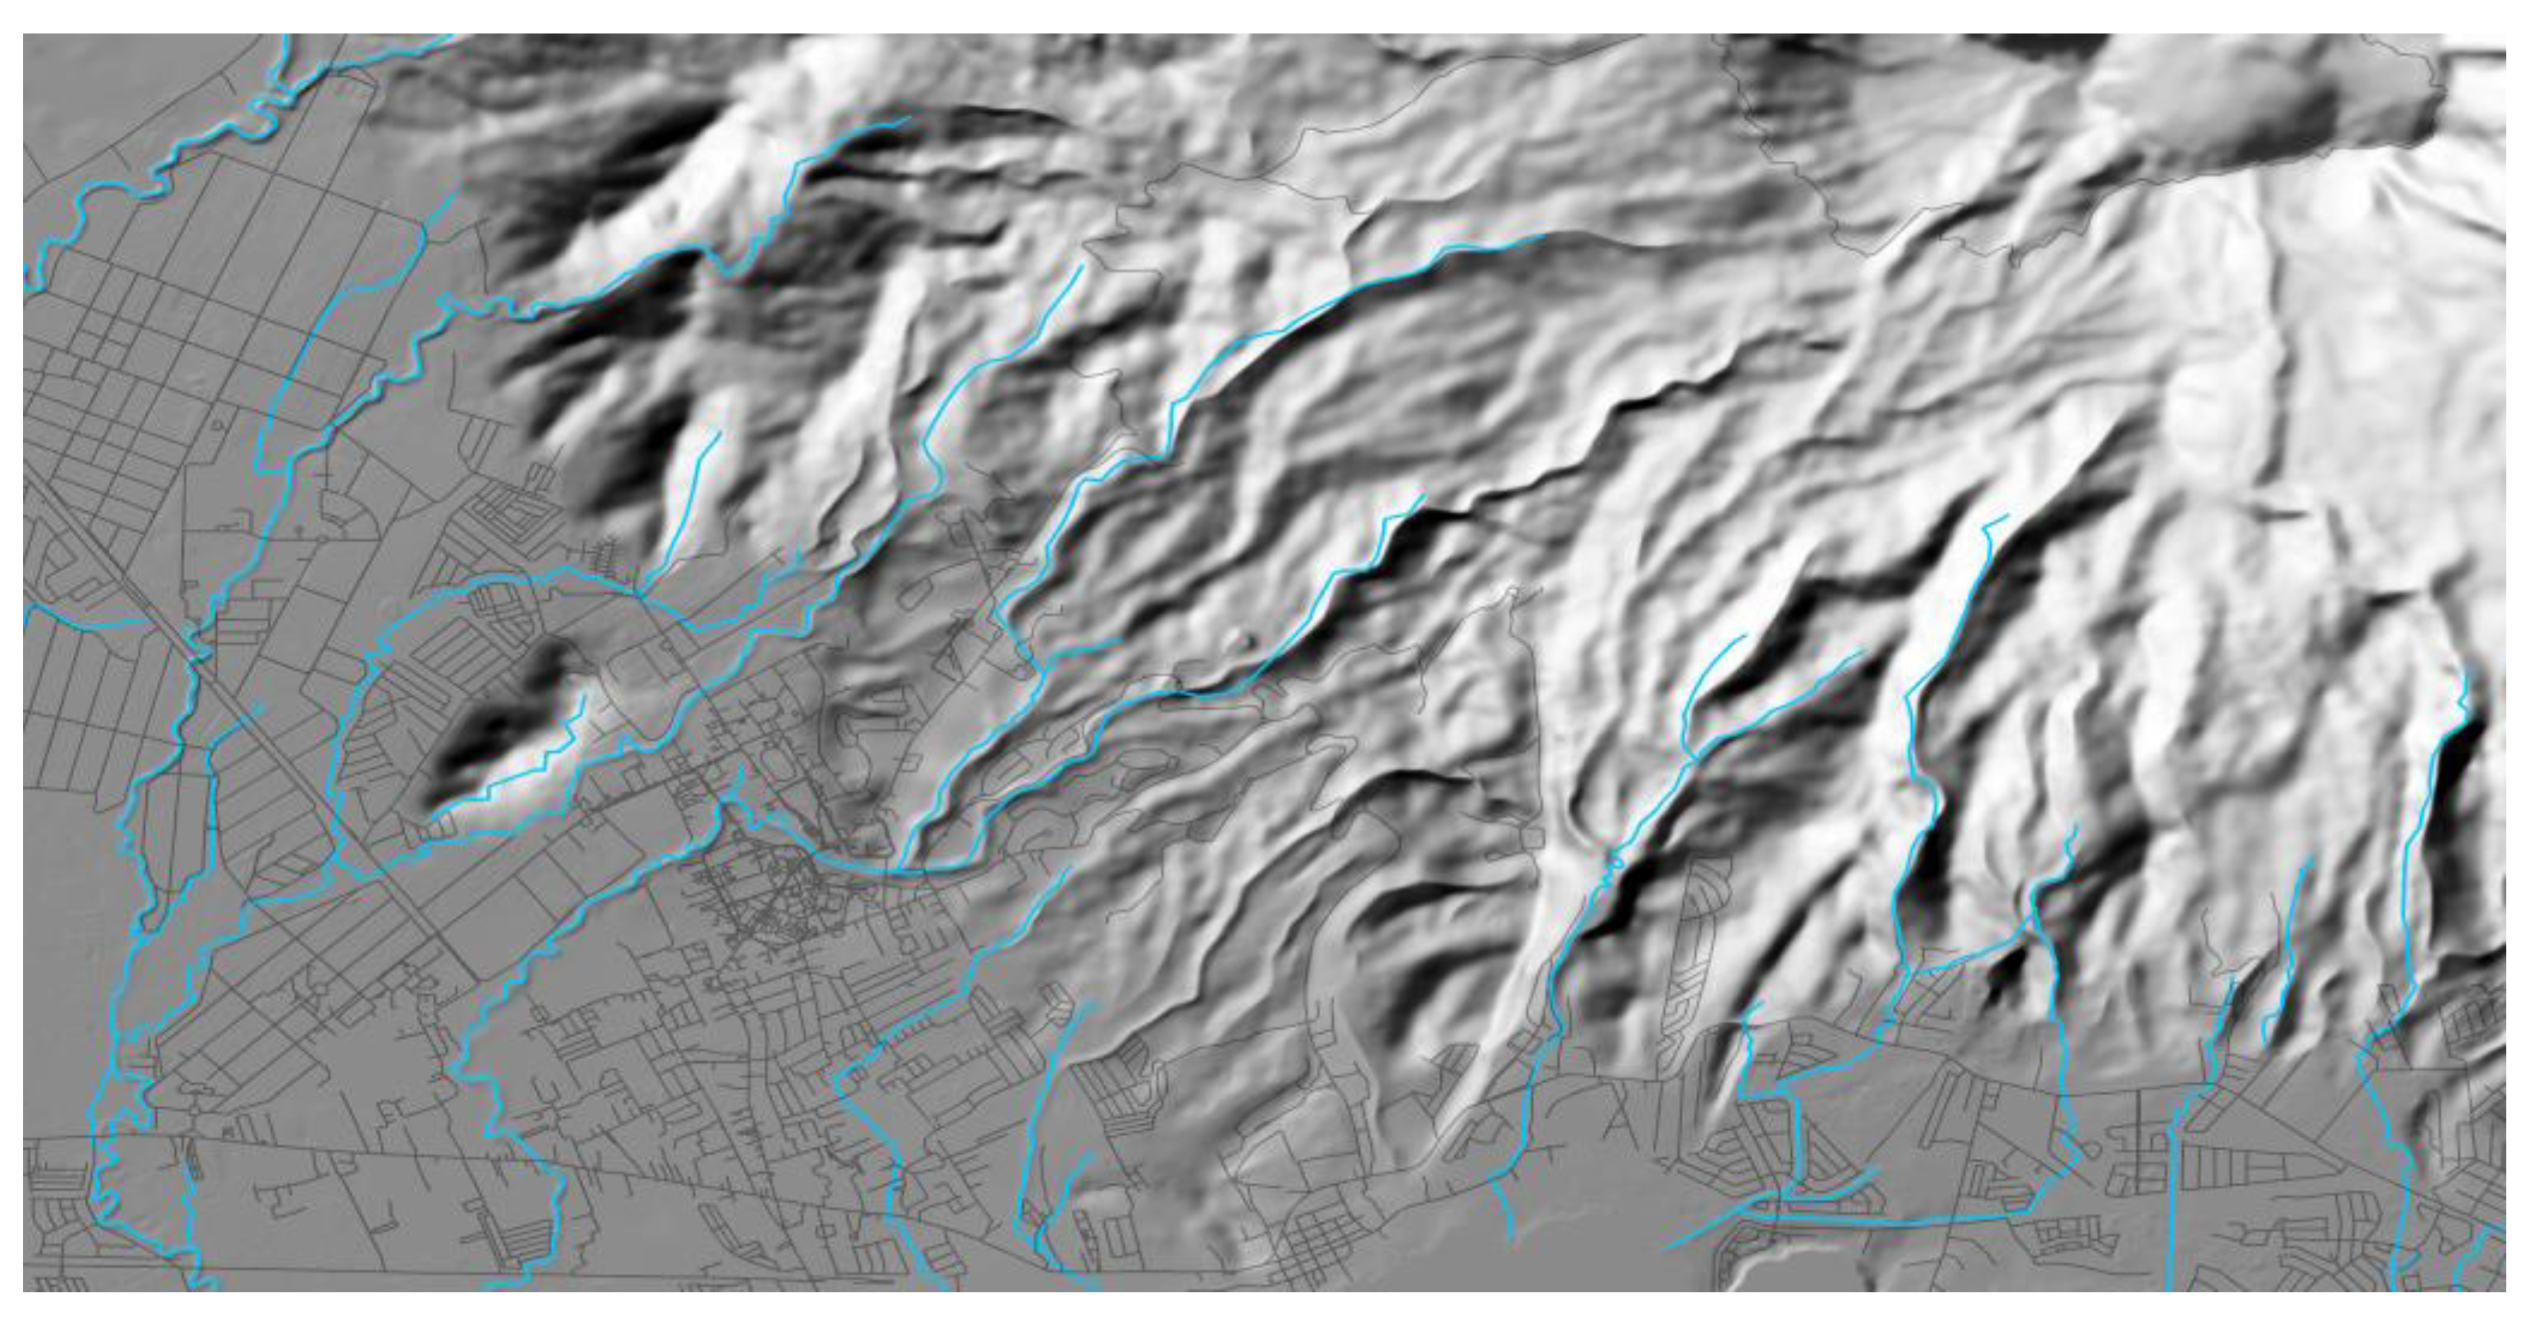
Input Data
Submodels
- Selective Logging
- Assisted Natural Regeneration
2.2. Economic Analysis of Timber Extraction
3. Results and Discussion
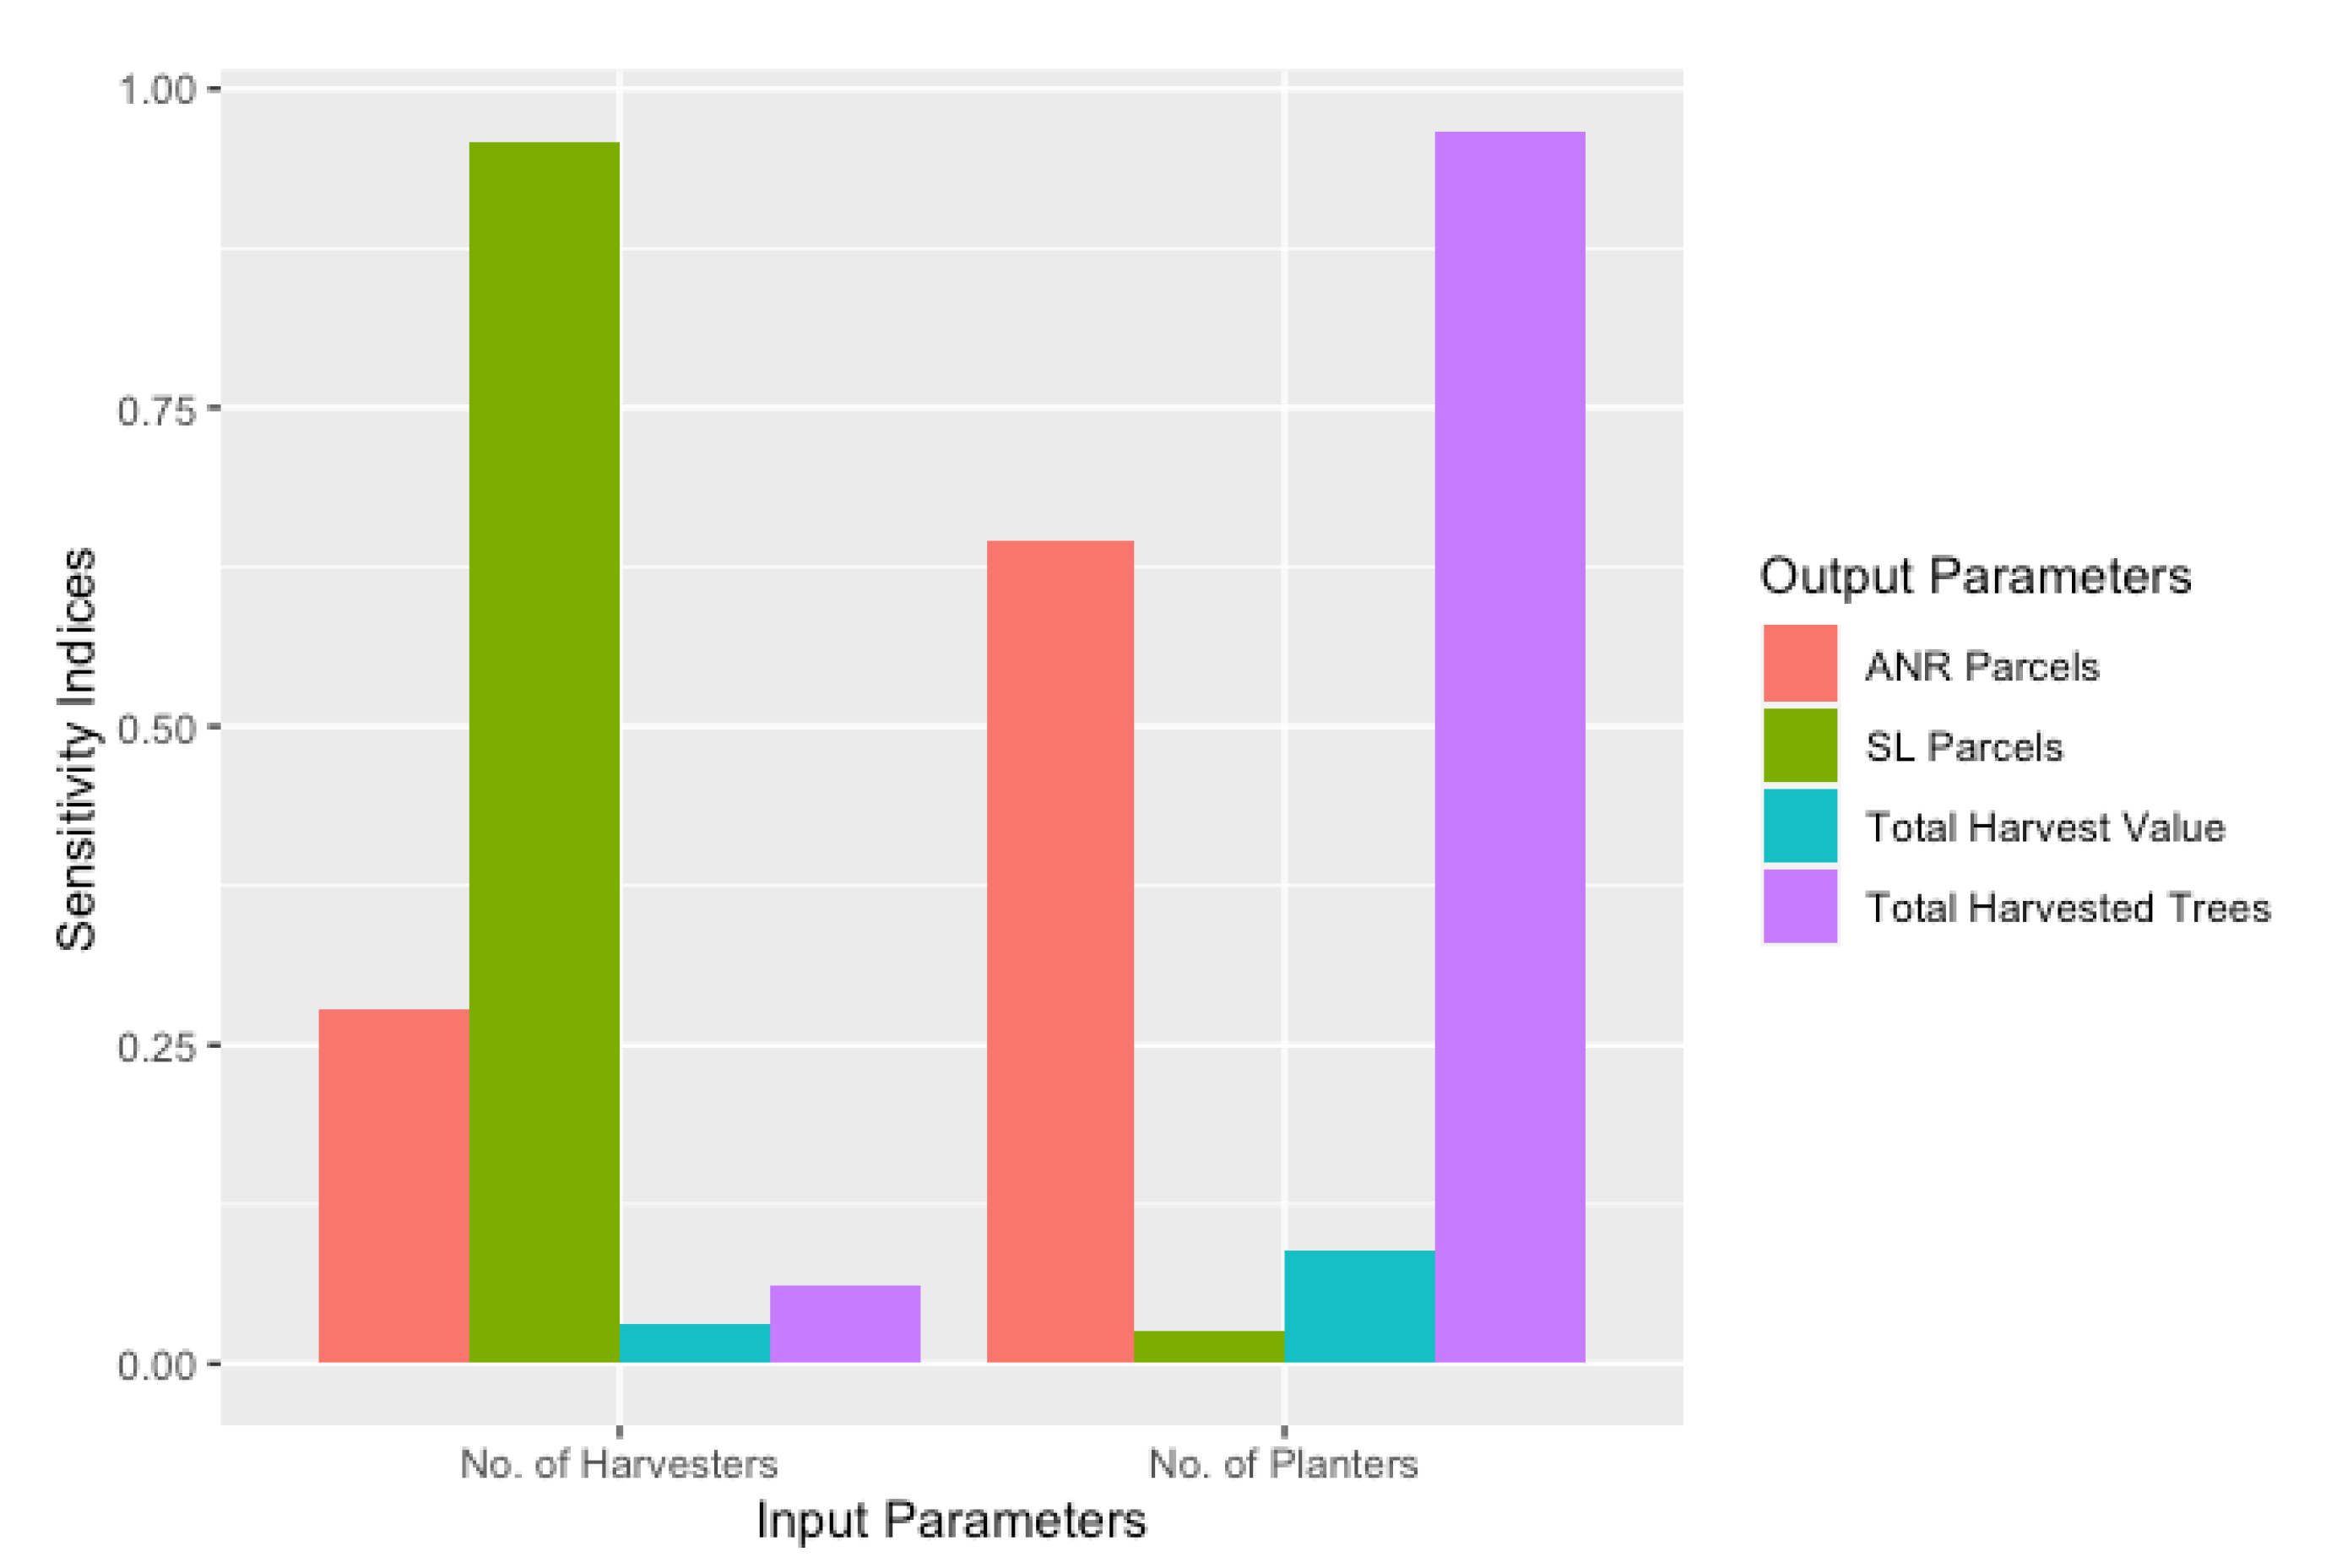
3.1. Model Exploration and Analysis
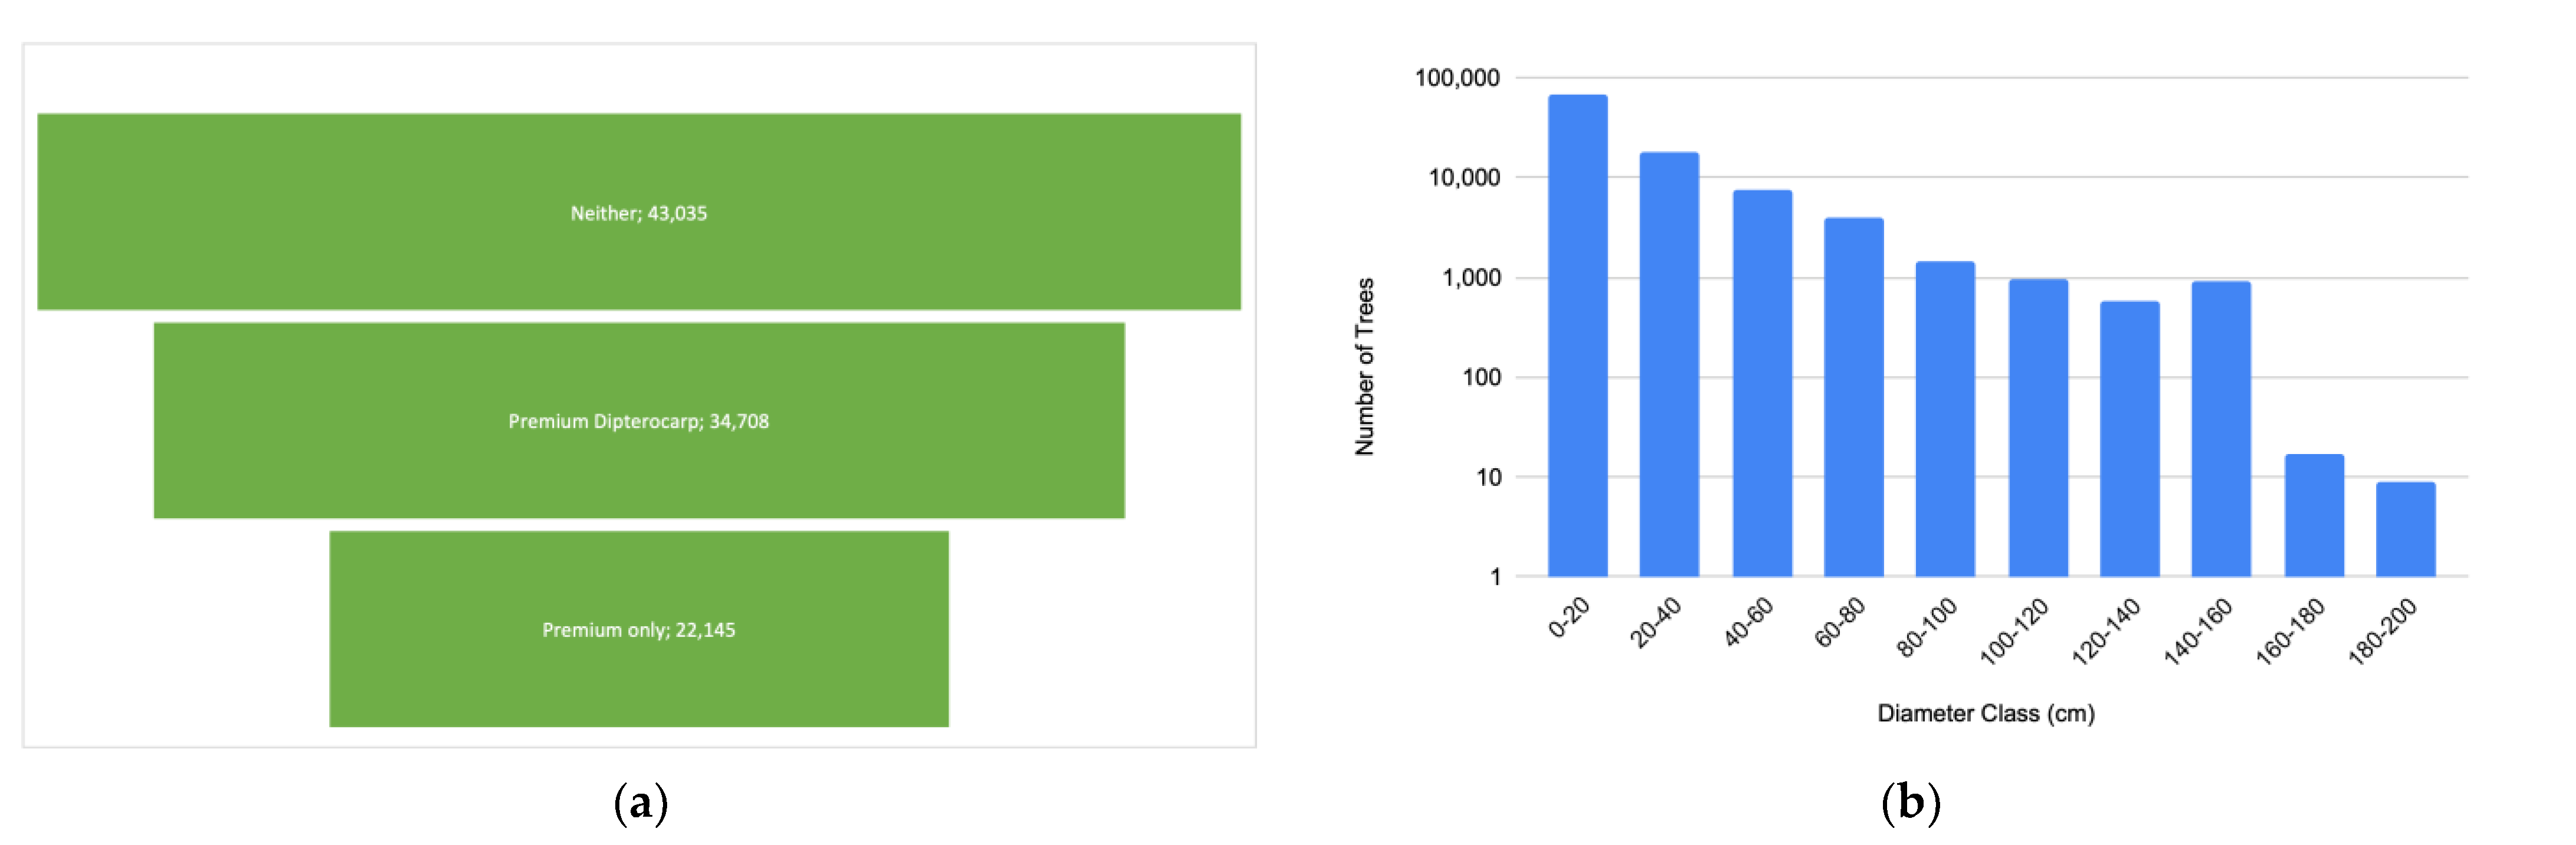
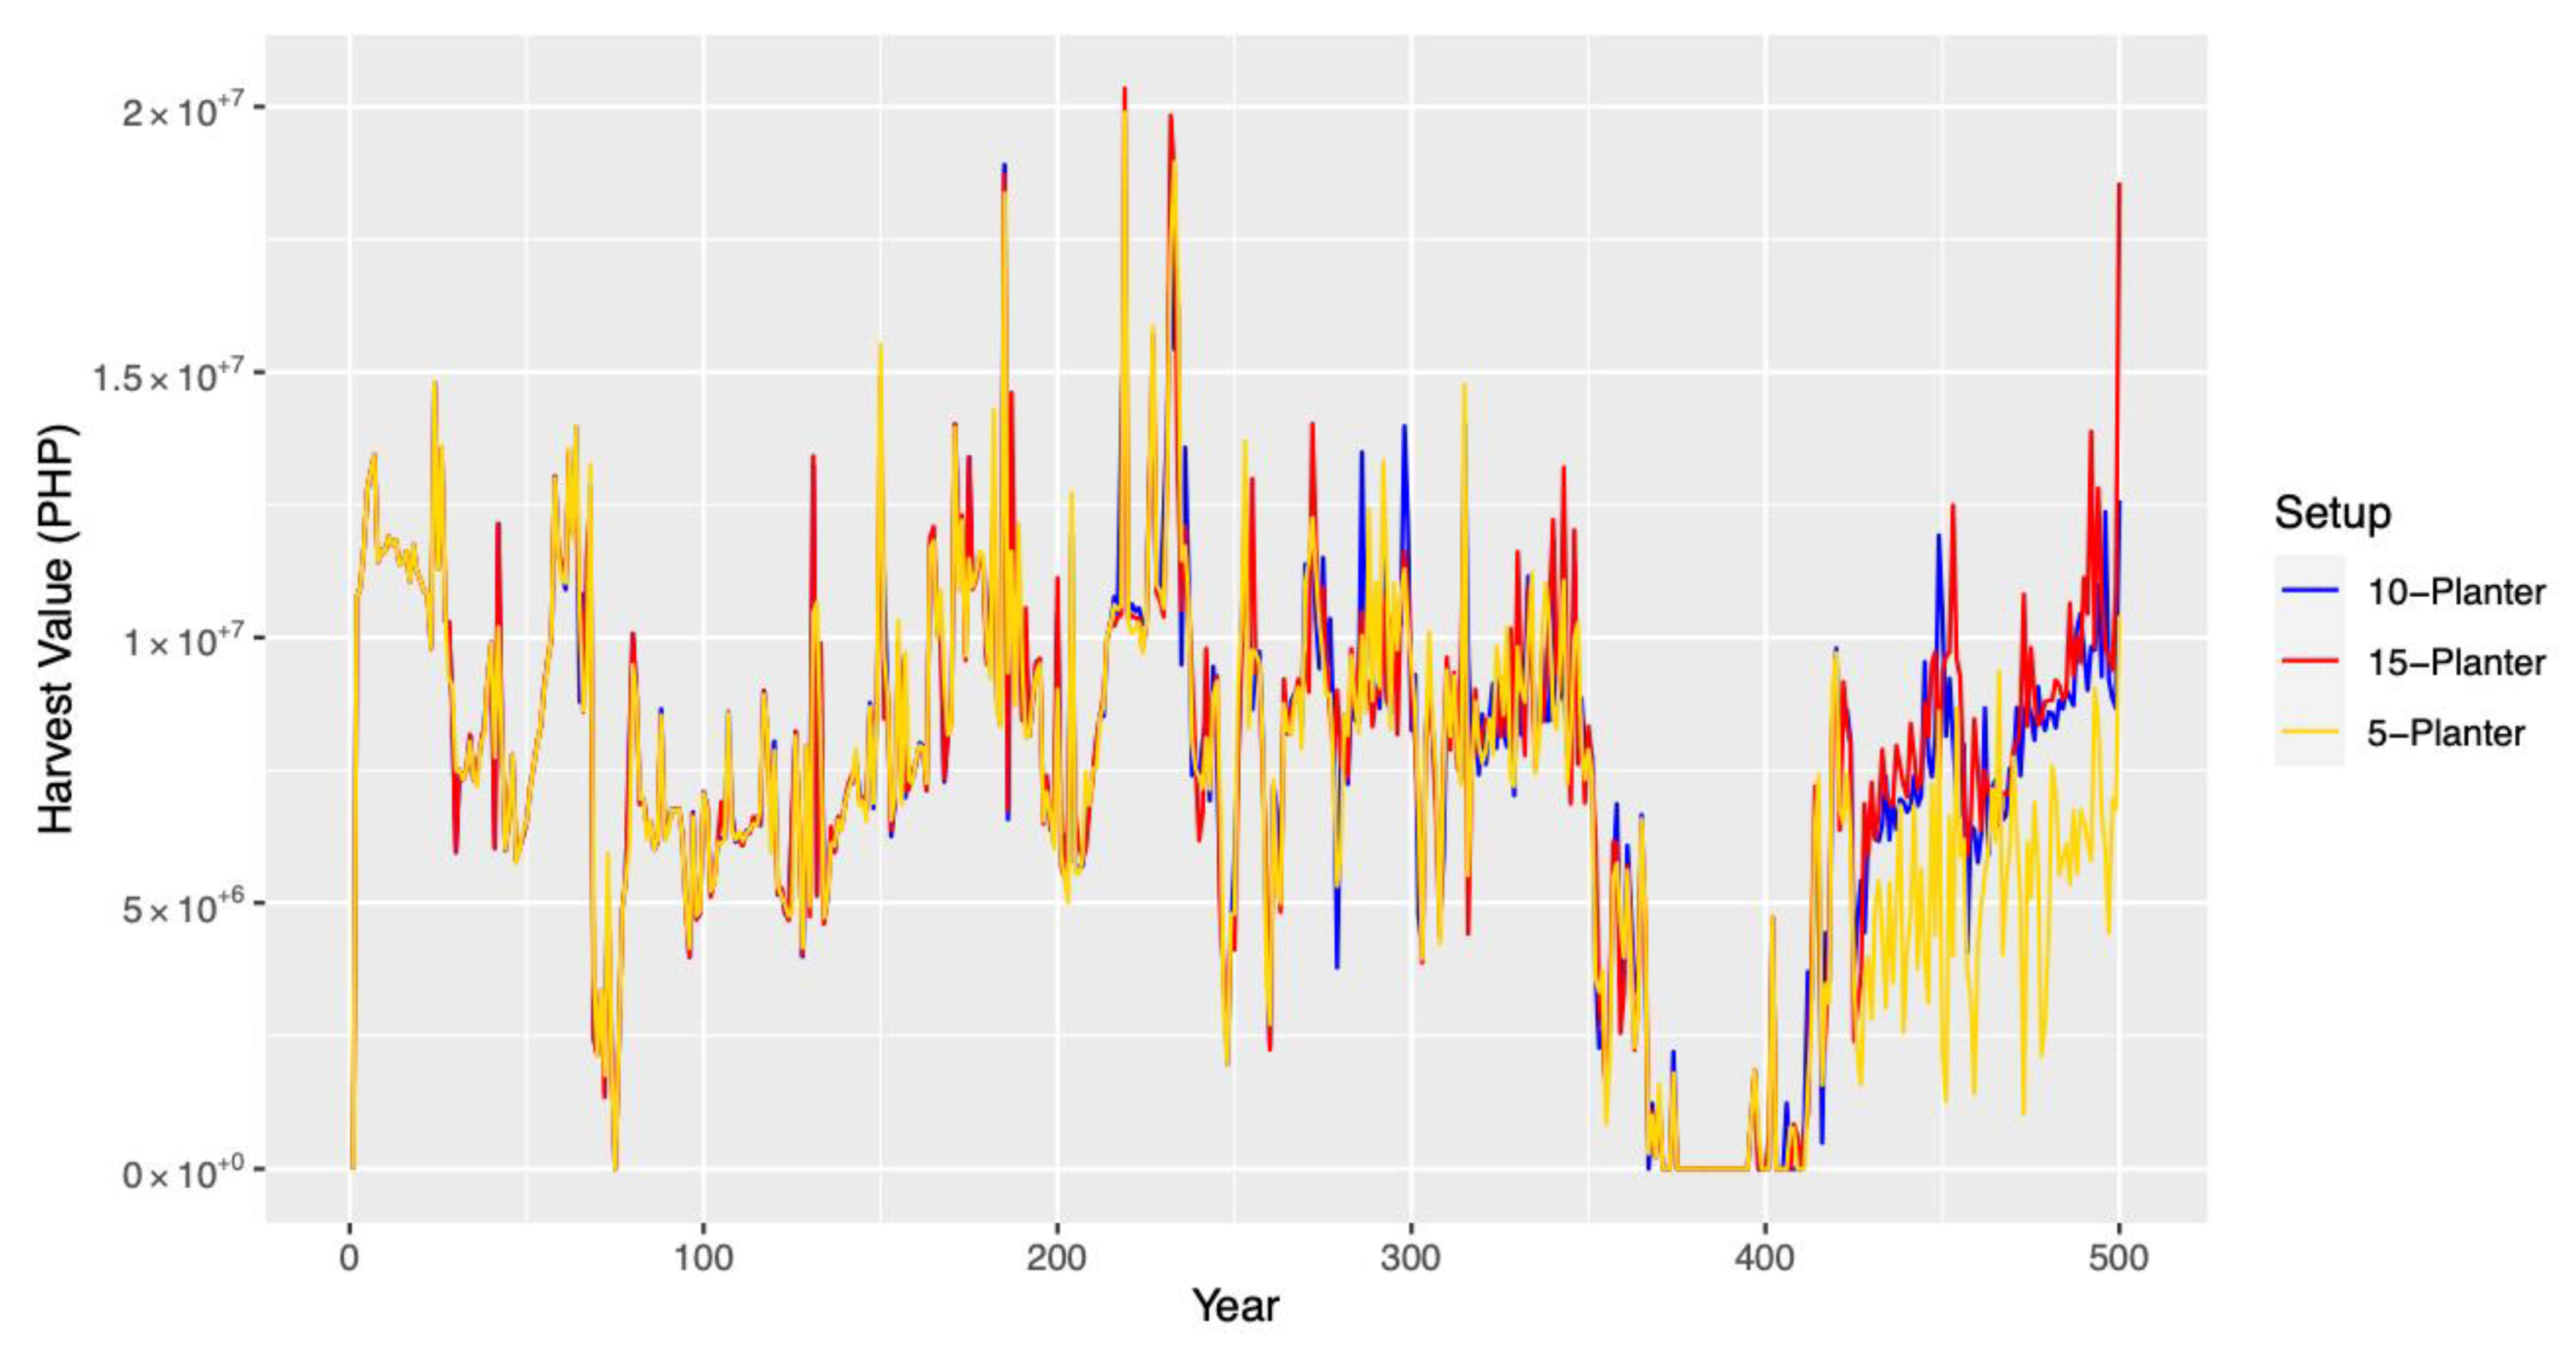
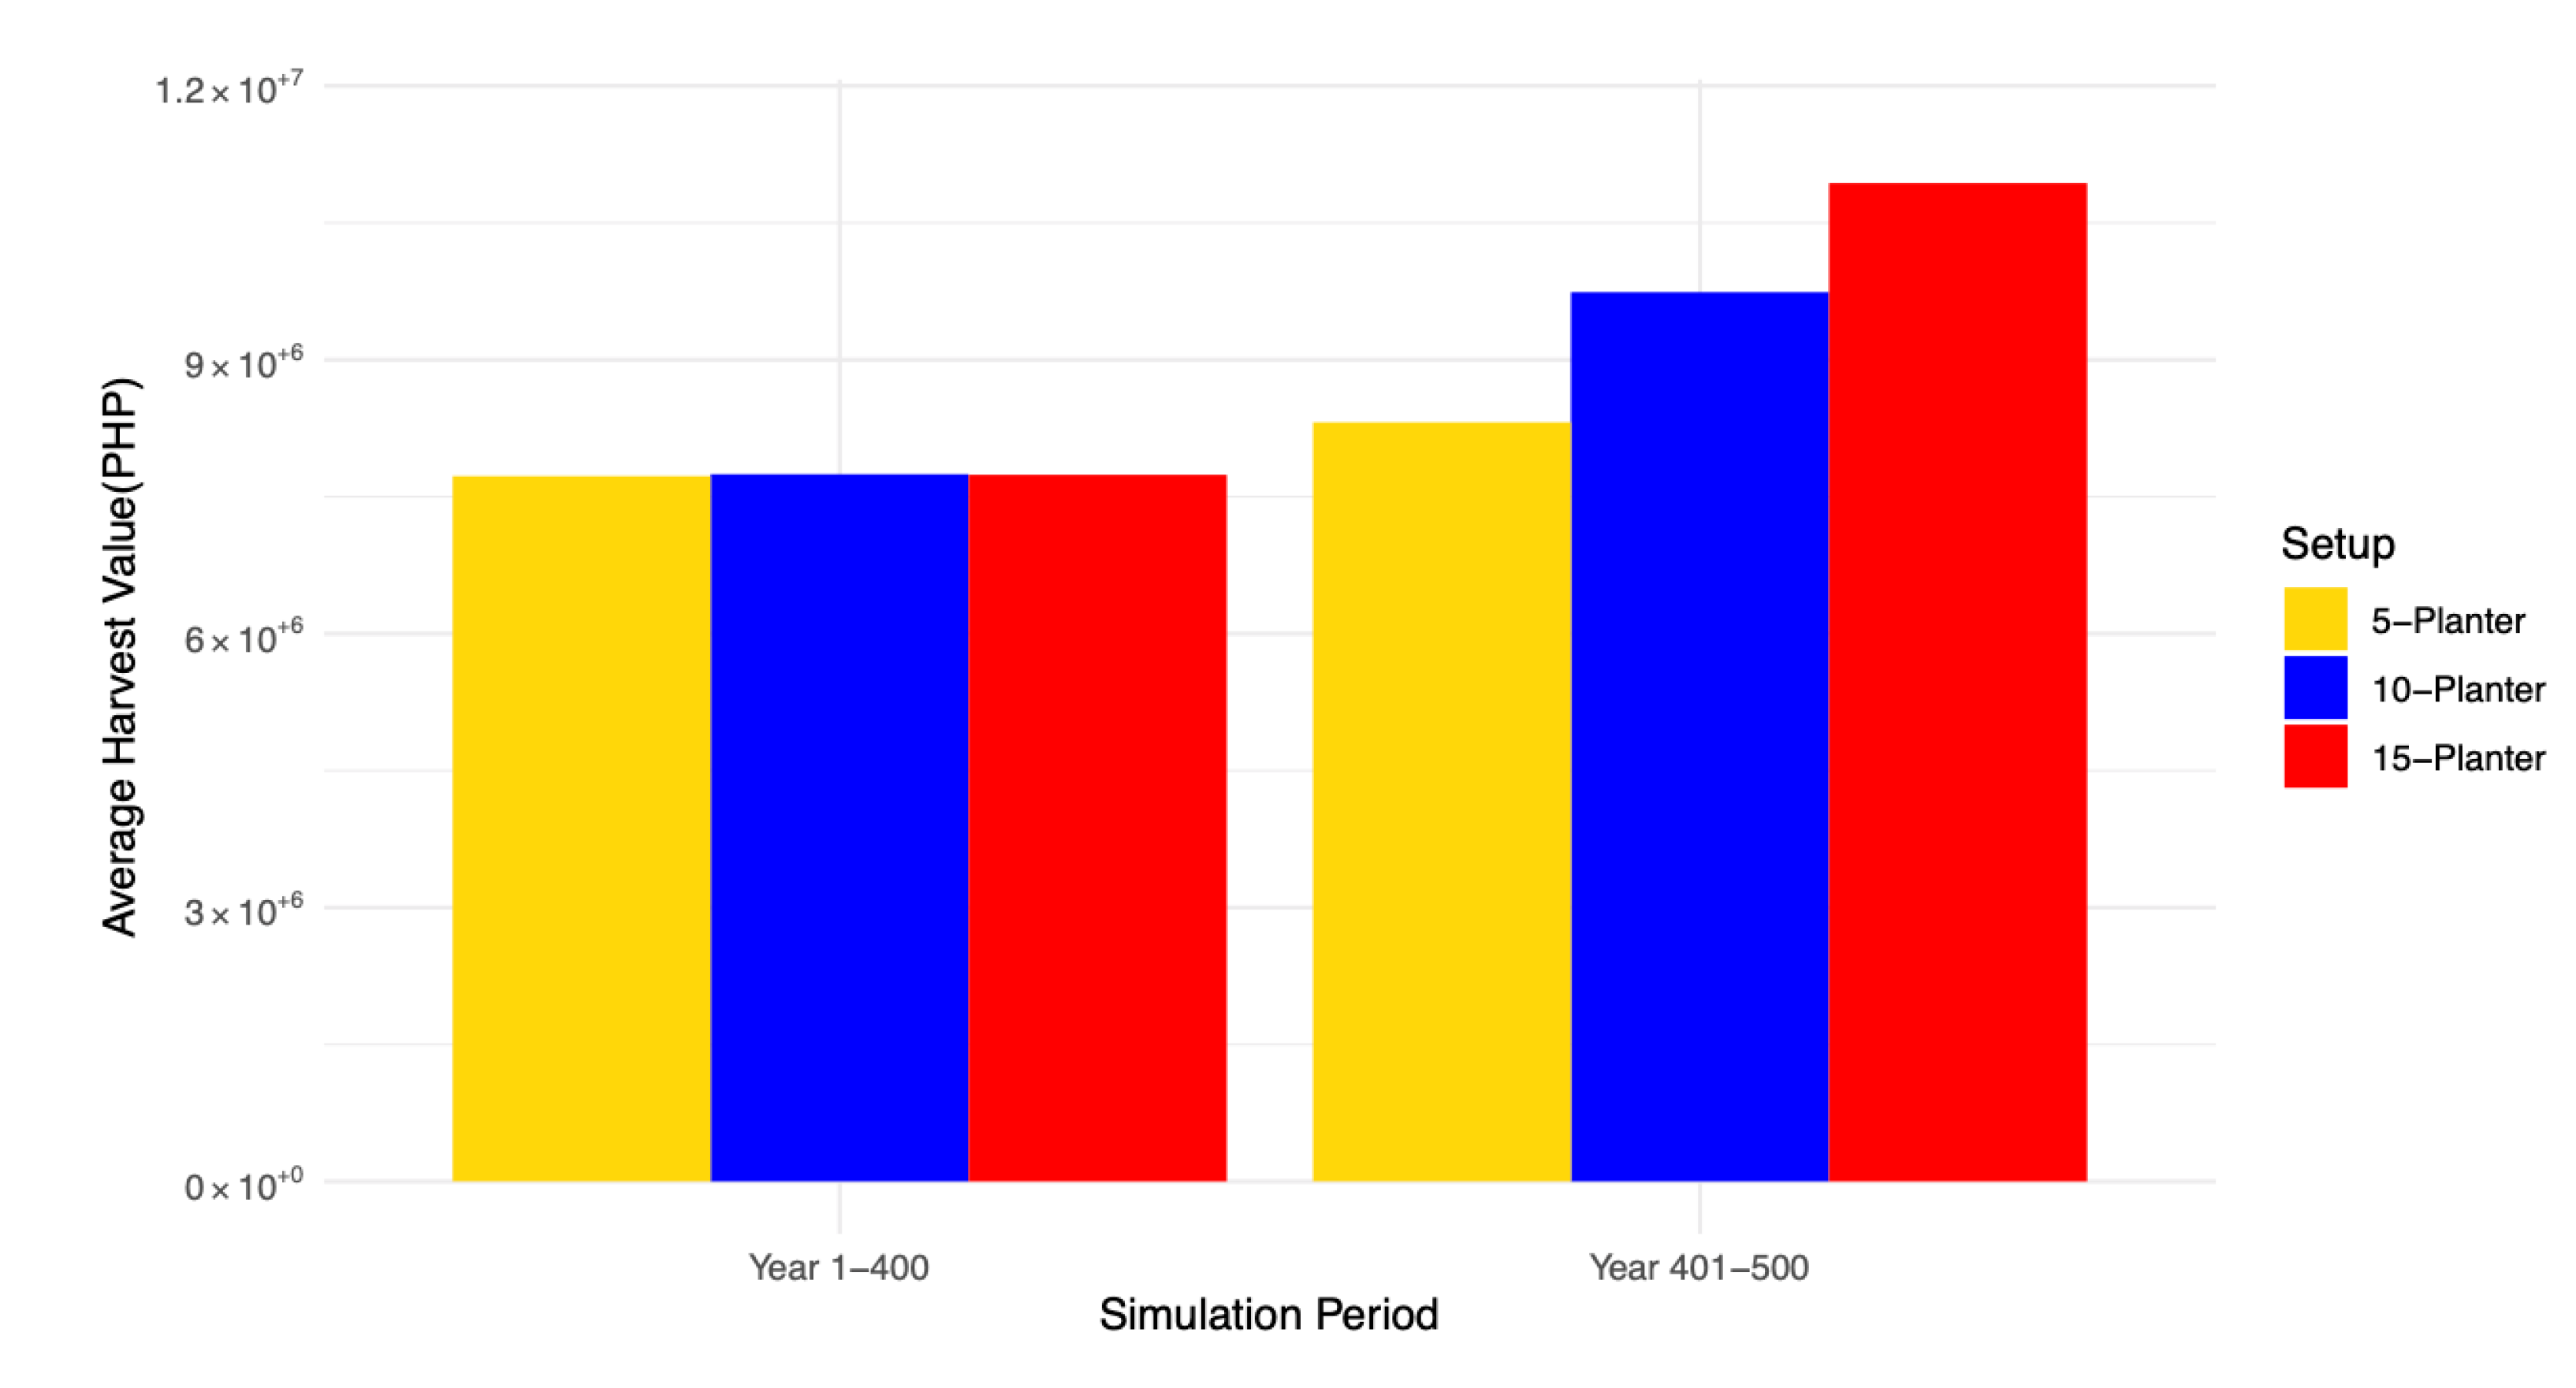
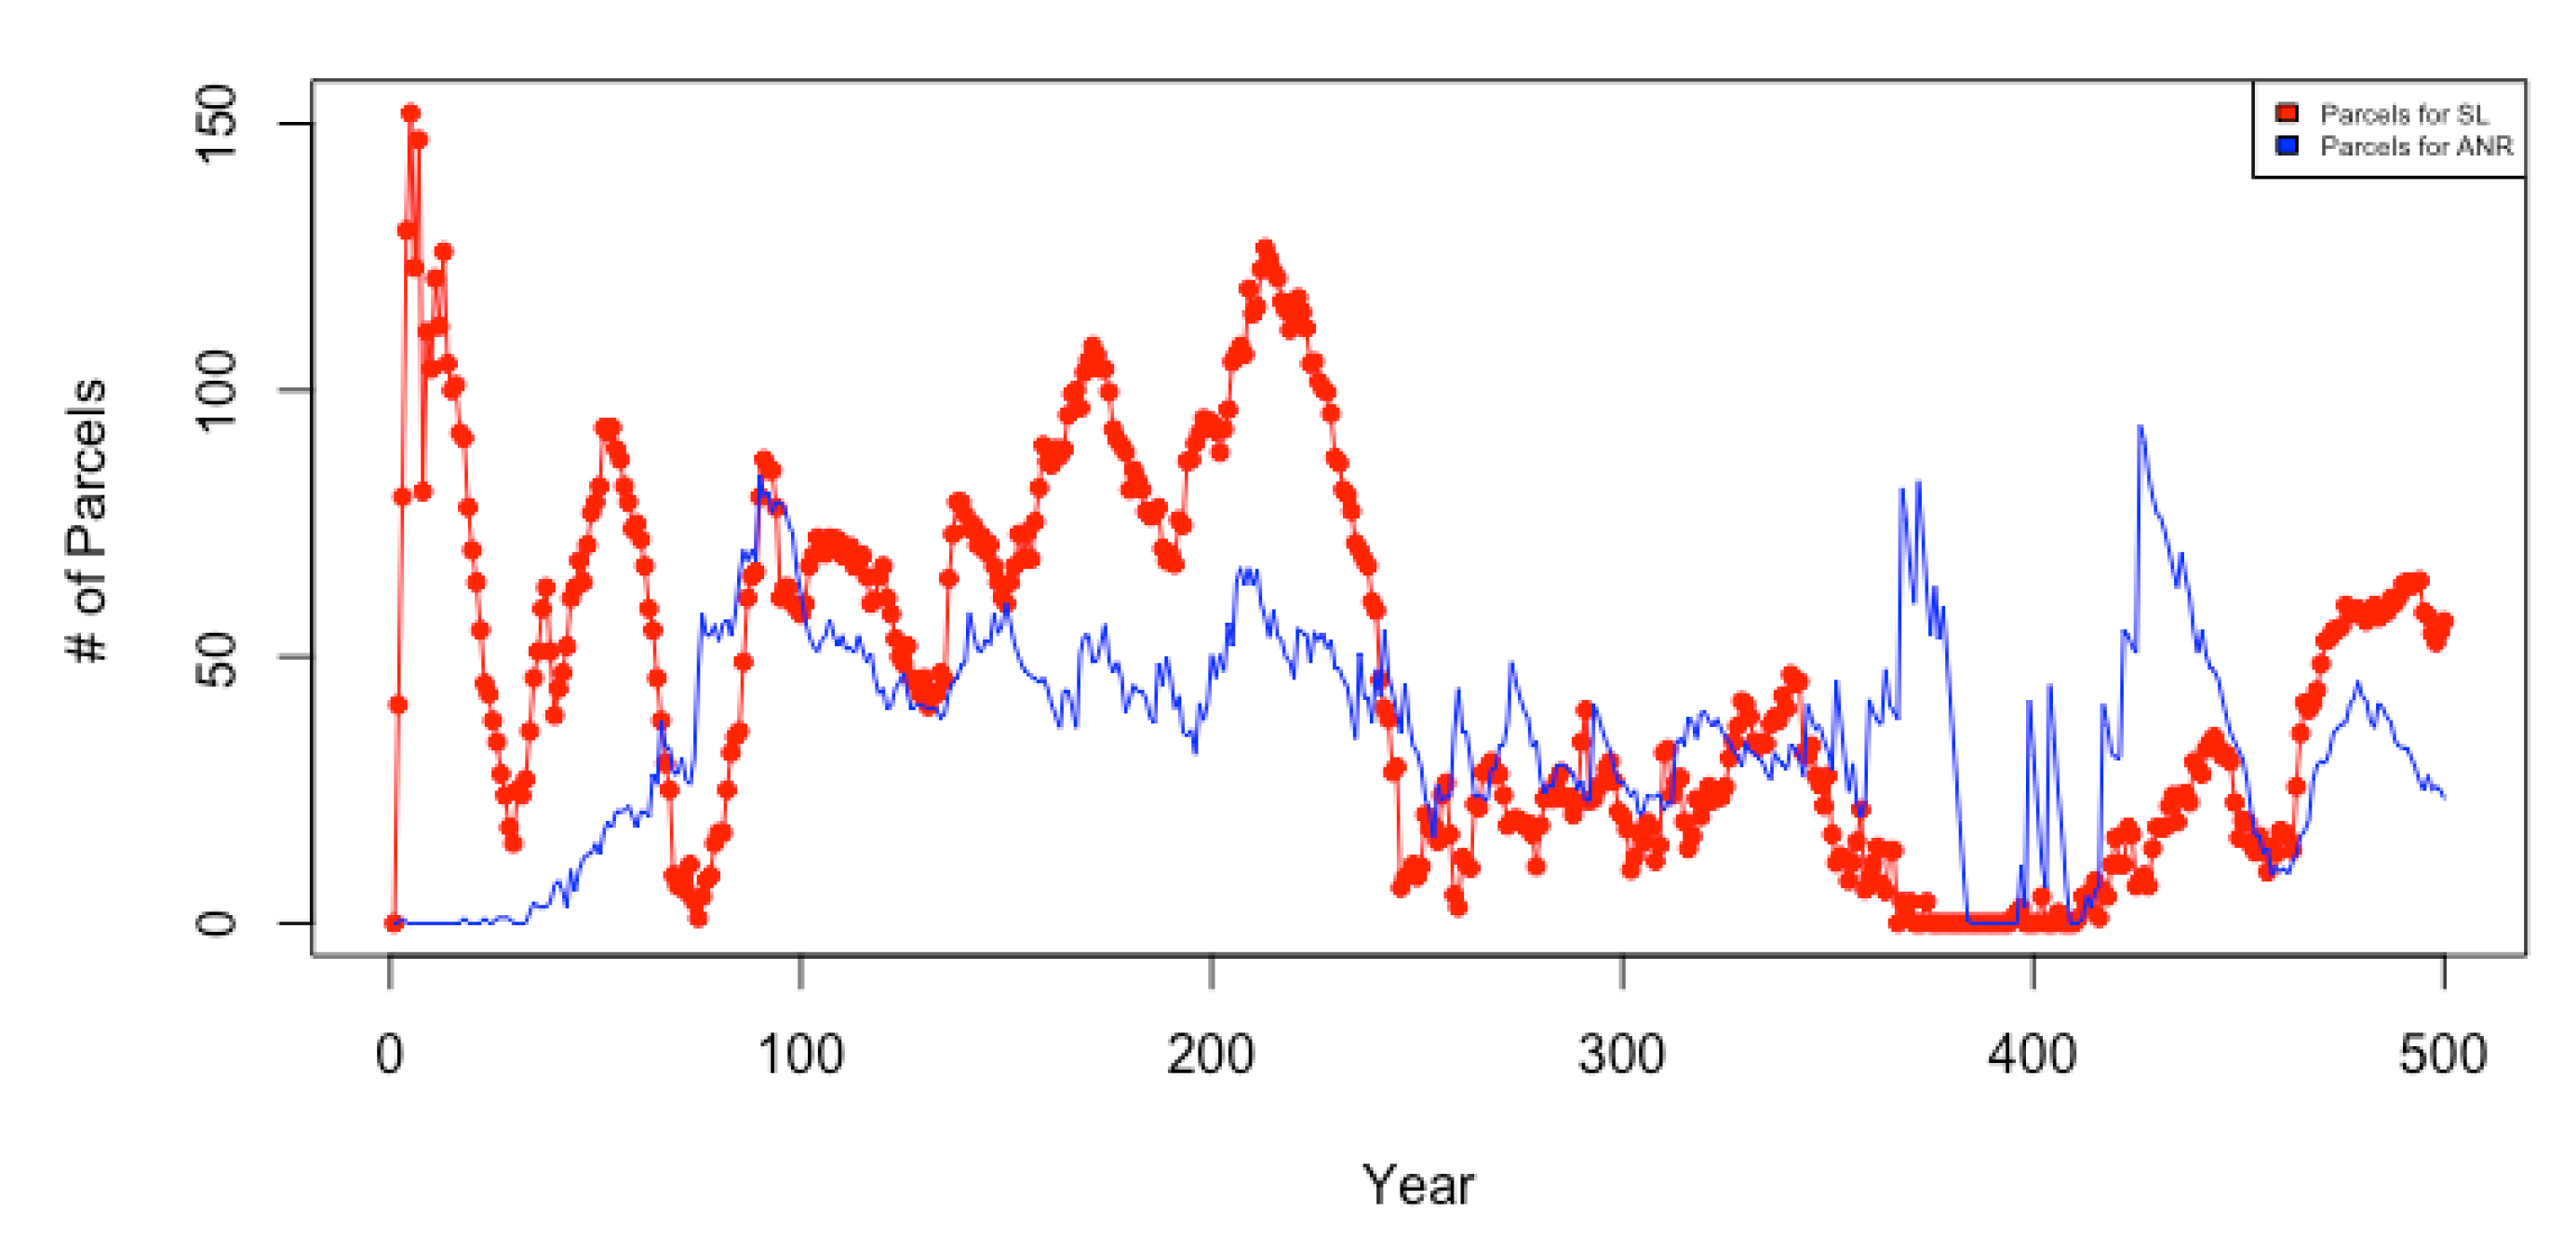
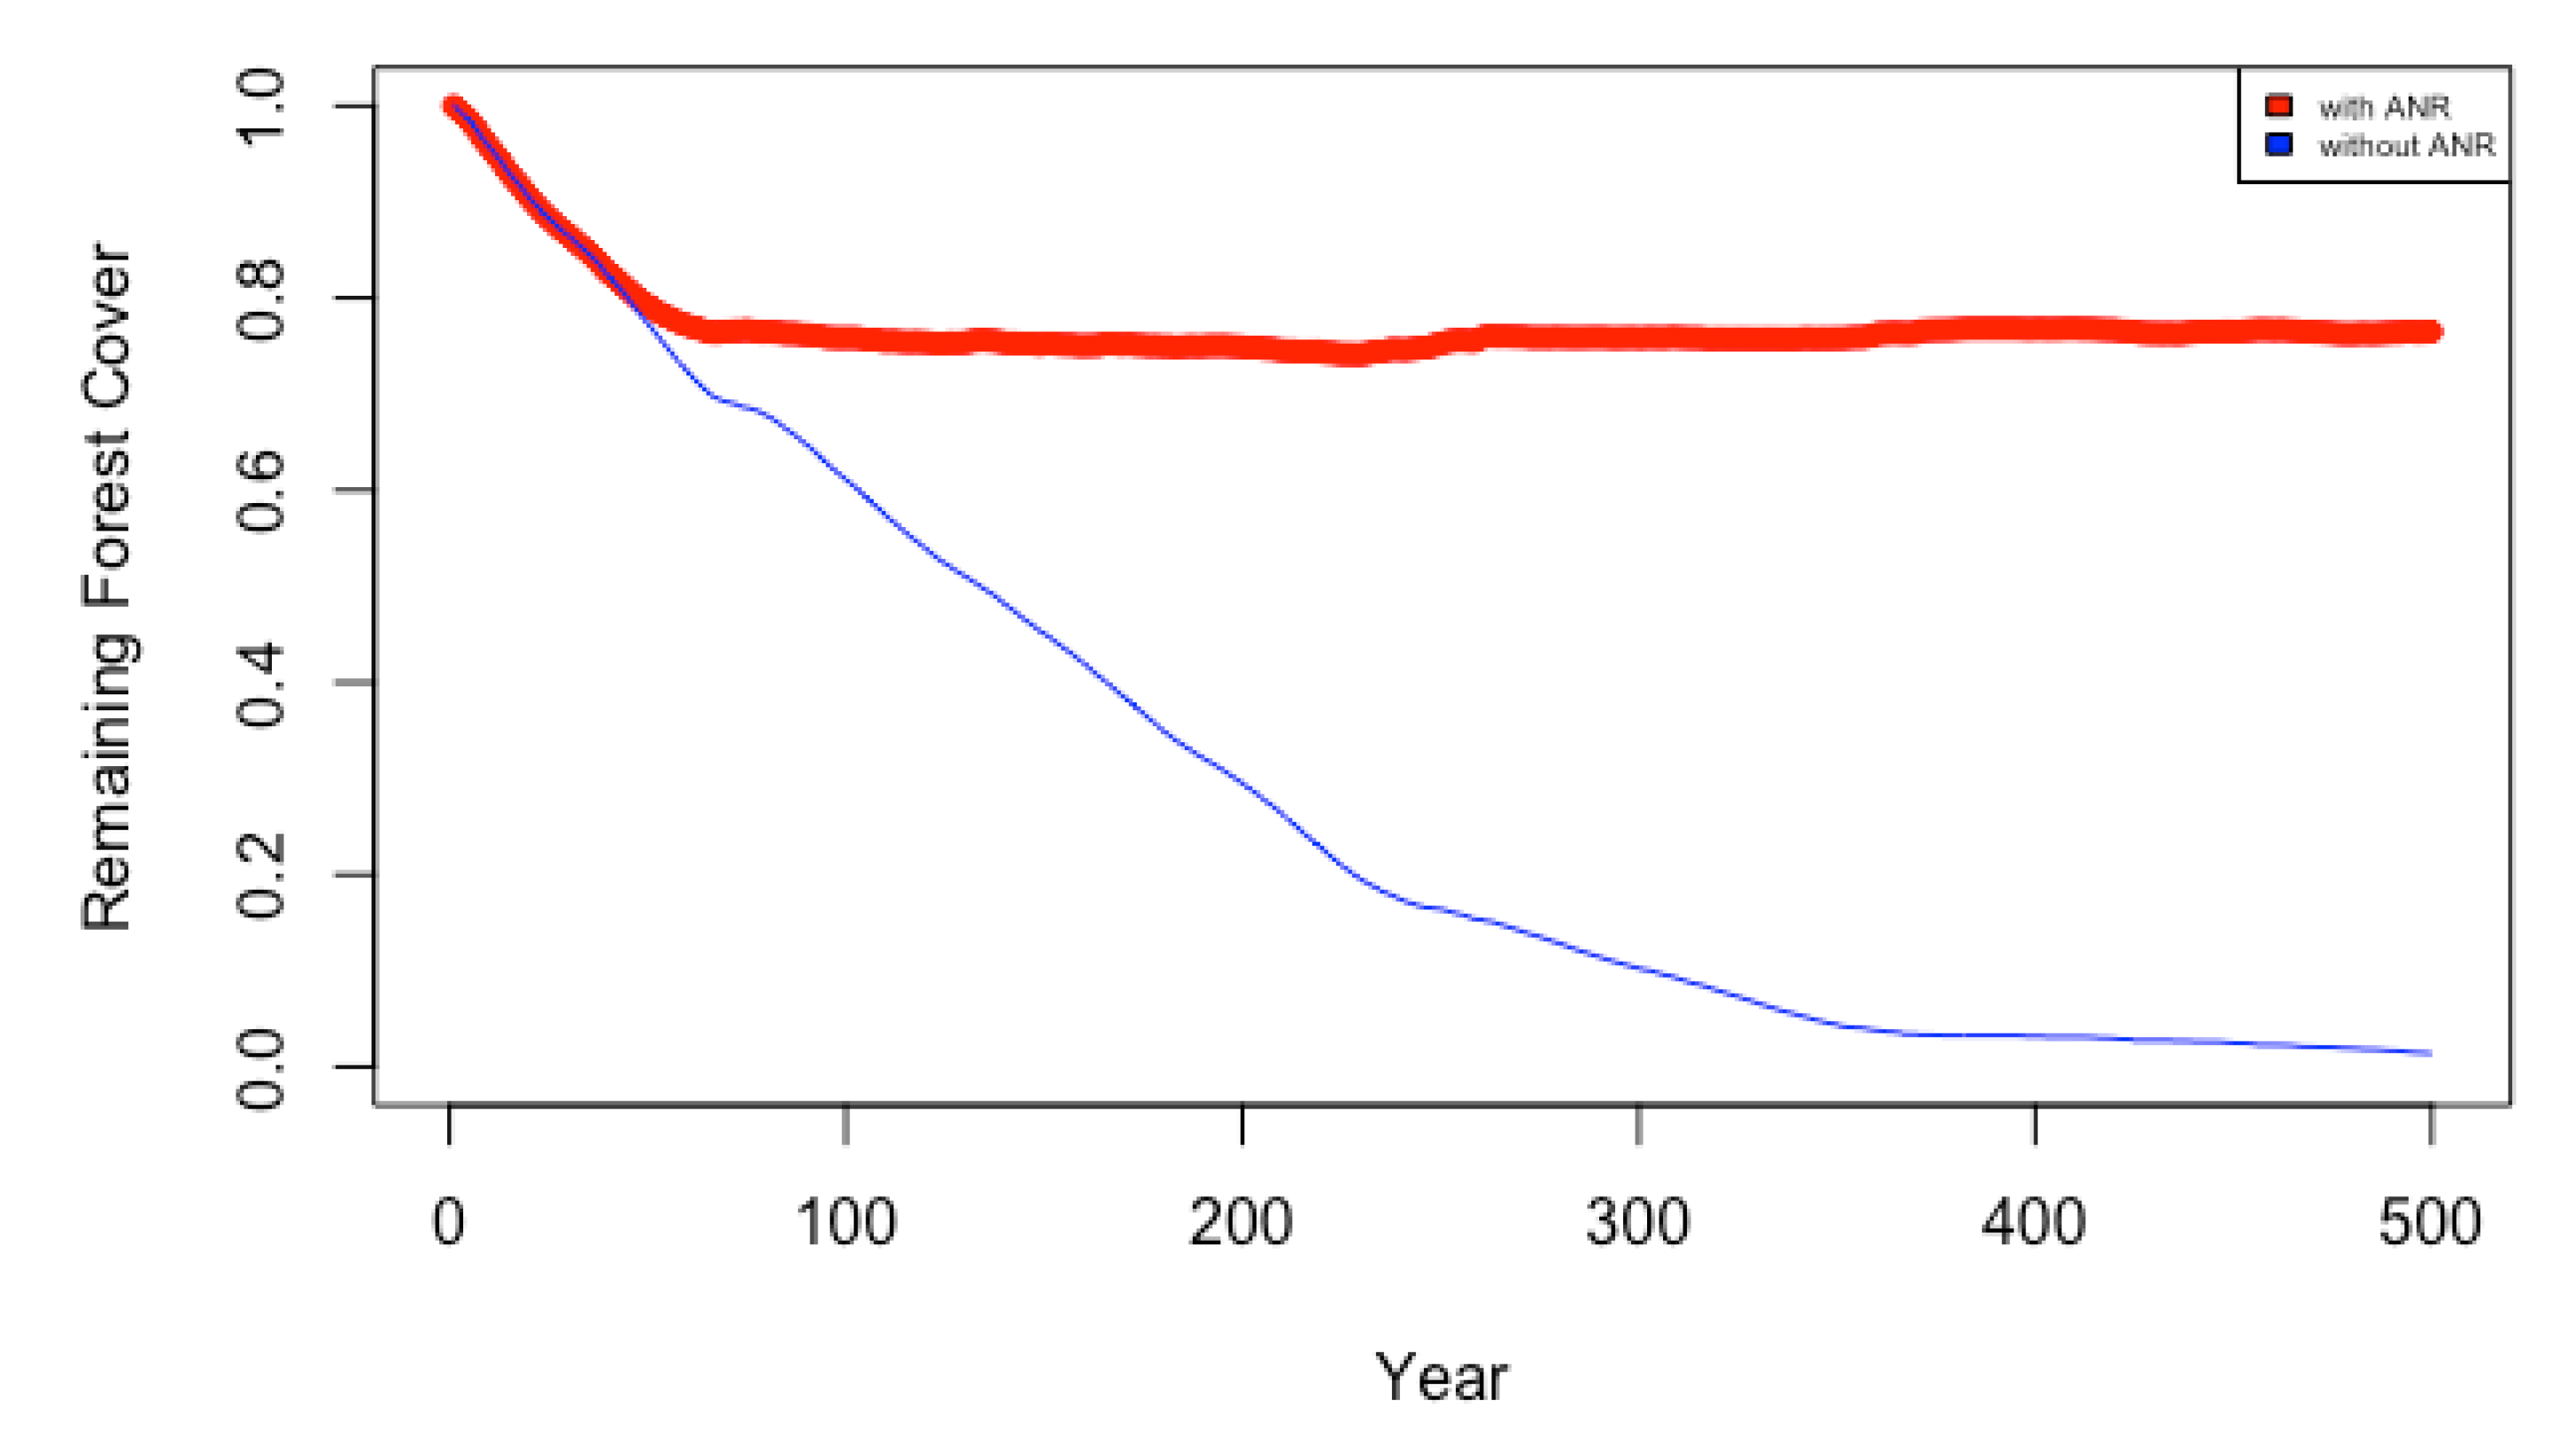
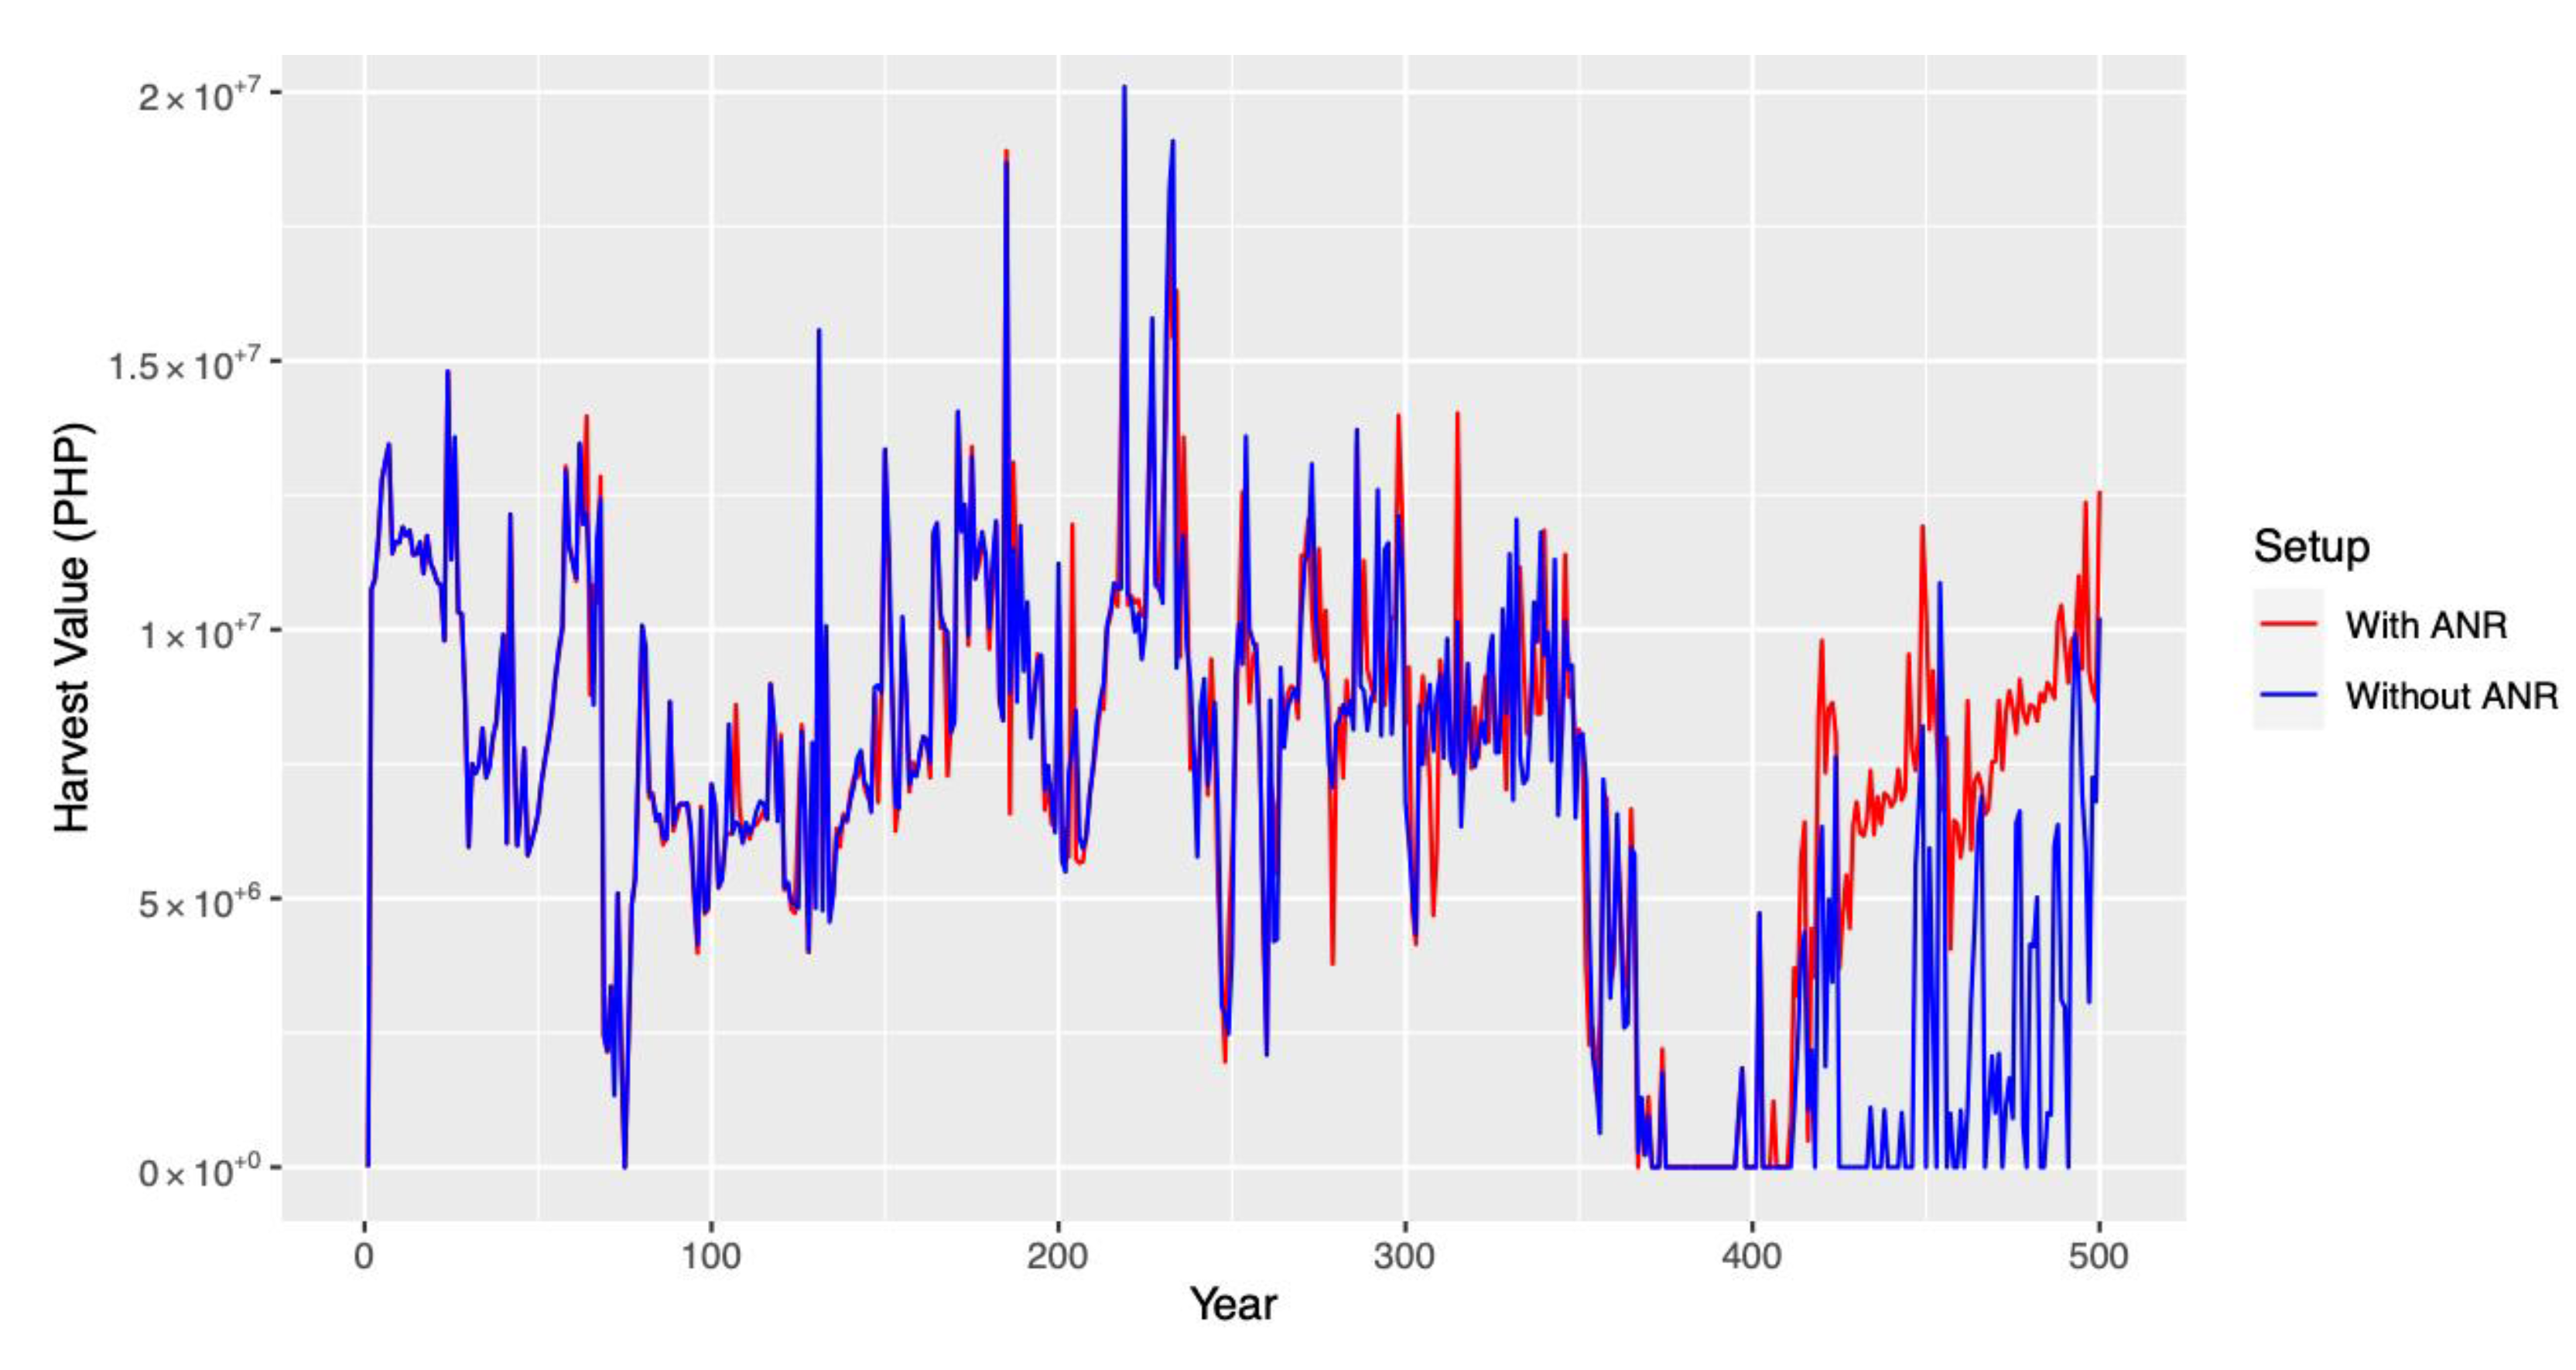
3.2. Model Results
4. Conclusions
Author Contributions
Funding
Data Availability Statement
Acknowledgments
Conflicts of Interest
Appendix A

| Family | Common Name | Scientific Name |
|---|---|---|
| Anacardiaceae | Dao | Dracontomelon dao |
| Apocynaceae | Lanete | Wrightia pubescens var. laniti |
| Dipterocarpaceae | Apitong | Dipterocarpus grandiflorus |
| Bagtikan | Parashorea malaanonan | |
| Dalingdingan | Hopea foxworthyi | |
| Guijo | Shorea guiso | |
| Hagakhak | Dipterocarpus validus | |
| Manggachapui | Hopea acuminata | |
| Mayapis | Shorea palosapis | |
| Palosapis | Anisoptera thurifera | |
| Saplungan | Hopea plagata | |
| While Lauan | Shorea contorta | |
| Ebenaceae | Ebony | Diospyros ferrea |
| Kamagong | Diospyros blancoi | |
| Fabaceae | Akle | Albizia acle |
| Banuyo | Wallaceodendron celebicum | |
| Ipil | Intsia bijuga | |
| Narra | Pterocarpus indicus | |
| Lamiaceae | Molave | Vitex parviflora |
| Meliaceae | Kalantas | Toona calantas |
References
- Chokkalingam, U. Center for International Forestry Research, Eds. One Century of Forest Rehabilitation in the Philippines: Approaches, Outcomes, and Lessons; Center for International Forestry Research: Bogor, Indonesia, 2006; ISBN 978-979-24-4643-2. [Google Scholar]
- Lasco, R.D.; Visco, R.G.; Pulhin, J.M. Secondary Forests in the Philippines: Formation and Transformation in the 20th Century. J. Trop. For. Sci. 2001, 13, 652–670. [Google Scholar]
- Philippine Forestry Statistics. Available online: https://forestry.denr.gov.ph/index.php/statistics/philippines-forestry-statistics (accessed on 5 February 2023).
- Forest Area (% of Land Area)—Philippines, World. Available online: https://data.worldbank.org/indicator/AG.LND.FRST.ZS?locations=PH-1W (accessed on 5 February 2023).
- Wood Summit: The Role of the Philippine Wood Industry in Nation Building. Available online: https://forestry.denr.gov.ph/index.php/wood-summit-the-role-of-philippine-wood-industry-in-nation-building (accessed on 4 January 2023).
- Office of the President of the Philippines [Benigno, S. Aquino, III]. Executive Order No. 23: Declaring a Moratorium on the Cutting and the Harvesting of Timber in the Natural and Residual Forests and Creating the Anti-Illegal Logging Task Force; Office of the President of the Philippines: Manila, Philippines, 2011. [Google Scholar]
- Paqueo, V.B.; Israel, D.C. Planting Seeds of Self-Defeat: Effects of Unrealistic Regulations on the Caraga Wood Industry and Forest Conservation; Philippine Institute for Development Studies: Quezon City, Philippines, 2016; Available online: http://hdl.handle.net/11540/9225 (accessed on 4 January 2023).
- Twery, M.J.; Weiskittel, A.R. Forest-Management Modelling. In Environmental Modelling; Wainwright, J., Mulligan, M., Eds.; John Wiley & Sons, Ltd.: Chichester, UK, 2013; pp. 379–398. ISBN 978-1-118-35147-5. [Google Scholar]
- Stenberg, L.C.; Siriwardana, M. Forest Conservation in the Philippines: An Economic Assessment of Selected Policy Responses Using a Computable General Equilibrium Model. For. Policy Econ. 2007, 9, 671–693. [Google Scholar] [CrossRef]
- Furtado, B.A.; Fuentes, M.A.; Tessone, C.J. Policy Modeling and Applications: State-of-the-Art and Perspectives. Complexity 2019, 2019, 5041681. [Google Scholar] [CrossRef]
- Bonabeau, E. Agent-Based Modeling: Methods and Techniques for Simulating Human Systems. Proc. Natl. Acad. Sci. USA 2002, 99, 7280–7287. [Google Scholar] [CrossRef] [PubMed]
- Osoba, O.A.; Vardavas, R.; Grana, J.; Zutshi, R.; Jaycocks, A. Modeling Agent Behaviors for Policy Analysis via Reinforcement Learning. In Proceedings of the 2020 19th IEEE International Conference on Machine Learning and Applications (ICMLA), Miami, FL, USA, 14–17 December 2020; pp. 213–219. [Google Scholar]
- Schulze, J.; Müller, B.; Groeneveld, J.; Grimm, V. Agent-Based Modelling of Social-Ecological Systems: Achievements, Challenges, and a Way Forward. JASSS 2017, 20, 8. [Google Scholar] [CrossRef]
- Taillandier, P.; Gaudou, B.; Grignard, A.; Huynh, Q.-N.; Marilleau, N.; Caillou, P.; Philippon, D.; Drogoul, A. Building, Composing and Experimenting Complex Spatial Models with the GAMA Platform. Geoinformatica 2019, 23, 299–322. [Google Scholar] [CrossRef]
- Kiruki, H.; van der Zanden, E.H.; Zagaria, C.; Verburg, P.H. Sustainable Woodland Management and Livelihood Options in a Charcoal Producing Region: An Agent-Based Modelling Approach. J. Environ. Manag. 2019, 248, 109245. [Google Scholar] [CrossRef] [PubMed]
- Lapp, M.; Long, C. A New Approach to Agent-Based Models of Community Resource Management Based on the Analysis of Cheating, Monitoring, and Sanctioning. Ecol. Model. 2022, 468, 109946. [Google Scholar] [CrossRef]
- Tew, R.D.; Straka, T.J.; Cushing, T.L. Forest Resource Management Planning: Why Plan? The Planning Process; FNR 110; Clemson (SC): Clemson Extension, Forestry and Natural Resources: Clemson, SC, USA, 2016; Available online: https://sref.info/resources/publications/forest-resource-management-planning-why-plan-the-planning-process (accessed on 4 January 2023).
- Alves, D.S.; Morton, D.C.; Batistella, M.; Roberts, D.A.; Souza, C. The Changing Rates and Patterns of Deforestation and Land Use in Brazilian Amazonia. In Geophysical Monograph Series; Keller, M., Bustamante, M., Gash, J., Silva Dias, P., Eds.; American Geophysical Union: Washington, DC, USA, 2009; Volume 186, pp. 11–23. ISBN 978-0-87590-476-4. [Google Scholar]
- Huang, X.; Li, S.; Su, J. Selective Logging Enhances Ecosystem Multifunctionality via Increase of Functional Diversity in a Pinus Yunnanensis Forest in Southwest China. For. Ecosyst. 2020, 7, 55. [Google Scholar] [CrossRef]
- Putz, F.E.; Romero, C.; Sist, P.; Schwartz, G.; Thompson, I.; Roopsind, A.; Ruslandi, R.; Medjibe, V.; Ellis, P. Sustained Timber Yield Claims, Considerations, and Tradeoffs for Selectively Logged Forests. Proc. Natl. Acad. Sci. USA Nexus 2022, 1, 102. [Google Scholar] [CrossRef]
- Chazdon, R.L.; Brancalion, P.H.S.; Lamb, D.; Laestadius, L.; Calmon, M.; Kumar, C. A Policy-Driven Knowledge Agenda for Global Forest and Landscape Restoration. Conserv. Lett. 2017, 10, 125–132. [Google Scholar] [CrossRef]
- Carandang, W.M.; Paelmo, R.F.; Lee, D.K.; Carandang, V.Q. Assisted Natural Regeneration as Affected by Lodging and Slashing Vegetation in a Grassland in the Philippines. For. Sci. Technol. 2007, 3, 47–52. [Google Scholar] [CrossRef]
- FAO. Restoring Forest Landscapes through Assisted Natural Regeneration (ANR)—A Practical Manual; Food and Agriculture Organization: Bangkok, Thailand, 2019; 52p. [Google Scholar]
- Dugan, P. Advancing Assisted Natural Regeneration (ANR) in Asia and the Pacific; Food and Agriculture Organization of the United Nations, Regional Office for Asia and the Pacific: Bangkok, Thailand, 2003; ISBN 978-974-7946-49-9. [Google Scholar]
- Grimm, V.; Berger, U.; Bastiansen, F.; Eliassen, S.; Ginot, V.; Giske, J.; Goss-Custard, J.; Grand, T.; Heinz, S.K.; Huse, G.; et al. A Standard Protocol for Describing Individual-Based and Agent-Based Models. Ecol. Model. 2006, 198, 115–126. [Google Scholar] [CrossRef]
- Grimm, V.; Berger, U.; DeAngelis, D.L.; Polhill, J.G.; Giske, J.; Railsback, S.F. The ODD Protocol: A Review and First Update. Ecol. Model. 2010, 221, 2760–2768. [Google Scholar] [CrossRef]
- Nguyen, T.T. Modelling Growth and Yield of Dipterocarp Forests in Central Highlands of Vietnam. Ph.D. Dissertation, Technische Universität München, München, Germany, 8 March 2010. [Google Scholar]
- FMB (Forest Management Bureau). FMB Technical Bulletin No. 3: Measurement Standards and Procedures in the Conduct of Inventory for Standing Trees (Timber); Forest Management Bureau: Manila, Philippines, 2014. [Google Scholar]
- Johnson, S.E.; Abrams, M.D. Basal area increment trends across age classes for two long-lived tree species in the eastern US. In TRACE—Tree Rings in Archaeology, Climatology, and Ecology; Scientific Technical Report STR, 09/03, Kaczka, R., Malik, I., Owczarek, P., Gartner, H., Helle, G., Heinrich, I., Eds.; GFZ: Potsdam, Germany, 2009. [Google Scholar]
- Russell, M.B.; Weiskittel, A.R.; Kershaw, J.A. Comparing Strategies for Modeling Individual-Tree Height and Height-to-Crown Base Increment in Mixed-Species Acadian Forests of Northeastern North America. Eur. J. Forest. Res. 2014, 133, 1121–1135. [Google Scholar] [CrossRef]
- Mangaoang, E.O. Annex 8: Economic analysis of community-based timber harvesting. In Management of Resources on Forestlands through Enhanced Sustainable Technologies; GIZ EnRD Program Philippines, CBFM Component: Manila, Philippines, 2013. [Google Scholar]
- DENR (Department of Environment and Natural Resources). Annual Allowable Cut Computation and Tree Marking Goal Determination in the Second Growth Dipterocarp Forest; Administrative Order No. 12; Department of Environment and Natural Resources: Quezon City, Philippines, 1992. Available online: https://apidb.denr.gov.ph/infores/uploads/policy/1992/FOR_DAO_1992_12.pdf (accessed on 4 January 2023).
- Taillandier, P.; Grignard, A.; Marilleau, N.; Philippon, D.; Huynh, Q.-N.; Gaudou, B.; Drogoul, A. Participatory Modeling and Simulation with the GAMA Platform. JASSS 2019, 22, 3. [Google Scholar] [CrossRef]
- Herman, J.D.; Kollat, J.B.; Reed, P.M.; Wagener, T. Technical Note: Method of Morris Effectively Reduces the Computational Demands of Global Sensitivity Analysis for Distributed Watershed Models. Hydrol. Earth Syst. Sci. 2013, 17, 2893–2903. [Google Scholar] [CrossRef]


| Variable | Type | Equation | Reference |
|---|---|---|---|
| Diameter-at-breast-height (DBH) | Dipterocarps | [27] | |
| Non-dipterocarps | |||
| Volume (V) | Dipterocarps | [28] | |
| Non-Dipterocarps | |||
| Basal Area (BA) | Both | [29] | |
| Height (H) | Both | [30] |
| Parameters | Value (in PHP) |
|---|---|
| Average value of premium round logs (per m3) | 5492.73 |
| Average value of non-premium round logs (per m3) | 3661.82 |
| Average harvesting cost of round logs (per m3) | 3405.06 |
| Setup | Variable | Default Value | Possible Values |
|---|---|---|---|
| General | numberOfHarvesters | 10 | |
| numberOfPlanters | 10 | ||
| SL | minParcelVolReqForHarvesting(m3) | 500.0 | |
| maxAllowedHarvestVolPerParcel(m3) | 1457.5 | ||
| minTreeDBHReqForHarvesting (cm) | 60.0 | ||
| ANR | isReplanting | True | True|False |
| maxTreesPerParcel | 300 | ||
| premChance | 0.5 | [0, 1] | |
| dipteroChance | 0.5 | [0, 1] |
Disclaimer/Publisher’s Note: The statements, opinions and data contained in all publications are solely those of the individual author(s) and contributor(s) and not of MDPI and/or the editor(s). MDPI and/or the editor(s) disclaim responsibility for any injury to people or property resulting from any ideas, methods, instructions or products referred to in the content. |
© 2023 by the authors. Licensee MDPI, Basel, Switzerland. This article is an open access article distributed under the terms and conditions of the Creative Commons Attribution (CC BY) license (https://creativecommons.org/licenses/by/4.0/).
Share and Cite
Arnejo, Z.; Barua, L.; Ramirez, P.J.; Tiburan Jr., C.; Bantayan, N. An Agent-Based Model of a Sustainable Forest Operation in a Theoretical Lowland Dipterocarp Forest Modeled after Mount Makiling Forest Reserve, Philippines. Forests 2023, 14, 428. https://doi.org/10.3390/f14020428
Arnejo Z, Barua L, Ramirez PJ, Tiburan Jr. C, Bantayan N. An Agent-Based Model of a Sustainable Forest Operation in a Theoretical Lowland Dipterocarp Forest Modeled after Mount Makiling Forest Reserve, Philippines. Forests. 2023; 14(2):428. https://doi.org/10.3390/f14020428
Chicago/Turabian StyleArnejo, Zenith, Leonardo Barua, Paul Joseph Ramirez, Cristino Tiburan Jr., and Nathaniel Bantayan. 2023. "An Agent-Based Model of a Sustainable Forest Operation in a Theoretical Lowland Dipterocarp Forest Modeled after Mount Makiling Forest Reserve, Philippines" Forests 14, no. 2: 428. https://doi.org/10.3390/f14020428
APA StyleArnejo, Z., Barua, L., Ramirez, P. J., Tiburan Jr., C., & Bantayan, N. (2023). An Agent-Based Model of a Sustainable Forest Operation in a Theoretical Lowland Dipterocarp Forest Modeled after Mount Makiling Forest Reserve, Philippines. Forests, 14(2), 428. https://doi.org/10.3390/f14020428