
The Characteristics of Gas and Particulate Emissions from Smouldering Combustion in the Pinus pumila Forest of Huzhong National Nature Reserve of the Daxing’an Mountains

Abstract
1. Introduction
2. Methods
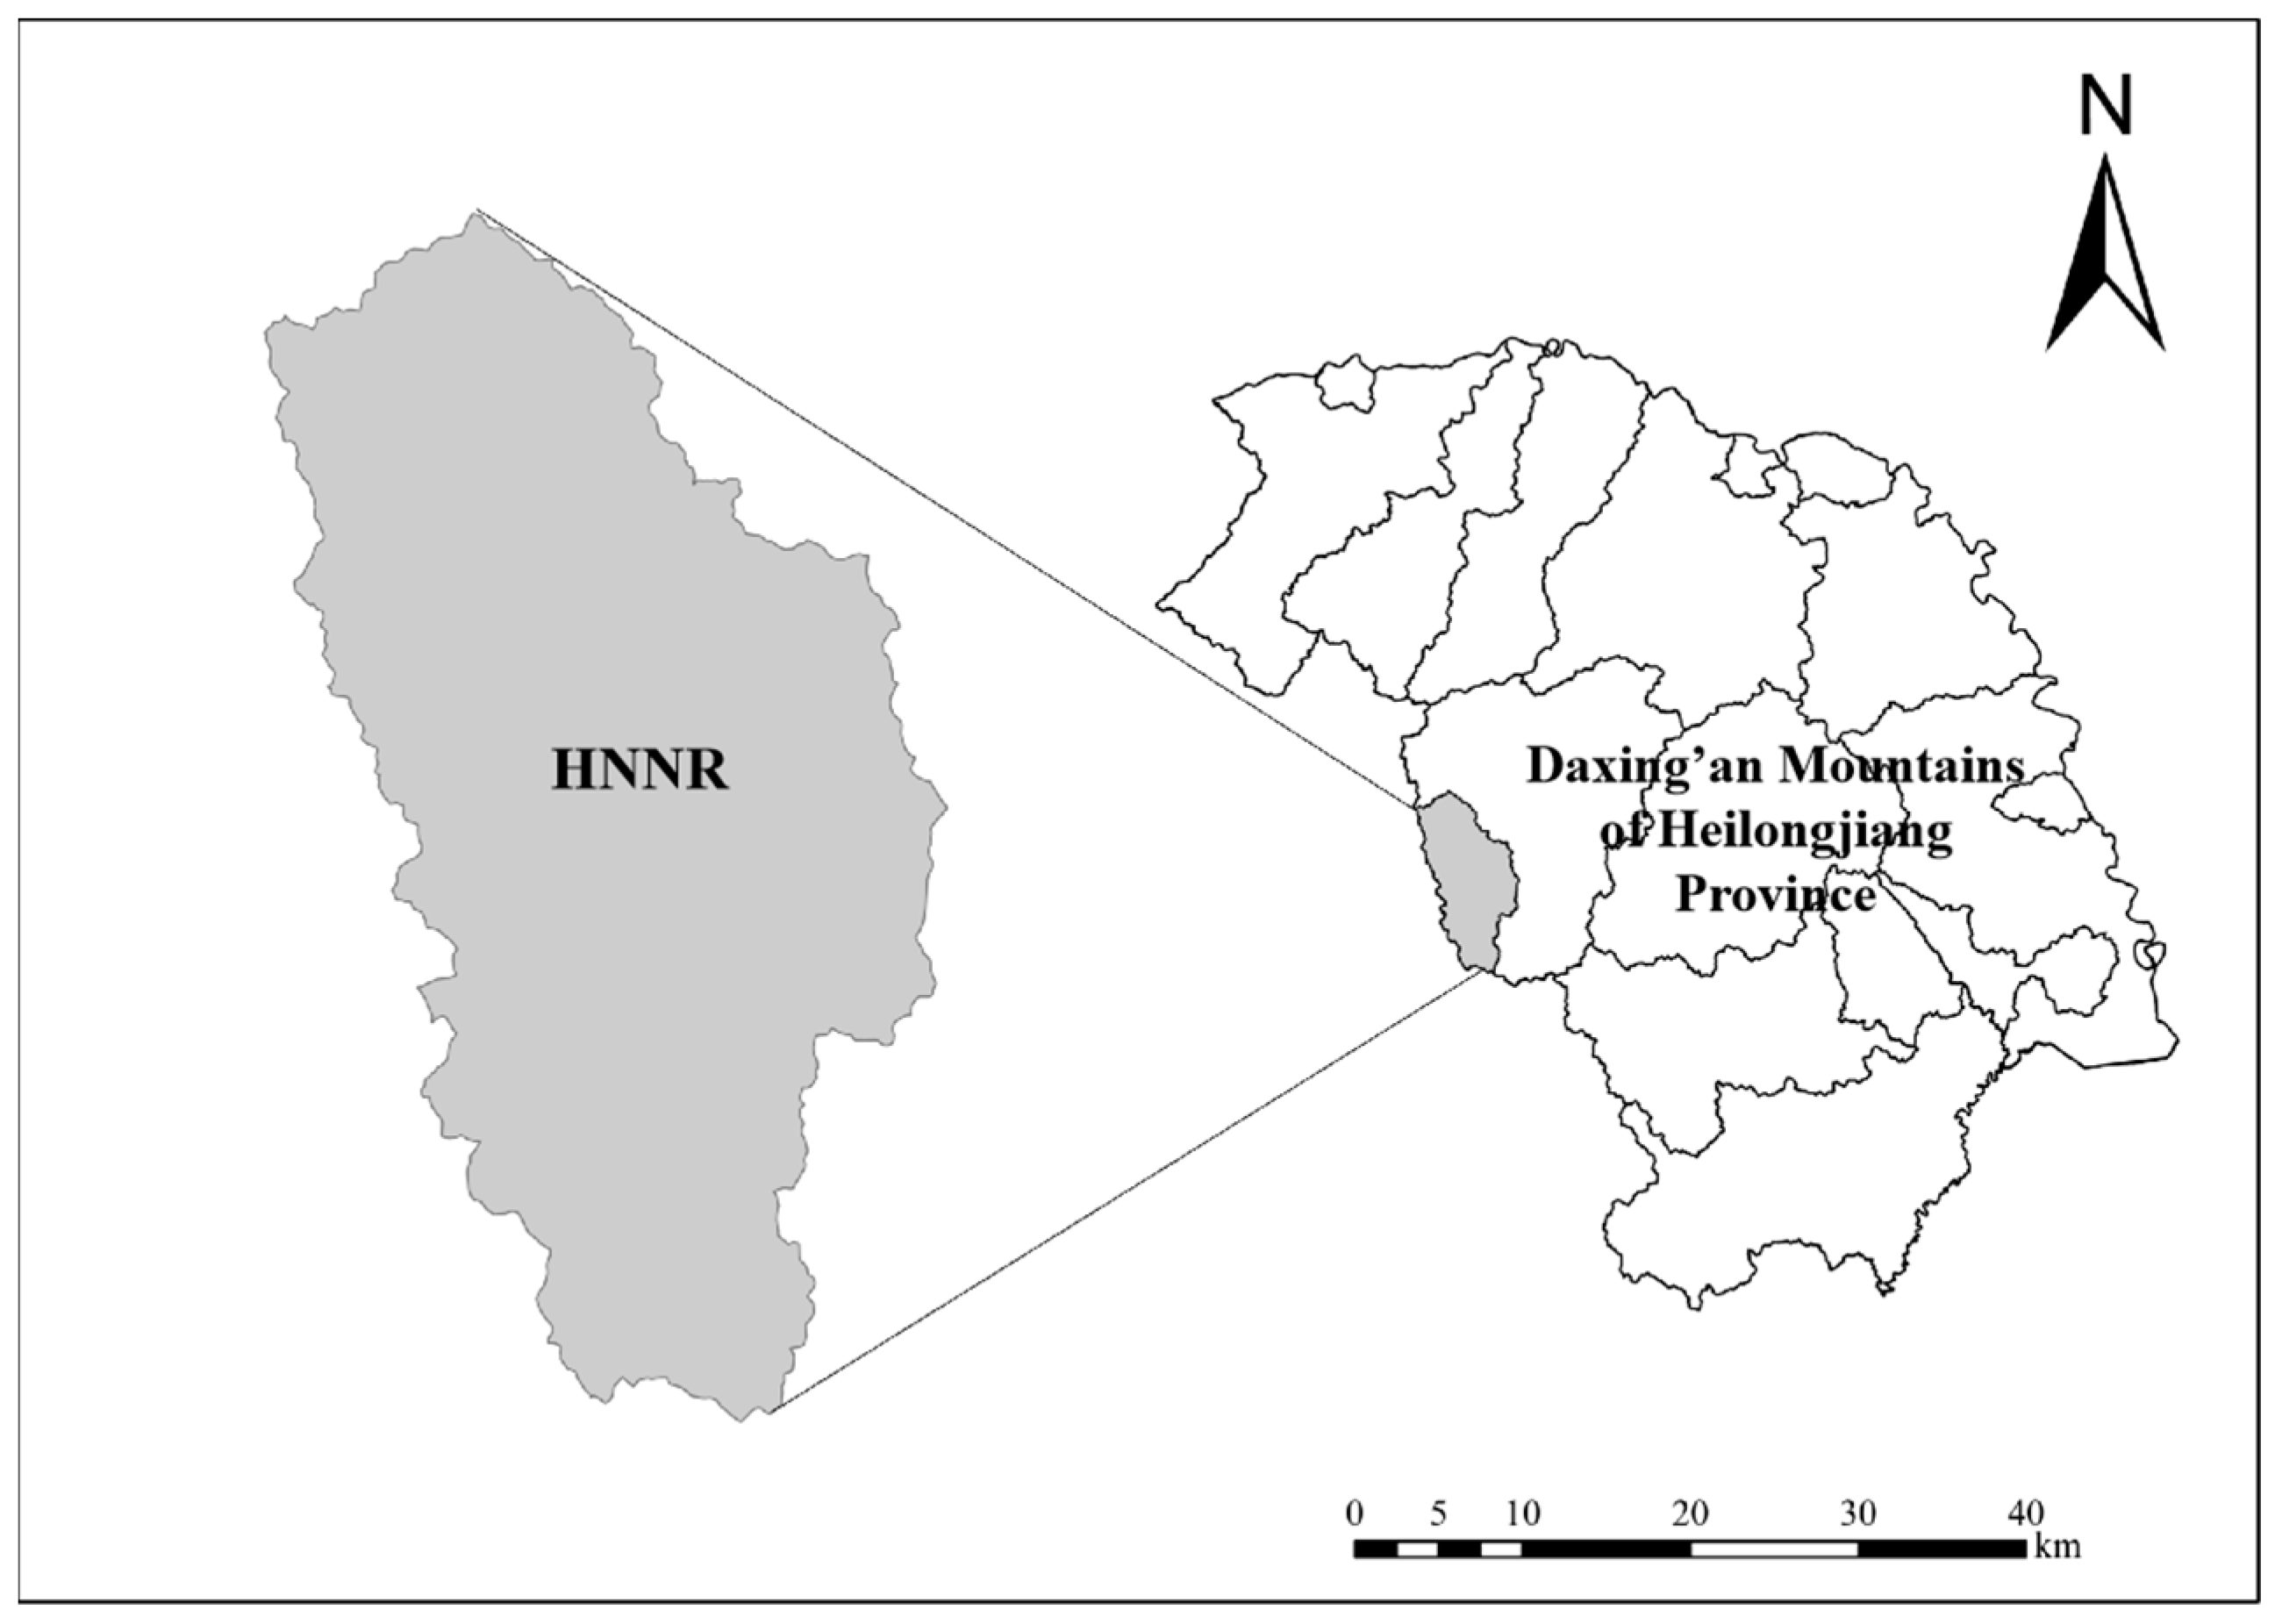
2.1. Study Area
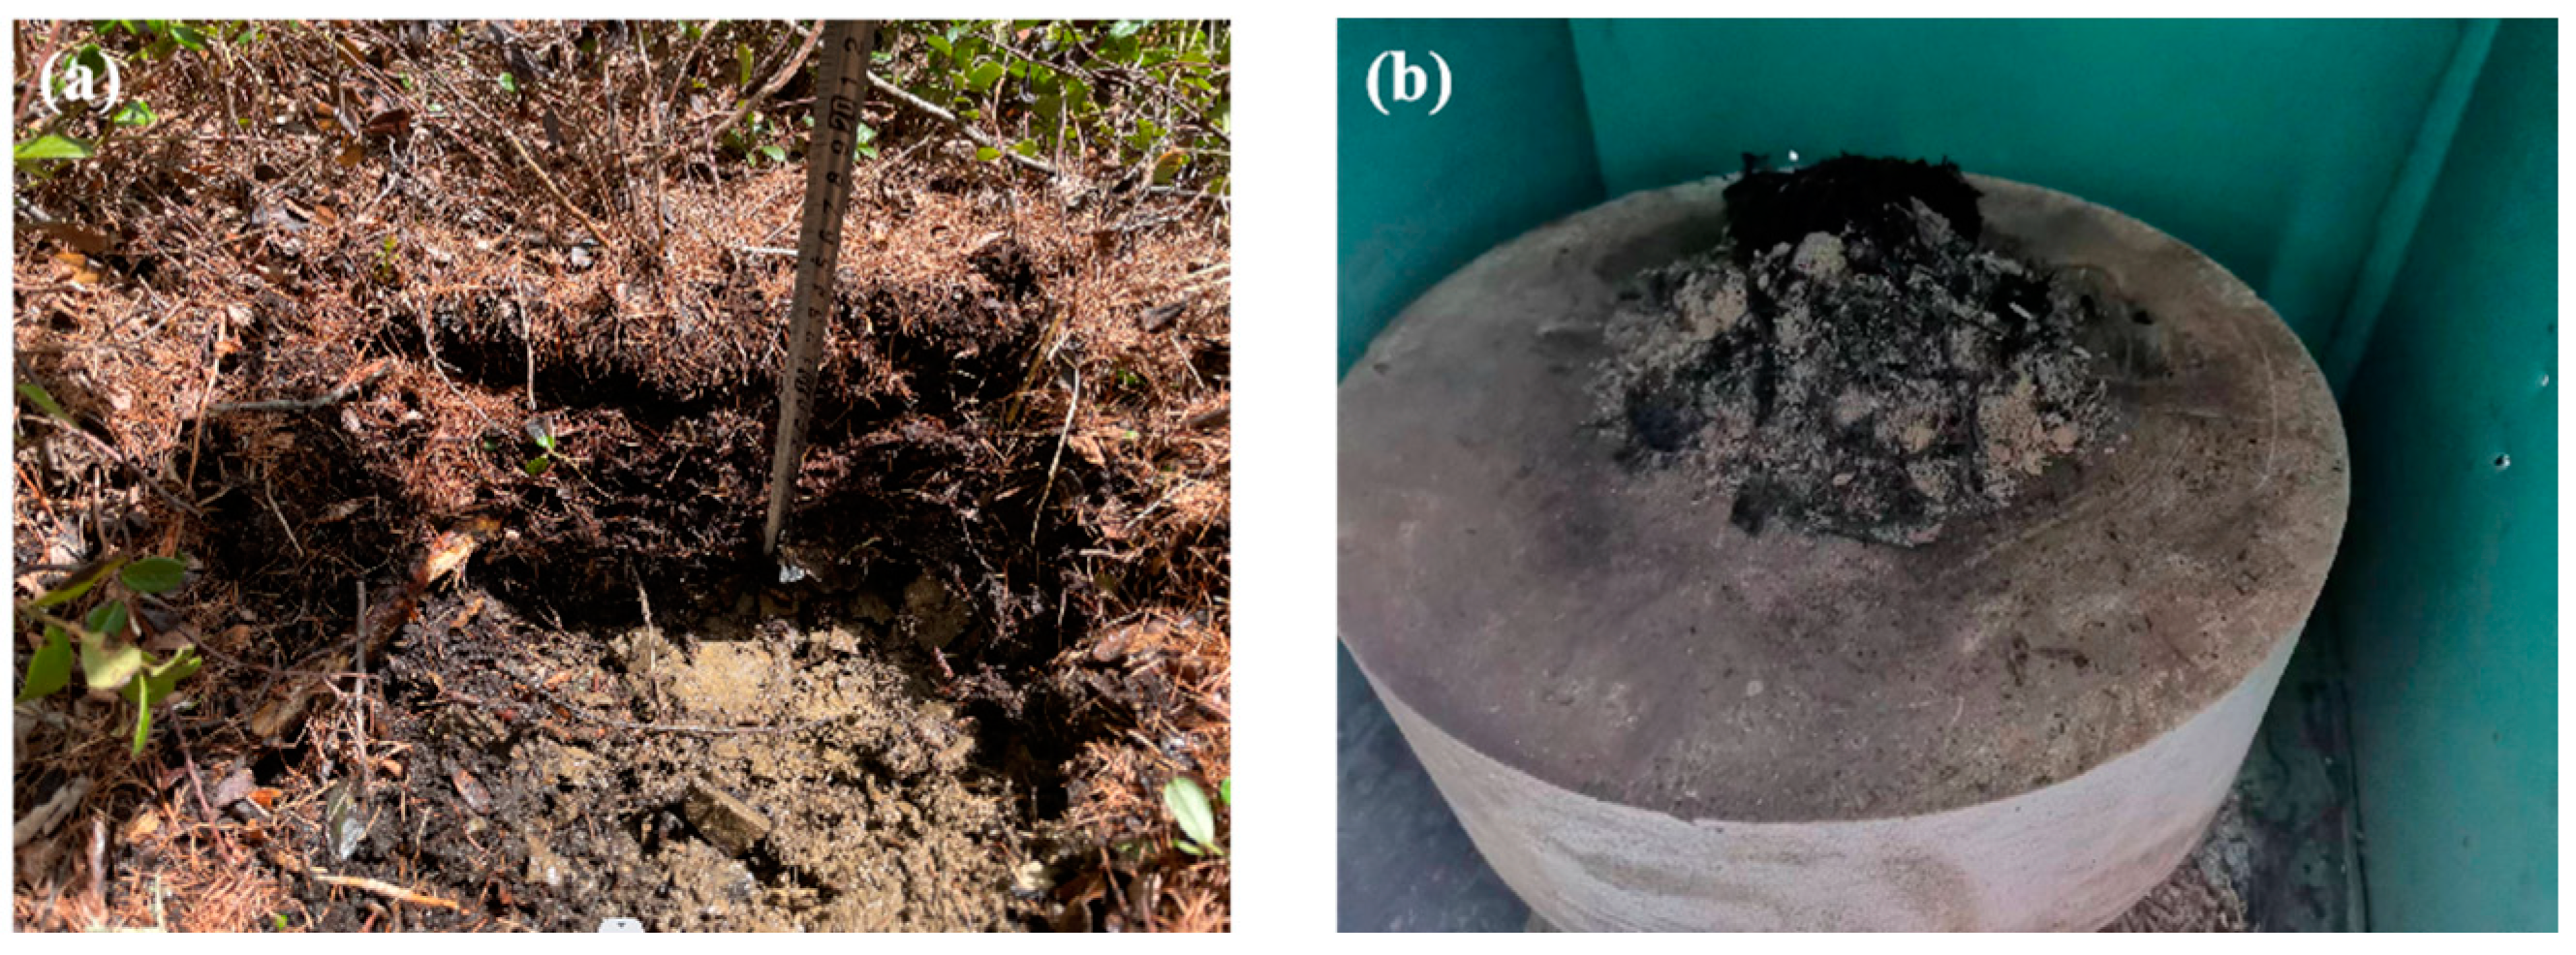
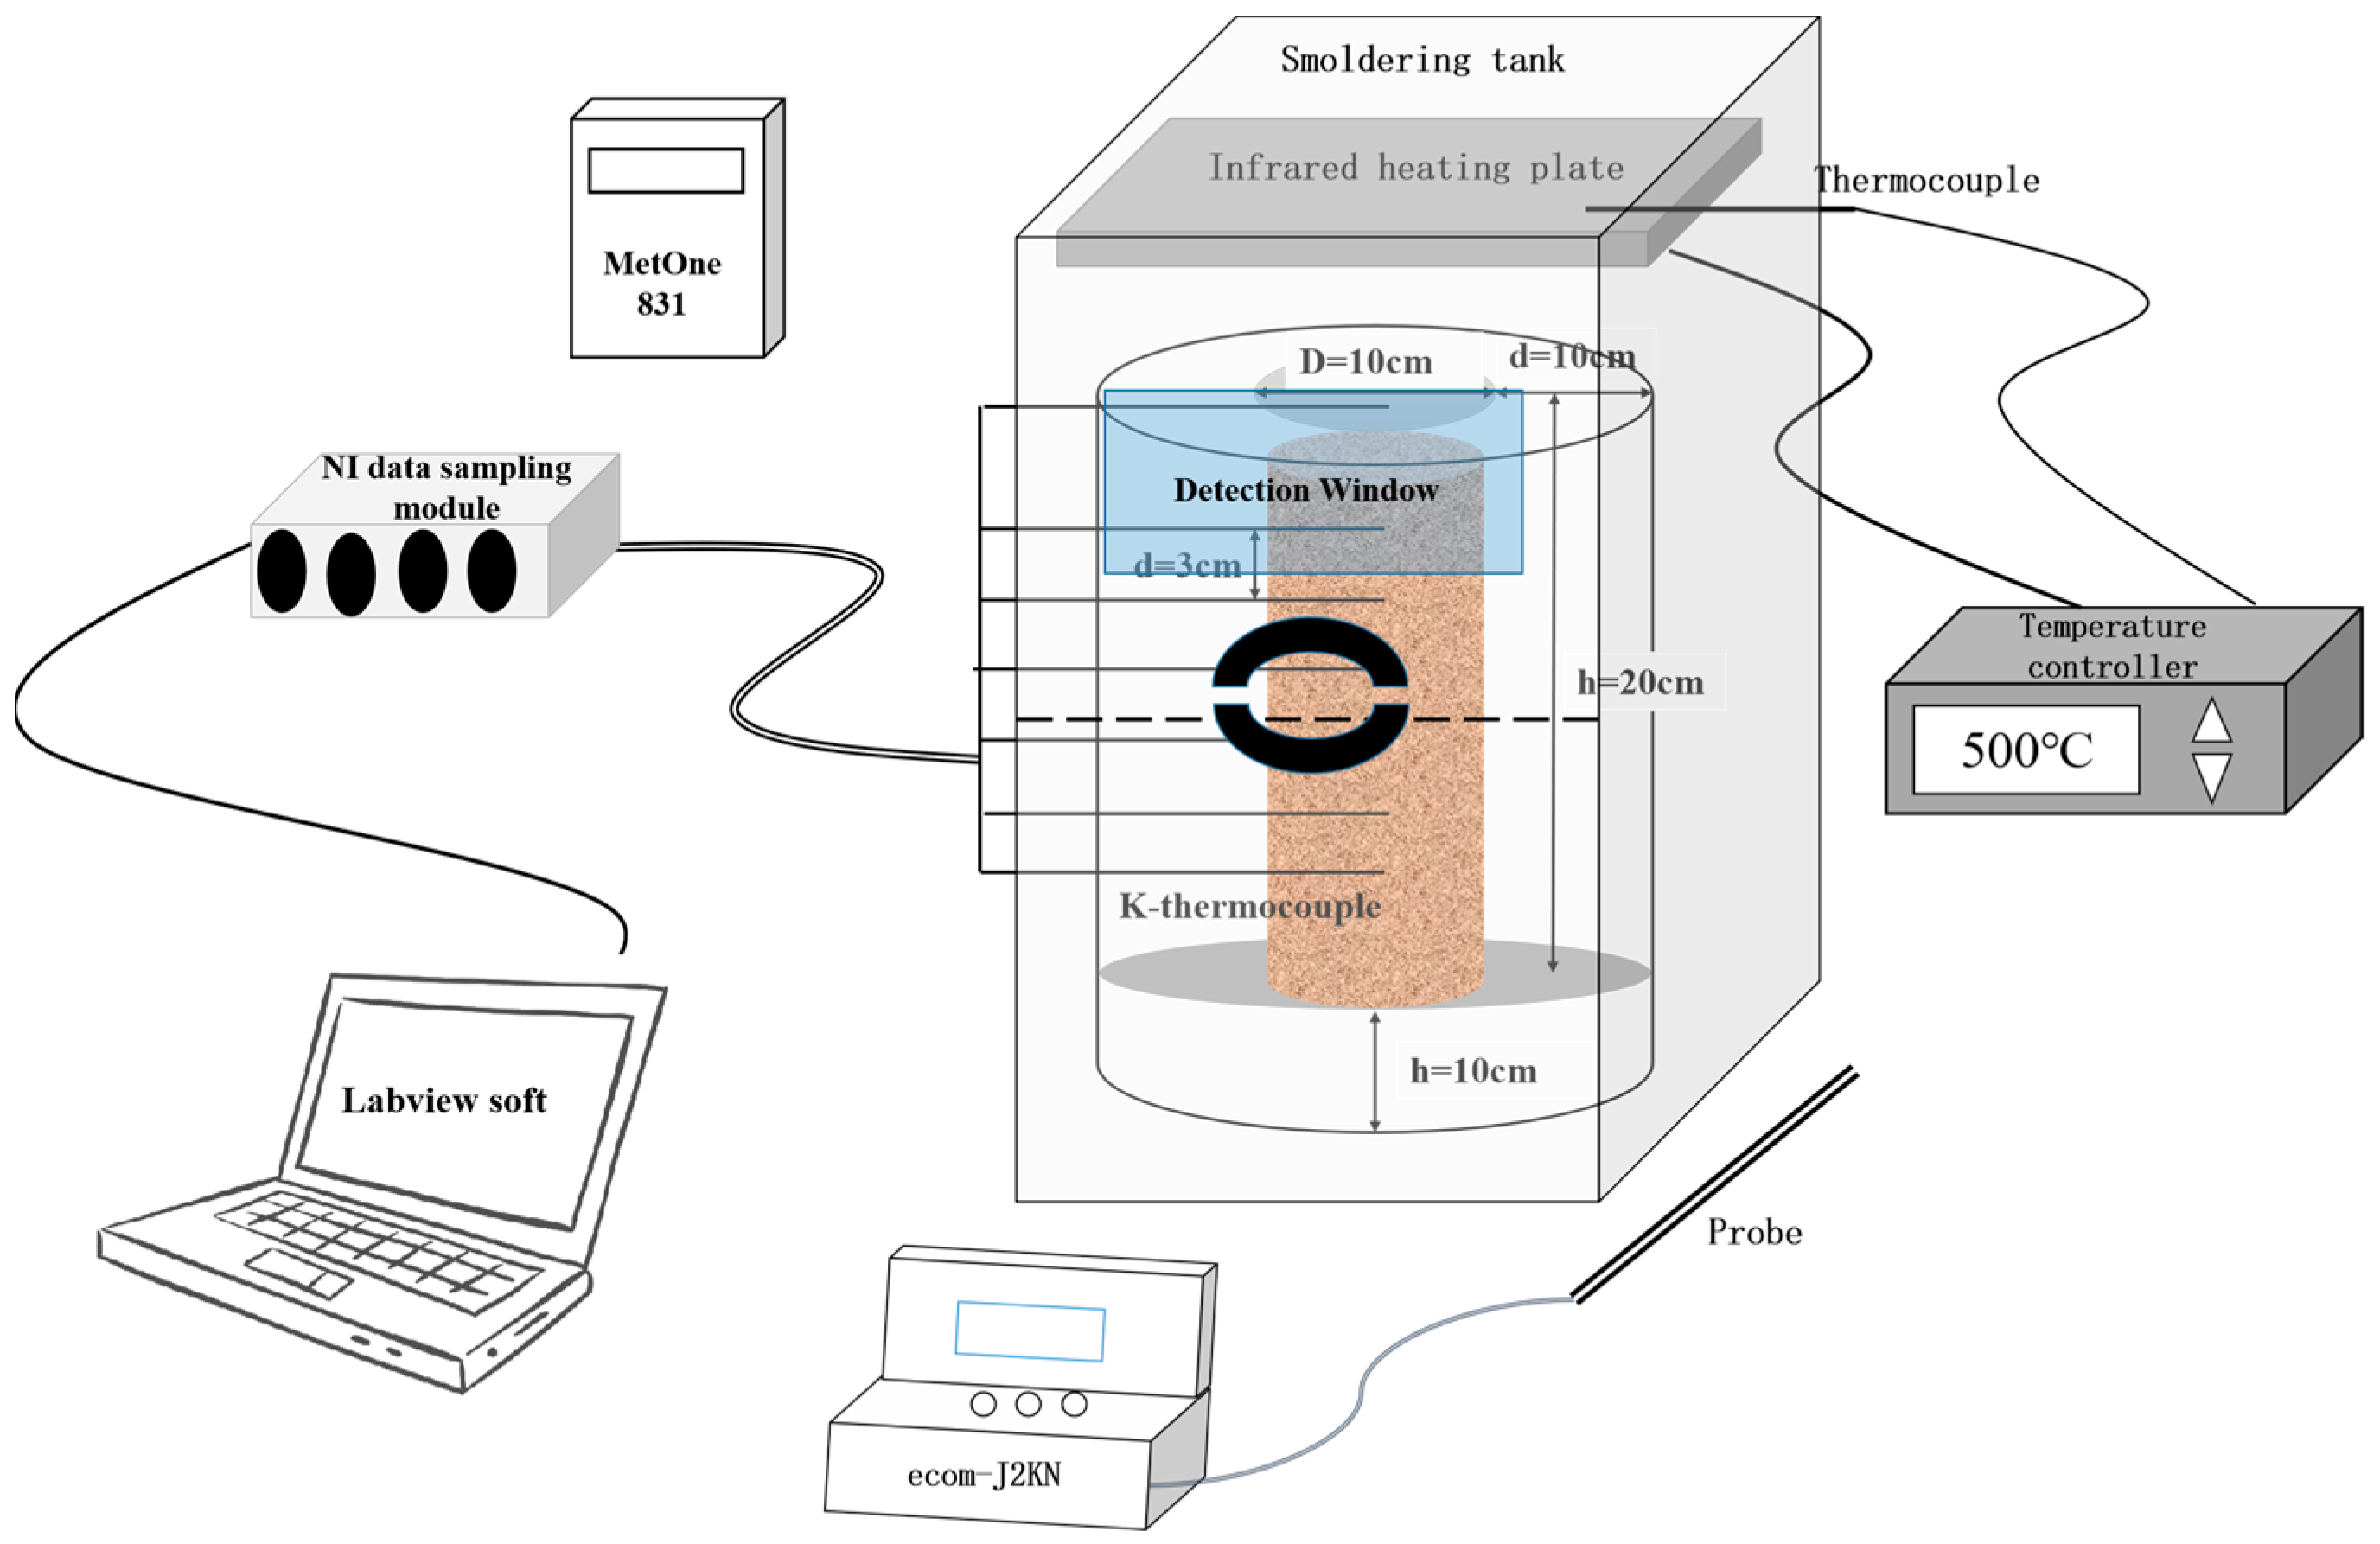
2.2. Experimental Method
2.3. Emission Factor
2.4. Modified Combustion Efficiency and Emission Ratio
2.5. Statistical Analysis
3. Results
3.1. Main Gas Emissions in the Smouldering Combustion
3.1.1. EF of CO2 and CO
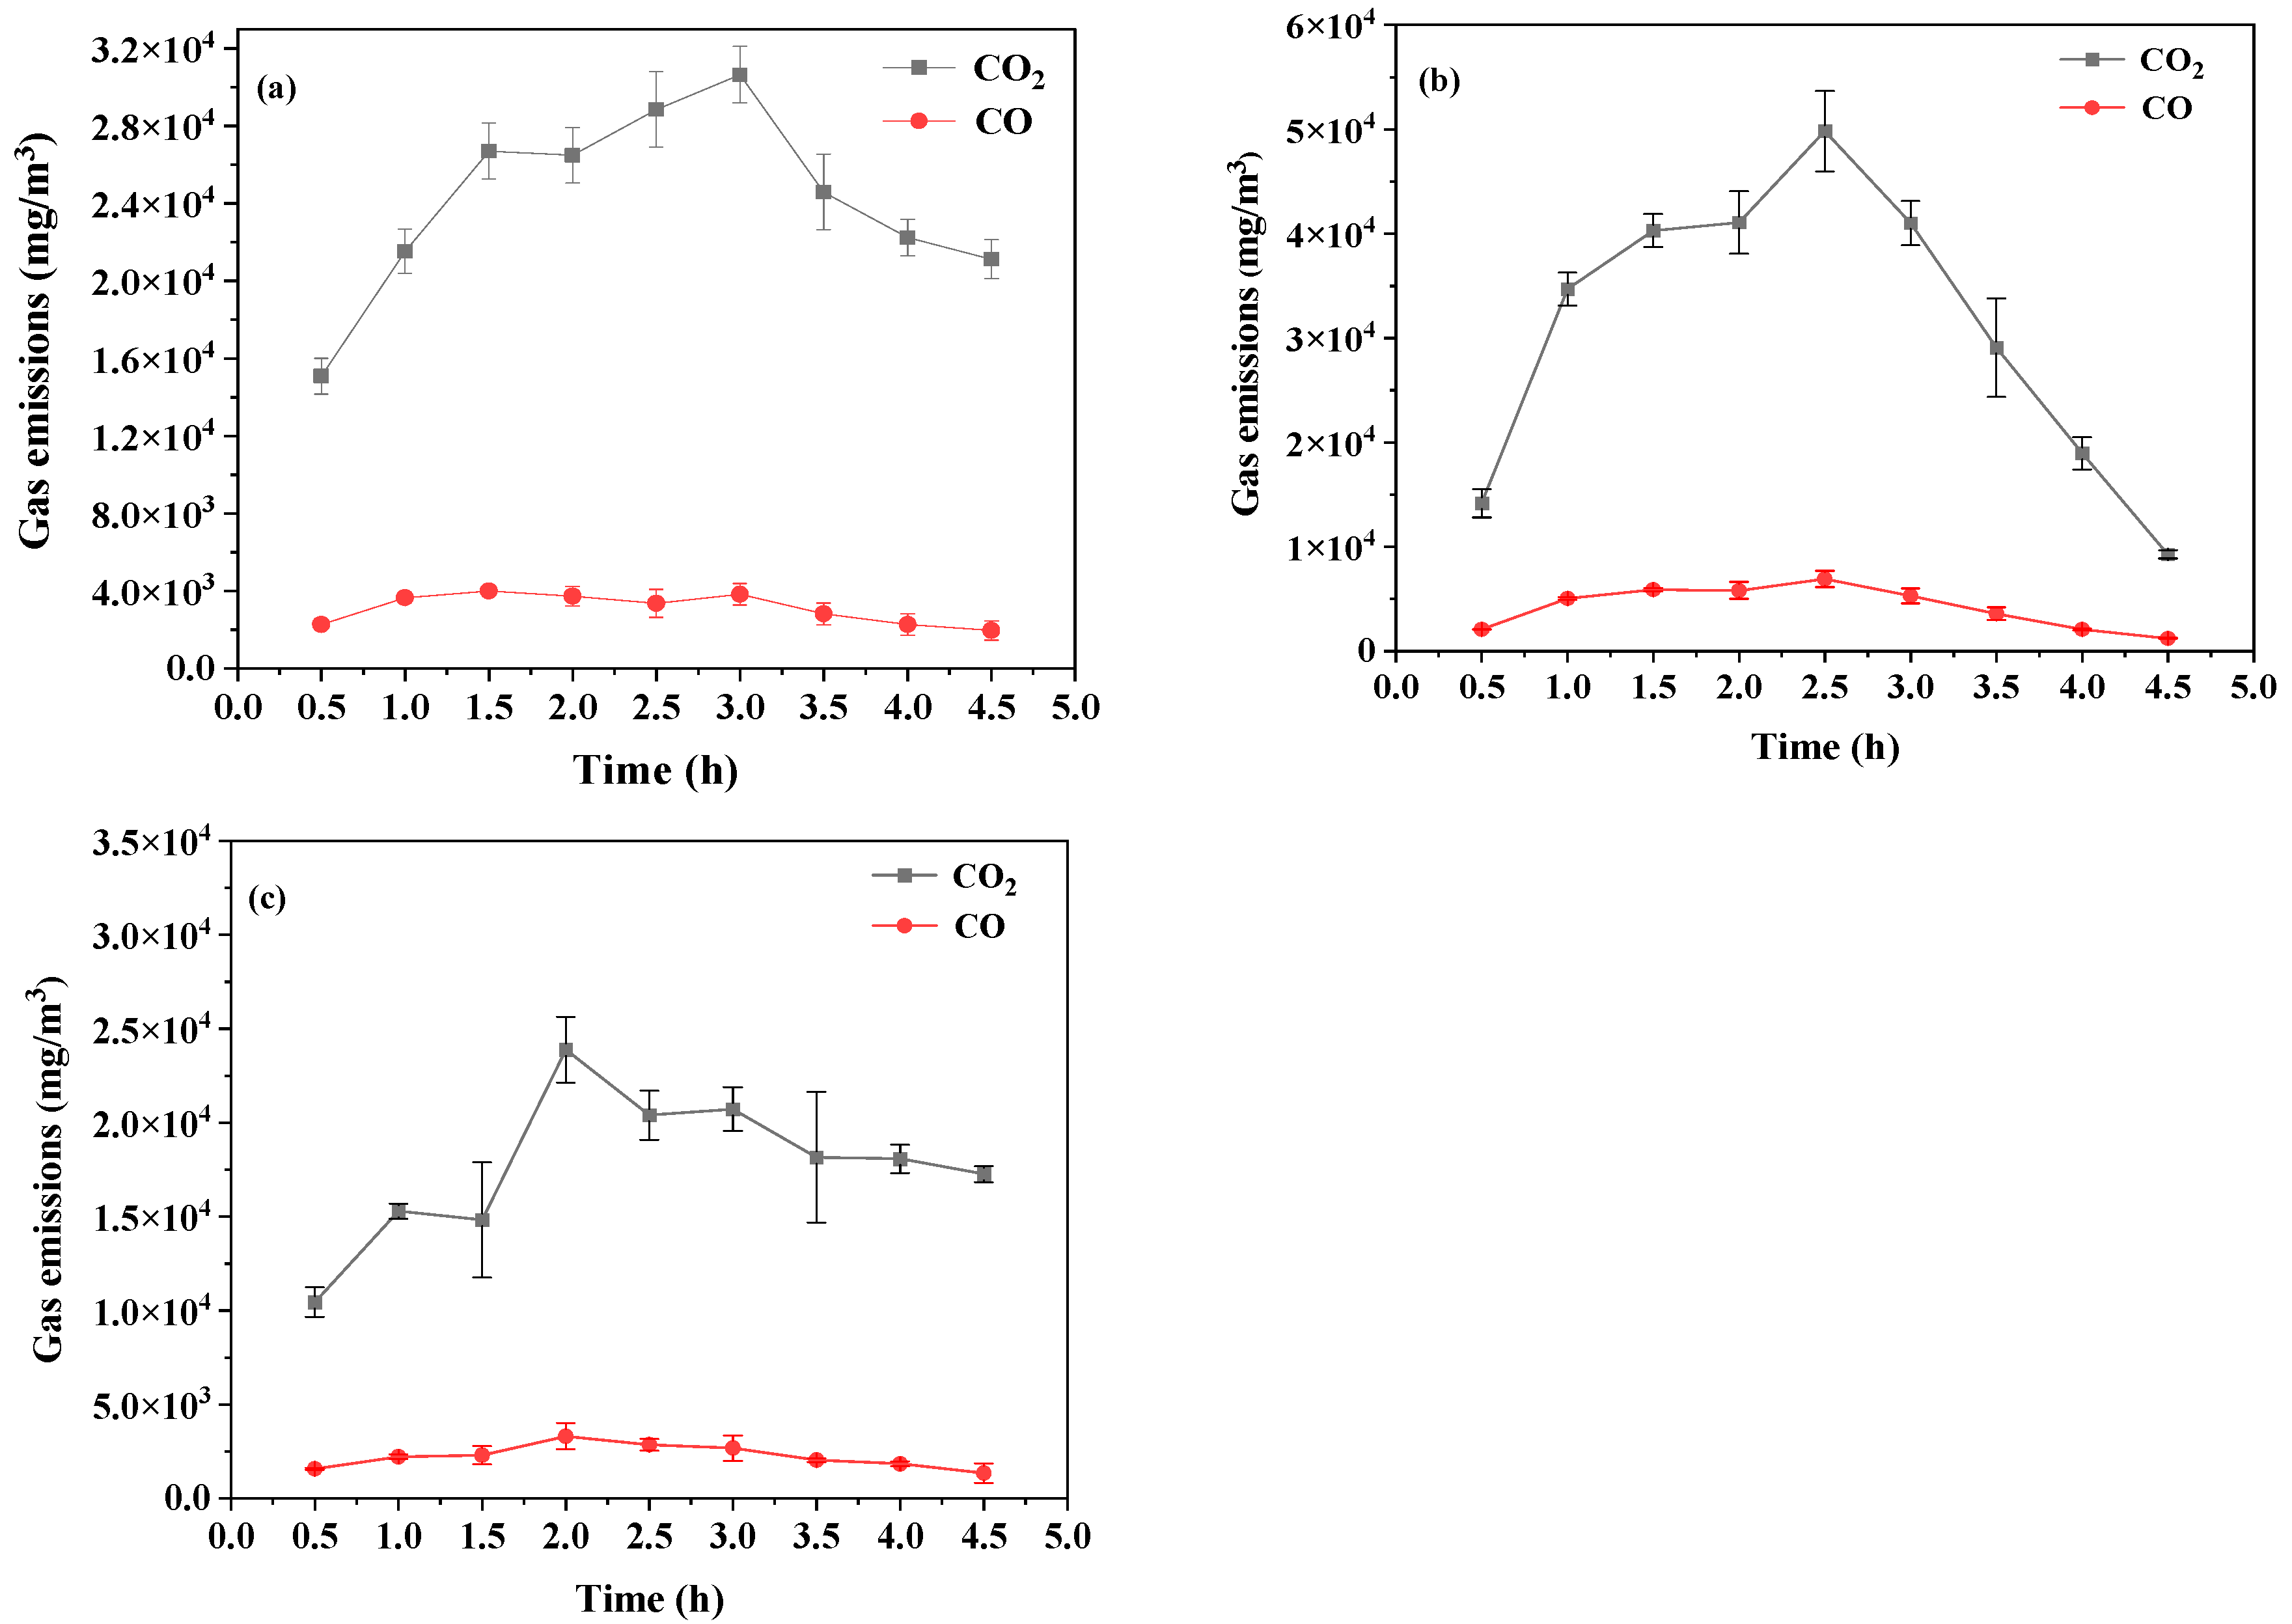
3.1.2. Emission Characteristics of CO2 and CO
3.2. Particulate Emissions in the Smouldering Combustion
3.2.1. EF of PM
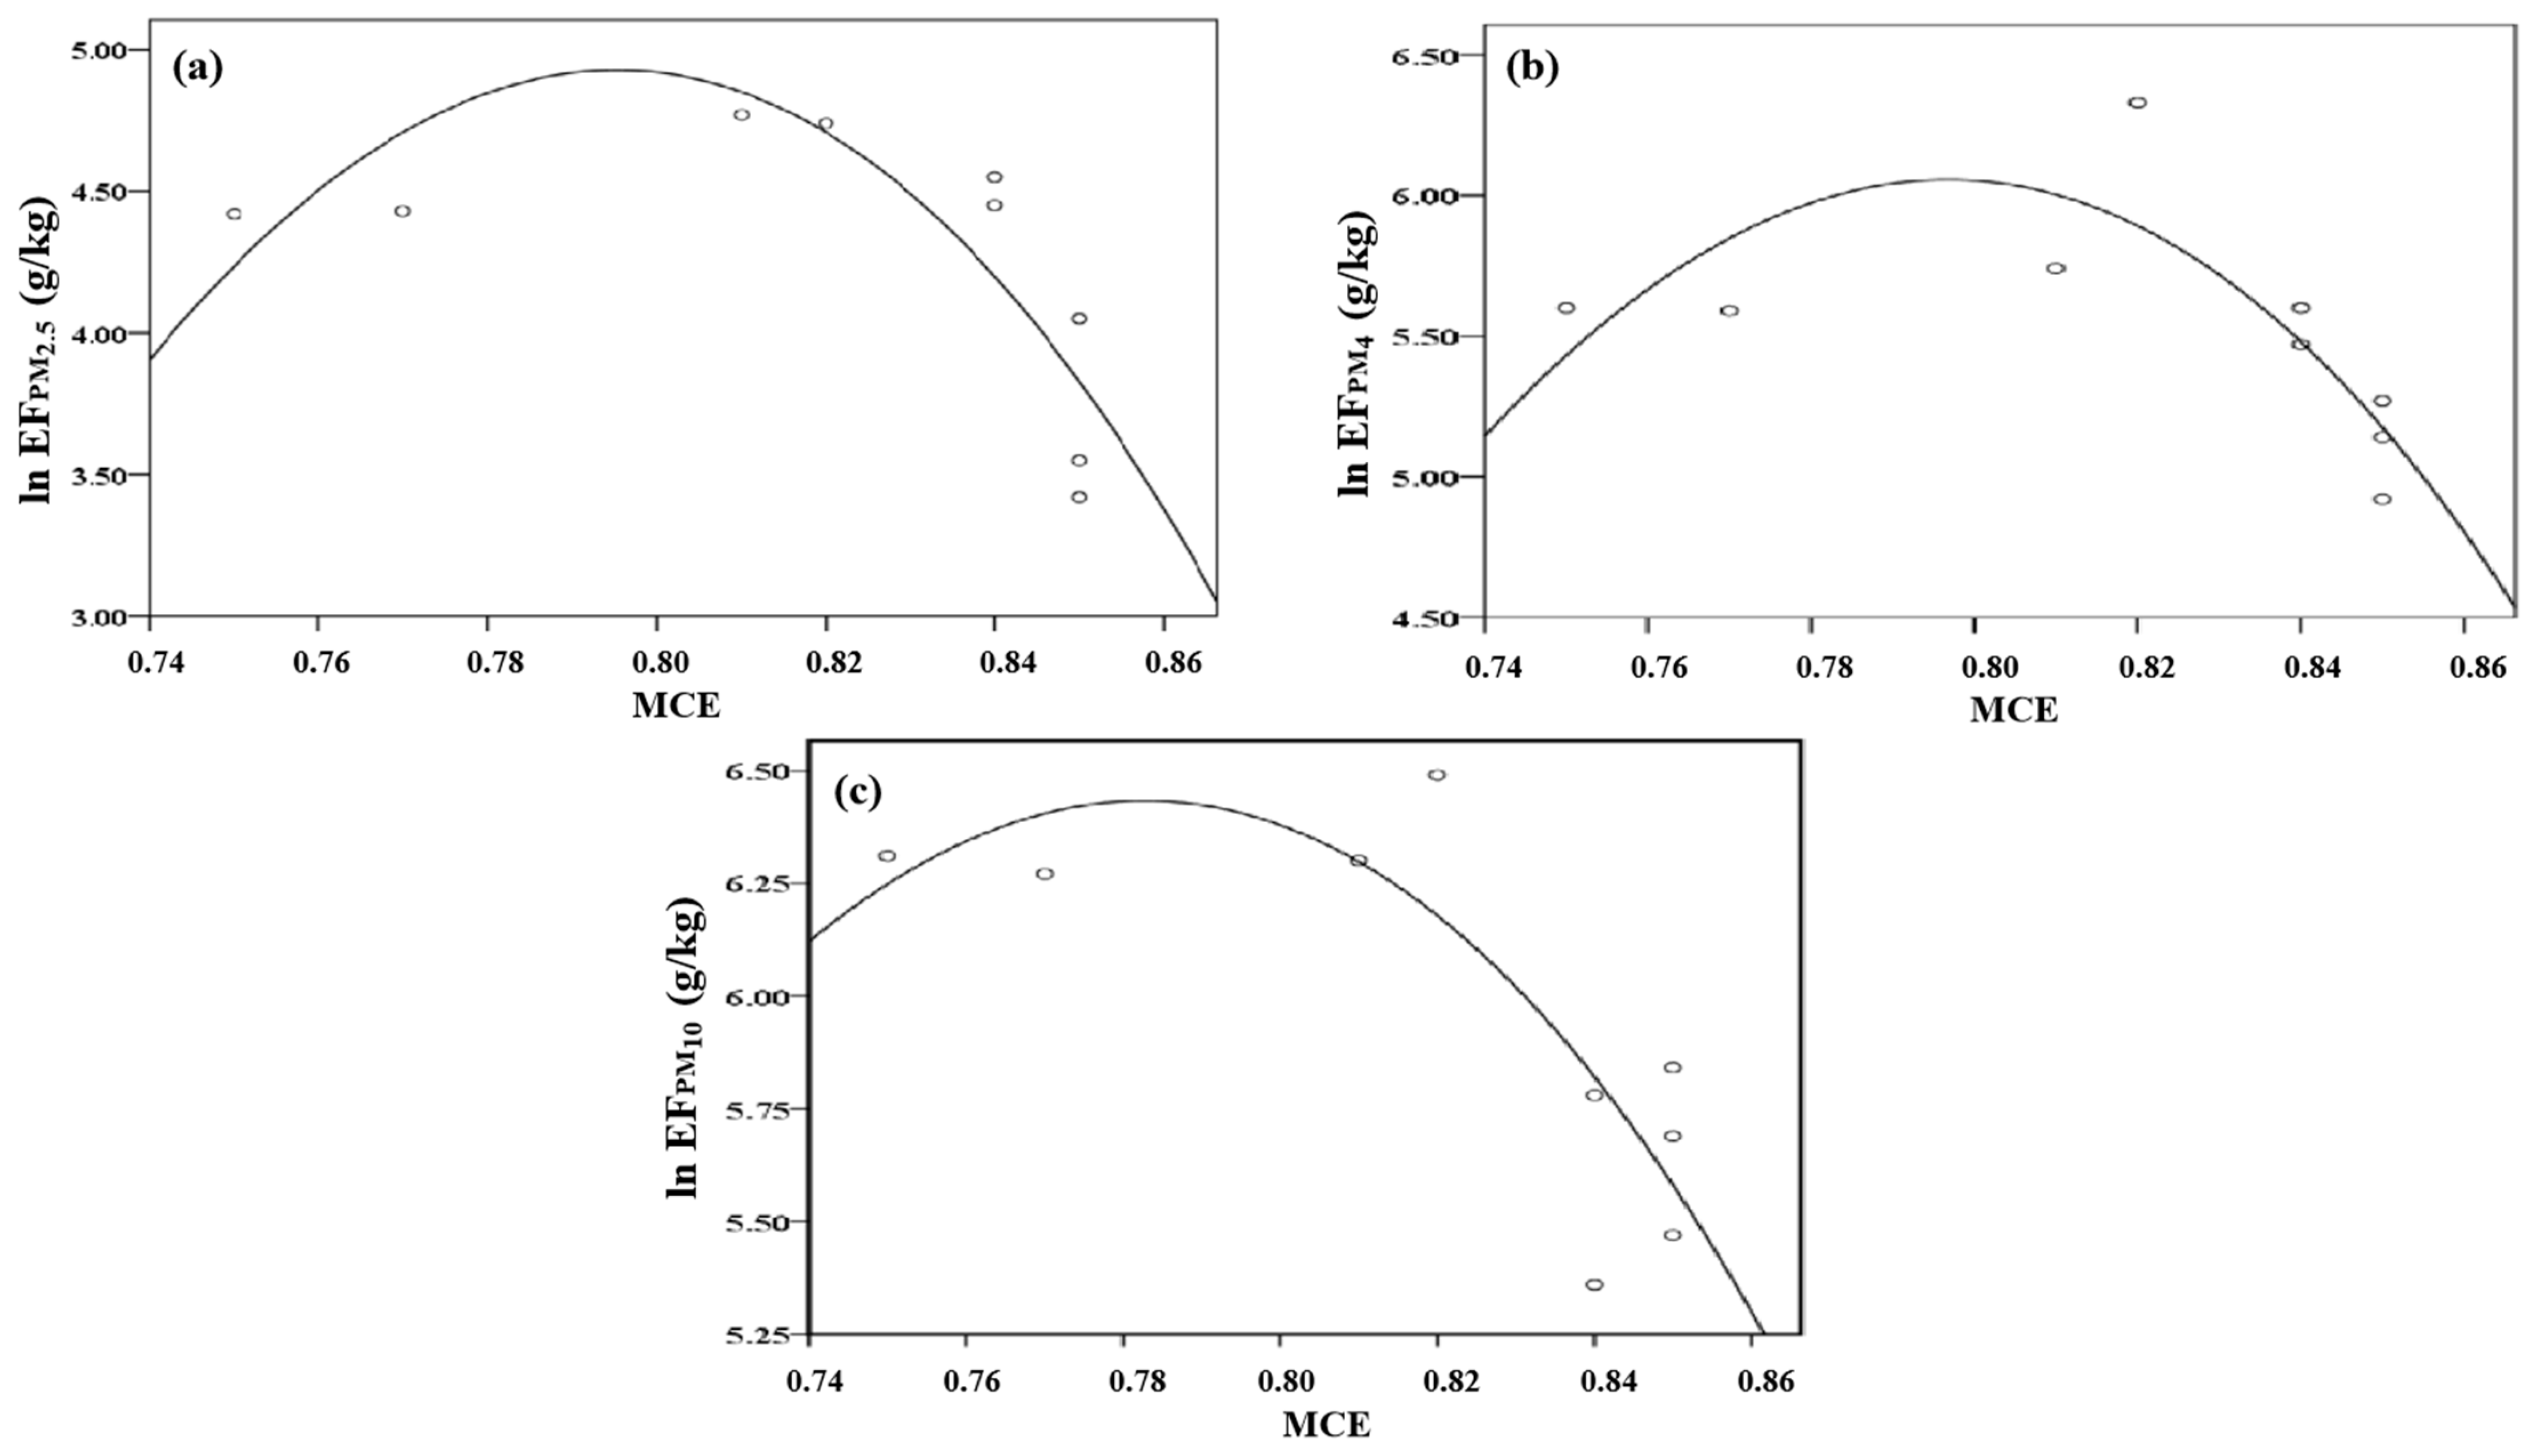
3.2.2. Relationship between EF and MCE
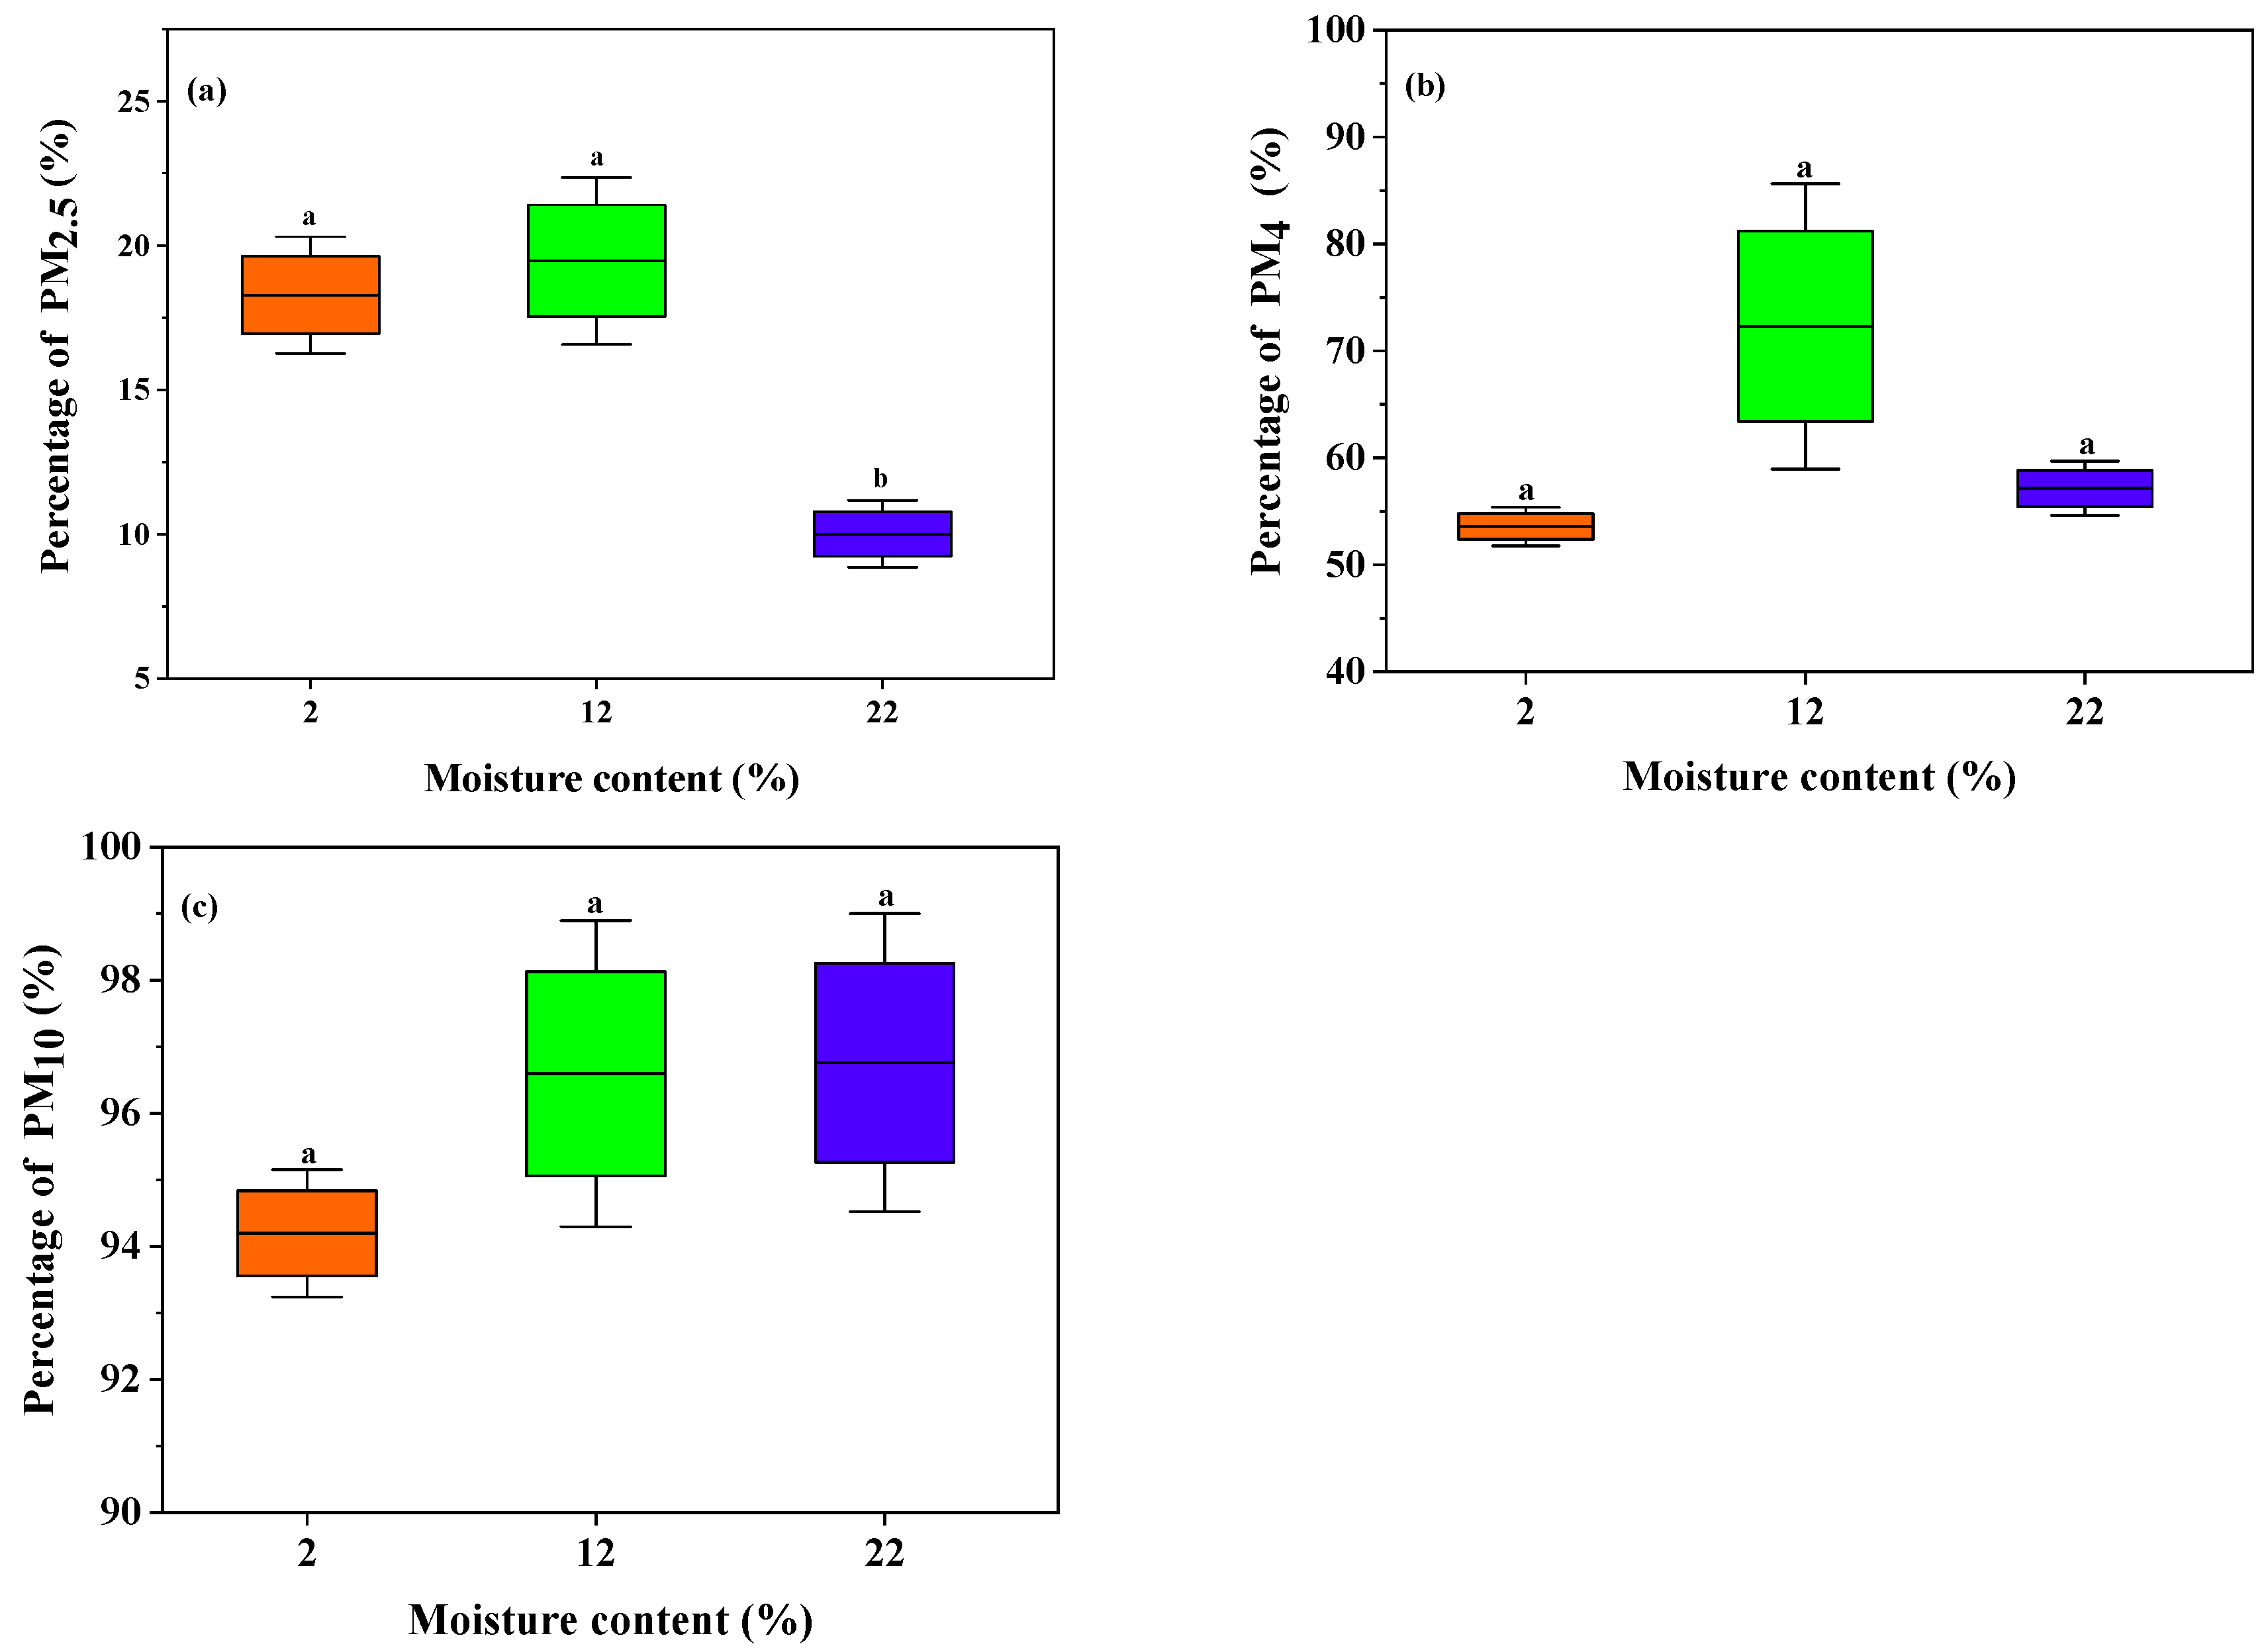
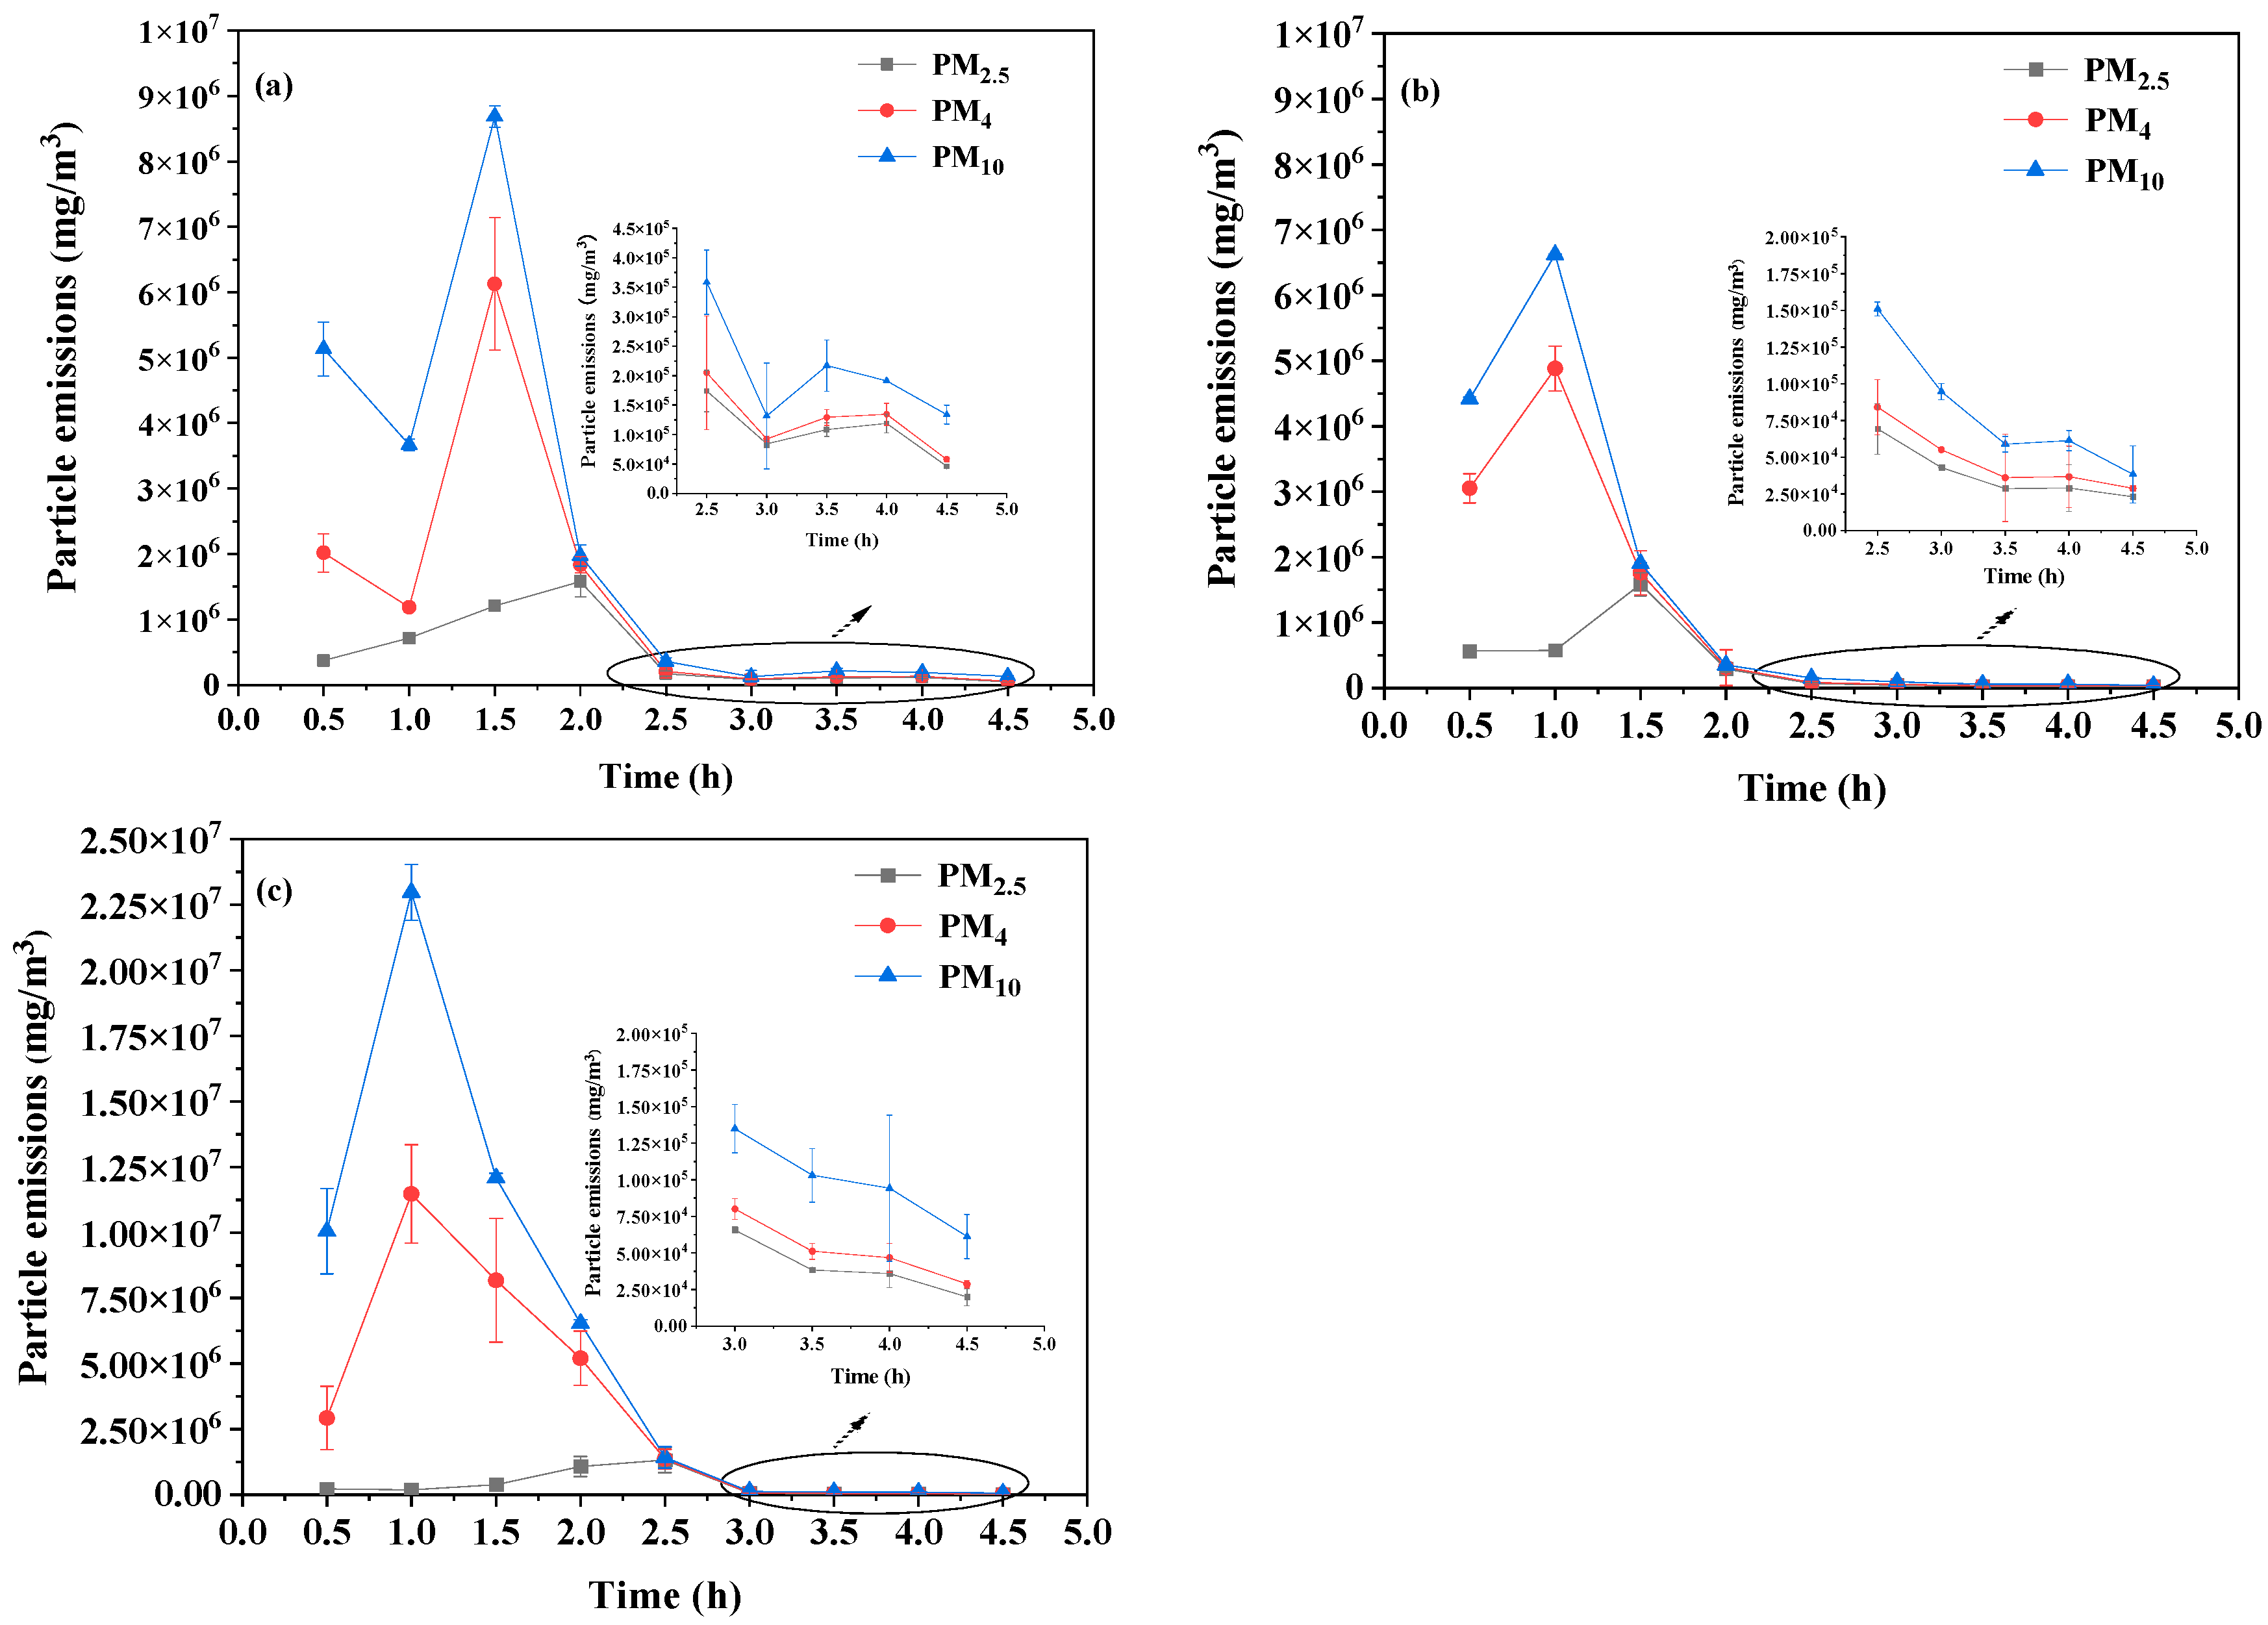
3.2.3. Emission Characteristics of PM
4. Discussion
4.1. EF of the Emissions and Variation Trend
4.2. Composition of Particulate Emissions in the Smouldering Combustion
4.3. Effect of MC on Gas and Particulate Emissions
5. Conclusions
Author Contributions
Funding
Data Availability Statement
Acknowledgments
Conflicts of Interest
Abbreviations
| HNNR | Huzhong National Nature Reserve |
| MC | Moisture content |
| EF | Emission factor |
| MCE | Modified combustion efficiency |
| ER | Emission ratio |
References
- Huang, X.; Rein, G. Downward spread of smouldering peat fire: The role of moisture, density and oxygen supply. Int. J. Wildland Fire 2017, 26, 907–918. [Google Scholar] [CrossRef]
- Zaccone, C.; Rein, G.; D’Orazio, V.; Hadden, R.M.; Belcher, C.M.; Miano, T.M. Smouldering fire signatures in peat and their implications for palaeoenvironmental reconstructions. Geochim. Cosmochim. Acta 2014, 137, 134–146. [Google Scholar] [CrossRef]
- Lin, S.; Liu, Y.; Huang, X. Climate-induced Arctic-boreal peatland fire and carbon loss in the 21st century. Sci. Total Environ. 2021, 796, 148924. [Google Scholar] [CrossRef]
- Hurley, M.J.; Gottuk, D.T.; Hall, J.R., Jr.; Harada, K.; Kuligowski, E.D.; Puchovsky, M.; Watts, J.M., Jr.; Wieczorek, C.J. SFPE Handbook of Fire Protection Engineering; Springer: New York, NY, USA, 2015. [Google Scholar]
- Hatch, L.E.; Luo, W.; Pankow, J.F.; Yokelson, R.J.; Stockwell, C.E.; Barsanti, K.C. Identification and quantification of gaseous organic compounds emitted from biomass burning using two-dimensional gas chromatography–time-of-flight mass spectrometry. Atmos. Chem. Phys. 2015, 15, 1865–1899. [Google Scholar] [CrossRef]
- Hu, Y.; Christensen, E.; Restuccia, F.; Rein, G. Transient gas and particle emissions from smouldering combustion of peat. Proc. Combust. Inst. 2019, 37, 4035–4042. [Google Scholar] [CrossRef]
- Page, S.E.; Siegert, F.; Rieley, J.O.; Boehm, H.-D.V.; Jaya, A.; Limin, S. The amount of carbon released from peat and forest fires in Indonesia during 1997. Nature 2002, 420, 61–65. [Google Scholar] [CrossRef] [PubMed]
- Sirin, A.A.; Makarov, D.A.; Gummert, I.; Maslov, A.A.; Gul’be, Y.I. Depth of peat burning and carbon loss during an underground forest fire. Contemp. Probl. Ecol. 2020, 13, 769–779. [Google Scholar] [CrossRef]
- Alves, C.A.; Vicente, A.; Monteiro, C.; Goncalves, C.; Evtyugina, M.; Pio, C. Emission of trace gases and organic components in smoke particles from a wildfire in a mixed-evergreen forest in Portugal. Sci. Total Environ. 2011, 409, 1466–1475. [Google Scholar] [CrossRef]
- Reid, J.S.; Koppmann, R.; Eck, T.F.; Eleuterio, D.P. A review of biomass burning emissions part II: Intensive physical properties of biomass burning particles. Atmos. Chem. Phys. 2005, 5, 799–825. [Google Scholar] [CrossRef]
- Hinwood, A.L.; Rodriguez, C.M. Potential health impacts associated with peat smoke: A review. J. R. Soc. West. Aust. 2005, 88, 133. [Google Scholar]
- Urbanski, S. Wildland fire emissions, carbon, and climate: Emission factors. For. Ecol. Manag. 2014, 317, 51–60. [Google Scholar] [CrossRef]
- Gorbach, N.; Startsev, V.; Mazur, A.; Milanovskiy, E.; Prokushkin, A.; Dymov, A. Simulation of Smoldering Combustion of Organic Horizons at Pine and Spruce Boreal Forests with Lab-Heating Experiments. Sustainability 2022, 14, 16772. [Google Scholar] [CrossRef]
- Yokelson, R.J.; Bertschi, I.T.; Christian, T.J.; Hobbs, P.V.; Ward, D.E.; Hao, W.M. Trace gas measurements in nascent, aged, and cloud-processed smoke from African savanna fires by airborne Fourier transform infrared spectroscopy (AFTIR). J. Geophys. Res. Atmos. 2003, 108, 8478–8496. [Google Scholar] [CrossRef]
- Akagi, S.K.; Yokelson, R.J.; Wiedinmyer, C.; Alvarado, M.J.; Reid, J.S.; Karl, T.; Crounse, J.D.; Wennberg, P.O. Emission factors for open and domestic biomass burning for use in atmospheric models. Atmos. Chem. Phys. 2011, 11, 4039–4072. [Google Scholar] [CrossRef]
- Andreae, M.O. Emission of trace gases and aerosols from biomass burning–an updated assessment. Atmos. Chem. Phys. 2019, 19, 8523–8546. [Google Scholar] [CrossRef]
- Wilson, D.; Dixon, S.D.; Artz, R.R.E.; Smith, T.E.L.; Evans, C.D.; Owen, H.J.F.; Archer, E.; Renou-Wilson, F. Derivation of greenhouse gas emission factors for peatlands managed for extraction in the Republic of Ireland and the United Kingdom. Biogeosciences 2015, 12, 5291–5308. [Google Scholar] [CrossRef]
- Stockwell, C.E.; Veres, P.R.; Williams, J.; Yokelson, R.J. Characterization of biomass burning emissions from cooking fires, peat, crop residue, and other fuels with high-resolution proton-transfer-reaction time-of-flight mass spectrometry. Atmos. Chem. Phys. 2015, 15, 845–865. [Google Scholar] [CrossRef]
- Hu, Y.; Cui, W.; Rein, G. Haze emissions from smouldering peat: The roles of inorganic content and bulk density. Fire Saf. J. 2020, 113, 102940. [Google Scholar] [CrossRef]
- Rein, G. Smouldering fires and natural fuels. In Fire Phenomena in the Earth System—An Interdisciplinary Approach to Fire Science; Wiley: Hoboken, NJ, USA, 2013; pp. 15–34. [Google Scholar]
- Yokelson, R.J.; Susott, R.; Ward, D.E.; Reardon, J.; Griffith, D.W.T. Emissions from smoldering combustion of biomass measured by open-path Fourier transform infrared spectroscopy. J. Geophys. Res. Atmos. 1997, 102, 18865–18877. [Google Scholar] [CrossRef]
- Hu, Y.; Fernandez-Anez, N.; Smith, T.E.L.; Rein, G. Review of emissions from smouldering peat fires and their contribution to regional haze episodes. Int. J. Wildland Fire 2018, 27, 293–312. [Google Scholar] [CrossRef]
- Rodriguez Vasquez, M.J.; Benoist, A.; Roda, J.M.; Fortin, M. Estimating greenhouse gas emissions from peat combustion in wildfires on Indonesian peatlands, and their uncertainty. Global Biogeochem. Cycles 2021, 35, e2019GB006218. [Google Scholar] [CrossRef]
- Stockwell, C.E.; Yokelson, R.J.; Kreidenweis, S.M.; Robinson, A.L.; DeMott, P.J.; Sullivan, R.C.; Reardon, J.; Ryan, K.C.; Griffith, D.W.T.; Stevens, L. Trace gas emissions from combustion of peat, crop residue, domestic biofuels, grasses, and other fuels: Configuration and Fourier transform infrared (FTIR) component of the fourth Fire Lab at Missoula Experiment (FLAME-4). Atmos. Chem. Phys. 2014, 14, 9727–9754. [Google Scholar] [CrossRef]
- Black, R.R.; Aurell, J.; Holder, A.; George, I.J.; Gullett, B.K.; Hays, M.D.; Geron, C.D.; Tabor, D. Characterization of gas and particle emissions from laboratory burns of peat. Atmos. Environ. 2016, 132, 49–57. [Google Scholar] [CrossRef]
- Konecny, K.; Ballhorn, U.; Navratil, P.; Jubanski, J.; Page, S.E.; Tansey, K.; Hooijer, A.; Vernimmen, R.; Siegert, F. Variable carbon losses from recurrent fires in drained tropical peatlands. Glob. Chang. Biol. 2016, 22, 1469–1480. [Google Scholar] [CrossRef]
- Heal, M.R.; Hibbs, L.R.; Agius, R.M.; Beverland, I.J. Total and water-soluble trace metal content of urban background PM10, PM2. 5 and black smoke in Edinburgh, UK. Atmos. Environ. 2005, 39, 1417–1430. [Google Scholar] [CrossRef]
- Durán, S.; Reisen, F.; Rideout, K. Evidence Review: Wildfire Smoke and Public Health Risk; BC Centre for Disease Control: Vancouver, BC, Canada, 2014. [Google Scholar]
- Kim, Y.H.; Tong, H.; Daniels, M.; Boykin, E.; Krantz, Q.T.; McGee, J.; Hays, M.; Kovalcik, K.; Dye, J.A.; Gilmour, M.I. Cardiopulmonary toxicity of peat wildfire particulate matter and the predictive utility of precision cut lung slices. Part. Fibre Toxicol. 2014, 11, 29. [Google Scholar] [CrossRef]
- Heil, A.; Goldammer, J. Smoke-haze pollution: A review of the 1997 episode in Southeast Asia. Reg. Environ. Chang. 2001, 2, 24–37. [Google Scholar] [CrossRef]
- Cancellieri, D.; Leroy-Cancellieri, V.; Leoni, E.; Simeoni, A.; Kuzin, A.Y.; Filkov, A.I.; Rein, G. Kinetic investigation on the smouldering combustion of boreal peat. Fuel 2012, 93, 479–485. [Google Scholar] [CrossRef]
- Atwood, E.C.; Englhart, S.; Lorenz, E.; Halle, W.; Wiedemann, W.; Siegert, F. Detection and characterization of low temperature peat fires during the 2015 fire catastrophe in Indonesia using a new high-sensitivity fire monitoring satellite sensor (FireBird). PLoS ONE 2016, 11, e0159410. [Google Scholar] [CrossRef]
- Shaposhnikov, D.; Revich, B.; Bellander, T.; Bedada, G.B.; Bottai, M.; Kharkova, T.; Kvasha, E.; Lezina, E.; Lind, T.; Semutnikova, E. Mortality related to air pollution with the Moscow heat wave and wildfire of 2010. Epidemiology 2014, 25, 359. [Google Scholar] [CrossRef]
- Rappold, A.G.; Stone, S.L.; Cascio, W.E.; Neas, L.M.; Kilaru, V.J.; Carraway, M.S.; Szykman, J.J.; Ising, A.; Cleve, W.E.; Meredith, J.T. Peat bog wildfire smoke exposure in rural North Carolina is associated with cardiopulmonary emergency department visits assessed through syndromic surveillance. Environ. Health Perspect. 2011, 119, 1415–1420. [Google Scholar] [CrossRef] [PubMed]
- Christian, T.J.; Kleiss, B.; Yokelson, R.J.; Holzinger, R.; Crutzen, P.J.; Hao, W.M.; Saharjo, B.H.; Ward, D.E. Comprehensive laboratory measurements of biomass-burning emissions: 1. Emissions from Indonesian, African, and other fuels. J. Geophys. Res. Atmos. 2003, 108, 4719. [Google Scholar] [CrossRef]
- Smith, T.E.L.; Evers, S.; Yule, C.M.; Gan, J.Y. In situ tropical peatland fire emission factors and their variability, as determined by field measurements in peninsula Malaysia. Glob. Biogeochem. Cycles 2018, 32, 18–31. [Google Scholar] [CrossRef]
- Rein, G.; Cohen, S.; Simeoni, A. Carbon emissions from smouldering peat in shallow and strong fronts. Proc. Combust. Inst. 2009, 32, 2489–2496. [Google Scholar] [CrossRef]
- Huijnen, V.; Wooster, M.J.; Kaiser, J.W.; Gaveau, D.L.A.; Flemming, J.; Parrington, M.; Inness, A.; Murdiyarso, D.; Main, B.; van Weele, M. Fire carbon emissions over maritime southeast Asia in 2015 largest since 1997. Sci. Rep. 2016, 6, 26886. [Google Scholar] [CrossRef] [PubMed]
- Page, S.E.; Rieley, J.O.; Banks, C.J. Global and regional importance of the tropical peatland carbon pool. Global Chang. Biol. 2011, 17, 798–818. [Google Scholar] [CrossRef]
- Miao, R.; Ma, J.; Liu, Y.; Liu, Y.; Yang, Z.; Guo, M. Variability of aboveground litter inputs alters soil carbon and nitrogen in a coniferous–broadleaf mixed forest of Central China. Forests 2019, 10, 188. [Google Scholar] [CrossRef]
- Adamczyk, B.; Sietiö, O.-M.; Straková, P.; Prommer, J.; Wild, B.; Hagner, M.; Pihlatie, M.; Fritze, H.; Richter, A.; Heinonsalo, J. Plant roots increase both decomposition and stable organic matter formation in boreal forest soil. Nat. Commun. 2019, 10, 3982. [Google Scholar] [CrossRef]
- Stockwell, C.E.; Jayarathne, T.; Cochrane, M.A.; Ryan, K.C.; Putra, E.I.; Saharjo, B.H.; Nurhayati, A.D.; Albar, I.; Blake, D.R.; Simpson, I.J. Field measurements of trace gases and aerosols emitted by peat fires in Central Kalimantan, Indonesia, during the 2015 El Niño. Atmos. Chem. Phys. 2016, 16, 11711–11732. [Google Scholar] [CrossRef]
- Geron, C.; Hays, M. Air emissions from organic soil burning on the coastal plain of North Carolina. Atmos. Environ. 2013, 64, 192–199. [Google Scholar] [CrossRef]
- Jayarathne, T.; Stockwell, C.E.; Gilbert, A.A.; Daugherty, K.; Cochrane, M.A.; Ryan, K.C.; Putra, E.I.; Saharjo, B.H.; Nurhayati, A.D.; Albar, I. Chemical characterization of fine particulate matter emitted by peat fires in Central Kalimantan, Indonesia, during the 2015 El Niño. Atmos. Chem. Phys. 2018, 18, 2585–2600. [Google Scholar] [CrossRef]
- Reisen, F.; Meyer, C.P.; Weston, C.J.; Volkova, L. Ground-Based Field Measurements of PM2.5Emission Factors from Flaming and Smoldering Combustion in Eucalypt Forests. J. Geophys. Res. Atmos. 2018, 123, 8301–8314. [Google Scholar] [CrossRef]
- Wang, C. Biomass allometric equations for 10 co-occurring tree species in Chinese temperate forests. For. Ecol. Manag. 2006, 222, 9–16. [Google Scholar] [CrossRef]
- Hu, H.-Q.; Guo, F.-T. Estimation of total carbon-containing gas emission from main tree species in forest fires in Daxing’an Mountains. Yingyong Shengtai Xuebao 2008, 19, 1884–1890. [Google Scholar] [PubMed]
- Pechony, O.; Shindell, D.T. Driving forces of global wildfires over the past millennium and the forthcoming century. Proc. Natl. Acad. Sci. USA 2010, 107, 19167–19170. [Google Scholar] [CrossRef]
- Gu, H.; Jin, Y.; Zhang, Y.; Chen, X. Effects of forest fire on soil nutrients of Ass. Pinus pumila-Larix gmelinii forest in Great Xing’an Mountains. J. Beijing For. Univ. 2016, 38, 48–54. [Google Scholar]
- Granged, A.J.P.; Jordán, A.; Zavala, L.M.; Muñoz-Rojas, M.; Mataix-Solera, J. Short-term effects of experimental fire for a soil under eucalyptus forest (SE Australia). Geoderma 2011, 167, 125–134. [Google Scholar] [CrossRef]
- Turetsky, M.R.; Benscoter, B.; Page, S.; Rein, G.; Van Der Werf, G.R.; Watts, A. Global vulnerability of peatlands to fire and carbon loss. Nat. Geosci. 2015, 8, 11–14. [Google Scholar] [CrossRef]
- Archibald, S.; Lehmann, C.E.R.; Belcher, C.M.; Bond, W.J.; Bradstock, R.A.; Daniau, A.-L.; Dexter, K.G.; Forrestel, E.J.; Greve, M.; He, T. Biological and geophysical feedbacks with fire in the Earth system. Environ. Res. Lett. 2018, 13, 033003. [Google Scholar] [CrossRef]
- Huang, X.; Rein, G. Computational study of critical moisture and depth of burn in peat fires. Int. J. Wildland Fire 2015, 24, 798–808. [Google Scholar] [CrossRef]
- Chang, Y.; Leng, W.; He, H.; Liu, B. Using weights of evidence to estimate the probability of forest fire occurrence: A case study in Huzhong area of the Daxing’an Mountains. Sci. Silvae Sin. 2010, 46, 103–109. [Google Scholar]
- Cai, W.H.; Yang, J.; Liu, Z.H.; Hu, Y.M.; Liu, S.J.; Jing, G.Z.; Zhao, Z.F. Controls of post-fire tree recruitment in Great Xing’an Mountains in Heilongjiang Province. Acta Ecol. Sin. 2012, 32, 3302–3307. [Google Scholar]
- Meyer, C.P.; Cook, G.D.; Reisen, F.; Smith, T.E.L.; Tattaris, M.; Russell-Smith, J.; Maier, S.W.; Yates, C.P.; Wooster, M.J. Direct measurements of the seasonality of emission factors from savanna fires in northern Australia. J. Geophys. Res. Atmos. 2012, 117, 305. [Google Scholar] [CrossRef]
- Hu, H.; Wei, S.; Sun, L. Estimation of carbon emissions from forest fires in 2010 in Huzhong of Daxing’anling Mountain. Sci. Silvae Sin. 2012, 48, 109–119. [Google Scholar]
- Chang, Y.; Hang, W.T.; Hu, Y.M.; Li, Y.H.; Bu, R.C.; Liu, Y.Y. Contemporary research advances on carbon emissions by forest fires and future prospects. Shengtaixue Zazhi 2015, 34, 2922–2929. [Google Scholar]
- Guo, L.F.M., Y. F.; Guo, X.B.;Zheng, W.X.; Guo, F.T. Analysis of the carbon emission of main tree species in Daxing’an Mountain under different burning condition. J. Fujian Agric. For. Univ. (Nat. Sci. Ed.) 2020, 49, 524–531. [Google Scholar]
- Hu, Y.; Christensen, E.G.; Amin, H.M.F.; Smith, T.E.L.; Rein, G. Experimental study of moisture content effects on the transient gas and particle emissions from peat fires. Combust. Flame 2019, 209, 408–417. [Google Scholar] [CrossRef]
- Bonsang, B.; Boissard, C.; Le Cloarec, M.F.; Rudolph, J.; Lacaux, J.P. Methane, carbon monoxide and light non-methane hydrocarbon emissions from African savanna burnings during the FOS/DECAFE experiment. J. Atmos. Chem. 1995, 22, 149–162. [Google Scholar] [CrossRef]
- Iinuma, Y.; Brüggemann, E.; Gnauk, T.; Müller, K.; Andreae, M.O.; Helas, G.; Parmar, R.; Herrmann, H. Source characterization of biomass burning particles: The combustion of selected European conifers, African hardwood, savanna grass, and German and Indonesian peat. J. Geophys. Res. Atmos. 2007, 112, D08209.1–D08209.26. [Google Scholar] [CrossRef]
- May, A.A.; McMeeking, G.R.; Lee, T.; Taylor, J.W.; Craven, J.S.; Burling, I.; Sullivan, A.P.; Akagi, S.; Collett, J.L., Jr.; Flynn, M. Aerosol emissions from prescribed fires in the United States: A synthesis of laboratory and aircraft measurements. J. Geophys. Res. Atmos. 2014, 119, 11826–11849. [Google Scholar] [CrossRef]
- McMeeking, G.R.; Kreidenweis, S.M.; Baker, S.; Carrico, C.M.; Chow, J.C.; Collett, J.L., Jr.; Hao, W.M.; Holden, A.S.; Kirchstetter, T.W.; Malm, W.C. Emissions of trace gases and aerosols during the open combustion of biomass in the laboratory. J. Geophys. Res. Atmos. 2009, 114, D19210–D19219. [Google Scholar] [CrossRef]
- Huang, X.; Rein, G. Smouldering combustion of peat in wildfires: Inverse modelling of the drying and the thermal and oxidative decomposition kinetics. Combust. Flame 2014, 161, 1633–1644. [Google Scholar] [CrossRef]
- Hadden, R.M.; Rein, G.; Belcher, C.M. Study of the competing chemical reactions in the initiation and spread of smouldering combustion in peat. Proc. Combust. Inst. 2013, 34, 2547–2553. [Google Scholar] [CrossRef]
- Sikkink, P.G.; Jain, T.B.; Reardon, J.; Heinsch, F.A.; Keane, R.E.; Butler, B.; Baggett, L.S. Effect of particle aging on chemical characteristics, smoldering, and fire behavior in mixed-conifer masticated fuel. For. Ecol. Manag. 2017, 405, 150–165. [Google Scholar] [CrossRef]
- Roulston, C.; Paton-Walsh, C.; Smith, T.E.L.; Guérette, É.A.; Evers, S.; Yule, C.M.; Rein, G.; Van der Werf, G.R. Fine particle emissions from tropical peat fires decrease rapidly with time since ignition. J. Geophys. Res. Atmos. 2018, 123, 5607–5617. [Google Scholar] [CrossRef]
- Morgan, G.; Sheppeard, V.; Khalaj, B.; Ayyar, A.; Lincoln, D.; Jalaludin, B.; Beard, J.; Corbett, S.; Lumley, T. Effects of bushfire smoke on daily mortality and hospital admissions in Sydney, Australia. Epidemiology 2010, 21, 47–55. [Google Scholar] [CrossRef]
- Uttajug, A.; Ueda, K.; Oyoshi, K.; Honda, A.; Takano, H. Association between PM10 from vegetation fire events and hospital visits by children in upper northern Thailand. Sci. Total Environ. 2021, 764, 142923. [Google Scholar] [CrossRef]
- Hofman, J.; Wuyts, K.; Van Wittenberghe, S.; Samson, R. On the temporal variation of leaf magnetic parameters: Seasonal accumulation of leaf-deposited and leaf-encapsulated particles of a roadside tree crown. Sci. Total Environ. 2014, 493, 766–772. [Google Scholar] [CrossRef]
- Nanos, G.D.; Ilias, I.F. Effects of inert dust on olive (Olea europaea L.) leaf physiological parameters. Environ. Sci. Pollut. Res.-Int. 2007, 14, 212–214. [Google Scholar] [CrossRef]
- Huang, X.; Restuccia, F.; Gramola, M.; Rein, G. Experimental study of the formation and collapse of an overhang in the lateral spread of smouldering peat fires. Combust. Flame 2016, 168, 393–402. [Google Scholar] [CrossRef]
- Usup, A.; Hashimoto, Y.; Takahashi, H.; Hayasaka, H. Combustion and thermal characteristics of peat fire in tropical peatland in Central Kalimantan, Indonesia. Tropics 2004, 14, 1–19. [Google Scholar] [CrossRef]
- Zhang, Y.; Obrist, D.; Zielinska, B.; Gertler, A. Particulate emissions from different types of biomass burning. Atmos. Environ. 2013, 72, 27–35. [Google Scholar] [CrossRef]
- Guerrero, F.; Yáñez, K.; Vidal, V.; Cereceda-Balic, F. Effects of wood moisture on emission factors for PM2. 5, particle numbers and particulate-phase PAHs from Eucalyptus globulus combustion using a controlled combustion chamber for emissions. Sci. Total Environ. 2019, 648, 737–744. [Google Scholar] [CrossRef] [PubMed]


| MC (%) | CO2 | CO |
|---|---|---|
| 2 | 107.27 ± 39.83 | 12.10 ± 3.65 |
| 12 | 91.63 ± 29.36 | 10.87 ± 1.07 |
| 22 | 103.23 ± 59.01 | 12.30 ± 6.65 |
| MC (%) | PM2.5 | PM4 | PM10 | TSP |
|---|---|---|---|---|
| 2 | 100.34 ± 24.05 | 290.54 ± 29.91 | 547.29 ± 4.91 | 549.35 ± 32.80 |
| 12 | 70.64 ± 19.09 | 219.80 ± 69.65 | 327.76 ± 44.82 | 333.96 ± 42.77 |
| 22 | 90.35 ± 6.26 | 594.76 ± 18.46 | 932.72 ± 76.93 | 950.70 ± 90.35 |
Disclaimer/Publisher’s Note: The statements, opinions and data contained in all publications are solely those of the individual author(s) and contributor(s) and not of MDPI and/or the editor(s). MDPI and/or the editor(s) disclaim responsibility for any injury to people or property resulting from any ideas, methods, instructions or products referred to in the content. |
© 2023 by the authors. Licensee MDPI, Basel, Switzerland. This article is an open access article distributed under the terms and conditions of the Creative Commons Attribution (CC BY) license (https://creativecommons.org/licenses/by/4.0/).
Share and Cite
Tang, S.; Yin, S.; Shan, Y.; Yu, B.; Cui, C.; Cao, L. The Characteristics of Gas and Particulate Emissions from Smouldering Combustion in the Pinus pumila Forest of Huzhong National Nature Reserve of the Daxing’an Mountains. Forests 2023, 14, 364. https://doi.org/10.3390/f14020364
Tang S, Yin S, Shan Y, Yu B, Cui C, Cao L. The Characteristics of Gas and Particulate Emissions from Smouldering Combustion in the Pinus pumila Forest of Huzhong National Nature Reserve of the Daxing’an Mountains. Forests. 2023; 14(2):364. https://doi.org/10.3390/f14020364
Chicago/Turabian StyleTang, Shuyuan, Sainan Yin, Yanlong Shan, Bo Yu, Chenxi Cui, and Lili Cao. 2023. "The Characteristics of Gas and Particulate Emissions from Smouldering Combustion in the Pinus pumila Forest of Huzhong National Nature Reserve of the Daxing’an Mountains" Forests 14, no. 2: 364. https://doi.org/10.3390/f14020364
APA StyleTang, S., Yin, S., Shan, Y., Yu, B., Cui, C., & Cao, L. (2023). The Characteristics of Gas and Particulate Emissions from Smouldering Combustion in the Pinus pumila Forest of Huzhong National Nature Reserve of the Daxing’an Mountains. Forests, 14(2), 364. https://doi.org/10.3390/f14020364