Abstract
Since the 1950s, divergence problems have reduced the temporal stability of tree rings in response to climate, shaken the foundations of dendroclimatology, and affected the reliability of reconstructed models based on tree rings and the accuracy of historical climate series. Therefore, it is of great importance to investigate divergence problems, which will help us to better understand the growth strategies of trees in response to climate warming and provide a scientific basis for accurate climate reconstruction and simulation of forest dynamics. This paper aims to elucidate the mechanism of divergent growth of Picea schrenkiana at high altitudes in the western Tianshan from three aspects: variations in atmospheric circulation, changes in climatic factors, and the coping strategy of trees with climate change. High spring temperatures accelerate the melting of snow cover. Large amounts of snowmelt initially replenish soil water, leading to the rapid growth of trees, but later, the continuous consumption of snowmelt reduces the available water capacity of soil, resulting in water stress on trees. The pattern of trees’ response to changes in climate ranges from a pure temperature limitation to a collaborative temperature–moisture limitation. Since the 1990s, the weakening of the westerly circulation and the North Atlantic Oscillation has reduced their impacts on the hydroclimate in the Tianshan Mountains of Central Asia. The combination of heat-induced water deficit and a long-term weakening trend in atmospheric circulation has slowed tree growth over the past decade.
1. Introduction
Tree rings have become an excellent palaeoclimatic material; their many distinct advantages, such as high temporal resolution, accurate dating, wide geographical distribution, a large number of duplicates, easy availability of samples, accurate recording of surrounding environmental changes, etc., have been widely used to reconstruct regional and global climate change history [1,2,3]. They can not only show the natural variability of climate change on the centennial and millennial scales [4,5,6] but can also reveal the impact of human activities on nature [7,8,9,10]. They are also a key material for accurately assessing climate change scenarios and the response strategies and adaptive capacity of trees. The multiple parameters of tree rings provide many opportunities for climate research in different directions. Traditional macrostructural indicators, such as tree-ring width and tree-ring density, with their long research history and established techniques and methods, have formed the research foundation of dendroclimatology [2,3,4,5,11]. Innovative isotopic indicators such as tree-ring stable isotopes at the atomic scale have established tree-ring isotopic physiological models based on the principle of isotope fractionation and revealed large-scale regional climate signals [6,12,13,14,15]. Microstructural indicators, such as xylem anatomical characteristics, can reveal climatic and environmental signals from the perspective of cellular and subcellular scales and provide the internal mechanism or physiological explanations for the tree-ring growth–climate relationship [16,17,18,19].
Since the second half of the 20th century, however, the relationship between tree growth and climate has changed significantly with global warming. Rapid warming changes the sensitivity of trees to temperature and thus significantly alters the composition and distribution of forest ecosystems, especially the distribution of vegetation towards polar and high elevations [20,21,22,23,24]. The discovery of the divergence problem at high latitudes and mid-high elevations, i.e., the decreasing sensitivity of tree growth to temperature over time, challenges the traditional dendroclimatic reconstruction and breaks our understanding of the basic hypothesis, i.e., the uniformity principle in dendroclimatology [25]. It affects the reliability of reconstructed models based on tree rings and the accuracy of historical climate series. There are still different explanations for the mechanism of the divergence problem, mainly as follows. First, the temperature threshold hypothesis [26,27] states that there is an inverted U-shaped or nonlinear relationship between tree growth and temperature [28], i.e., that there is an optimal temperature range for tree growth. When the temperature rises beyond this range, it is possible to cause a decline in tree growth. The second explanation is drought stress, which emphasises that a water deficit affects normal tree growth and that the increased limiting effect of water on tree growth weakens the limiting effect of temperature on tree growth [29,30]. There are also other influences, such as physiological differences between tree species, different tree-ring parameters, sampling site conditions, detrending methods, etc. [31].
The Tianshan Mountains, located in arid Central Asia, are controlled by westerly circulation [32]. Its unique climatic and geographical conditions, as well as its sensitivity to climate change, make it an ideal area for studying past climate and environmental change. Previous studies have identified divergent growth of trees in the Tianshan Mountains [33,34,35,36]. However, due to environmental heterogeneity, different tree species, and altitude differences, the dynamic response of tree growth to temperature is not exactly the same as in other locations, meaning that the existing discussion of the mechanisms needs to be further explored, and the methodology for studying the divergent growth and response strategies of trees still needs to be improved. In this study, a tree-ring width chronology was established at high altitudes in the western Tianshan Mountains, showing a significant decline in recent decades. The reasons for the decline in tree-ring width need to be explained, and the mechanisms of divergent growth of Picea schrenkiana need to be fully discussed. This may provide new perspectives and opportunities for future discussions on the mechanisms of the regional divergence problem. The main research questions in this paper are as follows: (1). What are the main climatic factors limiting the radial growth of Picea schrenkiana at high altitudes in the western Tianshan Mountains? (2). Is the relationship between climatic factors and tree-ring width stable? (3). What are the causes or mechanisms of divergence between tree growth and climatic factors? These include changes in climate factors (e.g., temperature, precipitation, relative humidity, etc.) and changes in the background of atmospheric circulation.
2. Materials and Methods
2.1. Study Area and Sampling Site
The study area is located on the southern slope of the western Tianshan Mountains in East Central Asia, and the main ridge runs from northeast to southwest. The climate is mainly controlled by the midlatitude westerly circulation and partly by the Indian monsoon [32]. Water vapour sources are more abundant and complex, with contributions from the North Atlantic, the Arctic Ocean, and the Indian Ocean [37]. The sampling site (80.33° E, 41.74° N, 2760–3000 m a.s.l., Figure 1) is near the upper limit of the forest, within the Tomur National Nature Reserve of Xinjiang, China; the highest peak (Tomur Peak) is in the Tianshan Mountains. The reserve’s topography is high in the north and low in the south, with a large difference in elevation [38]. There are many glaciers in the reserve. The glacial activity makes it the source of many inland rivers and an important water supply area in Xinjiang [38]. The forest is sparse and has low canopy density on the shady slope. Schrenk spruce (Picea schrenkiana), is a shallow-rooted conifer that prefers moist and shady habitats and is widespread in the Tianshan Mountains, where it plays an important role in water conservation, climate regulation, and biodiversity conservation. It often grows to a height of 30–40 m and a diameter of 70–100 cm. The samples are designated as the “TGLK” group.
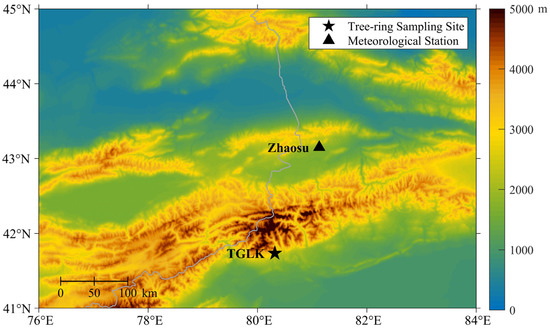
Figure 1.
Map showing the location of the sampling site (Tagelake, TGLK) and the nearby Zhaosu meteorological station.
2.2. Tree-Ring-Width Chronology Development
Samples were collected in July 2019, with two cores extracted from each tree at breast height (1–1.5 m) in different directions using 10-mm increment borers. All tree-ring cores were dried naturally and then polished with sandpaper of different meshes in the laboratory. After the removal of some missing and decayed cores, a total of 38 cores were included in the establishment of tree-ring width chronology (Table 1). Tree-ring width (TRW) values were measured by using the LINTAB system with a resolution of 0.01 mm. The COFFCHA program was then utilised for quality control of the cross-dating [39]. TRW data were detrended by fitting linear regression or negative exponential curves to remove nonclimatic trends. Finally, the standardised chronology was established using a biweighted robust mean method by using the ARSTAN program [2]. Statistical parameters are used to evaluate the reliability and quality of the chronology, including mean sensitivity (MS), mean correlation (R1: all series, R2: within trees, R3: between trees), signal-to-noise ratio (SNR), percentage of variance in the first eigenvector (PC1), subsample signal strength (SSS) and expressed population signal (EPS) [1,2,3,11].

Table 1.
Statistical characteristics for the standardised tree-ring width Chronology.
2.3. Meteorological Data and Statistical Methods
For this study, instrumental data from the nearby high-altitude Zhaosu meteorological station (81.13° E, 43.15° N, 1851.0 m a.s.l., Figure 1) were obtained from the National Meteorological Science Data Center (http://data.cma.cn/ (accessed on 12 January 2023), Figure 2), including mean temperature (Tmean), mean maximum temperature (Tmax), mean minimum temperature (Tmin), total precipitation (PR), and mean relative humidity (RH). Due to the lagged response of tree growth to climate, monthly climate data from October of the previous year to September of the current year were used to examine climate–growth relationships. In addition, volumetric soil water (VSW), total evaporation (TE), and snowmelt (SML) from the ERA5-Land Reanalysis dataset [40] are also included as important factors considering moisture conditions, with the first two variables serving as approximately equivalent proxies for P and RH. At high altitudes, soil water is mainly recharged by atmospheric precipitation, snowmelt, and seasonal thawing of frozen soils. TE is the accumulated amount of water that has evaporated from the Earth’s surface into the atmosphere, including vegetation transpiration, soil evaporation, evaporation from the canopy interception reservoir, etc. ERA5-land is a state-of-the-art global reanalysis dataset for land applications that was released by the European Centre for Medium-Range Weather Forecasts (ECMWF, with 0.1° × 0.1° grids for 1954–2016 AD). The North Atlantic Oscillation (NAO), the Arctic Oscillation (AO), and the Eurasian Zonal Circulation index (CI) were used to measure the variability of atmospheric circulation in the mid-latitudes of the northern Hemisphere. The first two indices are taken from the KNMI Climate Explorer (https://climexp.knmi.nl/, accessed on 12 January 2023). CI is represented by the difference in 500 hPa geopotential height between 45° N and 65° N and then averaged over 0° E–150° E.
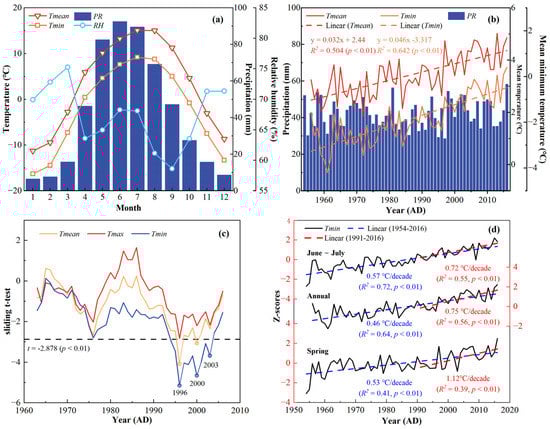
Figure 2.
(a) Monthly climate variations in temperature, precipitation, and relative humidity. (b) Annual climate variations in temperature and precipitation (1954–2016 AD). (c) An abrupt change in Tmean, Tmax, and Tmin was detected by the sliding t-test. The dashed lines indicate the significance value at the 0.01 level. (d) Variations of Tmin in different seasons (1954–2016 AD).
Pearson correlation analysis was performed to explore the association between TRW and climatic variables, and z-scores standardisation was used to improve the comparability of different data. A sliding t-test was used to detect the abrupt changes in temperature, based on whether the mean difference between two subsets exceeds a given significance level [41]. First-order difference processing, which is the difference between two adjacent terms, was applied to the raw sequence to avoid the influence of long-term trends and to reveal high-frequency variability. Commonality analysis (CA), based on a multiple linear regression relationship between independent variables and dependent variables, was used to disentangle the effects of multiple factors on TRW in the R statistical programming environment. The advantages of CA are that it can calculate the relative contribution of each predictor and can also give the common contribution between any combination of predictors [42].
3. Results
3.1. Tree-Ring Width Chronology and Climate Change
The standardised TRW chronology, the sample size, and the SSS are shown in Figure 3a, which retains both high-frequency and low-frequency climate signals [2]. The credible starting year of the TRW chronology is 1729, according to the SSS > 0.85 criterion [11]. Table 1 lists some of the statistical parameters of the chronology, where high mean sensitivity and high signal-to-noise ratio mean that the chronology is more sensitive to climate change and contains richer climate signals. High correlation coefficients (R1, R2, R3) indicate more consistent changes between samples. A high expressed population signal indicates that the chronology represents the population signal with sufficient quality. In addition, the TRW index has an extremely intriguing trajectory; it increased significantly after the 1950s, reached a peak in 1998, and then fell into an abrupt decline (Figure 3).
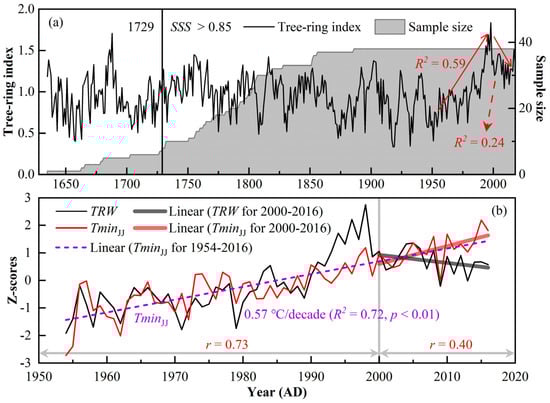
Figure 3.
(a) TRW chronology during 1635–2018 AD and the sample size. (b) Comparisons between the TRW index (black line) and the mean minimum temperature from June to July (TminJJ, red line) during 1954–2016 AD.
Observational records show that Tmean for 1954–2016 AD ranges from −11.3 °C in January to 15.1 °C in July, and PR is 508.9 mm, with May to September accounting for about 74.8% of PR (Figure 2a). Tmean was 3.3 °C with a significantly increasing long-term trend of 0.32 °C/decade (p < 0.01, Figure 2b) over the last 63 years, while PR does not. Tmin increases at a rate of 0.46 °C/decade (p < 0.01, Figure 2b), which is even higher than Tmean. Figure 2c shows the abrupt temperature changes in 1996, 2000, and 2003, after performing a sliding t-test on the temperatures. Given the consistent variation between the TRW index and temperature, the climate data were divided into two periods based on the change point of 2000; the first period was 1954–2000, which was followed by 2000–2016 for the subsequent response analysis.
3.2. Divergent Climate Responses
Correlation analysis indicated a strong and significant positive correlation between TRW and temperature, with the highest correlation with Tmin in June–July (r = 0.74, p < 0.01) but no significant relationship with PR and RH (Figure 4a,c). When PR and RH were replaced by VSW and TE, respectively, TRW had significant correlations with water-related variables (i.e., VSW and TE, Figure 4a,c), with a significant positive correlation with VSW throughout the year, reaching −0.62 (p < 0.01) with TE in June–August (Figure 4a,c). After performing the first-order difference on the raw series, TRW remained significantly related to Tmin and TE in June–July (Figure 4b,d) and had no significant relationship with PR (except February) and RH (Figure 4b,d); however, the relationship with VSW was apparently weakened in Figure 4b. This suggests that TRW at high altitudes is controlled more by temperature than by water conditions.
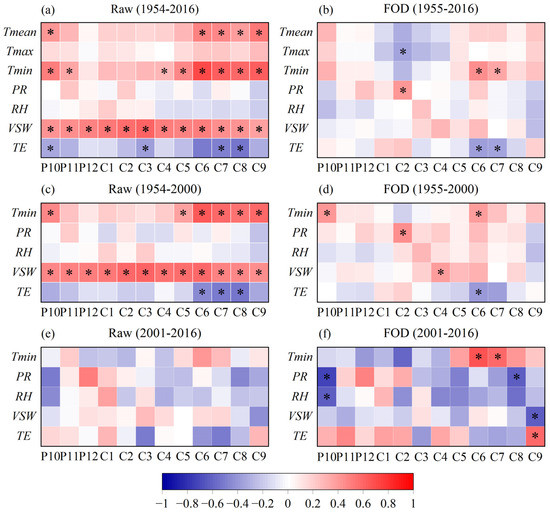
Figure 4.
Heat map of correlation coefficients between the TRW index and climate variables (Tmean, Tmax, Tmin, PR, VSW, TE), including correlation coefficients between the raw series and first-order difference (FOD) series at different periods. P10–C9 represents October of the previous year to September of the current year. The * represents the correlation coefficient exceeding the 99% significance level.
There is a strange trajectory in Figure 3b where both TRW and Tmin in June–July maintain similar increasing trends before 2000; after 2000, however, these trends sharply decreased in TRW and had a continuous upward tendency in June–July Tmin at a high rate of 0.91 °C/decade (p < 0.01). The correlation coefficient between TRW and June–July Tmin decreased from 0.73 (n = 47, p < 0.01, Figure 3b and Figure 4c) during 1954–2000 AD to 0.40 (n = 16, p = 0.13, Figure 3b and Figure 4e) during 2001–2016 AD. However, the change in the correlation coefficient between TRW and June–July Tmin at high frequencies was stronger, increasing from 0.48 (n = 47, p < 0.01, Figure 4d) during 1954–2000 AD to 0.81 (n = 16, p < 0.01, Figure 4f) during 2001–2016 AD. The above results imply two things: first, a divergent response of TRW to June–July Tmin occurs in recent decades, and second, Tmin is still the main climatic factor controlling tree-ring growth at high frequencies and the main factor is not changed by the “divergence problem”. Moreover, PR in February and VSW in April reached a significant positive correlation with TRW at high frequencies in 1955–2000 AD, with correlation coefficients of 0.45 (p < 0.01) and 0.40 (p < 0.01, Figure 4d), respectively. From 2001 to 2016, TRW at high frequencies still maintained a significant positive correlation with PR from November of the previous year to February of the current year (r = 0.53, n = 16, p < 0.05) and showed a significant negative correlation with PR in August and VSW in September at the end of the growing season (Figure 4f).
3.3. Contribution of Climatic Variables to TRW
The CA presented the relative contribution of climatic factors to TRW in different periods. Tmin, PR, and RH explained 58.03% of the total variance in TRW during 1954–2016 AD, with Tmin dominating the explained variance, and its pure effect accounting for 95.08% of the total explained variance (Figure 5a). The pure effect or unique contribution of Tmin to TRW was as high as 99.74% during 1954–2000 (Figure 5b), but after 2000, this contribution was reduced to 18.57% due to the abrupt climate change; the unique contribution of PR to TRW and the common contribution of PR and Tmin to TRW increased, accounting for 55.90% and 19.59% of the total explained variance, respectively (Figure 5c). It is also noted that the climate response pattern at high frequencies (Figure 5d–f) is still similar to that of the raw series (Figure 5a–c). The pure contribution of Tmin decreased from 55.51% for 1955–2000 AD (Figure 5e) to 39.90% for 2001–2016 AD (Figure 5f). The common contribution of Tmin and PR increased from 28.58% for 1955–2000 AD (Figure 5e) to 37.8% for 2001–2016 AD, and the common contribution of Tmin and RH also reached 20.64% (Figure 5f).
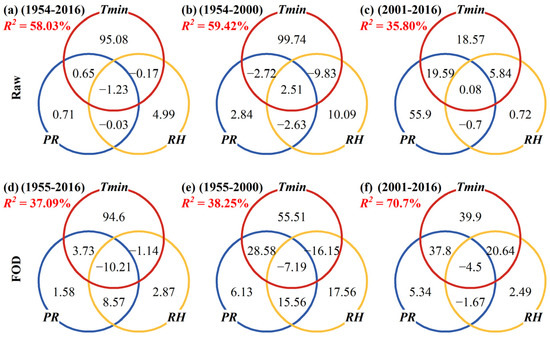
Figure 5.
The proportion of contribution (%, the numbers inside the Venn diagram) of Tmin, PR and RH in explaining the variance of TRW at different periods by using commonality analysis. (a–c): Raw data; (d–f): First-order difference (FOD). R2 is the variance of TRW explained by Tmin, PR and RH.
When PR and RH were replaced by VSW and TE, CA revealed some differences in the climate response patterns. These differences reflect the significant contribution of moisture conditions to TRW before the abrupt climate change, both in the raw series and in the first-order difference series (Figure 6). The similarity was that, after the abrupt change, the unique contribution of Tmin decreased, and the common contribution of the interactive effect between moisture and Tmin increased. For example, the pure contribution of VSW increased from 4.52% for 1954–2000 AD (Figure 6b) to 21.16% for 2001–2016 AD (Figure 6c) and the unique effect of TE was from 1.19% for 1954–2000 AD (Figure 6b) to 54.11% for 2001–2016 AD (Figure 6c). Finally, it was found that the explained variance of climatic factors to TRW decreased in the raw sequences after the abrupt climate change (Figure 5b,c and Figure 6b,c), but increased at high frequencies (Figure 5e,f and Figure 6e,f).
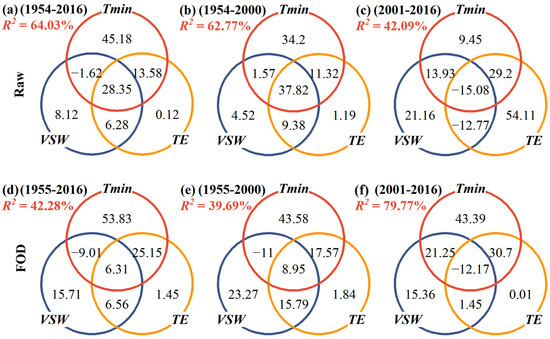
Figure 6.
The proportion of contribution (%, the numbers inside the Venn diagram) of Tmin, VSW and TE in explaining the variance of TRW at different time periods by using commonality analysis. (a–c): Raw data; (d–f): First-order difference (FOD). R2 is the variance of TRW explained by Tmin, VSW and TE.
4. Discussion
4.1. Differences in TRW Response to Climatic Conditions
With global warming, the relationship between tree growth and climate is changing [26,27,29,30,33,34,35,36,43,44,45]. The results of the correlation analysis in this study showed that tree growth at high altitudes in the Tianshan Mountains is mainly controlled by Tmin, which is manifested by a significant positive correlation between tree growth and Tmin in the rapid growth stage of trees from June to July (Figure 4, Figure 5 and Figure 6). As Tmin continues to rise, first, it is conducive to enhanced photosynthesis, providing more energy and nutrients for tree growth [1]; second, a longer growing season due to high temperatures is expected to produce wider tree rings [46]. Temperature regulates the tree growth cycle by controlling cambium activity. If the ambient temperature or cumulative temperature is higher than the minimum threshold temperature for cambium activity, the onset of cambium activity is brought forward, and the growing season will be prolonged [19,47]. However, if high temperatures cause drought stress in the early growing season, this will exacerbate water deficit of trees and slow tree growth [48].
In addition, the effect of elevation on the response of tree growth to temperature is noteworthy. Jiao et al. (2022) found a significant negative correlation between Tmin in the growing season and tree rings of Schrenk spruce at an elevation of about 1650 m in the western Tianshan Mountains, suggesting that the climate–growth relationship shifts from tree growth being promoted by high temperatures at high elevations to tree growth being inhibited by high temperatures at middle elevations. This may occur because the reduction in radial growth of trees is caused by drought stress due to high temperatures and excessive nutrient consumption due to increased respiration [25]. Our study also showed no significant correlation between TRW and PR at high altitudes, but TRW has a significant relationship with VSW (Figure 4 and Figure 6). Although this may be a trend correlation (Figure 4b), it still indicates that moisture conditions are the basis for tree growth. When TRW is not related to PR, VSW may be a better variable than PR to measure the effect of moisture conditions on tree growth. In recent decades, the climate–growth relationship has quietly changed, as evidenced by the decreasing proportion of temperature contribution to TRW and the increasing proportion of moisture contribution after the abrupt climate change (Figure 5 and Figure 6). In other words, the climatic response pattern of tree growth has shifted from a pure temperature limitation to a collaborative temperature–moisture limitation. The attitude or response pattern of tree growth towards moisture conditions changed from “maintaining basic growth” to “intense demand”. However, this shift in response pattern does not completely alter the dominance of Tmin limiting tree growth, with Tmin still playing the role it should. This result differs from Schreel et al. (2021) [49].
4.2. What Causes the Divergent Response of TRW to Climate?
The results of CA and the changes at high frequencies cannot explain the long-term decline in TRW since 2000 and further analysis at low frequencies is required. After 21 years of low-pass filtering, the long-term decline in TRW was basically consistent with the trend of moisture conditions over the last two decades, but the timing of the inflexion point at which each variable begins to decline is not the same (Figure 7). The inflexion point for the decline in TRW is roughly the same as that for the decline in VSW, both before the decline in PR (Figure 7).
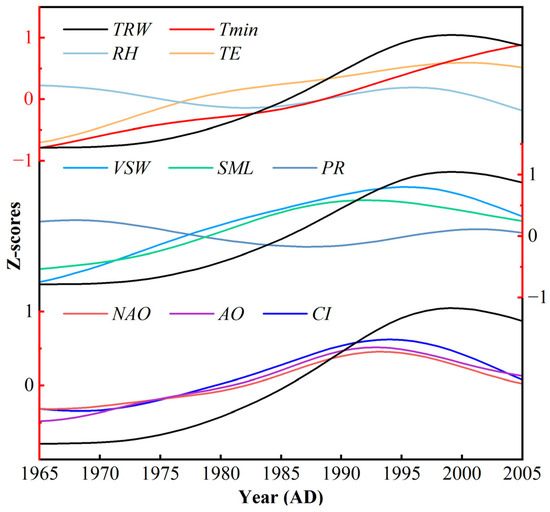
Figure 7.
Comparisons between TRW (black line) and climate factors (Tmin, PR, RH, TE, VSW, SML) and atmospheric circulation indices (NAO, AO, CI) for 1954–2016 AD. All series were normalised and then subjected to a 21-year low-pass filter.
It is well known that soil water is mostly recharged by atmospheric precipitation, but at high altitudes, snowmelt and seasonal frozen soil can provide more water than PR both before and at the beginning of the growing season. Therefore, the variable of spring and summer snowmelt was introduced, and the inflexion point of snowmelt was found to be around 1990, even before that of VSW and TRW (Figure 7). Subsequently, this study reassessed the variability of Tmin in spring since 1990 and found that it increased at a high rate of 1.12°C/decade (p < 0.01, Figure 2d), much higher than June–July Tmin and annual Tmin. Thus, it is reasonable to assume that the rapid rise of spring Tmin intensifies snowmelt, and that a large amount of snowmelt continuously supplies soil water, leading to an increase in tree radial growth. However, with the continuous reduction in snow cover and no significant increase in precipitation, the soil water supply was limited, causing the trees to suffer from water restrictions. The situation worsened over time and eventually resulted in the decrease in the radial growth of the trees.
Previous studies have shown that, at high altitudes in the western Tien Shan [36,44,45] and western Kunlun Mountains [50,51], Picea schrenkiana is mainly regulated by Tmin of the growing season, which promotes tree growth. At middle and low altitudes in Central Asia, moisture is the main limiting factor for tree growth [34,52,53]. The precipitation signal or drought signal was significantly positively correlated with TRW, but the temperature signal showed a negative correlation with TRW [54]. Furthermore, in the Mediterranean region, the post-1980s decline of larch over the last 20 years has also been attributed to drought stress, with the duration of local snow cover playing an important role [29]. In the Great Xing’an Mountains of China, Larix gmelinii [30] and Pinus sylvestris var. Mongolica [55] have also shown a decline in tree growth because the effective soil water content has reduced because of permafrost degeneration. With global warming, water deficit or drought stress is gradually expanding to higher altitudes and is likely to be a major factor influencing the shift in climate response patterns of trees.
4.3. Influence of the Atmospheric Circulation
The hydroclimate variability in the western Tianshan is controlled by the westerly circulation and the NAO. Studies have also confirmed that the NAO can affect climate change in mid-latitude Eurasian through atmospheric teleconnection [56,57,58]. The comparisons in Figure 7 were performed between TRW and three circulation indices (NAO, AO, CI) for 1954–2016 AD. A similar trajectory was found for all three indices, with a downward trend after 1990. This decline has also been observed in other studies [59,60,61]; it is similar to the long-term trend of the moisture-related variables and precedes the decline of these variables and TRW. In addition, the relationship between the NAO and PR over mid-latitude East Asia weakened rapidly after the 1980s; after that, the correlation between the two was no longer significant [56]. This implied that the influence of NAO on remote areas was weakening. After the 1990s, the weakening of the Eurasian midlatitude circulation reduced the water vapour fluxes from the North Atlantic Ocean as well as from the west of Central Asia, thereby affecting the hydroclimatic variations in the study area [56,57]. Although the NAO was in a positive phase during this period, the decline of the NAO diminished the meridional pressure gradients in the northern Hemisphere and weakened the intensity of the westerly circulation in the middle and upper troposphere, thus reducing the influence of the North Atlantic Ocean on remote areas, such as Central Asia and East Asia [56,62]. Changes in the climatic background state, i.e., the weakening of the westerly circulation, have altered the changes in moisture-related climatic elements, which together with the continued increase in temperature have resulted in divergent responses of tree growth to climate at the end of the 20th century (Figure 2, Figure 3 and Figure 7).
5. Conclusions
The radial growth of trees is controlled by local climatic conditions and large-scale atmospheric circulation. When the climatological background state changes, tree growth must respond to the climate accordingly. In this study, the growth of Schrenk spruce at high altitudes is mainly regulated by Tmin in June–July in the western Tianshan Mountains. The energy and nutrients accumulated by photosynthesis and the extension of the growing season together facilitated the tree radial growth due to the increase in Tmin. Since the 1990s, the westerly circulation in the Northern Hemisphere has been in a background state of long-term weakening, resulting in a reduction in water vapour transport from the North Atlantic Ocean. The rapid and continuous melting of snow cover, due to warmer spring temperatures, reduced and then limited soil water availability. As temperatures continued to rise, the reduction in soil moisture exacerbated the water stress on tree growth. Finally, the combination of temperature and water stress has slowed down the radial growth of trees over the last two decades and the divergence problem between TRW and Tmin has occurred. During this time, the growth strategy of trees in response to climate change altered from a pure temperature limitation to a collaborative temperature–moisture limitation. However, temperature as the main limiting factor did not change as a result of the change in growth strategy. If temperatures continue to rise in the future and water supply is not effectively replenished, the growth of trees at high altitudes will be further limited, making it necessary to investigate the effects of warming-induced drought on forest ecosystems at high altitudes.
Author Contributions
Conceptualisation, methodology, software, writing-original draft, T.L.; supervision, project administration, funding acquisition, Y.L.; Supervision, methodology, editing, Q.C.; chart drawing, data curation, X.D.; Investigation, data curation, P.L.; Funding acquisition, M.R.; Investigation, Y.Y. All authors have read and agreed to the published version of the manuscript.
Funding
The study was financially supported by grants from the National Natural Science Foundation of China (U1803245), the second Tibetan Plateau Scientific Expedition and Research Program (STEP, 2019QZKK0101), the Strategic Priority Research Program of the Chinese Academy of Sciences (XDB40010300, XDA23070202) and the State Key Laboratory of Loess and Quaternary Geology, Institute of Earth Environment, CAS (SKLLQG2141, SKLLQG2022).
Data Availability Statement
Meteorological data are included within the article and all data sources are mentioned.
Acknowledgments
We sincerely appreciate Congxi Fang for their support on software. We are also grateful to Tongwen Zhang, Qiang Li, Mao Ye, Linlin Cui and Youping Chen for their assistance with sample collection.
Conflicts of Interest
The authors declare no conflict of interest.
References
- Fritts, H.C. Tree Rings and Climate; Academic Press: London, UK; New York, NY, USA, 1976. [Google Scholar]
- Cook, E.R. A Time Series Analysis Approach to Tree-ring Standardization (Dendrochronology, Forestry, Dendroclimatology, Autoregressive Process). Ph.D. Thesis, University of Arizona, Tucson, Arizona, USA, 1985. [Google Scholar]
- Cook, E.R.; Kairiukstis, L.A. Methods of Dendrochronology: Applications in the Environmental Sciences; Kluwer Academic Publishers: Dordrecht, The Netherlands, 1990. [Google Scholar]
- Liu, Y.; An, Z.S.; Linderholm, H.W.; Chen, D.L.; Song, H.M.; Cai, Q.F.; Sun, J.Y.; Tian, H. Annual temperatures during the last 2485 years in the mid-eastern Tibetan Plateau inferred from tree rings. Sci. China Ser. D Earth Sci. 2009, 52, 348–359. [Google Scholar] [CrossRef]
- Liu, Y.; Li, C.Y.; Sun, C.F.; Song, H.M.; Li, Q.; Cai, Q.F.; Liu, R.S. Temperature variation at the low-latitude regions of East Asia recorded by tree rings during the past six centuries. Int. J. Climatol. 2020, 40, 1561–1570. [Google Scholar] [CrossRef]
- Yang, B.; Qin, C.; Bräuning, A.; Osborn, T.J.; Trouet, V.; Ljungqvist, F.C.; Esper, J.; Schneider, L.; Griessinger, J.; Büntgen, U.; et al. Long-term decrease in Asian monsoon rainfall and abrupt climate change events over the past 6700 years. Proc. Natl. Acad. Sci. USA 2021, 118, e2102007118. [Google Scholar] [CrossRef] [PubMed]
- Wang, W.Z.; Liu, X.H.; Xu, G.B.; Treydte, K.; Shao, X.M.; Qin, D.H.; Wang, G.X.; McDowell, N.G. CO2 Fertilization Confounds Tree-Ring Records of Regional Hydroclimate at Northeastern Qinghai-Tibetan Plateau. Earth Space Sci. 2019, 6, 730–740. [Google Scholar]
- Wang, W.Z.; McDowell, N.G.; Liu, X.H.; Xu, G.B.; Wu, G.J.; Zeng, X.M.; Wang, G.X. Contrasting growth responses of Qilian juniper (Sabina przewalskii) and Qinghai spruce (Picea crassifolia) to CO2 fertilization despite common water-use efficiency increases at the northeastern Qinghai–Tibetan plateau. Tree Physiol. 2021, 41, 992–1003. [Google Scholar] [CrossRef]
- Li, J.B.; Xie, S.P.; Cook, E.R.; Chen, F.H.; Shi, J.F.; Zhang, D.D.; Fang, K.Y.; Gou, X.H.; Li, T.; Peng, J.F.; et al. Deciphering Human Contributions to Yellow River Flow Reductions and Downstream Drying Using Centuries-Long Tree Ring Records. Geophys. Res. Lett. 2019, 46, 898–905. [Google Scholar] [CrossRef]
- Liu, Y.; Song, H.M.; An, Z.S.; Sun, C.F.; Trouet, V.; Cai, Q.F.; Liu, R.S.; Leavitt, S.W.; Song, Y.; Li, Q.; et al. Recent anthropogenic curtailing of Yellow River runoff and sediment load is unprecedented over the past 500 y. Proc. Natl. Acad. Sci. USA 2020, 117, 18251–18257. [Google Scholar] [CrossRef]
- Wigley, T.M.L.; Briffa, K.R.; Jones, P.D. On the average value of correlated time series, with applications in Dendroclimatology and Hydrometeorology. J. Clim. Appl. Meteorol. 1984, 23, 201–213. [Google Scholar] [CrossRef]
- Leavitt, S.W.; Lone, A. Seasonal stable-carbon isotope variability in tree rings: Possible paleoenvironmental signals. Chem. Geol. 1991, 87, 59–70. [Google Scholar] [CrossRef]
- McCarroll, D.; Loader, N.J. Stable isotopes in tree rings. Quat. Sci. Rev. 2004, 23, 771–801. [Google Scholar] [CrossRef]
- Roden, J.S.; Lin, G.; Ehleringer, J.R. A mechanistic model for interpretation of hydrogen and oxygen isotope ratios in tree-ring cellulose. Geochim. Cosmochim. Acta 2000, 64, 21–35. [Google Scholar] [CrossRef]
- Zeng, X.M.; Liu, X.H.; Treydte, K.; Evans, M.N.; Wang, W.Z.; An, W.L.; Sun, W.Z.; Xu, G.B.; Wu, G.J.; Zhang, X.W. Climate signals in tree-ring δ18O and δ13C from southeastern Tibet: Insights from observations and forward modelling of intra- to interdecadal variability. New Phytol. 2017, 216, 1104–1118. [Google Scholar] [CrossRef] [PubMed]
- Babushkina, E.A.; Belokopytova, L.V.; Zhirnova, D.F.; Vaganov, E.A. Siberian spruce tree ring anatomy: Imprint of development processes and their high-temporal environmental regulation. Dendrochronologia 2019, 53, 114–124. [Google Scholar] [CrossRef]
- Liang, W.; Heinrich, I.; Simard, S.; Helle, G.; Linan, I.D.; Heinken, T. Climate signals derived from cell anatomy of Scots pine in NE Germany. Tree Physiol. 2013, 33, 833–844. [Google Scholar] [CrossRef]
- Pritzkow, C.; Heinrich, I.; Grudd, H.; Helle, G. Relationship between wood anatomy, tree-ring widths and wood density of Pinus sylvestris L. and climate at high latitudes in northern Sweden. Dendrochronologia 2014, 32, 295–302. [Google Scholar] [CrossRef]
- Zhu, L.J.; Li, Z.S.; Wang, X.C. Anatomical characteristics of xylem in tree rings and its relationship with environments. Chin. J. Plant. Ecol. 2017, 41, 238–251. (In Chinese) [Google Scholar]
- Aitken, S.N.; Yeaman, S.; Holliday, J.A.; Wang, T.L.; Curtis-McLane, S. Adaptation, migration or extirpation: Climate change outcomes for tree populations. Evol. Appl. 2008, 1, 95–111. [Google Scholar] [CrossRef]
- Gou, X.H.; Zhang, F.; Deng, Y.; Ettl, G.J.; Yang, M.X.; Gao, L.L.; Fang, K.Y. Patterns and dynamics of tree-line response to climate change in the eastern Qilian Mountains, northwestern China. Dendrochronologia 2012, 30, 121–126. [Google Scholar] [CrossRef]
- Felde, V.A.; Kapfer, J.; Grythnes, J.A. Upward shift in elevational plant species ranges in Sikkilsdalen, central Norway. Ecography 2012, 35, 922–932. [Google Scholar] [CrossRef]
- He, X.; Burgess, K.S.; Gao, L.M.; Li, D.Z. Distributional responses to climate change for alpine species of Cyananthus and Primula endemic to the Himalaya-Hengduan Mountains. Plant Divers. 2019, 41, 26–32. [Google Scholar] [CrossRef]
- Awang, Z.L.R.; Sun, J.P.; Zhang, S.R.; Xia, L.; Wang, S.P. Research advance on the key factors affecting the migration of alpine grassland plants to high altitude or high latitude in Qinghai-Tibet Plateau. Chin. J. Ecol. 2021, 40, 1521–1529. (In Chinese) [Google Scholar]
- D’Arrigo, R.; Wilson, R.; Liepert, B.; Cherubini, P. On the ‘Divergence Problem’ in Northern Forests: A review of the tree-ring evidence and possible causes. Glob. Planet. Chang. 2008, 60, 289–305. [Google Scholar] [CrossRef]
- D’Arrigo, R.; Kaufmann, R.K.; Davi, N.; Jacoby, G.C.; Laskowski, C.; Myneni, R.B.; Cherubini, P. Thresholds for warming-induced growth decline at elevational tree line in the Yukon Territory, Canada. Glob. Biogeochem. Cycles 2004, 18, GB3021. [Google Scholar] [CrossRef]
- Hart, S.J.; Laroque, C.P. Searching for thresholds in climate-radial growth relationships of Engelmann spruce and subalpine fir, Jasper National Park, Alberta, Canada. Dendrochronologia 2013, 31, 9–15. [Google Scholar] [CrossRef]
- Kramer, P.J.; Kozlowski, T.T. Physiology of Woody Plants; Academic Press: New York, NY, USA, 1979. [Google Scholar]
- Pellizzari, E.; Camarero, J.J.; Gazol, A.; Granda, E.; Shetti, R.; Wilmking, M.; Moiseev, P.; Pividori, M.; Carrer, M. Diverging shrub and tree growth from the Polar to the Mediterranean biomes across the European continent. Glob. Chang. Biol. 2017, 23, 3169–3180. [Google Scholar] [CrossRef] [PubMed]
- Bai, X.P.; Chang, Y.X.; Zhang, X.L.; Ma, Y.J.; Wu, T.; Li, J.X.; Chen, Z.J. Impacts of rapid warming on radial growth of Larix gmelinii on two typical micro-topographies in the recent 30 years. Chin. J. Appl. Ecol. 2016, 17, 3853–3861. (In Chinese) [Google Scholar]
- Gai, X.R.; Yu, D.P.; Wang, S.L.; Jia, X.; Wu, J.; Zhou, W.M.; Zhou, L.; Dai, L.M. A review of formation mechanism on the ‘divergence problem’ of tree growth-climate relationship. Chin. J. Ecol. 2017, 36, 3273–3280. (In Chinese) [Google Scholar]
- Liu, Y.Z.; Wu, C.Q.; Jia, R.; Huang, J.P. An overview of the influence of atmospheric circulation on the climate in arid and semi-arid region of Central and East Asia. Sci. China-Earth Sci. 2018, 61, 1183–1194. [Google Scholar] [CrossRef]
- Jiao, L.; Jiang, Y.; Zhang, W.T.; Wang, M.C.; Zhang, L.N.; Zhao, S.D. Divergent responses to climate factors in the radial growth of Larix sibirica in the eastern Tianshan Mountains, northwest China. Trees-Struct. Funct. 2015, 29, 1673–1686. [Google Scholar] [CrossRef]
- Jiao, L.; Jiang, Y.; Zhang, W.T.; Wang, M.C.; Wang, S.J.; Liv, X.R. Assessing the stability of radial growth responses to climate change by two dominant conifer trees species in the Tianshan Mountains, northwest China. For. Ecol. Manag. 2019, 433, 667–677. [Google Scholar] [CrossRef]
- Jiao, L.; Wang, S.J.; Chen, K.; Liu, X.P. Dynamic response to climate change in the radial growth of Picea schrenkiana in western Tien Shan, China. J. For. Res. 2022, 33, 147–157. [Google Scholar] [CrossRef]
- Qin, L.; Liu, K.X.; Shang, H.M.; Zhang, T.W.; Yu, S.L.; Zhang, R.B. Minimum temperature during the growing season limits the radial growth of timberline Schrenk spruce (P. schrenkiana). Agric. For. Meteorol. 2022, 322, 109004. [Google Scholar] [CrossRef]
- Jiang, J.; Zhou, T.J.; Chen, X.L.; Wu, B. Central Asian precipitation shaped by the tropical Pacific decadal variability and the Atlantic multidecadal variability. J. Clim. 2021, 34, 7541–7553. [Google Scholar] [CrossRef]
- Zhao, J.Q.; Sabit, M.; Aimaiti, M.; Yimier, N. Changing rates of glacier in Tomur National Nature Reserve from 1992 to 2017. Arid Zone Res. 2020, 37, 1079–1086. (In Chinese) [Google Scholar]
- Holmes, R.L. Computer-assisted quality control in tree-ring dating and measurement. Tree-Ring Bull. 1983, 43, 69–78. [Google Scholar]
- Muñoz-Sabater, J.; Dutra, E.; Agusti-Panareda, A.; Albergel, C.; Arduini, G.; Balsamo, G.; Boussetta, S.; Choulga, M.; Harrigan, S.; Hersbach, H.; et al. ERA5-Land: A state-of-art global reanalysis dataset for land applications. Earth Syst. Sci. Data 2021, 13, 4349–4383. [Google Scholar] [CrossRef]
- Zhang, S.H.; Qi, G.Z.; Su, K.; Zhou, L.Y.; Bai, H.Y. Research on Sequence Construction and Characteristics Diagnosis of Droughts and Floods in the Qinling Mountains of China From 1850 to 1959. Front. Earth Sci. 2022, 10, 860750. [Google Scholar] [CrossRef]
- Nimon, K.; Lewis, M.; Kane, R.; Haynes, R.M. An R package to compute commonality coefficients in the multiple regression case: An introduction to the package and a practical example. Behav. Res. Methods 2008, 40, 457–466. [Google Scholar] [CrossRef] [PubMed]
- Zhang, Y.X.; Wilmking, M. Divergent growth responses and increasing temperature limitation of Qinghai spruce growth along an elevation gradient at the northeast Tibet Plateau. For. Ecol. Manag. 2010, 260, 1076–1082. [Google Scholar] [CrossRef]
- Yu, S.L.; Yuan, Y.J.; Wei, W.S.; Chen, F.; Zhang, T.W.; Shang, H.M.; Zhang, R.B.; Qing, L. A 352-year record of summer temperature reconstruction in the western Tianshan Mountains, China, as deduced from tree-ring density. Quat. Res. 2013, 80, 158–166. [Google Scholar] [CrossRef]
- Peng, Z.T.; Zhang, Y.D.; Zhu, L.J.; Lu, Q.G.; Mo, Q.F.; Cai, J.Q.; Guo, M.M. Divergent Tree Growth and the Response to Climate Warming and Humidification in the Tianshan Mountains, China. Forests 2022, 13, 886. [Google Scholar] [CrossRef]
- Latreille, A.; Davi, H.; Huard, F.; Pichot, C. Variability of the climate-radial growth relationship among Abies alba trees and populations along altitudinal gradients. For. Ecol. Manag. 2017, 396, 150–159. [Google Scholar] [CrossRef]
- Fonti, P.; Garcia-Gonzalez, I. Suitability of chestnut earlywood vessel chronologies for ecological studies. New Phytol. 2004, 163, 77–86. [Google Scholar] [CrossRef] [PubMed]
- Wu, X.C.; Liu, H.Y.; Wang, Y.F.; Deng, M.H. Prolonged limitation of tree growth due to warmer spring in semi-arid mountain forests of Tianshan, northwest China. Environ. Res. Lett. 2013, 8, 024016. [Google Scholar] [CrossRef]
- Schreel, J.D. Is temperature still the most limiting factor for growth in northern boreal forests? Holocene 2021, 31, 1351–1353. [Google Scholar] [CrossRef]
- Huang, R.; Zhu, H.F.; Liang, E.Y.; Asad, F.; Griessinger, J. A tree-ring-based summer (June–July) minimum temperature reconstruction for the western Kunlun Mountains since AD 1681. Theor. Appl. Climatol. 2019, 138, 673–682. [Google Scholar] [CrossRef]
- Shang, H.M.; Mamattuersun, K.; Li, H.; Yu, S.L.; Zhang, R.B.; Zhang, T.W.; Chen, F.; Lu, H.; Wei, W.S.; Yuan, Y.J. Evaluation on the Climatic Information of Tree-ring Width of Picea schrenkiana from Yarkand River Basin. Desert. Oasis. Meteorol. 2017, 11, 17–24. [Google Scholar]
- Zhang, R.B.; Yuan, Y.J.; Gou, X.H.; He, Q.; Shang, H.M.; Zhang, T.W.; Chen, F.; Ermenbaev, B.; Yu, S.L.; Qin, L.; et al. Tree-ring-based moisture variability in western Tianshan Mountains since AD 1882 and its possible driving mechanism. Agric. For. Meteorol. 2016, 218, 267–276. (In Chinese) [Google Scholar] [CrossRef]
- Zhang, T.W.; Lu, B.; Zhang, R.B.; Diushen, M.; Rysbek, S.; Bakytbek, E.; Chen, F.; Yu, S.L.; Jiang, S.X.; Zhang, H.L. A 256-year-long precipitation reconstruction for northern Kyrgyzstan based on tree-ring width. Int. J. Climatol. 2020, 40, 1477–1491. [Google Scholar] [CrossRef]
- Zhang, T.W.; Zhang, R.B.; Jiang, S.X.; Bagila, M.; Ainur, U.; Yu, S.L. On the ‘Divergence Problem’ in the Alatau Mountains, Central Asia: A Study of the Responses of Schrenk Spruce Tree-Ring Width to Climate under the Recent Warming and Wetting Trend. Atmosphere 2019, 10, 473. [Google Scholar] [CrossRef]
- Zhang, X.L.; He, X.Y.; Chen, Z.J.; Cui, M.X.; Li, N. Responses of Pinus sylvestris var. mongolica radial growth to climate warming in Great Xing’an Mountains: A case study in Mangui. Chin. J. Appl. Ecol. 2011, 22, 3101–3108. (In Chinese) [Google Scholar]
- Xu, T.T.; Shi, Z.G.; Wang, H.L.; An, Z.S. Nonstationary impact of the winter North Atlantic Oscillation and the response of mid-latitude Eurasian climate. Theor. Appl. Climatol. 2016, 124, 1–14. [Google Scholar] [CrossRef]
- Linderholm, H.W.; Seim, A.; Ou, T.H.; Jeong, J.H.; Liu, Y.; Wang, X.C.; Bao, G.; Folland, C. Exploring teleconnections between the summer NAO (SNAO) and climate in East Asia over the last four centuries—A tree-ring perspective. Dendrochronologia 2013, 31, 297–310. [Google Scholar] [CrossRef]
- Li, J.P.; Ruan, C.Q. The North Atlantic-Eurasian teleconnection in summer and its effects on Eurasian climates. Environ. Res. Lett. 2018, 13, 024007. [Google Scholar] [CrossRef]
- Li, J.P.; Wang, J.X.L. A new North Atlantic Oscillation index and its variability. Adv. Atmos. Sci. 2003, 20, 661–676. [Google Scholar]
- Folland, C.K.; Knight, J.; Linderholm, H.W.; Fereday, D.; Ineson, S.; Hurrell, J.W. The Summer North Atlantic Oscillation: Past, Present, and Future. J. Clim. 2009, 22, 1082–1103. [Google Scholar] [CrossRef]
- Velichkova, T.; Kilifarska, N. Lower Stratospheric Ozone’s Influence on the Nao Climatic Mode. C. R. Acad. Bulg. Sci. 2019, 72, 219–225. [Google Scholar]
- Hurrell, J.W. Decadal Trends in the North-Atlantic Oscillation-Regional Temperatures and Precipitation. Science 1995, 269, 676–679. [Google Scholar] [CrossRef] [PubMed]
Disclaimer/Publisher’s Note: The statements, opinions and data contained in all publications are solely those of the individual author(s) and contributor(s) and not of MDPI and/or the editor(s). MDPI and/or the editor(s) disclaim responsibility for any injury to people or property resulting from any ideas, methods, instructions or products referred to in the content. |
© 2023 by the authors. Licensee MDPI, Basel, Switzerland. This article is an open access article distributed under the terms and conditions of the Creative Commons Attribution (CC BY) license (https://creativecommons.org/licenses/by/4.0/).