Article

Hydrothermal Conditions in Deep Soil Layer Regulate the Interannual Change in Gross Primary Productivity in the Qilian Mountains Area, China

Key Laboratory of Western China’s Environmental Systems (Ministry of Education), College of Earth and Environmental Sciences, Lanzhou University, Lanzhou 730030, China
*
Author to whom correspondence should be addressed.
Forests 2023, 14(12), 2422; https://doi.org/10.3390/f14122422
Submission received: 14 November 2023 / Revised: 11 December 2023 / Accepted: 11 December 2023 / Published: 12 December 2023
(This article belongs to the Section Forest Soil)

Abstract

:
The variability in soil hydrothermal conditions generally contributes to the diverse distribution of vegetation cover types and growth characteristics. Previous research primarily focused on soil moisture alone or the average values of soil hydrothermal conditions in the crop root zone (0–100 cm). However, it is still unclear whether changes in gross primary productivity (GPP) depend on the hydrothermal conditions at different depths of soil layers within the root zone. In this study, the soil hydrothermal conditions from three different layers, surface layer 0–7 cm (Level 1, L1), shallow layer 7–28 cm (Level 2, L2), and deep layer 28–100 cm (Level 3, L3) in the Qilian Mountains area, northwestern China, are obtained based on ERA5-Land reanalysis data. The Sen-MK trend test, Pearson correlation analysis, and machine learning algorithm were used to explore the influence of these three soil hydrothermal layers on GPP. The results show that soil moisture values increase with soil depth, while the soil temperature values do not exhibit a stratified pattern. Furthermore, the strong correlation between GPP and deep soil hydrothermal conditions was proved, particularly in terms of soil moisture. The Random Forest feature importance extraction revealed that deep soil moisture (SM-L3) and surface soil temperature (ST-L1) are the most influential variables. It suggests that regulations of soil hydrothermal conditions on GPP may involve both linear and nonlinear effects. This study can obtain the temporal and spatial dynamics of soil hydrothermal conditions across different soil layers and explore their regulations on GPP, providing a basis for clarifying the relationship between soil and vegetation in arid mountain systems.

Graphical Abstract

1. Introduction

The variability in soil hydrothermal conditions is closely linked to the stability of vegetation ecosystems and leads to variations in gross primary productivity (GPP) via regulating processes such as photosynthesis, respiration, and transpiration [1,2,3]. For example, a decrease in soil moisture reduces the water potential of vegetation leaves, hindering the diffusion of carbon dioxide and affecting the photosynthetic rate [4,5]. On the other hand, an increase in soil temperature can stimulate vegetation metabolism and enhance carbon accumulation, but it also leads to rapid soil moisture depletion [6,7]. With the influence of global warming, regional climate conditions become more unstable, and there is considerable uncertainty regarding the relationship between soil hydrothermal conditions and vegetation dynamics [8]. Thus, it is of great importance to identify the regulation of soil hydrothermal conditions on GPP values [9,10,11].
The regulations of soil hydrothermal conditions on vegetation dynamics vary depending on regional factors [12]. In arid and semi-arid regions, soil moisture plays a crucial role in limiting vegetation growth [13], while soil temperature exhibits a more significant regulation in humid regions [14]. Studies have demonstrated that when examining the influence of soil hydrothermal conditions on carbon sequestration capacity in the Tibetan Plateau, soil moisture and soil temperature are the primary drivers of carbon flux changes in the arid grassland of the western region and the humid meadow of the eastern region, respectively [15]. Additionally, there is a synergistic effect between soil moisture and soil temperature. Previous control experiments conducted on alpine meadows at different altitudes in Northern Tibet have found that an increase in soil moisture, induced by experimental warming of soil temperature, leads to a rise in GPP during the growing season [16]. Therefore, the regulation mechanisms of soil hydrothermal conditions on changes in gross primary productivity (GPP) vary in different regions. It is also possible that the soil hydrothermal conditions within different layers have differentiated impacts on vegetation dynamics. However, there is a lack of research specifically examining the regulations of soil hydrothermal conditions at different depths within the root zone on GPP.
At the regional scale, previous studies have demonstrated a positive correlation between vegetation growth and soil moisture [17], while soil temperature has been found to promote vegetation carbon sequestration capacity [18]. Liu et al. claimed that the imbalance of soil hydrothermal conditions caused by drought is the main stress that threatens GPP accumulation in more than 70% of regional ecosystems worldwide [19]. An experiment conducted by Mishra et al. in the Southeastern USA demonstrated a strong correlation between 0 and 100 cm soil hydrothermal conditions and vegetation greenness [20]. Additionally, studies have shown that soil profiles at different depths exhibit distinct physicochemical and hydrothermal properties. Xiao et al. proved that the hydrothermal conditions of the 0–20 cm soil layer are more susceptible to external environmental disturbances in Northwest China [21]. The study by Wang et al. demonstrated that the soil hydrothermal conditions in the Qinghai Tibet Plateau region exhibit significant differences between active layers and permafrost during the freezing period [22]. However, most studies focus solely on a single element of soil moisture or soil temperature [23] or only conduct short-term research based on in situ sampling data [24]. There are obvious limitations in the existing research on the long time series regulations of soil hydrothermal conditions at different depths on vegetation growth.
The Qilian Mountains area, as a representative geographical unit of the Tibetan Plateau, possesses a fragile ecosystem and complex climate conditions, leading to spatial variations in soil hydrothermal conditions [25]. Considering the differences in the strong link between water and heat availability to vegetation root depth, it is crucial to conduct long time series research on the regulations of soil hydrothermal conditions across different depths, which helps to understand the coupling mechanism between soil and vegetation at a regional scale [26]. In this study, the soil hydrothermal conditions across three profiles in the Qilian Mountains area from 2000 to 2020 were provided by the ERA5-Land dataset, a state-of-the-art global reanalysis dataset for land applications [27]. The purpose of this study is to determine the temporal and spatial dynamics of hydrothermal conditions at different depths within the study area and to reveal their regulations on vegetation GPP, providing a basis for clarifying the relationship between soil and vegetation in semi-arid mountain ecosystems.

2. Materials and Methods
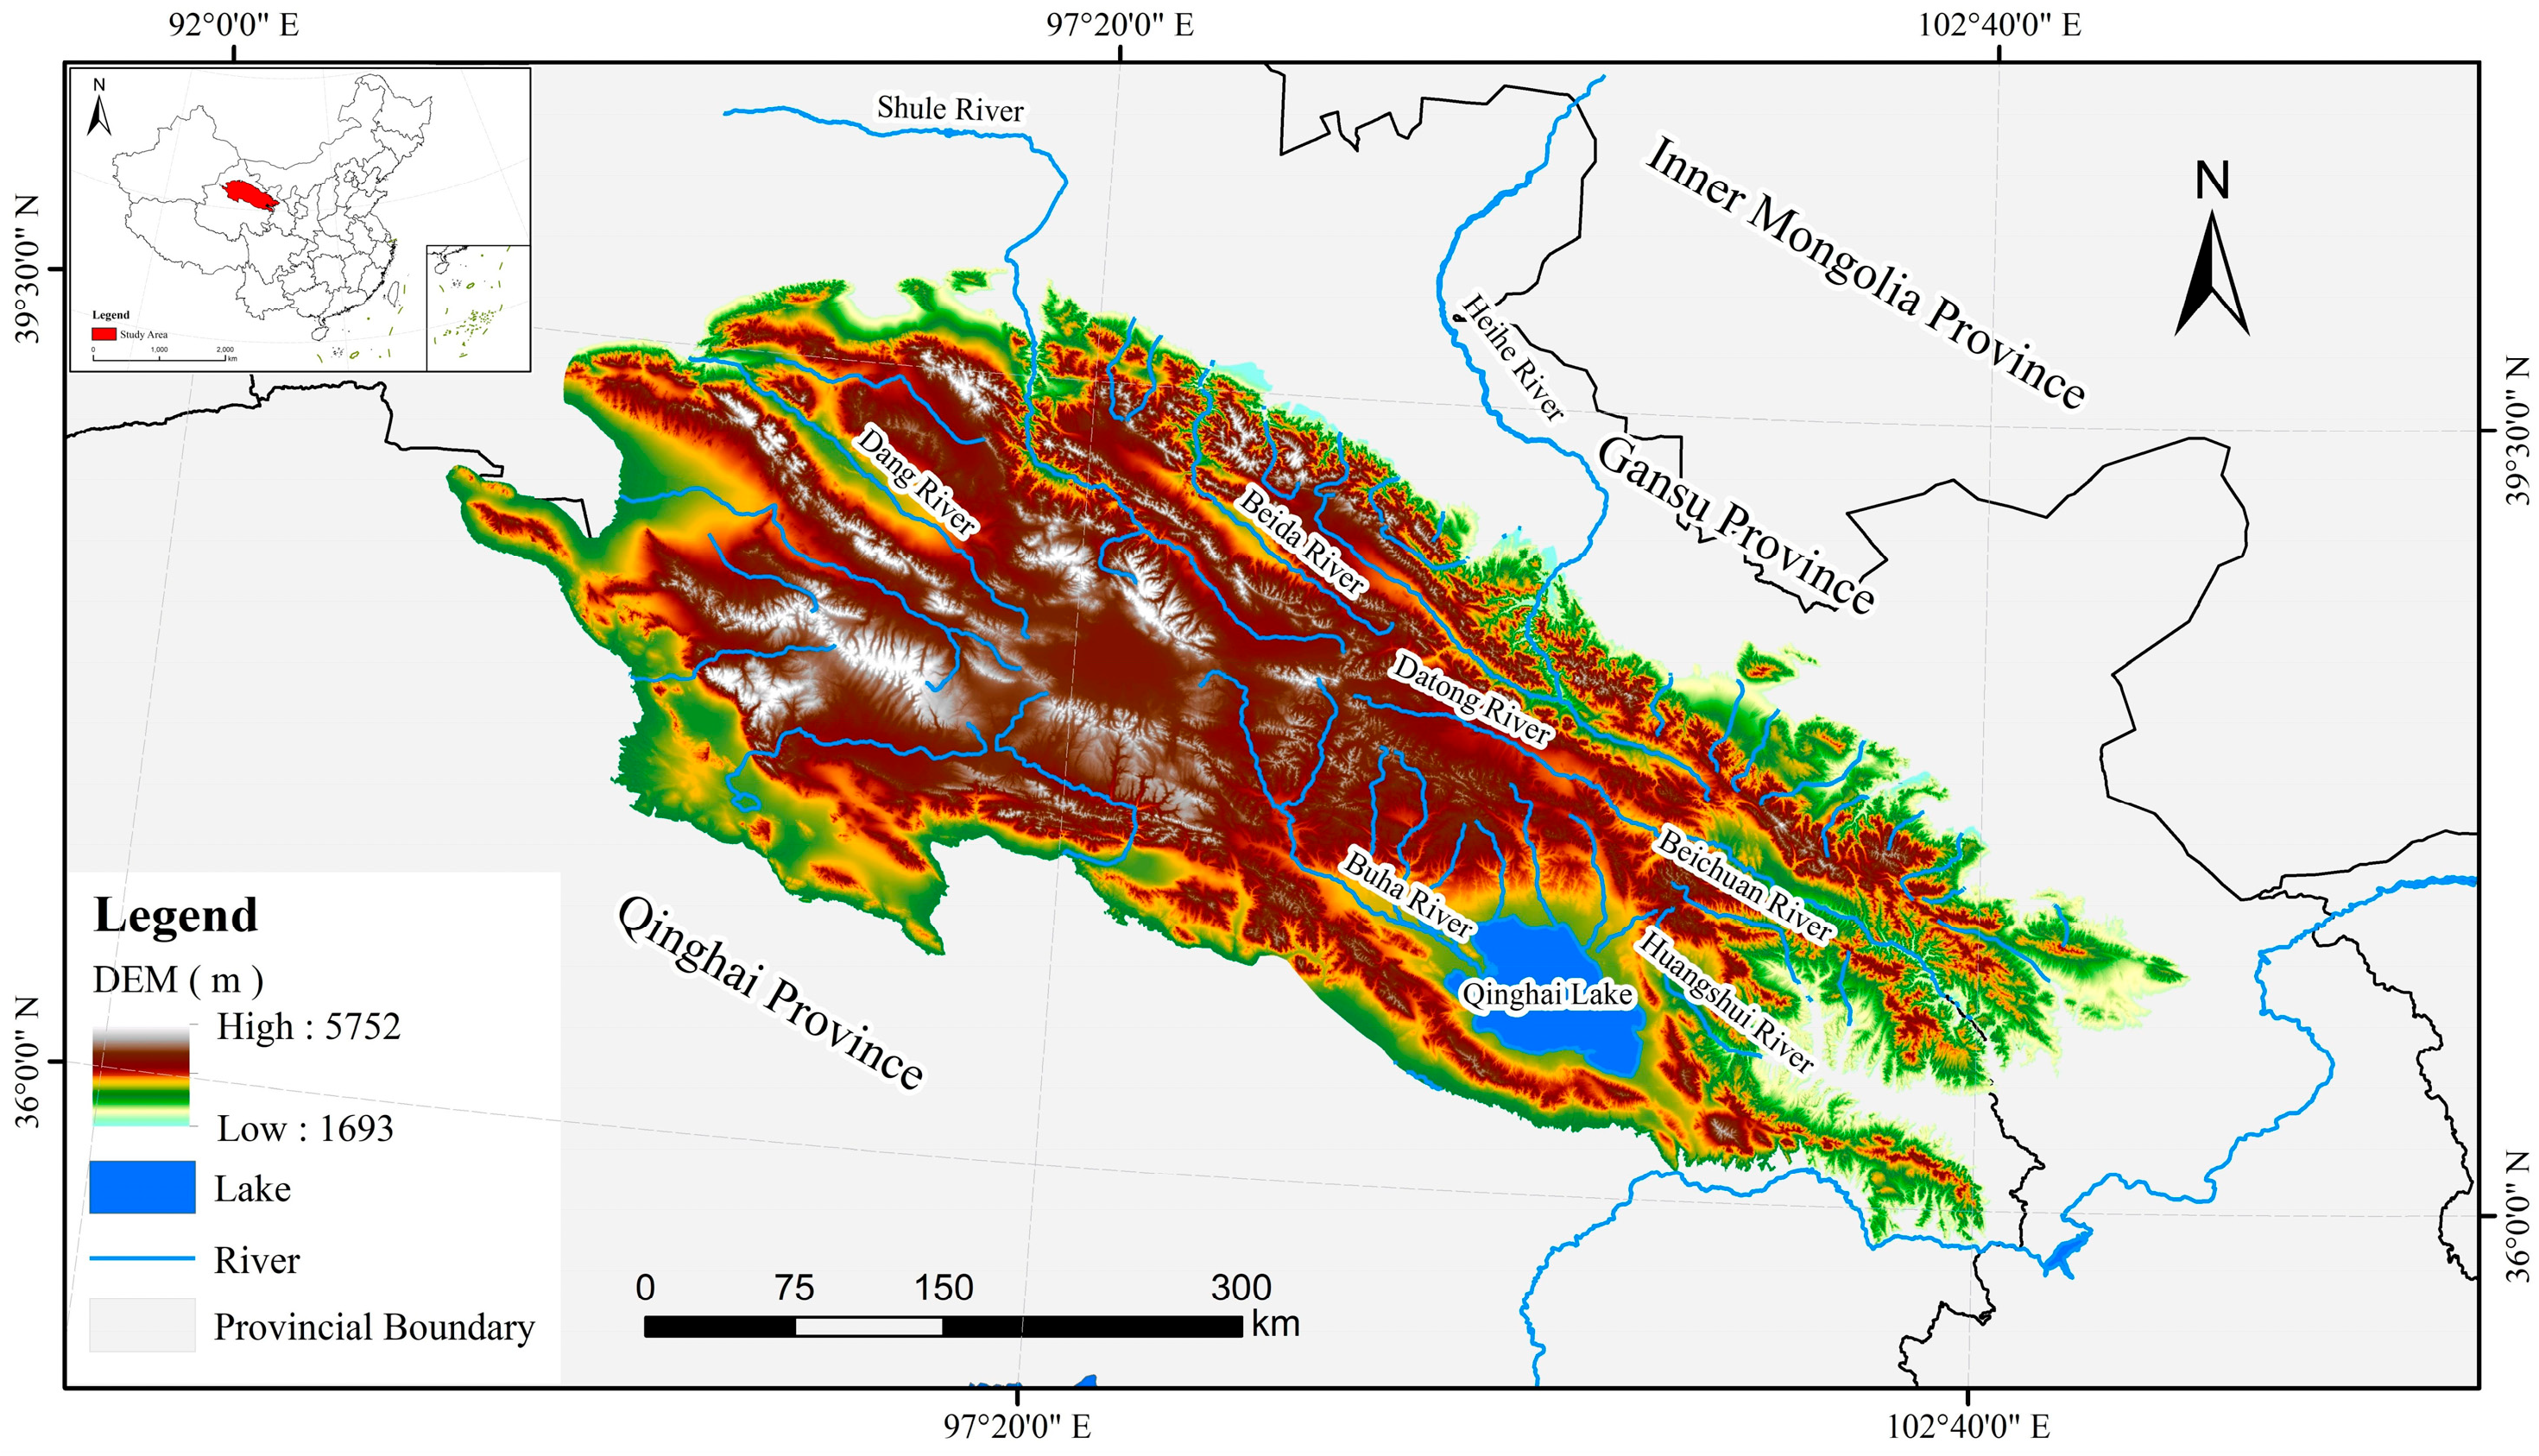
2.1. Study Area

The Qilian Mountains (35–40° E and 93–104° N) are located in the northeast of the Tibetan Plateau (Figure 1), straddling cross Gansu Province and Qinghai Province, with an approximately average elevation of 3500 m [17]. This area serves as a transitional zone within the arid and semi-arid regions, characterized by large differences in climatic conditions [28], belonging to a typical continental alpine semi-arid climate [29]. The mean annual temperature is about 2 °C [28]. The precipitation in this area rises from northwest to southeast, with the mean annual precipitation ranging from 100 mm to 800 mm [30]. In the past decade, it has been observed that the temperature increases and precipitation decreases. Moreover, the high soil water content in this area is mainly from snow melt in the late spring and rainfall in the summer. According to World Reference Base for Soil Resources (WRB), the main soil types in the Qilian Mountains are Leptosols and Kastanozems, with a combined proportion of over 70%. Due to the complex, diverse terrain and the redistribution of soil hydrothermal conditions, the vegetation types exhibit significant spatial variations.

2.2. Data Sources

2.2.1. MODIS GPP

To assess the capacity of vegetation to sequester carbon, the 8-day MODIS GPP product with a resolution of 0.5 km (MOD17A2H) was used, and annual GPP values for the study period were calculated with the help of ArcGIS 10.8. The product incorporates recently updated Biome Property look-up tables and an improved version of the daily GMAP meteorological data as input parameters [31], which have been extensively employed at both global and regional scales [32].

2.2.2. ERA5-Land

Considering the regulations of soil hydrothermal conditions at different depths on GPP, it is essential to acquire different soil profile data with homology. The ERA5-Land reanalysis dataset, accessible via the Copernicus Climate Change Service (C3S), provides an enhanced global reanalysis dataset at a resolution of 0.1° [27]. This dataset includes a four-layer representation of soil hydrothermal conditions, namely Level 1 (0–7 cm), Level 2 (7–28 cm), Level 3 (28–100 cm), and Level 4 (100–289 cm). Considering the significant influence of the top 100 cm of soil hydrothermal conditions on plant root growth [33], in this study, the first three levels were defined as surface, shallow, and deep soil layers and have been integrated into annual data for soil profile investigation.

2.2.3. Vegetation Map of China

The Vegetation Map of China, with a scale of 1:1,000,000, has been modified to align with the boundary of the Qilian Mountains in order to identify the vegetation types present in this specific region [34]. The resulting map consists of multiple cropped patches, each containing numerous polygons that have been classified into nine distinct categories: needleleaf forest, broadleaf forest, shrub, grassland, marsh, alpine, desert, cultivated vegetation, and areas devoid of vegetation. This adjusted vegetation map serves as a foundational tool for spatial zoning, enabling the investigation of differentiated impacts among the various vegetation types within the study area.

2.3. Methods

2.3.1. Sen-MK Trend Test

To understand the background variation in soil hydrothermal conditions and GPP values in the study area, the interannual variation trends are determined using Sen’s slope estimator [35,36]. This estimator allows for the calculation of the trends over time, expressed as follows:
β = m e a n x j x i j i   ,   j > i        
where xi and xj are the values at times i and j within the dataset, respectively.
The Mann–Kendell trend test, a non-parametric statistical method, is employed to identify significant trends of interannual variables [37]; the MK test statistic S is calculated as follows:
S = i = 1 n 1 j = i + 1 n s g n   ( x j x i ) ,   j > i    
where n represents the number of data points, xi and xj are the data values in time series i and j, respectively, and sgn (xj − xi) is a sign function as
s g n   x j x i = + 1   ,   i f   x j x i > 0   0   ,   i f   x j x i = 0   1   ,   i f   x j x i < 0      
In cases where there is no correlation between the statistic S and the trend, the variance Var (S) is determined as
V a r S = n ( n 1 ) ( 2 n + 5 ) 18 = σ 2  
where n is the number of data points.
Another parameter for the Mann–Kendell trend test is the standard Z value:
Z = S 1 σ       f o r     S > 0         0               f o r       S = 0 S + 1 σ       f o r     S < 0    
The trend is considered insignificant if Z is less than the confidence levels (a = 5%) but significant if |Z| ≥ 1.65, 1.98, and 2.58 at the confidence levels of 90%, 95%, and 99%, respectively. The results combined Sen’s slope estimator and Mann–Kendell trend test can intuitively both reflect the variation trends and significance degrees.

2.3.2. Correlation Analysis

The Pearson correlation analysis is utilized to assess the magnitude of the linear association between soil hydrothermal conditions and GPP [38]. The correlation coefficient r > 0 indicates a positive correlation, and vice versa. Additionally, it is worth noting that all calculated values of r in this study have successfully passed the two-tailed t-test.

2.3.3. Feature Importance Extraction

The Random Forest algorithm divides the dataset into a training set and a test set (out-of-bag data, OOB) by bootstrap resampling [39]. To better capture the non-linear impact effect of soil hydrothermal conditions on GPP, the mean decrease accuracy (MDA) method based on the OOB data has been applied [40].
The bootstrap technique is employed to construct a series of decision trees tm (m = 1, …, T), along with the associated input matrix XOOB and output Yp. The mean square error (MSE) of Yp and the true value Y can be calculated as follows:
ε O O B m = m s e Y p Y 2        
The total predicted feature importance of variable i is determined by calculating the average value of MSEs across all decision trees tm (m = 1, …, T) [41].

3. Results

3.1. Interannual Variation Trends

Overall, Table 1 shows nine different interannual variation trends obtained by Sen’s slope estimator and the Mann–Kendell trend test. Meanwhile, the interannual variation trends of soil moisture in the Qilian Mountains vegetation zone are investigated, as shown in Figure 2. The multi-year average values of soil moisture across three soil layers exhibit a spatial pattern characterized by lower values in the northwest and higher values in the southeast. Within the middle zone of the Qilian Mountains, there are scattered patches on the map where soil moisture exceeds 50%. Geographically, these areas with high soil moisture are primarily concentrated in the Shule River basin, which suggests a potential association with surface and underground runoff transport processes [42]. Additionally, it is evident that soil moisture increases with depth, with values of 0.2974, 0.3128, and 0.3139 from top to bottom, respectively. This indicates that the deep soil is provided with stronger water retention characteristics compared to the shallow soil. The interannual variation trends depicted in Figure 2d–f exhibit notable spatial heterogeneity, with a drying trend in high-altitude areas (above 4000 m) and a wetting trend in the northeast and surrounding areas of Qinghai Lake. Notably, the pixel percentage of extremely significant increase trend in deep soil reaches 23.06%, which means that the area showing a positive trend in deep soil has increased by about 20% compared with other depths, emphasizing the deep soil has undergone a humidifying stage [43].
The background and variation in soil temperature are shown in Figure 3. The soil temperature values across three layers exhibit a spatial pattern characterized by a gradual increase from the northwest to the southeast. Also, the spatial distribution of soil temperature aligns closely with the elevation altitude, suggesting that variations in air temperature resulting from vertical zonality may influence soil heat absorption [30]. The lowest soil temperature sections are concentrated in the mountainous areas of Haixi Prefecture in Qinghai Province. However, there is no distinct differentiation of soil temperature observed across soil layers. The interannual variation in soil temperature generally demonstrates an increasing trend [44], with more than 50% of pixels exhibiting no significant increase trend. However, in the eastern areas, the interannual variation indicates an extremely significant increase.
Moreover, the spatial pattern of GPP in the Qilian Mountains vegetation zone during the study period is examined, as depicted in Figure 4. The results reveal a distinct spatial pattern of GPP, characterized by lower values in the northwest and higher values in the southeast, indicating significant spatial heterogeneity. The areas with lower GPP values are predominantly situated along mountain ranges, while in the temperate desert grassland of the northwest, these areas exhibit a prominent striped distribution of low values. Furthermore, the analyses of long time series data exhibit more year-to-year variability in GPP. The pixel percentage of increasing trend exceeds 75%, particularly in the vicinity of Qinghai Lake, where a continuous spatial distribution of an extremely significant increasing trend. These results provide evidence of a persistent increase in vegetation carbon sequestration capacity throughout the study period.

3.2. Correlation Comparative Analysis

The correlation analyses between GPP and soil hydrothermal conditions are conducted using the Pearson method, and the results are presented in Figure 5 and Table 2. The findings reveal variations in the correlation effects between soil moisture and GPP across layers. Large areas with negative correlations are observed in the surface layer, particularly in the high-altitude regions of the Qilian Mountains’ main peak area. However, as the soil deepens, the negative effects weaken while the positive effects strengthen. The Pearson correlation coefficients (PCCs) across layers range from 0.0945 to 0.5076, indicating that the deep soil has a more pronounced promoting effect on vegetation carbon sequestration, with the help of the strong water retention characteristics. This effect may be influenced by the water absorption characteristics of vegetation roots [45]. Additionally, the areas showing a negative correlation effect align with the interannual decreasing areas of soil moisture, primarily distributed in high-altitude areas (above 4000 m), which can be attributed to the influence of vertical climate zonality on vegetation growth. The correlation analyses between soil temperature and GPP primarily reveal positive effects, with scattered areas exhibiting inconspicuous negative effects in the central peak area. Unlike soil moisture, the correlation results of soil temperature vary slightly across different layers. The PCCs fluctuate around 0.55, with the highest value of 0.5566 in the surface soil layer, indicating that the soil temperature exhibits a noticeable promoting effect on GPP.
Three dominant vegetation types are identified based on the ranking of coverage area, including grassland (56.99%), shrub (9.33%), and alpine (7.87%). The spatial distribution is illustrated in Figure 6. Grassland exhibits a widespread and continuous distribution, while shrub and alpine vegetation are predominantly interspersed in the eastern regions and high-altitude areas, respectively. The multi-year average values of GPP for each vegetation type are determined by the ArcGIS zonation statistics tool. The descending order of GPP values is as follows: shrub (417.7 gC × m−2 × a−1), grassland (284.5 gC × m−2 × a−1), and alpine (109.8 gC × m−2 × a−1). Accordingly, the correlation difference analyses between GPP and soil hydrothermal conditions are carried out among dominant vegetation types.
Table 3 shows the comparative correlation analyses for the dominant vegetation types. When considering the promoting effect of soil moisture on GPP, all three dominant vegetation types exhibit a stronger correlation with the Level 3 layer, which is consistent with the findings for the entire vegetation zone. Furthermore, for the same layer, the magnitude of PCCs corresponds to the area occupancy, with grassland obtaining the highest PCC, followed by shrub and alpine. This indicates that soil moisture has a pronounced promoting effect in different vegetation regions with larger area occupancy. Overall, the PCC for grassland is higher than the average value for the entire vegetation zone, confirming that the soil moisture conditions in the Qilian Mountains are more conducive to the growth of grassland [46]. Similarly, the PCCs of all three dominant vegetation types fluctuate around 0.55, with no significant divergence observed across vegetation types and soil layers.

3.3. Feature Importance Extraction

To assess the non-linear contribution of soil hydrothermal conditions to GPP, feature importance extraction experiments are conducted using the Random Forest algorithm. The experiments focus on two independent variables, soil moisture and soil temperature, among four dimensions, namely the overall vegetation zone and specific vegetation types (grassland, shrub, and alpine vegetation). The results are presented in Figure 7. Considering the impact of soil moisture on GPP, the feature importance values across three layers exceeded 30%, with a ranking of SM-L3 > SM-L1 > SM-L2. Notably, deep soil moisture consistently emerges as the most influential variable, contributing 35.54%, 37.35%, 35.56%, and 35.05% to GPP in the vegetation zone and the three dominant vegetation types, respectively. Furthermore, the feature importance values of the deep soil moisture gradually decrease with the vegetation coverage area. This suggests that for vegetation types with larger distribution areas, the promoting effect of deep soil moisture is more significant. In addition, the feature importance extraction reveals that the surface soil temperature plays the most crucial role in GPP, which is more pronounced than linear correlation results. It contributes over 45% to GPP in the vegetation zone and 44.96%, 43.28%, and 33.47% to GPP in the three dominant vegetation types. Moreover, there is no significant differentiation in the contribution degrees of SM-L2 and SM-L3 to GPP. These findings indicate that, in the Qilian Mountains, compared to other layers, the surface soil temperature is essential for GPP, and this relationship often exhibits a non-linear effect.

4. Discussion

4.1. Uncertainty Validation

The objective of this study is to investigate the interplay between MODIS GPP data and the ERA5-Land reanalysis dataset. Previous research has demonstrated the utility of MODIS GPP data for assessing regional-scale vegetation carbon sequestration capacity [26,47,48]. Similarly, other studies have evaluated the feasibility of utilizing ERA5-Land reanalysis datasets to capture soil hydrothermal conditions in the Qilian Mountains area of the Tibetan Plateau. For instance, various satellite and reanalysis estimates of surface soil moisture (SSM) and root-zone soil moisture (RZSM) in the Qinghai-Tibet Plateau region from summer 2016 to 2018 have been evaluated [49]. The results proved that the ERA5-Land product exhibited the best performance, with the lowest median unbiased root mean squared error (RMSE) value of 0.04 m3/m3 when compared to other soil moisture products. Additionally, scholars combined reanalysis datasets with observed soil temperature data to analyze long-term changes in the thermal regime of the uppermost soil layer at six sites in the central Tibetan Plateau [50]. They concluded that MERRA2 and ERA5-Land demonstrated the highest quality in matching the observed data at each site, exhibiting the largest correlation coefficient, smallest standard deviation, and smallest RMSE. Therefore, the utilization of MODIS GPP data and ERA5-Land data in this study for analyzing the Qilian Mountains area is deemed reliable based on these previous findings.

4.2. Interannual Fluctuation Trends

To facilitate a more comprehensive comparison of the dynamic changes in soil hydrothermal conditions and GPP, the annual data was normalized [51]. Figure 8 illustrates the interannual fluctuations of soil hydrothermal conditions across different layers. Notably, the soil moisture values for all three layers reached their lowest point in 2013 during the study period. From 2007 to 2013, the soil moisture values across three layers exhibited a consistent decreasing trend, followed by a fluctuating increasing trend from 2013 to 2018. Previous studies have indicated that the Qilian Mountains experienced a mild drought event lasting for eight months in 2013, which likely contributed to the observed valley value in soil moisture [52,53]. Furthermore, in the deep layer, it is evident that the decreasing trend of soil moisture is less pronounced, while the rising trend is more prominent. This finding supports the previous conclusion that the deep soil in the Qilian Mountains exhibits strong water retention characteristics.
Similar to the interannual trend analyzed in Section 3.1, the interannual fluctuations of soil temperature values across three layers exhibit noticeable similarities. The years 2004, 2012, and 2019 correspond to valley values, while peak values occur in 2009, 2014, and 2020. The Lenglong Mountain and Wushao Mountain in the eastern part of the study area serve as transition regions from cold to warm soil temperatures, and the interannual variation trends in these areas also indicate an extremely significant increase. This region exhibits a strong response to regional climate warming, with the persistent phenomenon of permafrost degradation contributing to a notable interannual rise in soil temperature [54]. The regulation of soil heat in the Qilian Mountains is significantly influenced by the freezing and thawing processes [55]. The presence of snow cover on the surface soil affects the exchange of heat with the soil, with thicker snow cover resulting in higher soil temperatures [56,57]. However, the process of snow melting absorbs heat from the soil, leading to a fluctuating decrease in soil temperature to some extent [58]. Consequently, the annual variation characteristics of soil temperature are closely linked to the intensity of freezing and thawing processes.
Figure 9 illustrates the interannual fluctuation of GPP in the Qilian Mountain vegetation zone. The data reveal a significant increasing trend throughout the study period, reaching its peak in 2018. Additionally, GPP values in the second decade are higher than those in the first decade. The relatively warm and humid climate conditions in the southeast region contribute to luxuriant vegetation growth, resulting in a stronger capacity for carbon sequestration [59]. The continuous improvement in the vegetation carbon sequestration capacity of the Qilian Mountains is likely attributed to robust afforestation efforts [60,61]. Moreover, the interannual fluctuation trends of GPP align more closely with SM-L3, providing further evidence of their strong correlation.

4.3. Influence Degree Threshold Analyses

Based on the feature importance extraction, the most influential factors affecting GPP in relation to soil hydrothermal conditions are the deep soil moisture and the surface soil temperature. Although it provides a more intuitive depiction of the contribution degree of soil hydrothermal conditions to GPP, the influence degree threshold analyses also need to be conducted to trace the changing trend and clarify the internal regulations mechanism.
Due to the “black box” nature of machine learning models, the Shapley Additive exPlanation (SHAP) method is utilized to evaluate the concise causality relationships between feature variables [62]. The SHAP method is an additivity interpretation model inspired by the Shapley value from cooperative probability theory [63]. Its fundamental concept involves calculating the marginal contribution of features to the model output, thereby enabling the interpretation of the “black box” model at both global and local levels. The SHAP method has gained widespread adoption due to its desirable properties, including local accuracy, missingness, and consistency [64,65]. To better investigate the threshold effects and the degree of influence between soil hydrothermal conditions and GPP values, scatter analyses are conducted for different dominant vegetation areas using the “SHAP package” in Python 3.9.
The zero value of SHAP is commonly used as a threshold. A positive SHAP value indicates that the sample point positively contributes to the predicted result. The magnitude of the SHAP value corresponds to the extent of the positive contribution, with larger values indicating greater contributions and vice versa. The analyses for soil moisture and soil temperature are shown in Figure 10 and Figure 11, respectively. The linear regression analysis of soil moisture values in the vegetation zone has demonstrated that positive contributions to GPP only occur when the surface soil moisture SM-L1 exceeds 34.06%. However, SM-L2 and SM-L3 exhibit positive contributions even before reaching the threshold values of 33.80% and 34.32%, respectively (Figure 10a–c). The higher number of positive sample points further confirms the stronger facilitation effect of the deep soil. The scatter analyses for grassland (Figure 10d–f), which is the dominant vegetation type with the widest distribution, are similar to those for the vegetation zone, with threshold points of 33.45%, 31.22%, and 35.78%, respectively. In the shrub (Figure 10g–i), the SHAP values of soil moisture in different soil layers do not exhibit a well-fitting linear trend, and the threshold effect is not significant. For alpine vegetation (Figure 10j–l), the limited number of sample points and low SHAP values can be attributed to the low coverage area of this vegetation type. The most pronounced linear fitting trend in the vegetation zone is observed in Level 2, where a clear positive contribution is evident once the soil temperature exceeds −0.58 °C (Figure 11a–c). In the grassland (Figure 11d–f), both ST-L1 and ST-L2 exhibit significant threshold turning points at −0.35 °C and 0.23 °C, indicating that the positive contribution of ST-L1 is more extensive and influential for GPP. The positive and negative evaluations are most pronounced at the threshold point of ST-L1 in shrubs (Figure 11g–i), demonstrating consistent facilitation when the soil temperature exceeds 2.78 °C. Similar to soil moisture, the analyses of soil temperature for alpine vegetation are also limited by the small number of sample points (Figure 11j–l).

5. Conclusions

As a micro-ecosystem supporting vegetation, variations in soil hydrothermal conditions inevitably lead to corresponding changes in the overlying vegetation. Previous studies have predominantly treated soil hydrothermal conditions as a collective factor or solely focused on the impact of water availability on vegetation, with limited exploration of the differential effects across soil profiles. This study aims to address this gap by examining the influence of soil hydrothermal conditions across different layers on GPP in the Qilian Mountains area, utilizing MODIS GPP data and the ERA5-Land reanalysis dataset. Analytical methods such as trend tests, correlation analysis, and machine learning algorithms are employed to investigate these influence effects. The findings yield several key conclusions:
(1)
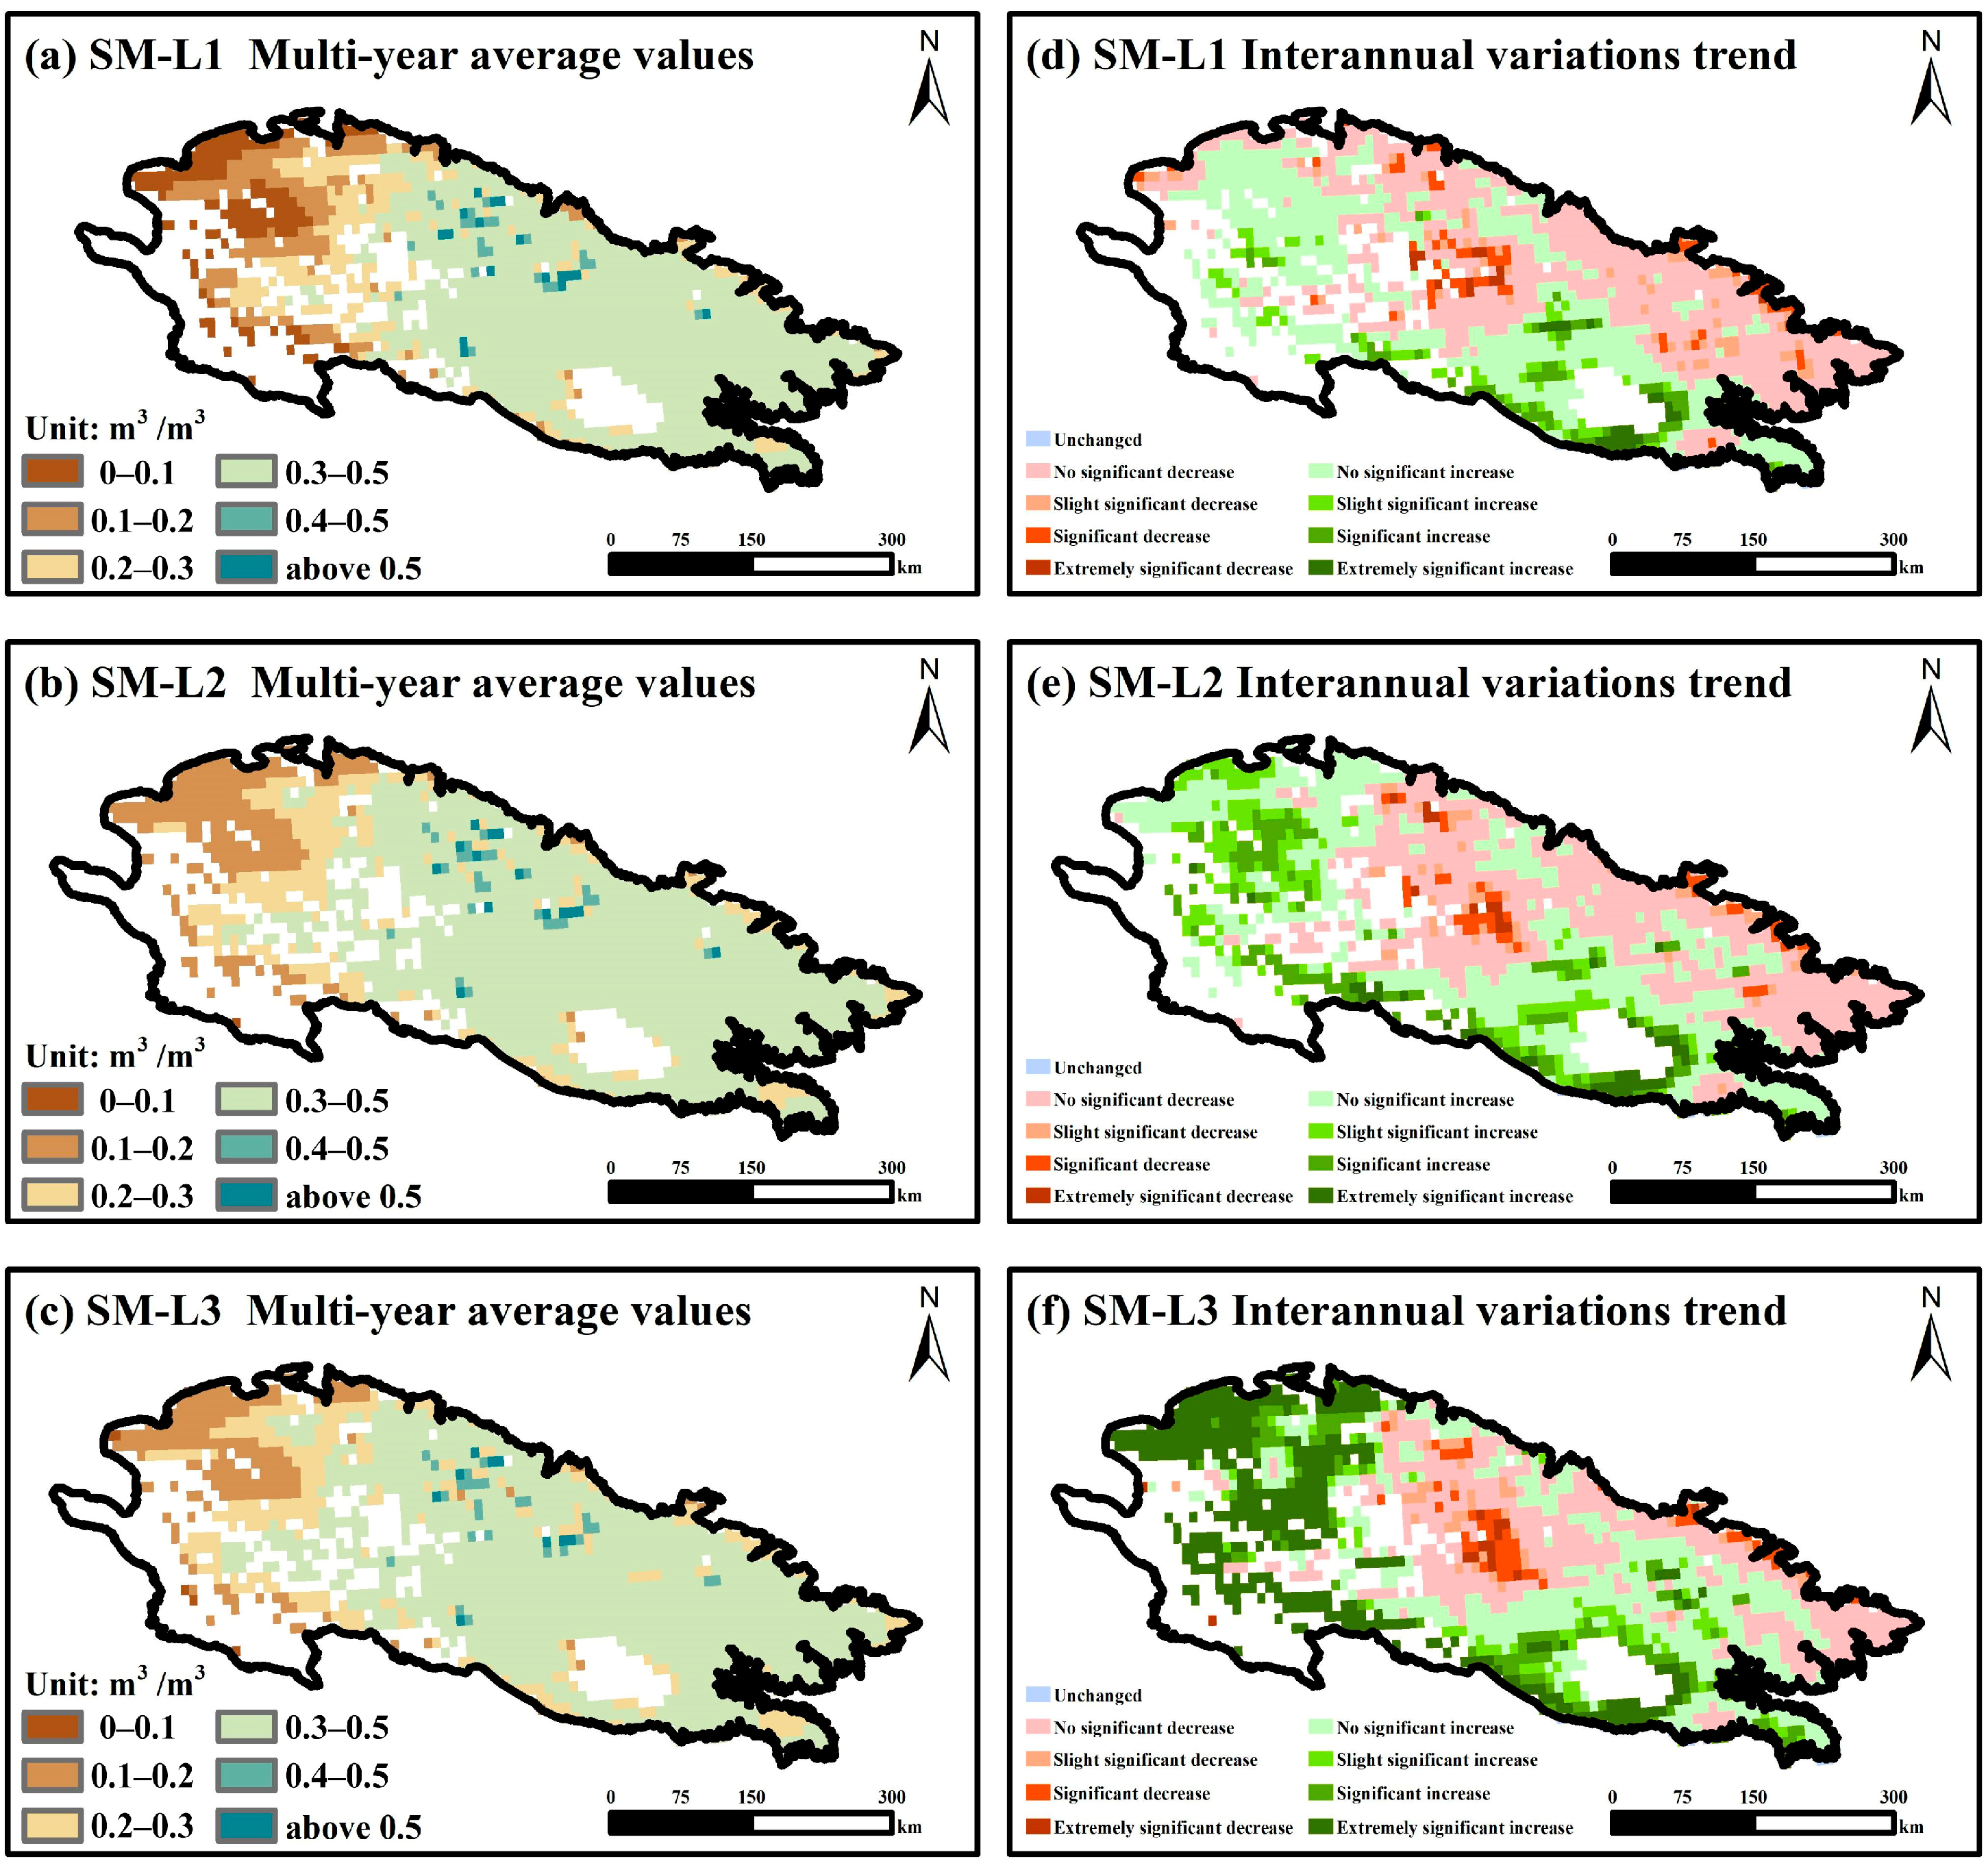
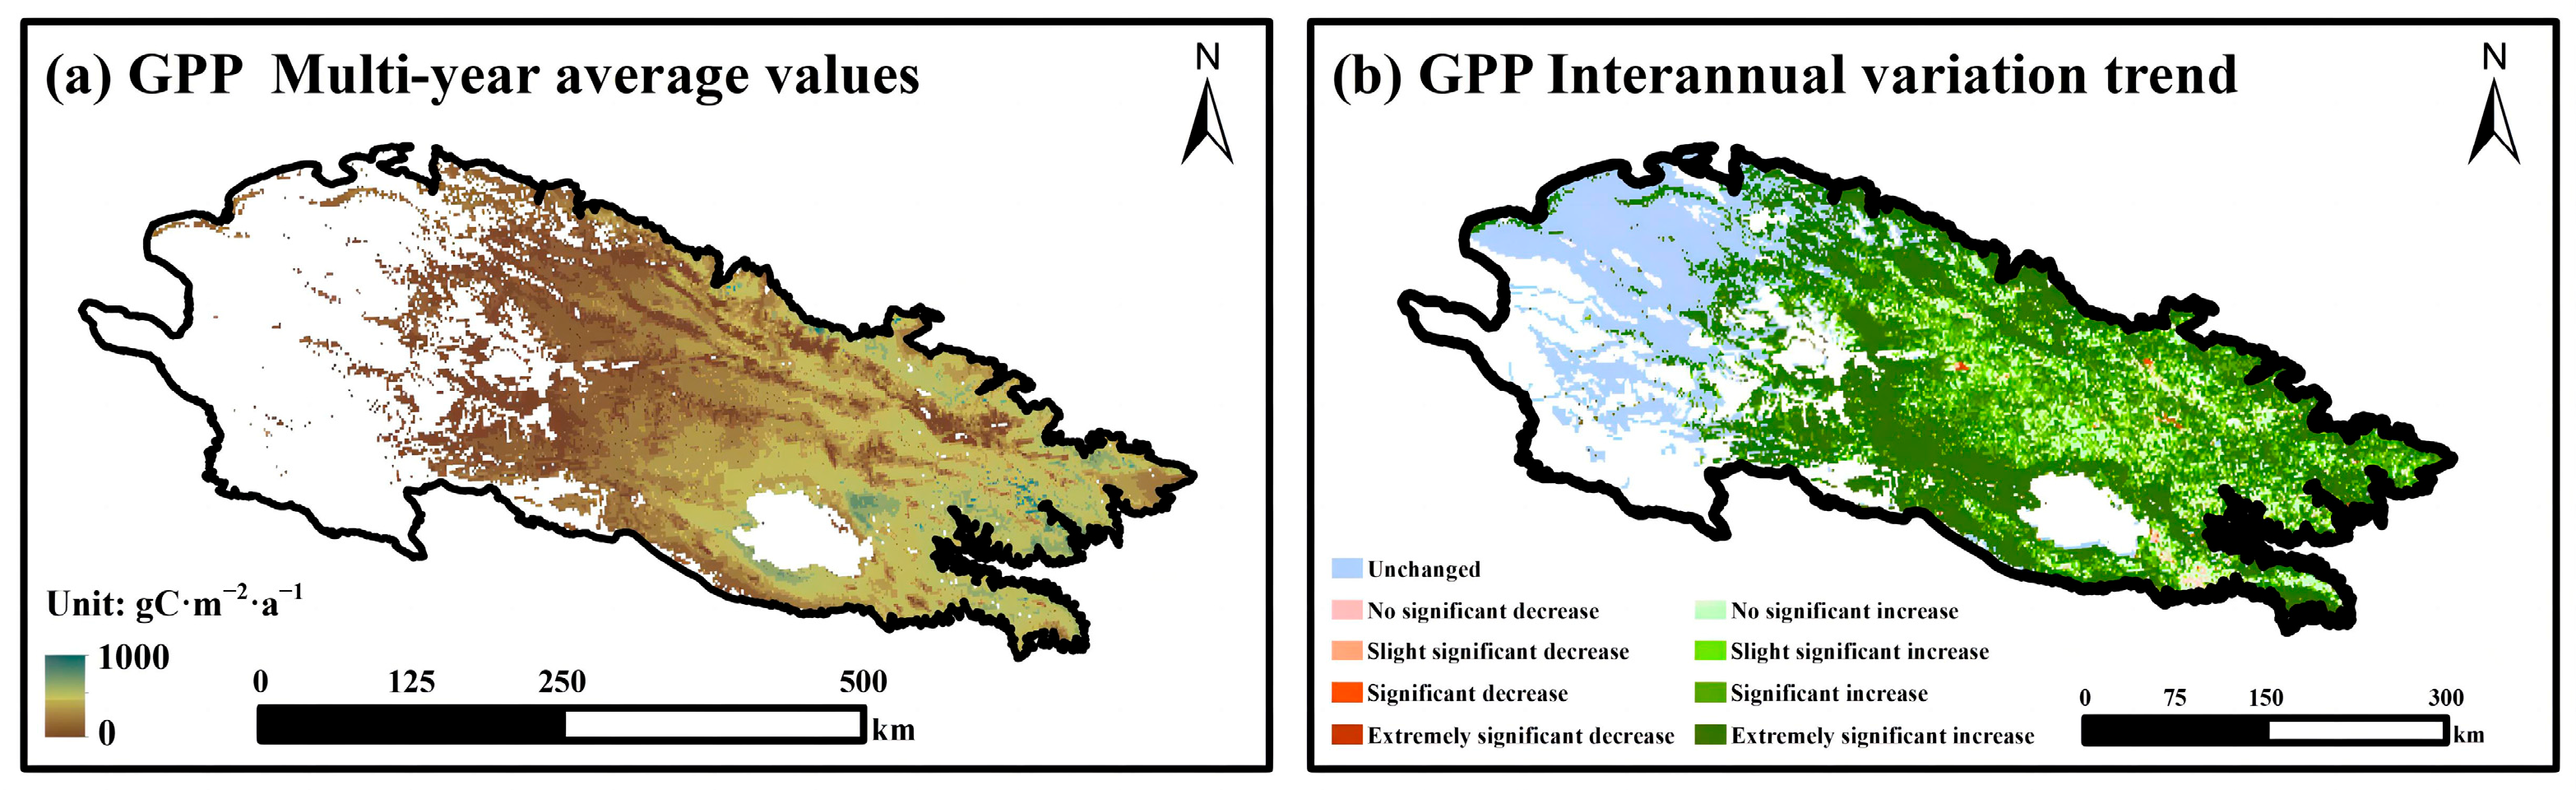
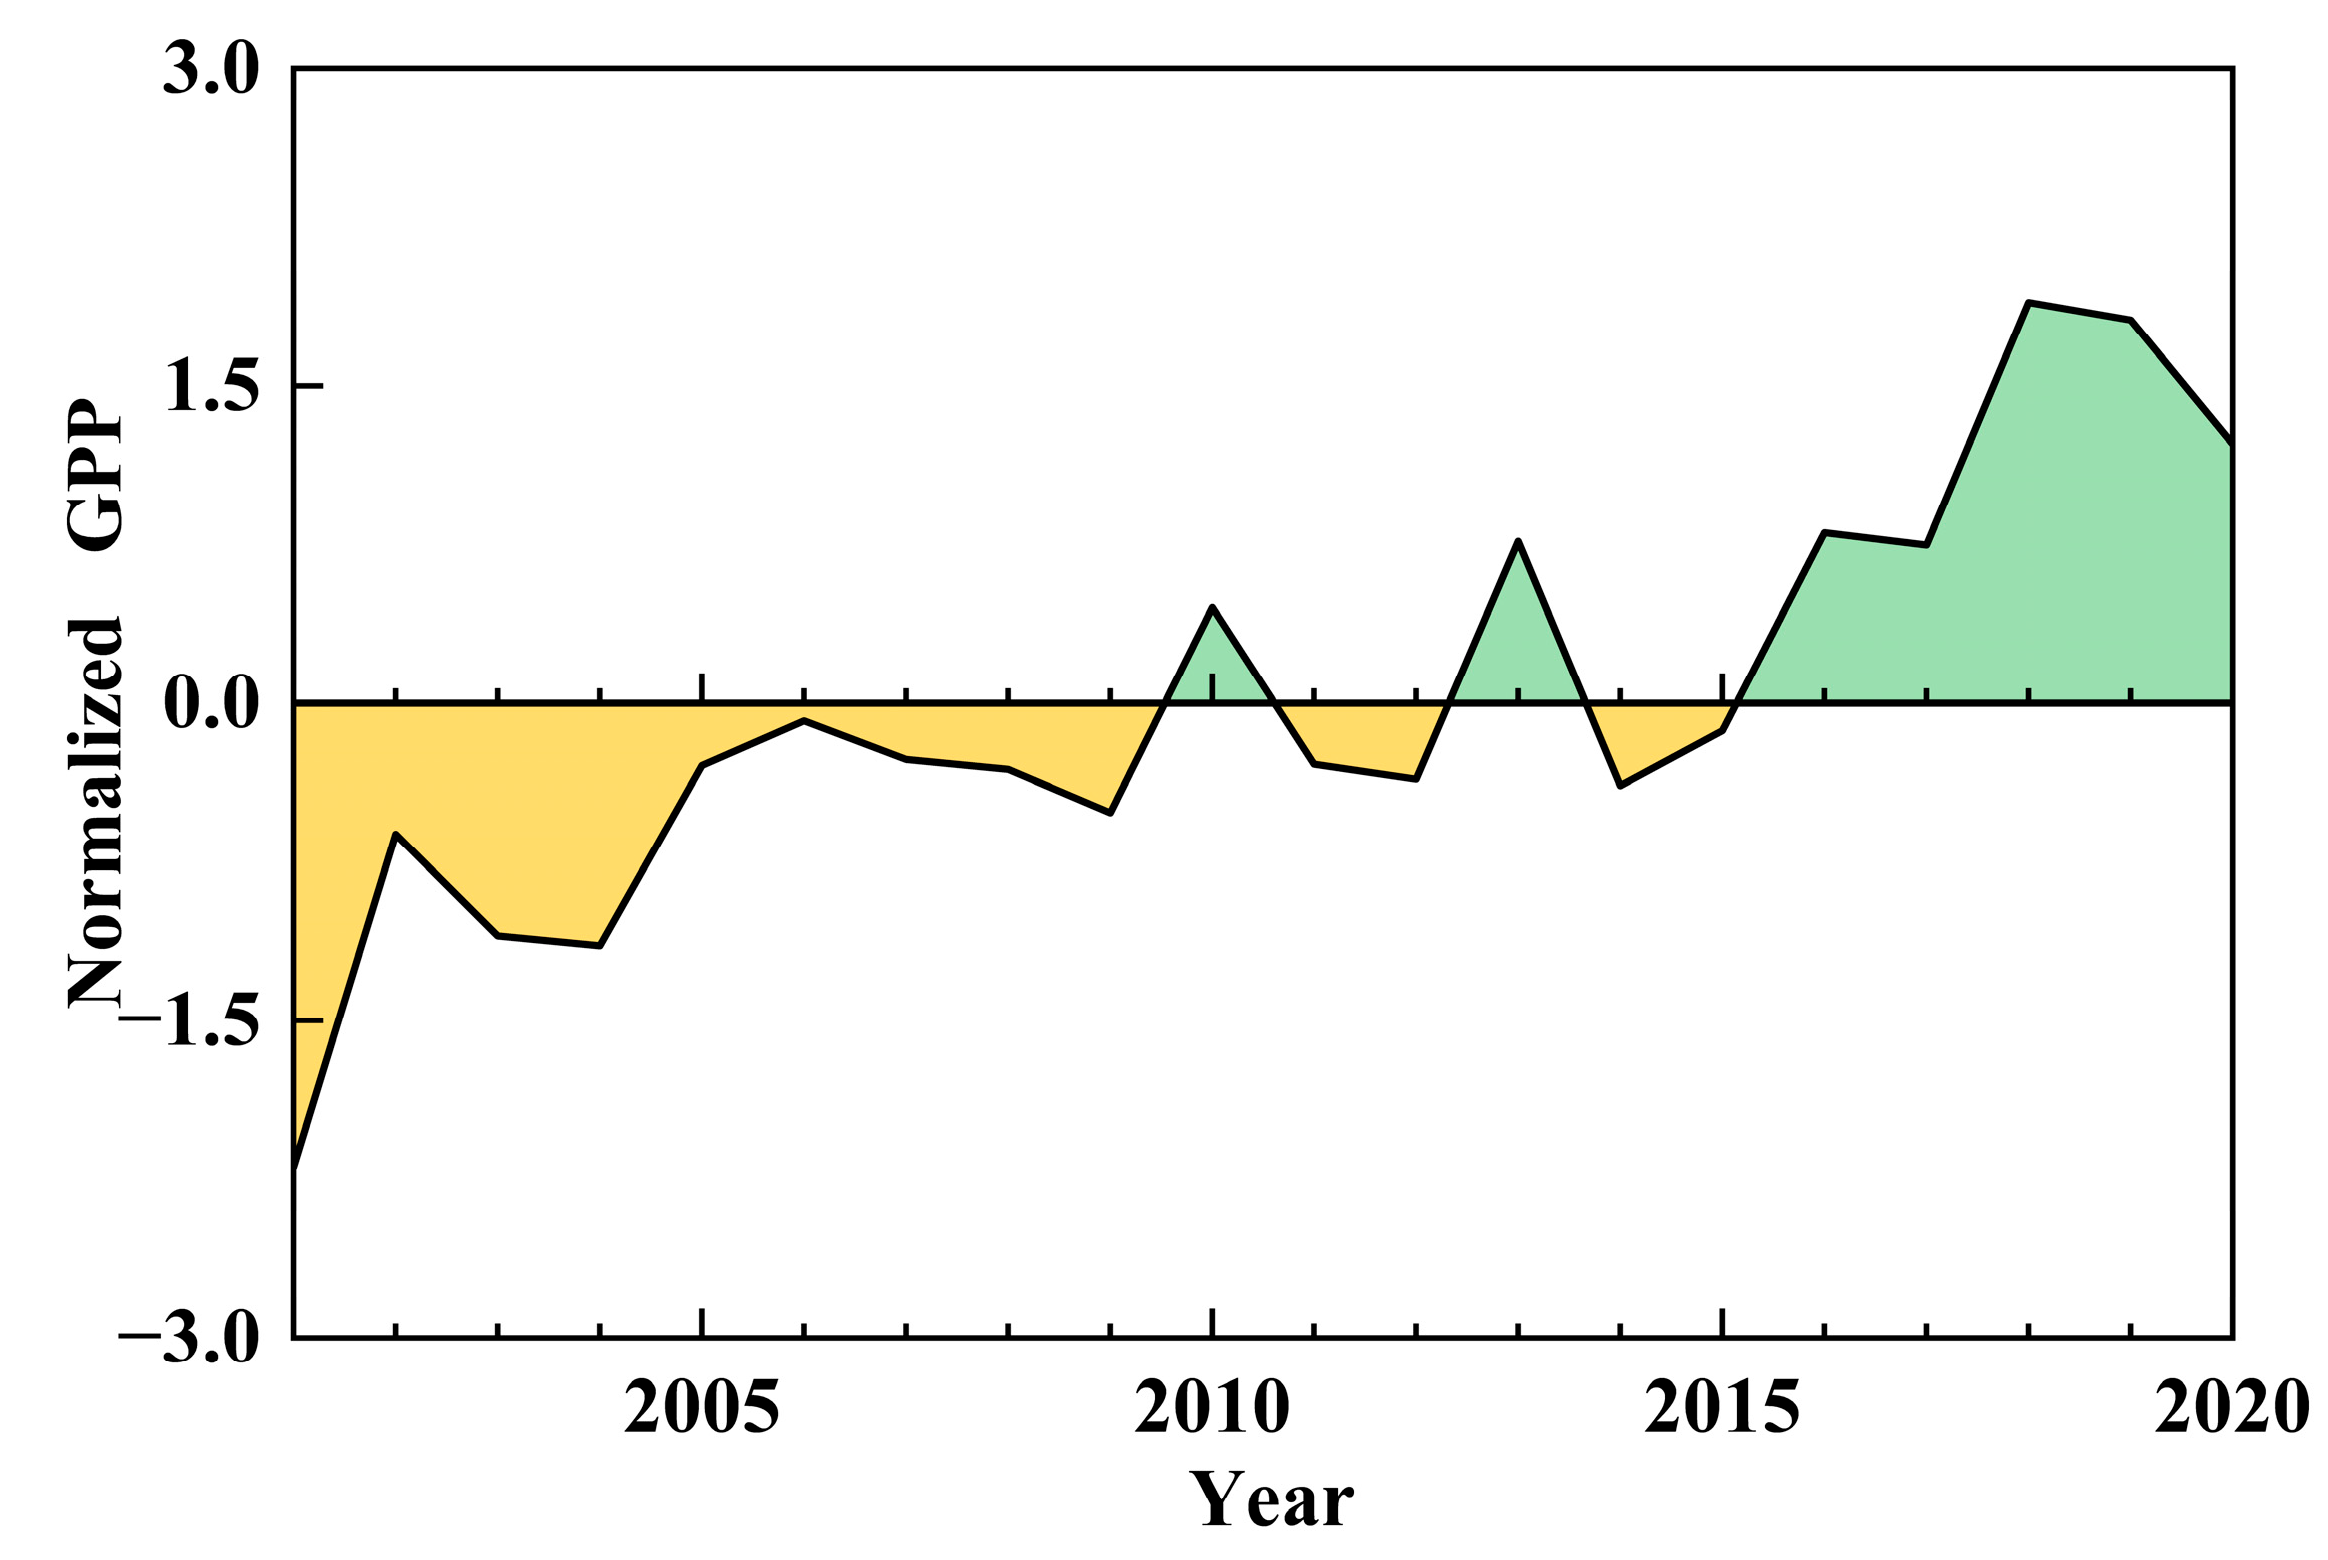
Deeper soil is wetter than shallower soil, proving that the deep soil possesses stronger water retention characteristics than other profiles. Conversely, the interannual variations in soil temperature do not exhibit significant divergence with soil depth. Moreover, the deep soil moisture demonstrates a distinct and significant interannual increasing trend, while soil temperature values show a similar fluctuating upward trend across three soil layers. GPP values exhibit a spatial distribution pattern characterized by low values in the northwest and high values in the southeast. Furthermore, GPP values generally demonstrate a significant increasing trend throughout the study period, confirming the persistent vegetation carbon sequestration capacity of the semi-arid region.
(2)
The correlation analyses have confirmed that GPP values exhibit a stronger correlation with deep soil moisture, while the correlations with soil temperature do not show significant differentiation across layers. This pattern is consistently observed in different dominant vegetation areas. Additionally, the magnitude of the PCCs between GPP values and soil moisture of the same layer aligns with the vegetation cover area occupancy.
(3)
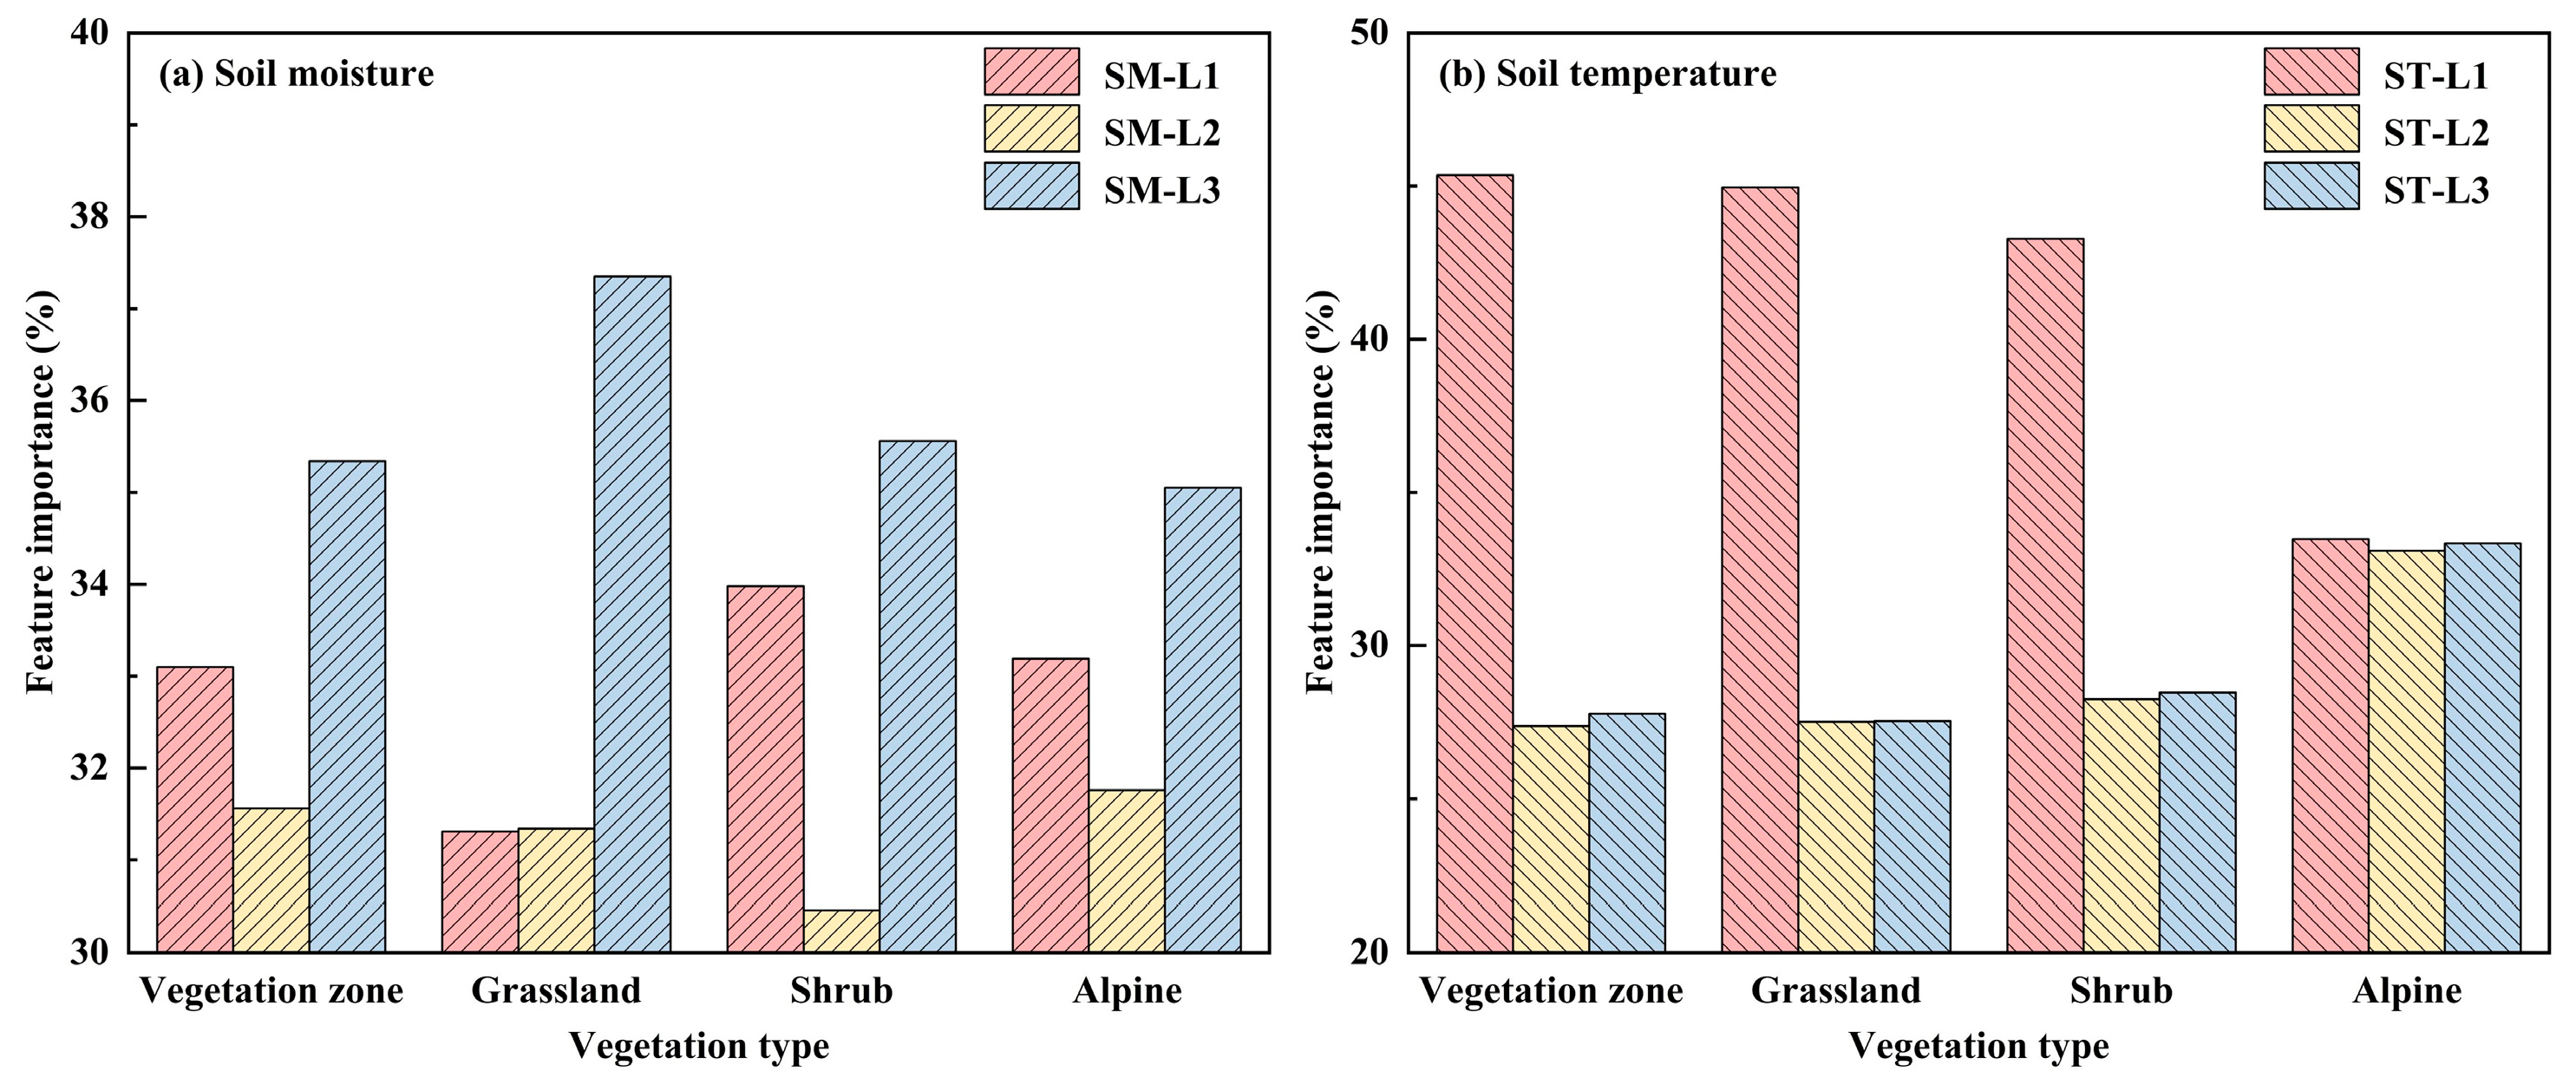
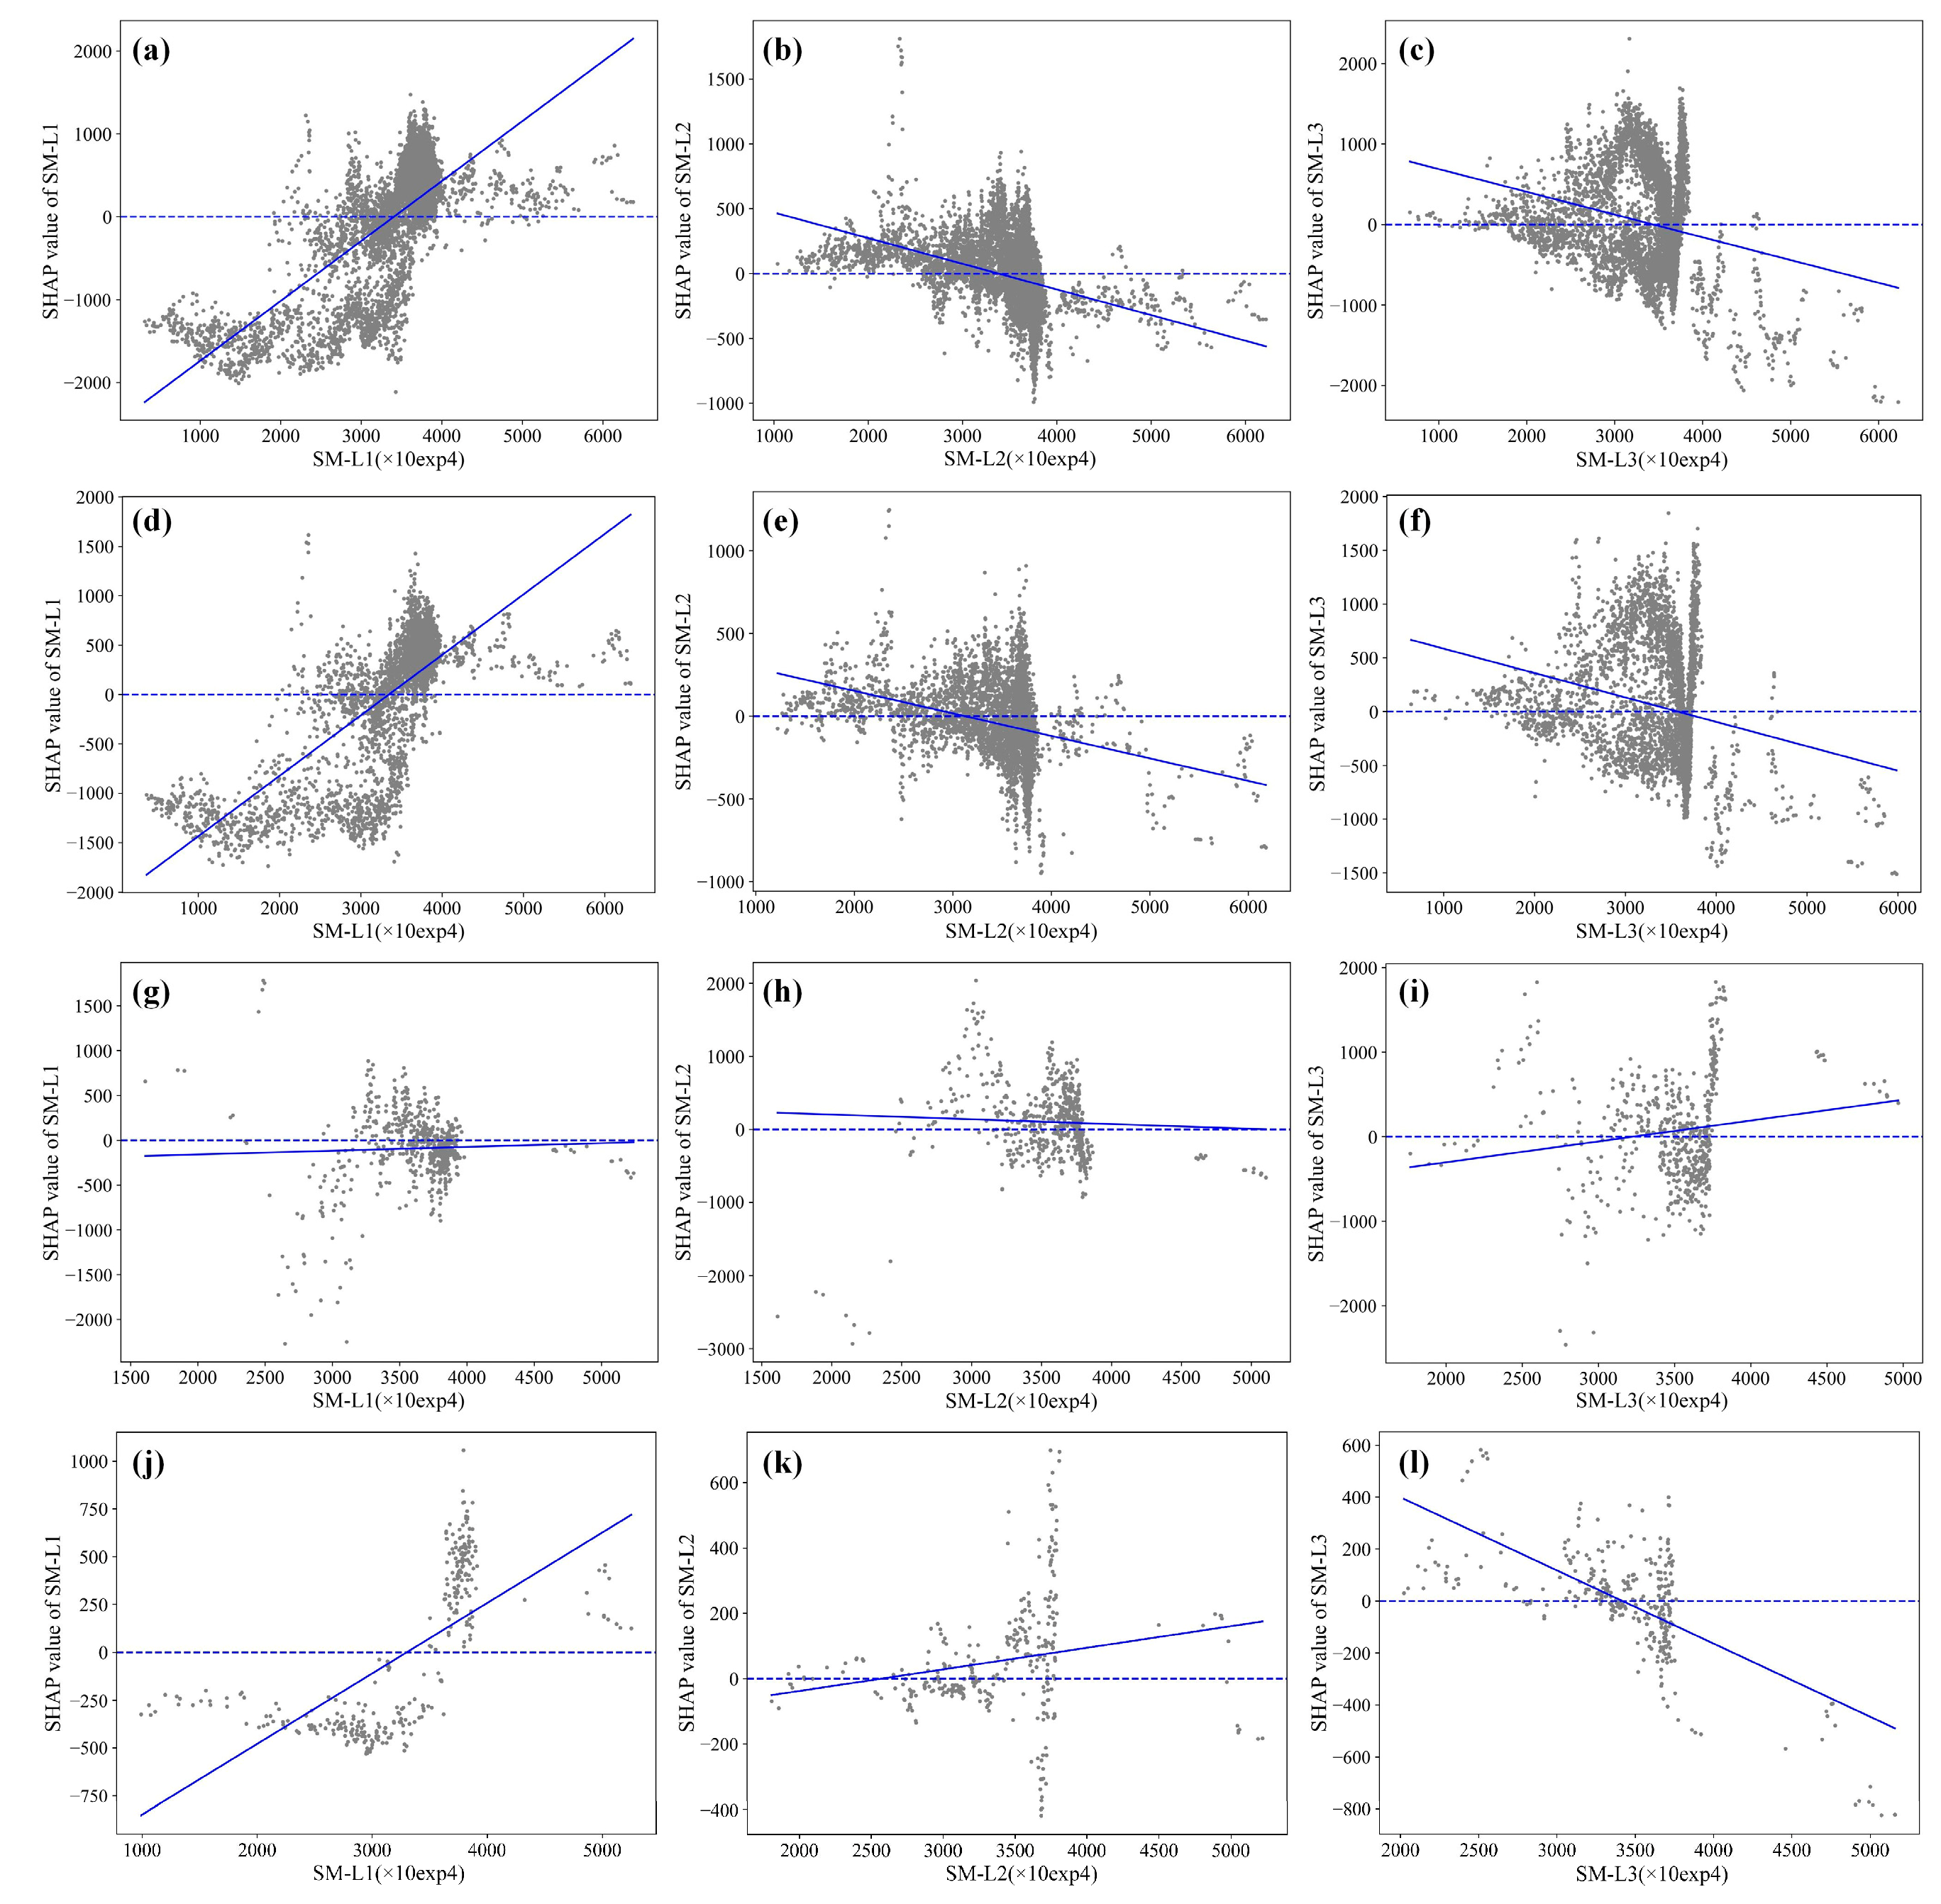
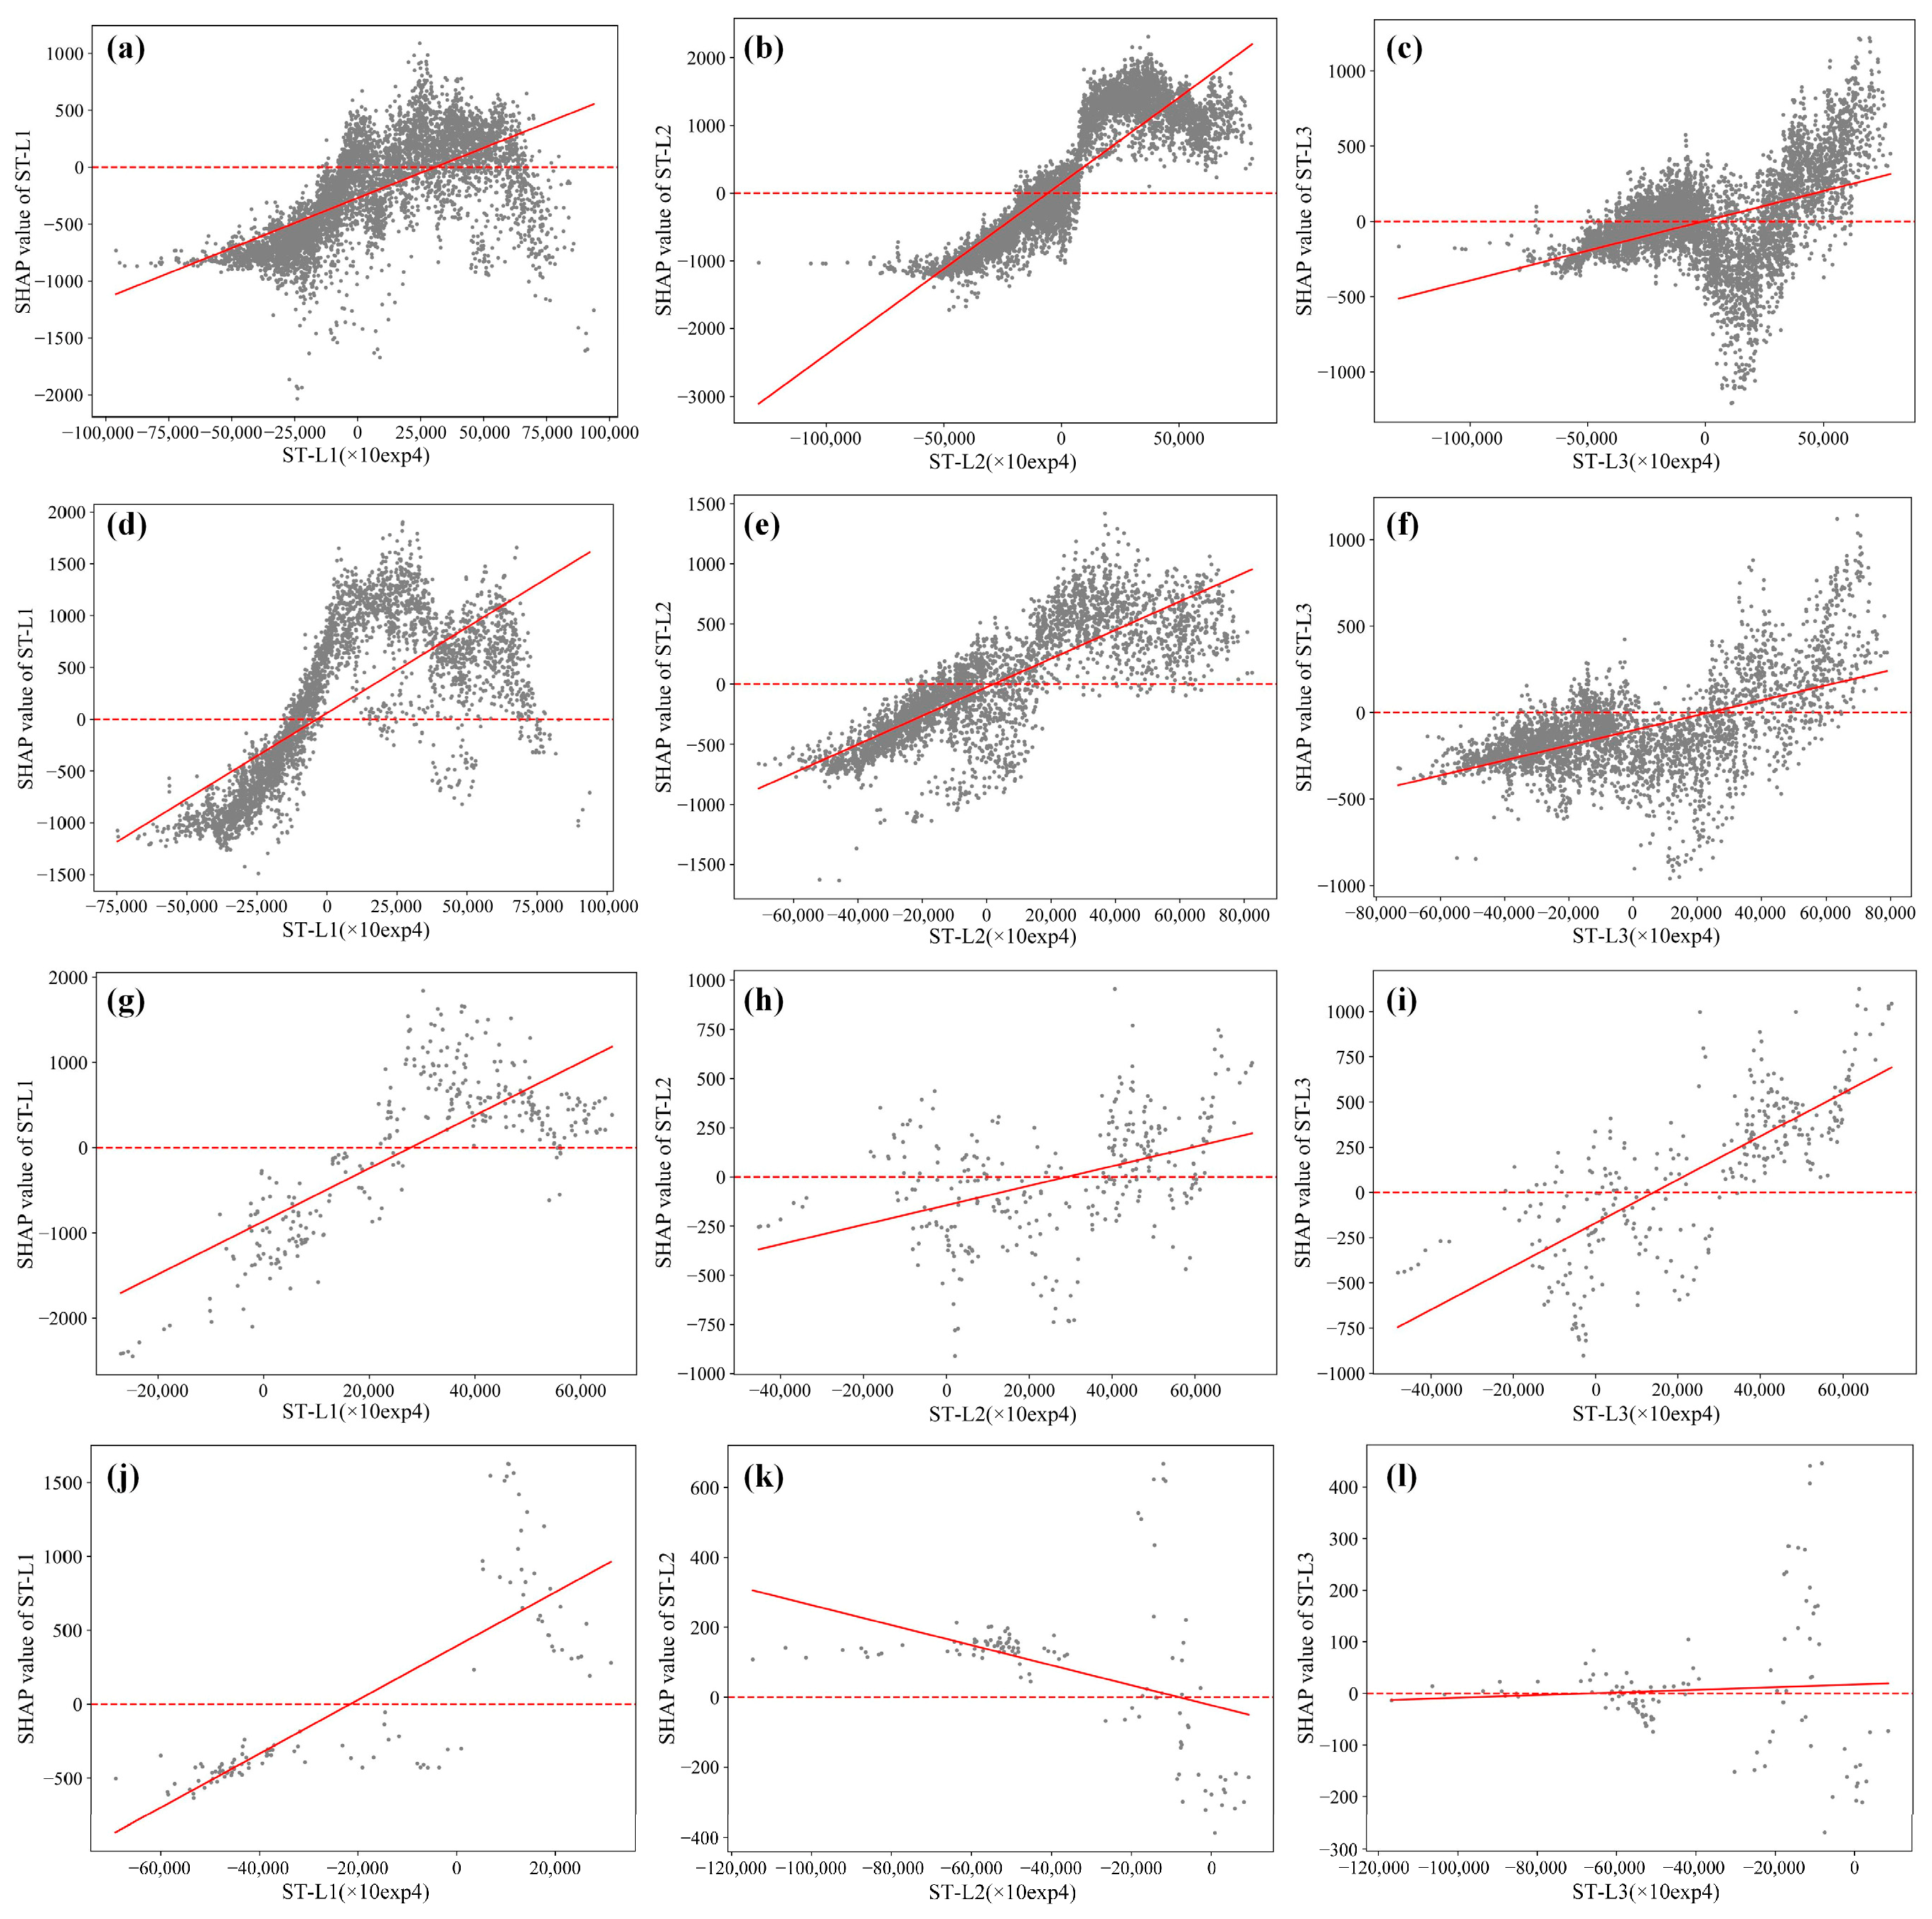
The Random Forest feature importance extraction provides evidence that the prominent feature variables influencing GPP are the deep soil moisture and the surface soil temperature. These results suggest that soil temperature may exert a non-linear influence on GPP while also confirming the stronger correlation between deep soil moisture and GPP.

Author Contributions

D.W., Conceptualization, Investigation, Writing—original draft; Y.Z. (Yang Zhang), Data curation, Investigation; Y.L., Validation; Y.Z. (Yun Zhang), Writing—reviewing and editing; B.W., Supervision. All authors have read and agreed to the published version of the manuscript.

Funding

This research received no external funding.

Data Availability Statement

Data are contained within the article.

Conflicts of Interest

The authors declare no conflict of interest.

References

  1. Dusenge, M.E.; Duarte, A.G.; Way, D.A. Plant carbon metabolism and climate change: Elevated CO2 and temperature impacts on photosynthesis, photorespiration and respiration. New Phytol. 2019, 221, 32–49. [Google Scholar] [CrossRef]
  2. Fu, Z.T.; Wu, Q.B.; Wang, L.Y.; Liu, Y.L. Response of soil hydrothermal processes within the active layer to variable alpine vegetation conditions on the Qinghai-Tibet Plateau. Adv. Clim. Chang. Res. 2023, 14, 200–212. [Google Scholar] [CrossRef]
  3. Zandalinas, S.I.; Mittler, R.; Balfagon, D.; Arbona, V.; Gomez-Cadenas, A. Plant adaptations to the combination of drought and high temperatures. Physiol. Plant. 2018, 162, 2–12. [Google Scholar] [CrossRef]
  4. Franks, P.J.; Farquhar, G.D. The mechanical diversity of stomata and its significance in gas-exchange control. Plant Physiol. 2007, 143, 78–87. [Google Scholar] [CrossRef] [PubMed]
  5. Lawson, T.; Matthews, J. Guard cell metabolism and stomatal function. Annu. Rev. Plant Biol. 2020, 71, 273–302. [Google Scholar] [CrossRef] [PubMed]
  6. Chai, Q.; Wang, T.; Di, C. Evaluating the impacts of environmental factors on soil moisture temporal dynamics at different time scales. J. Water Clim. Chang. 2021, 12, 420–432. [Google Scholar] [CrossRef]
  7. Hasanuzzaman, M.; Nahar, K.; Alam, M.M.; Roychowdhury, R.; Fujita, M. Physiological, biochemical, and molecular mechanisms of heat stress tolerance in plants. Int. J. Mol. Sci. 2013, 14, 9643–9684. [Google Scholar] [CrossRef]
  8. Xu, H.J.; Wang, X.P.; Yang, T.B. Trend shifts in satellite-derived vegetation growth in Central Eurasia, 1982–2013. Sci. Total Environ. 2017, 579, 1658–1674. [Google Scholar] [CrossRef]
  9. Piao, S.; Nan, H.; Huntingford, C.; Ciais, P.; Friedlingstein, P.; Sitch, S.; Peng, S.; Ahlstrom, A.; Canadell, J.G.; Cong, N.; et al. Evidence for a weakening relationship between interannual temperature variability and northern vegetation activity. Nat. Commun. 2014, 5, 5018. [Google Scholar] [CrossRef]
  10. Tai, X.; Epstein, H.E.; Li, B. Elevation and climate effects on vegetation greenness in an arid mountain-basin system of Central Asia. Remote Sens. 2020, 12, 1665. [Google Scholar] [CrossRef]
  11. Wang, H.; Liu, X.; Zhang, X.; Wang, P.; Lin, H.; Yu, L. Spatiotemporal crop NDVI responses to climatic factors in mainland China. Int. J. Remote Sens. 2019, 40, 89–103. [Google Scholar] [CrossRef]
  12. Xing, X.; Qian, J.; Chen, X.; Chen, C.; Sun, J.; Wei, S.; Yimamaidi, D.; Zhanar, Z. Analysis of effects of recent changes in hydrothermal conditions on vegetation in Central Asia. Land 2022, 11, 327. [Google Scholar] [CrossRef]
  13. Vicente-Serrano, S.M.; Gouveia, C.; Julio Camarero, J.; Begueria, S.; Trigo, R.; Lopez-Moreno, J.I.; Azorin-Molina, C.; Pasho, E.; Lorenzo-Lacruz, J.; Revuelto, J.; et al. Response of vegetation to drought time-scales across global land biomes. Proc. Natl. Acad. Sci. USA 2013, 110, 52–57. [Google Scholar] [CrossRef] [PubMed]
  14. Nemani, R.R.; Keeling, C.D.; Hashimoto, H.; Jolly, W.M.; Piper, S.C.; Tucker, C.J.; Myneni, R.B.; Running, S.W. Climate-driven increases in global terrestrial net primary production from 1982 to 1999. Science 2003, 300, 1560–1563. [Google Scholar] [CrossRef] [PubMed]
  15. Wang, Y.; Xiao, J.; Ma, Y.; Luo, Y.; Hu, Z.; Li, F.; Li, Y.; Gu, L.; Li, Z.; Yuan, L. Carbon fluxes and environmental controls across different alpine grassland types on the Tibetan Plateau. Agric. For. Meteorol. 2021, 311, 108694. [Google Scholar] [CrossRef]
  16. Fu, G.; Shen, Z.X. Environmental humidity regulates effects of experimental warming on vegetation index and biomass production in an alpine meadow of the Northern Tibet. PLoS ONE 2016, 11, e0165643. [Google Scholar] [CrossRef] [PubMed]
  17. Cui, X.; Xu, G.; He, X.; Luo, D. Influences of seasonal soil moisture and temperature on vegetation phenology in the Qilian Mountains. Remote Sens. 2022, 14, 3645. [Google Scholar] [CrossRef]
  18. Zhu, J.; Li, H.; He, H.; Zhang, F.; Yang, Y.; Li, Y. Interannual characteristics and driving mechanism of CO2 fluxes during the growing season in an alpine wetland ecosystem at the southern foot of the Qilian Mountains. Front. Plant Sci. 2022, 13, 1013812. [Google Scholar] [CrossRef]
  19. Liu, L.; Gudmundsson, L.; Hauser, M.; Qin, D.; Li, S.; Seneviratne, S.I. Soil moisture dominates dryness stress on ecosystem production globally. Nat. Commun. 2020, 11, 4892. [Google Scholar] [CrossRef]
  20. Mishra, V.; Ellenburg, W.L.; Markert, K.N.; Limaye, A.S. Performance evaluation of soil moisture profile estimation through entropy-based and exponential filter models. Hydrol. Sci. J. 2020, 65, 1036–1048. [Google Scholar] [CrossRef]
  21. Xiao, C.; Ji, Q.Y.; Zhang, F.C.; Li, Y.; Fan, J.L.; Hou, X.H.; Yan, F.L.; Liu, X.Q.; Gong, K.Y. Effects of various soil water potential thresholds for drip irrigation on soil salinity, seed cotton yield and water productivity of cotton in northwest China. Agric. Water Manag. 2023, 279, 108172. [Google Scholar] [CrossRef]
  22. Wang, Y.; Liu, X.; Lv, M.; Zhang, Z. Mechanisms and influencing factors of hydrothermal processes in active layer soils on the Qinghai-Tibet Plateau under freeze-thaw action. Catena 2023, 220, 106694. [Google Scholar] [CrossRef]
  23. He, P.; Zeng, Y.; Wang, N.; Han, Z.; Meng, X.; Dong, T.; Ma, X.; Ma, S.; Ma, J.; Sun, Z. Early evidence that soil dryness causes widespread decline in grassland productivity in China. Land 2023, 12, 484. [Google Scholar] [CrossRef]
  24. Bai, X.; Zhang, L.; He, C.; Zhu, Y. Estimating regional soil moisture distribution based on NDVI and land surface temperature time series data in the upstream of the Heihe River watershed, Northwest China. Remote Sens. 2020, 12, 2414. [Google Scholar] [CrossRef]
  25. Chen, T.; Xu, H.J.; Qi, X.L.; Shan, S.Y.; Chen, S.Y.; Deng, Y.F. Temporal dynamics of satellite-derived vegetation pattern and growth in an arid inland river basin, Tibetan Plateau. Glob. Ecol. Conserv. 2022, 38, e02262. [Google Scholar] [CrossRef]
  26. Chang, X.; Xing, Y.; Gong, W.; Yang, C.; Guo, Z.; Wang, D.; Wang, J.; Yang, H.; Xue, G.; Yang, S. Evaluating gross primary productivity over 9 ChinaFlux sites based on random forest regression models, remote sensing, and eddy covariance data. Sci. Total Environ. 2023, 875, 162601. [Google Scholar] [CrossRef]
  27. Muñoz-Sabater, J.; Dutra, E.; Agustí-Panareda, A.; Albergel, C.; Arduini, G.; Balsamo, G.; Boussetta, S.; Choulga, M.; Harrigan, S.; Hersbach, H. ERA5-Land: A state-of-the-art global reanalysis dataset for land applications. Earth Syst. Sci. Data 2021, 13, 4349–4383. [Google Scholar] [CrossRef]
  28. Liu, L.; Song, W.; Zhang, Y.; Han, Z.; Li, H.; Yang, D.; Wang, Z.; Huang, Q. Zoning of ecological restoration in the Qilian Mountain area, China. Int. J. Environ. Res. Public Health 2021, 18, 12417. [Google Scholar] [CrossRef]
  29. Du, J.; He, Z.; Yang, J.; Chen, L.; Zhu, X. Detecting the effects of climate change on canopy phenology in coniferous forests in semi-arid mountain regions of China. Int. J. Remote Sens. 2014, 35, 6490–6507. [Google Scholar] [CrossRef]
  30. Ma, Y.; Guan, Q.; Sun, Y.; Zhang, J.; Yang, L.; Yang, E.; Li, H.; Du, Q. Three-dimensional dynamic characteristics of vegetation and its response to climatic factors in the Qilian Mountains. Catena 2022, 208, 105694. [Google Scholar] [CrossRef]
  31. Turner, D.P.; Ritts, W.D.; Cohen, W.B.; Gower, S.T.; Running, S.W.; Zhao, M.; Costa, M.H.; Kirschbaum, A.A.; Ham, J.M.; Saleska, S.R. Evaluation of MODIS NPP and GPP products across multiple biomes. Remote Sens. Environ. 2006, 102, 282–292. [Google Scholar] [CrossRef]
  32. Cai, Z.; Junttila, S.; Holst, J.; Jin, H.; Ardo, J.; Ibrom, A.; Peichl, M.; Molder, M.; Jonsson, P.; Rinne, J.; et al. Modelling daily gross primary productivity with Sentinel-2 data in the nordic region-comparison with data from MODIS. Remote Sens. 2021, 13, 469. [Google Scholar] [CrossRef]
  33. Zha, X.; Xiong, L.; Liu, C.; Shu, P.; Xiong, B. Identification and evaluation of soil moisture flash drought by a nonstationary framework considering climate and land cover changes. Sci. Total Environ. 2023, 856, 158953. [Google Scholar] [CrossRef] [PubMed]
  34. Zhang, X. Vegetation Map of the People’s Republic of China (1:1,000,000); Geology Press: Beijing, China, 2007. [Google Scholar]
  35. Baniya, B.; Tang, Q.; Huang, Z.; Sun, S.; Techato, K. Spatial and temporal variation of NDVI in response to climate change and the implication for carbon dynamics in Nepal. Forests 2018, 9, 329. [Google Scholar] [CrossRef]
  36. Sen, P.K. Estimates of the regression coefficient based on Kendall’s tau. J. Am. Stat. Assoc. 1968, 63, 1379–1389. [Google Scholar] [CrossRef]
  37. Kendall, M.G. Rank Correlation Methods; Charles Griffin: London, UK, 1975. [Google Scholar]
  38. Pearson, K. On the criterion that a given system of deviations from the probable in the case of a correlated system of variables is such that it can be reasonably supposed to have arisen from random sampling. Lond. Edinb. Dublin Philos. Mag. J. Sci. 1900, 50, 157–175. [Google Scholar] [CrossRef]
  39. Scornet, E.; Biau, G.; Vert, J.-P. Consistency of random forests. Ann. Stat. 2015, 43, 1716–1741. [Google Scholar] [CrossRef]
  40. Georganos, S.; Grippa, T.; Vanhuysse, S.; Lennert, M.; Shimoni, M.; Kalogirou, S.; Wolff, E. Less is more: Optimizing classification performance through feature selection in a very-high-resolution remote sensing object-based urban application. GIScience Remote Sens. 2018, 55, 221–242. [Google Scholar] [CrossRef]
  41. Badih, G.; Pierre, M.; Laurent, B. Assessing variable importance in clustering: A new method based on unsupervised binary decision trees. Comput. Stat. 2019, 34, 301–321. [Google Scholar] [CrossRef]
  42. He, Y.; Jiang, X.; Wang, N.; Zhang, S.; Ning, T.; Zhao, Y.; Hu, Y. Changes in mountainous runoff in three inland river basins in the arid Hexi Corridor, China, and its influencing factors. Sustain. Cities Soc. 2019, 50, 101703. [Google Scholar] [CrossRef]
  43. Hao, W.; Li, B.; Xia, B.; Xu, M. Deep carbon dioxide flows substantially contributes to soil-atmosphere carbon flux from Robinia pseudoacacia forests. Ecol. Indic. 2022, 141, 109062. [Google Scholar] [CrossRef]
  44. Vogel, M.M.; Orth, R.; Cheruy, F.; Hagemann, S.; Lorenz, R.; van den Hurk, B.J.J.M.; Seneviratne, S.I. Regional amplification of projected changes in extreme temperatures strongly controlled by soil moisture-temperature feedbacks. Geophys. Res. Lett. 2017, 44, 1511–1519. [Google Scholar] [CrossRef]
  45. Zhu, X.; He, Z.; Du, J.; Chen, L.; Lin, P.; Tian, Q. Soil moisture temporal stability and spatio-temporal variability about a typical subalpine ecosystem in northwestern China. Hydrol. Process. 2020, 34, 2401–2417. [Google Scholar] [CrossRef]
  46. Liu, Y.; Liu, X.; Zhao, C.; Wang, H.; Zang, F. The trade-offs and synergies of the ecological-production-living functions of grassland in the Qilian mountains by ecological priority. J. Environ. Manag. 2023, 327, 116883. [Google Scholar] [CrossRef]
  47. Zhang, Y.; Kong, D.; Gan, R.; Chiew, F.H.S.; McVicar, T.R.; Zhang, Q.; Yang, Y. Coupled estimation of 500 m and 8-day resolution global evapotranspiration and gross primary production in 2002–2017. Remote Sens. Environ. 2019, 222, 165–182. [Google Scholar] [CrossRef]
  48. Zheng, Y.; Zhang, L.; Xiao, J.; Yuan, W.; Yan, M.; Li, T.; Zhang, Z. Sources of uncertainty in gross primary productivity simulated by light use efficiency models: Model structure, parameters, input data, and spatial resolution. Agric. For. Meteorol. 2018, 263, 242–257. [Google Scholar] [CrossRef]
  49. Xing, Z.; Fan, L.; Zhao, L.; De Lannoy, G.; Frappart, F.; Peng, J.; Li, X.; Zeng, J.; Al-Yaari, A.; Yang, K.; et al. A first assessment of satellite and reanalysis estimates of surface and root-zone soil moisture over the permafrost region of Qinghai-Tibet Plateau. Remote Sens. Environ. 2021, 265, 112666. [Google Scholar] [CrossRef]
  50. Chen, R.; Yang, M.; Wang, X.; Wan, G.; Li, H. Thermal regime variations of the uppermost soil layer in the central Tibetan Plateau. Catena 2022, 213, 106224. [Google Scholar] [CrossRef]
  51. Cheadle, C.; Vawter, M.P.; Freed, W.J.; Becker, K.G. Analysis of microarray data using Z score transformation. J. Mol. Diagn. 2003, 5, 73–81. [Google Scholar] [CrossRef]
  52. Liang, L.; Wang, Q.; Guan, Q.; Du, Q.; Sun, Y.; Ni, F.; Lv, S.; Shan, Y. Assessing vegetation restoration prospects under different environmental elements in cold and arid mountainous region of China. Catena 2023, 226, 107055. [Google Scholar] [CrossRef]
  53. Zhang, J.; Gou, X.; Manzanedo, R.D.; Zhang, F.; Pederson, N. Cambial phenology and xylogenesis of Juniperus przewalskii over a climatic gradient is influenced by both temperature and drought. Agric. For. Meteorol. 2018, 260, 165–175. [Google Scholar] [CrossRef]
  54. Wu, J.; Sheng, Y.; Wu, Q.; Wen, Z. Processes and modes of permafrost degradation on the Qinghai-Tibet Plateau. Sci. China-Earth Sci. 2010, 53, 150–158. [Google Scholar] [CrossRef]
  55. Wang, Q.; Yang, Q.; Guo, H.; Xiao, X.; Jin, H.; Li, L.; Zhang, T.; Wu, Q. Hydrothermal variations in soils resulting from the freezing and thawing processes in the active layer of an alpine grassland in the Qilian Mountains, northeastern Tibetan Plateau. Theor. Appl. Climatol. 2019, 136, 929–941. [Google Scholar] [CrossRef]
  56. Fu, Q.; Hou, R.; Li, T.; Wang, M.; Yan, J. The functions of soil water and heat transfer to the environment and associated response mechanisms under different snow cover conditions. Geoderma 2018, 325, 9–17. [Google Scholar] [CrossRef]
  57. Matsumura, S.; Yamazaki, K. A longer climate memory carried by soil freeze-thaw processes in Siberia. Environ. Res. Lett. 2012, 7, 045402. [Google Scholar] [CrossRef]
  58. Tan, B.; Wu, F.Z.; Yang, W.Q.; He, X.H. Snow removal alters soil microbial biomass and enzyme activity in a Tibetan alpine forest. Appl. Soil Ecol. 2014, 76, 34–41. [Google Scholar] [CrossRef]
  59. Zheng, C.; Tang, X.; Gu, Q.; Wang, T.; Wei, J.; Song, L.; Ma, M. Climatic anomaly and its impact on vegetation phenology, carbon sequestration and water-use efficiency at a humid temperate forest. J. Hydrol. 2018, 565, 150–159. [Google Scholar] [CrossRef]
  60. Chen, L.F.; He, Z.B.; Zhu, X.; Du, J.; Yang, J.J.; Li, J. Impacts of afforestation on plant diversity, soil properties, and soil organic carbon storage in a semi-arid grassland of northwestern China. Catena 2016, 147, 300–307. [Google Scholar] [CrossRef]
  61. Sun, W.; Song, X.; Mu, X.; Gao, P.; Wang, F.; Zhao, G. Spatiotemporal vegetation cover variations associated with climate change and ecological restoration in the Loess Plateau. Agric. For. Meteorol. 2015, 209, 87–99. [Google Scholar] [CrossRef]
  62. Lundberg, S.M.; Erion, G.; Chen, H.; DeGrave, A.; Prutkin, J.M.; Nair, B.; Katz, R.; Himmelfarb, J.; Bansal, N.; Lee, S.-I. From local explanations to global understanding with explainable AI for trees. Nat. Mach. Intell. 2020, 2, 56–67. [Google Scholar] [CrossRef]
  63. Park, J.; Lee, W.H.; Kim, K.T.; Park, C.Y.; Lee, S.; Heo, T.-Y. Interpretation of ensemble learning to predict water quality using explainable artificial intelligence. Sci. Total Environ. 2022, 832, 155070. [Google Scholar] [CrossRef] [PubMed]
  64. Chang, I.; Park, H.; Hong, E.; Lee, J.; Kwon, N. Predicting effects of built environment on fatal pedestrian accidents at location-specific level: Application of XGBoost and SHAP. Accid. Anal. Prev. 2022, 166, 106545. [Google Scholar] [CrossRef] [PubMed]
  65. Yang, Y.; Yuan, Y.; Han, Z.; Liu, G. Interpretability analysis for thermal sensation machine learning models: An exploration based on the SHAP approach. Indoor Air 2022, 32, e12984. [Google Scholar] [CrossRef] [PubMed]
Figure 1. The geographical location of the Qilian Mountains area.
Forests 14 02422 g001
Figure 2. The background investigation of soil moisture across three layers, including (ac) spatial pattern of multi-year average values and (df) spatial pattern of interannual variation trends.
Forests 14 02422 g002
Figure 3. The background investigation of soil temperature across three layers, including (ac) spatial pattern of multi-year average values and (df) spatial pattern of interannual variation trend.
Forests 14 02422 g003
Figure 4. The background investigation of GPP across three layers, including (a) spatial pattern of multi-year average values and (b) spatial pattern of interannual variation trend.
Forests 14 02422 g004
Figure 5. Spatial pattern of the correlation coefficients between soil hydrothermal conditions and GPP, (ac) soil moisture, and (df) soil temperature in different layers.
Forests 14 02422 g005
Figure 6. Spatial distribution and GPP multi-year average values of different dominant vegetation types in the Qilian Mountains area.
Forests 14 02422 g006
Figure 7. Feature importance of the regulations of soil hydrothermal conditions on GPP, (a) soil moisture, (b) soil temperature.
Forests 14 02422 g007
Figure 8. Interannual fluctuations of normalized values of the soil hydrothermal conditions across three layers: (ac) is soil moisture at different depths, (df) is soil temperature at different depths.
Forests 14 02422 g008
Figure 9. Interannual fluctuation of normalized values of GPP in the Qilian Mountains vegetation zone.
Forests 14 02422 g009
Figure 10. Influence degree threshold analysis of soil moisture values in different dominant vegetation areas: (ac) vegetation zone, (df) grassland, (gi) shrub, and (jl) alpine.
Forests 14 02422 g010
Figure 11. Influence degree threshold analysis of soil temperature values in different dominant vegetation areas: (ac) vegetation zone, (df) grassland, (gi) shrub, and (jl) alpine.
Forests 14 02422 g011
Table 1. Statistical analysis of interannual variation trend in soil moisture, soil temperature, and GPP.
TrendSM-L1SM-L2SM-L3ST-L1ST-L2ST-L3GPP
Unchanged1.17%1.17%1.17%1.17%1.17%1.17%23.45%
No significant decrease41.13%35.10%27.72%5.38%4.69%3.48%0.75%
Slight significant decrease4.53%3.37%3.04%0.00%0.00%0.00%0.06%
Significant decrease4.27%2.66%3.30%0.00%0.00%0.00%0.07%
Extremely significant decrease0.84%0.71%0.91%0.00%0.00%0.00%0.11%
No significant increase37.89%35.36%28.04%60.62%57.62%55.19%9.02%
Slight significant increase4.73%9.97%4.99%12.50%12.87%14.66%5.32%
Significant increase3.95%9.07%7.77%13.54%16.51%17.59%15.57%
Extremely significant increase1.49%2.59%23.06%6.80%7.14%7.90%45.65%
Table 2. Correlation coefficients between GPP and soil hydrothermal conditions validated by the double-tailed t-test.
Soil Hydrothermal ConditionsSoil LayerCorrelation Coefficient
Soil moistureSM-L10.0945 *
SM-L20.3176 *
SM-L30.5076 *
Soil temperatureST-L10.5566 *
ST-L20.5539 *
ST-L30.5480 *
* means the correlation is significant at the 0.05 level.
Table 3. Correlation coefficients between GPP and soil hydrothermal conditions (validated by the double-tailed t-test).
Soil Hydrothermal ConditionsSoil LayerGrasslandShrubAlpine
Soil moistureSM-L10.12980.0101−0.2480
SM-L20.34200.27540.0074
SM-L30.51690.47840.3678
Soil temperatureST-L10.55770.55390.5529
ST-L20.55460.55310.5558
ST-L30.54930.54270.5487
Disclaimer/Publisher’s Note: The statements, opinions and data contained in all publications are solely those of the individual author(s) and contributor(s) and not of MDPI and/or the editor(s). MDPI and/or the editor(s) disclaim responsibility for any injury to people or property resulting from any ideas, methods, instructions or products referred to in the content.

