Article

Geographic Variation in Progeny: Climatic and Soil Changes in Offspring Size and Colour in Four Sorbus spp. (Rosaceae)

1
College of Forestry, Shanxi Agriculture University, Jinzhong 030801, China
2
Shanxi Academy of Forestry and Grassland Sciences, Taiyuan 030012, China
*
Author to whom correspondence should be addressed.
Forests 2023, 14(12), 2390; https://doi.org/10.3390/f14122390
Submission received: 26 October 2023 / Revised: 28 November 2023 / Accepted: 1 December 2023 / Published: 7 December 2023
(This article belongs to the Section Forest Ecology and Management)

Abstract

:
To investigate resource allocation and adaptation strategies of Sorbus spp. under different environment and soil conditions, four Sorbus L. species (Sorbus hupehensis C. K. Schneid, Sorbus pohuashanensis (Hance) Hedl, Sorbus discolor (Maxim.) Maxim, Sorbus koehneana C. K. Schneid) were selected as the study materials. Phenotypic traits including seed mass, fruit mass, and fruit colour were measured and analyzed. Linear Mixed-Effects Models were employed to analyze the associations between phenotypic traits and the environment, and the Maxent model was used to predict the potential distribution areas. Our study reveals that Sorbus spp. tend to prioritize seed production to increase their survival ability in nutrient-poor environments, while they tend to lean towards fruit production in nutrient-rich environments. Specifically, S. pohuashanensis has fruit skin rich in carotenoids and anthocyanins, with the degree of fruit colouration being positively correlated with the environmental suitability. However, the other three spp. demonstrate the opposite pattern. S. pohuashanensis is found to be most suitable for growth in mountainous areas around 40° N, and it is adapted to low temperatures. S. hupehensis prefers warm regions and is distributed in southern Shanxi, while S. discolor has a wider range of adaptability. These results provide a scientific basis for the protection and rational utilization of Sorbus spp. by elucidating their ecological adaptation abilities.

1. Introduction

The genus Sorbus L., a deciduous tree or shrub in the subfamily Maloideae of the Rosaceae family, exhibits colour-changing leaves and dense inflorescence with white flowers that develop into pear-shaped fruits, ranging in colour from white to red or yellow. This genus is renowned for its excellent horticultural attributes, providing aesthetic value throughout the seasons with spring and summer blossoms, as well as autumn and winter foliage and fruit observation [1]. The fruits of plants in the Sorbus genus are rich in various vitamins and have effects such as reducing cough and asthma, as well as antioxidation. They can be used to make food and medicine [2]. In addition, plants from the Sorbus genus have a beautiful crown shape, and their fruits have diverse colours and ornamental value. Due to their strong resistance, they are suitable for greening in factories and urban streets. With over 100 species, Sorbus plants are distributed across Asia, Europe, and North America [3,4], with approximately 67 species found within China, primarily concentrated in the northern and northeastern regions. These plants typically grow in mountainous areas at an altitude of around 1000 m. Due to the strong seed dormancy and limited natural reproductive ability, the natural population of Sorbus species is small. Additionally, they face challenges such as animal grazing, restricted growth environments, and ecological damage, making natural regeneration difficult [5]. Studying the phenotypic traits of Sorbus seeds and fruits is important for understanding the genetic and adaptive variations within different species and for the conservation and widespread utilization of these valuable genetic resources. By observing and intervening in behavioural patterns during the reproductive process, potential behaviours that may cause detrimental effects can be identified. This research not only enhances the breeding and genetic inheritance of superior varieties, but also effectively addresses the negative impacts of the natural environment and external pressures on reproduction. With the help of statistical data, we can more effectively select suitable plant species for landscaping and ecological restoration projects in practical production, thereby improving plant survival rates and growth conditions, and promoting the construction and restoration of ecosystems.
To reveal the morphological, structural, and functional differences among individuals within species and their genetic and environmental basis, the study of phenotypic diversity has become an essential approach [6]. Seeds and fruits serve as vital reproductive structures in plant phenotypic diversity and play a crucial role in population survival and reproduction. They possess significant morphological features that contribute to species genetics [7,8]. Seed size has long been regarded as an indicator of plant fitness, holding great importance in evolutionary and ecological research. Larger offspring tend to possess relatively higher energy reserves during the independent phase, possibly explaining their superior performance compared to smaller offspring [9]. Phenotypic variation in seed mass can further influence germination timing, dispersal distance, demography, and ultimately impact population and community dynamics in plant populations [10]. Moreover, seed mass strongly influences plant distribution and is frequently employed as an indicator of disturbance in ecological classification schemes [11]. Climate and soil conditions are identified as primary determinants of seed bank diversity, while net primary productivity and soil characteristics serve as key predictors of seed bank density [12]. Fruit size and colour are important indicators of fruit quality and significantly affect species distribution and evolution, particularly as they relate to frugivores as dispersal agents [13,14]. Current research on the Sorbus genus primarily focuses on environmental stress [15,16], chemical composition [17,18], and seed propagation [19]. Limited studies have reported on the phenotypic trait differences within the Sorbus genus, and existing analytical methods often disregard the multi-level structure of the data, increasing the risk of biased results and misjudgment. Therefore, this study selects seeds and fruits of four widespread Sorbus spp. in Shanxi Province, namely, Sorbus hupehensis C. K. Schneid, Sorbus pohuashanensis (Hance) Hedl, Sorbus discolor (Maxim.) Maxim, and Sorbus koehneana C. K. Schneid, encompassing 71 families from seven provenances. The objective of this study is to investigate the following issues:
(1)
How do the seed and fruit mass of four Sorbus spp. vary across different environmental and soil conditions?
(2)
How does the seed-to-fruit mass ratio of four Sorbus spp. vary across different environmental and soil conditions?
(3)
How does the fruit colour of four Sorbus spp. vary across different environmental and soil conditions?
To address these questions, this study utilized a combination of Linear Mixed-Effects Models and Maxent models to analyze the correlation between phenotypic traits and environmental factors. The Linear Mixed-Effects Model [20,21] effectively handles issues of nested and non-independent data, thereby avoiding estimation biases caused by correlations and improving the efficiency and accuracy of parameter estimation. This model has been widely used in the forestry field. Abigail S. Potts employed a linear mixed-effects model to assess the influence of the interaction between milkweed maternal genotype and growing location (environment) on traits such as initial leaf growth rate, leaf yield, and plant size (height, leaf number, diameter). The study results indicate that environmental factors play a more significant role in phenotypic trait variation within this population [22]. Erik Westberg et al. investigated the population of Eruca sativa using a linear mixed model and found that the phenotypic variation of plant populations in the Eastern Mediterranean region is mainly correlated with climatic conditions, with soil factors also influencing the variation to some extent [23]. By integrating the Maxent model, the potential distribution range of Sorbus spp. in Shanxi and surrounding areas could be predicted, which holds crucial implications for optimizing resource utilization and managing ecosystem conservation. Simultaneously, understanding the resource allocation strategies and variations in resource utilization during plant reproduction is critical for revealing the ecological adaptability and competitive strategies of plants. Shedding light on the mechanisms behind these phenomena can provide valuable scientific evidence for ecological preservation, resource management, and the sustainable utilization of natural resources.

2. Materials and Methods

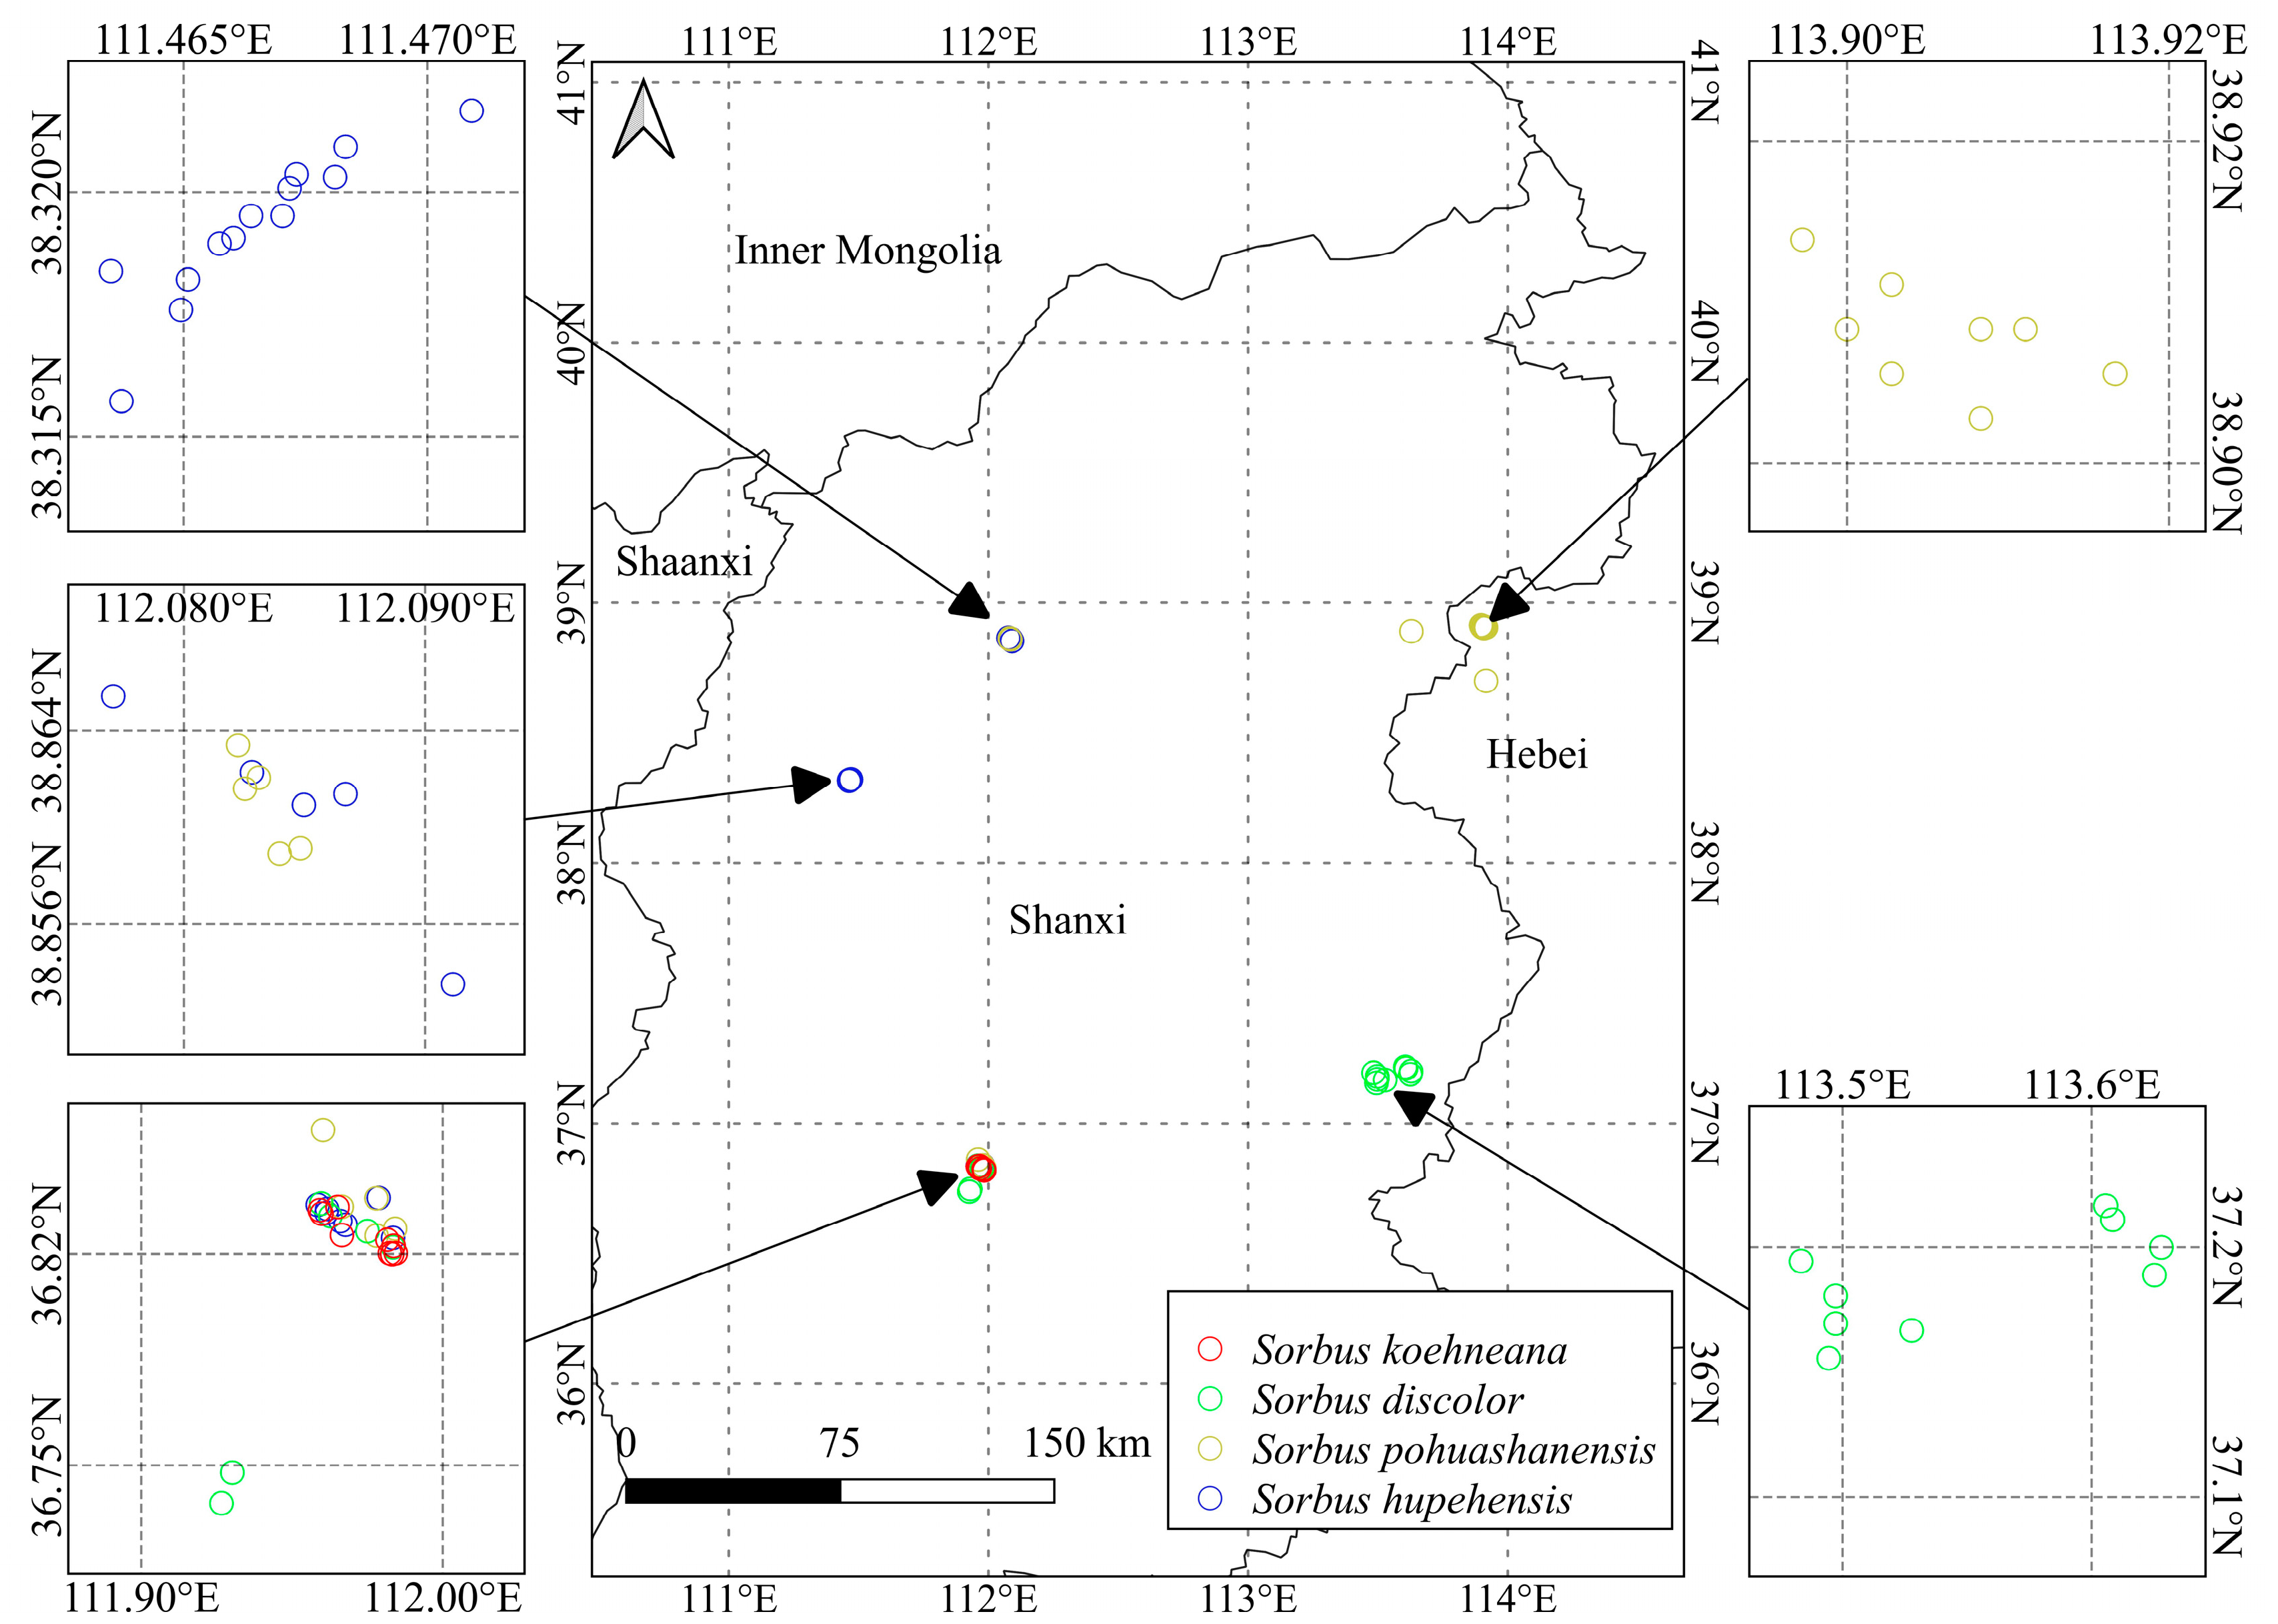
2.1. Territory Studied

This region is located in the central–north part of China, between 110°14′-114°33′ east longitude and 34°34′–40°44′ north latitude. It has a temperate continental climate characterized by aridness, coldness, and four distinct seasons. The average elevation is around 1000 m, with predominantly mountainous and plateau terrain. The dominant soil type is loam, and for more specific information please refer to Table 1.

2.2. Material Collection

According to the natural distribution patterns of Sorbus genus plants [24], sampling was conducted in autumn of 2022 from seven provenances, namely Heicha Mountain (HC), Luya Mountain (LYS), Taiyue Mountain (TY), Lingshi County (LS), Wutai Forestry Bureau (WT), Zuoquan County (ZQ), and Shigao Mountain (SG). Each provenance was sampled by selecting well-grown maternal plants with a minimum spacing of 50 m to avoid kinship. Mature fruits were collected from each individual plant and used as experimental subjects (Figure 1). Morphological characteristics, including leaves, bark, and fruit, were classified and identified, resulting in a total of four species, namely, Sorbus hupehensis, Sorbus pohuashanensis, Sorbus discolor, and Sorbus koehneana, comprising 71 families. Specifically, Heicha Mountain contained 13 families, Luya Mountain contained 10 families, Taiyue Mountain contained 12 families, Lingshi County contained 14 families, Wutai Forestry Bureau contained 11 families, Zuoquan County contained 9 families, and Shigao Mountain contained 2 families. Detailed information on each provenance is presented in Table 1. The collected fruits were promptly placed in a low-temperature safe box, transported back to the laboratory within 24 h, and then measured and analyzed.

2.3. Fruit Parameter Measurement

This research involved the selection of 30 mature and rounded fruits. A stereomicroscope (SZ810, produced by Chongqing Optec Instrument Co., Ltd., Chongqing, China), was used to capture fruit images. The Image J software (developed by Rasband, W.S. at the National Institutes of Health, Java 1.8.0_322) was then applied to analyze the images and determine the RGB colour information of the fruits (with DNR, DNG, and DNB representing the digital numbers in the red, green, and blue colour channels, respectively). Additionally, a 1/1000 electronic balance (manufactured by Ohaus Corporation in the United States) was employed to measure the mass of each fruit.

2.4. Seed Parameter Measurement

The collected fruits were subjected to immersion, allowing them to decompose, and subsequently hand-rubbed to extract the seeds. The extracted seeds were then washed in distilled water. For each breeding line, 30 mature and plump seeds were selected for parameter measurements. The weight of each individual seed was determined using an electronic balance with a precision of 1/1000.

2.5. Measurement of Fruit Peel Pigment Parameters

After sterilizing and cleaning the fruit peel with sterile water, 0.2 g of the sample was weighed and ground using liquid nitrogen. Subsequently, it was immersed in 10 mL of 80% acetone solution for a 24-h period in a light-avoiding room at room temperature. The absorbance values were 663 nm, 646 nm, and 470 nm, and the contents of carotenoids were calculated according to the methods proposed by Lichtenthal [25]. A total of 0.2 g of the sample was taken, ground, and submerged in a 10 mL mixture of 1% (v/v) HCI: MeOH (1:99, v/v). After being kept in darkness at 4 °C for 24 h, it was centrifuged for 15 min at a speed of 3500 rpm. The absorbance values of the supernatant were measured at wavelengths of 530 nm and 657 nm following the procedure described by Zhang et al. to determine the content of anthocyanins [26,27].

2.6. Extraction and Screening of Environmental Factors

Based on the maternal plant’s latitude and longitude, we extracted 11 temperature factors and 8 precipitation factors from the WorldClim 2.1 database at a resolution of 10′ (http://www.worldclim.org, accessed on 5 November 2022). N, P, K, CEC (Cation Exchange Capacity, See Table 2), and pH were extracted from the basic soil property dataset of the high-resolution China dataset with a 250 m spatial resolution [28,29]. Soil indicator data were extracted using QGIS software (3.28.3). Multicollinearity was addressed by excluding one variable from pairs with a correlation coefficient greater than 0.8, based on the variable’s impact on the target traits. Ultimately, 7 climate variables and 5 soil variables were retained for analysis (Table 2).

2.7. Data Statistics and Analysis

The average values, standard deviations, and coefficient of variation (CV) were computed to analyze the differences among various provenances. The calculation formulas used were as follows: CV = (standard deviation of each indicator/average value of each indicator) × 100%.
A linear mixed-effects model to investigate the impact of climate and soil factors on phenotypic indicators was used. The model comprises two components: fixed effects and random effects. The fixed effects encompass climate and soil factors, which are utilized to predict the influence of independent variables on the average dependent variable. The random effects account for the fluctuations in provenance and family factors and enable a more precise characterization of their impact on the data. To assess the suitability of the model, the significance of the random effects is tested based on the AIC criterion, and a random intercept model is employed. The formula for the mixed effects model is as follows:
Y = a0 + a1 × X + bprovenance + bfamily + ε
where X represents fixed effects, a1 represents the fixed effect coefficient, Y represents the dependent variable, a0 represents the model intercept, bprovenance and bfamily represent the random effects, and ε represents the error term.
R (v. 4.2.3, R Core Team, 2017) was employed for all computations. The “lme4” package was utilized for the execution of the mixed-effect model, and the “sjPlot” and “ggplot2” packages were utilized for the generation of the resultant plots.

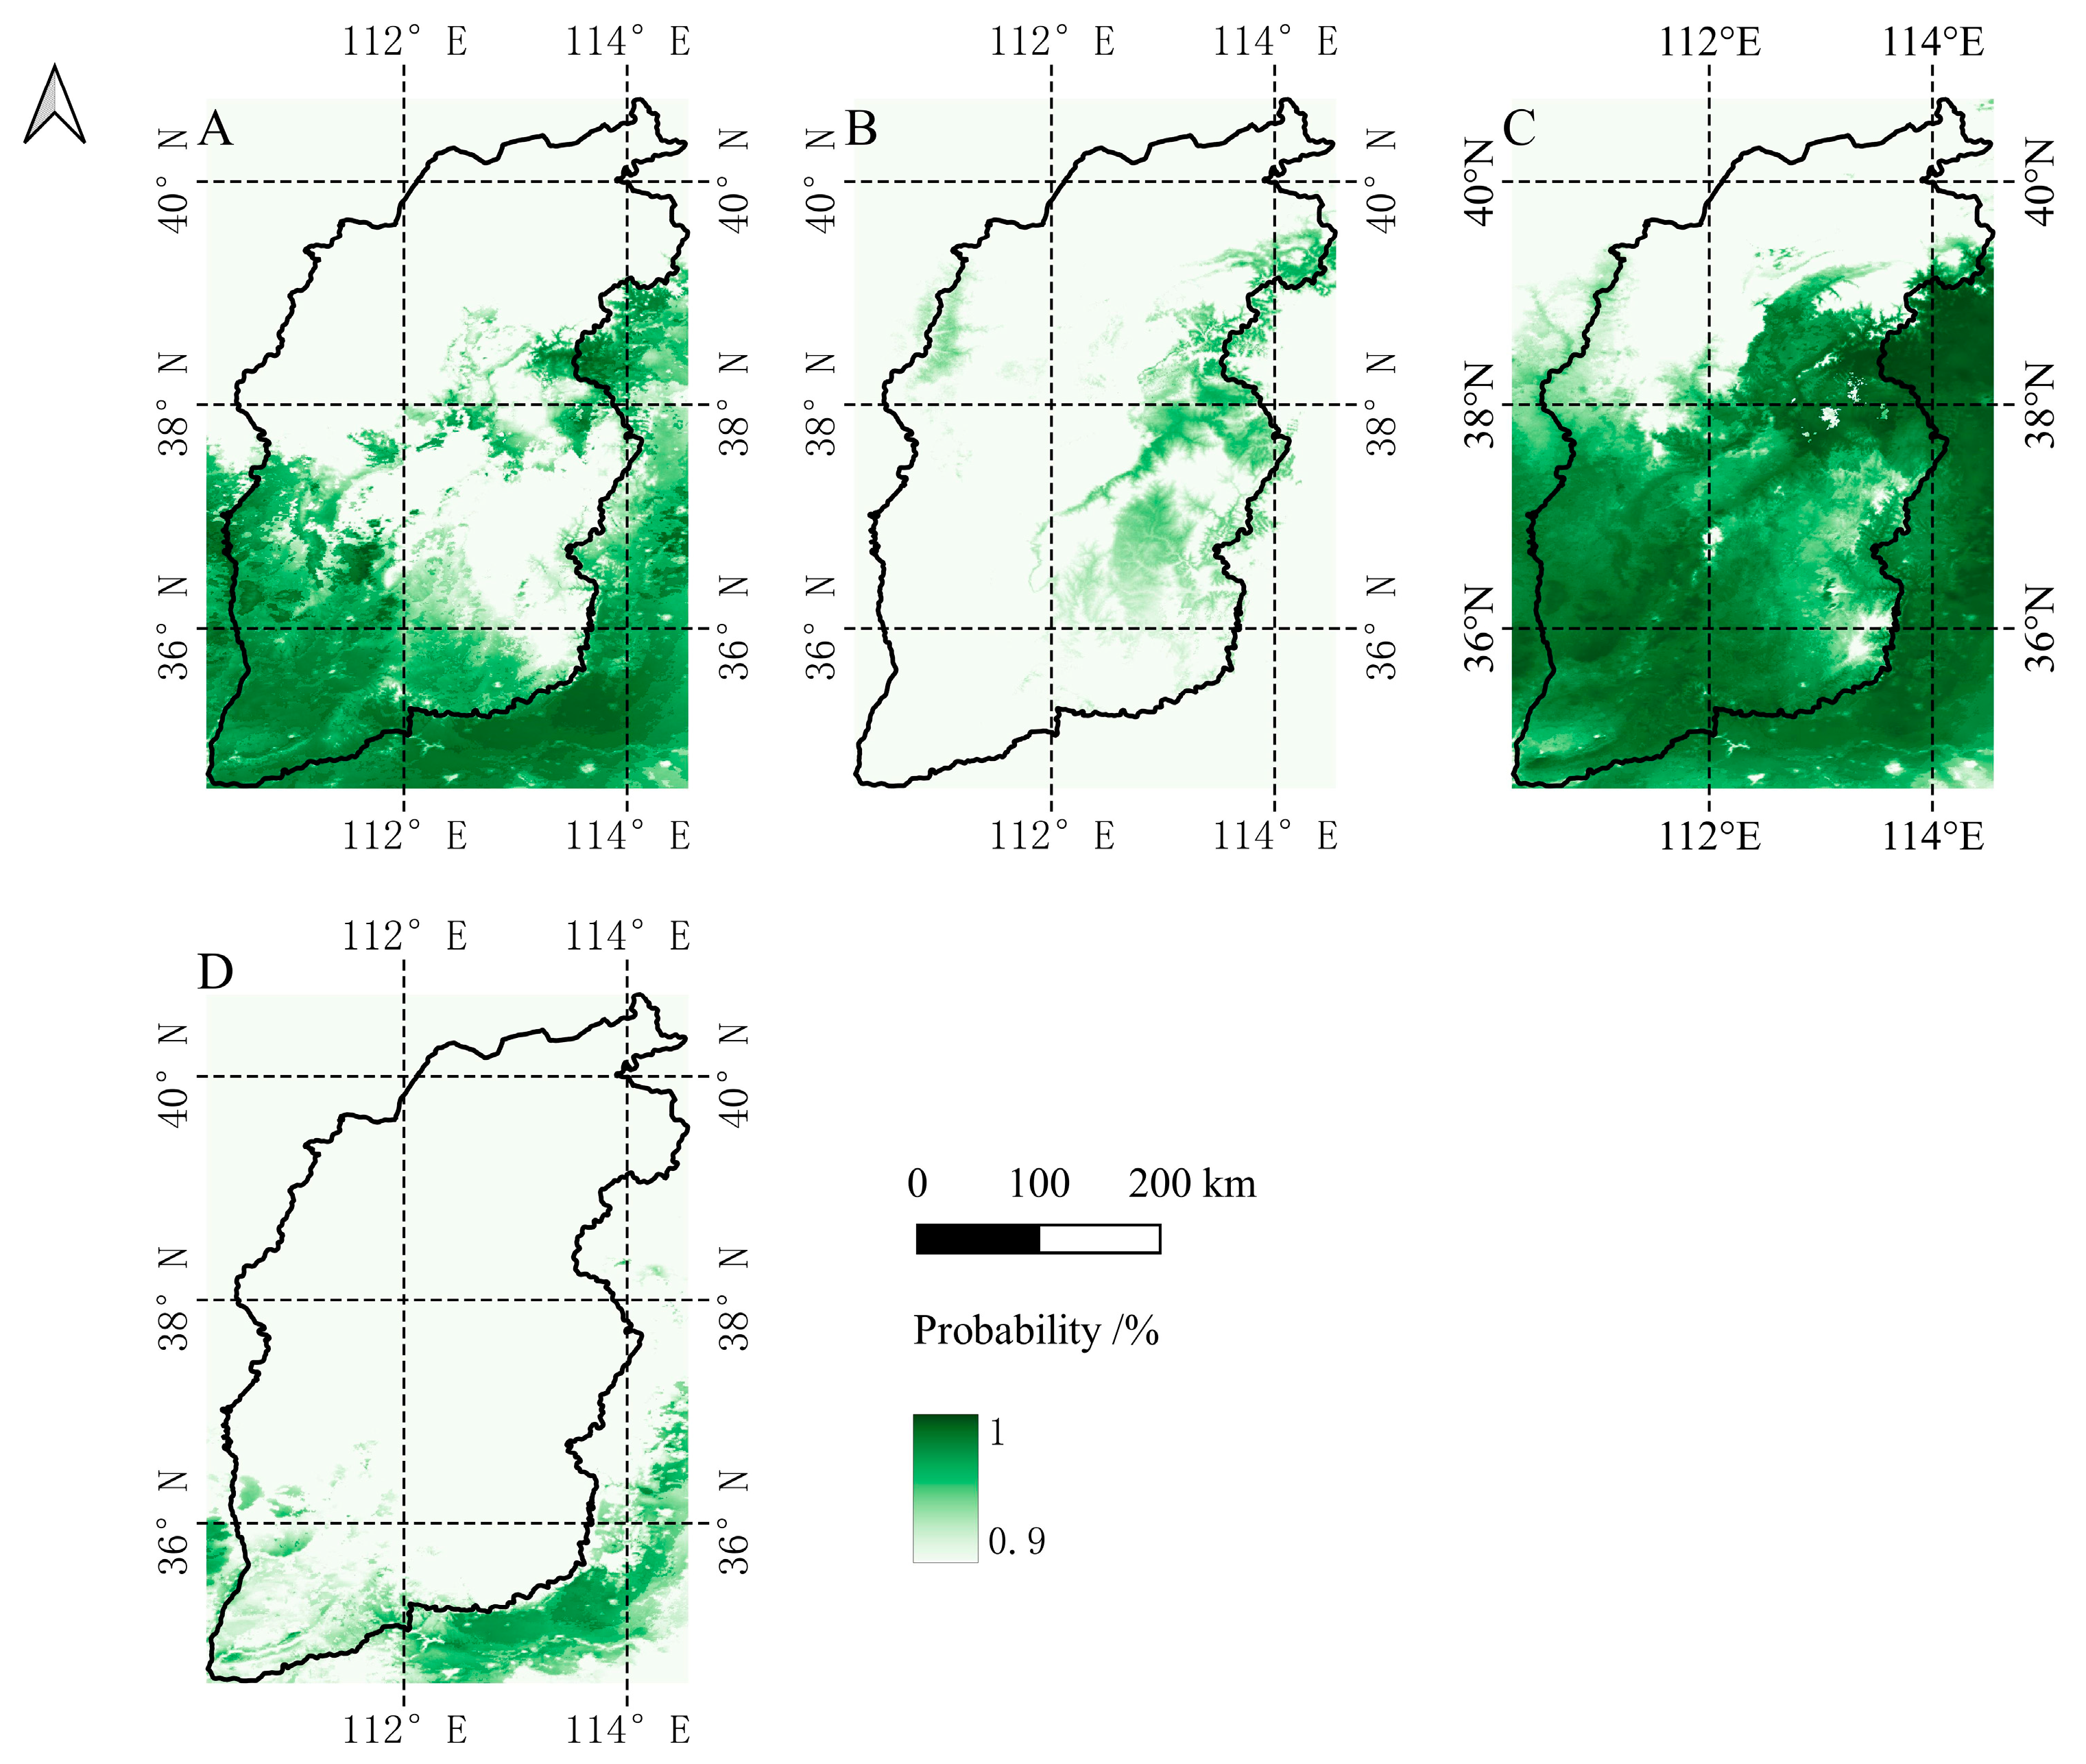
2.8. Maxent Model Prediction Analysis

A total of 860 valid distribution points for the Sorbus were obtained from the Global Biodiversity Information Facility (GBIF, www.gbif.org, accessed on 18 July 2023), with 177 distribution points for S. hupehensis, 185 distribution points for S. pohuashanensis, 129 distribution points for S. discolor, and 369 distribution points for S. koehneana. Spatially replicated data exclusion was performed using the “ecospat” package in R. The geographical coordinates of the Sorbus distribution points, along with environmental variables, were used as inputs for Maxent modeling. The probability map of Sorbus distribution points in Shanxi and its surrounding areas is shown in Figure 2.

3. Results

3.1. Phenotypic Variations in Seed and Fruit Traits

The research indicates significant interspecific variations among the four species of Sorbus in terms of seed and fruit mass, as well as fruit colour. Notably, the degree of variation in the seed-to-fruit mass ratio is the highest, followed by fruit mass and seed mass. In relation to fruit colour, the variations primarily concentrate in the blue component, followed by the green component, with the red component exhibiting the smallest coefficient of variation (Table 3).

3.2. Variations in Peel Pigment and Fruit Colour

The research findings demonstrate a significant correlation between the colour intensity of Sorbus fruit peel and the content of carotenoids and anthocyanins. By referring to Figure 3, it is evident that S. pohuashanensis exhibits the highest level of colour intensity, with fruit colours ranging from red to orange. In contrast, S. hupehensis displays white-coloured fruits with a tinge of pink. On the other hand, both S. discolor and S. koehneana present white-coloured fruits. In terms of pigment content (refer to Table 4), S. pohuashanensis contains the highest levels of carotenoids and anthocyanins, followed by S. hupehensis, while S. discolor and S. koehneana exhibit the lowest pigment content. Therefore, these results align with the observed fruit peel colours.

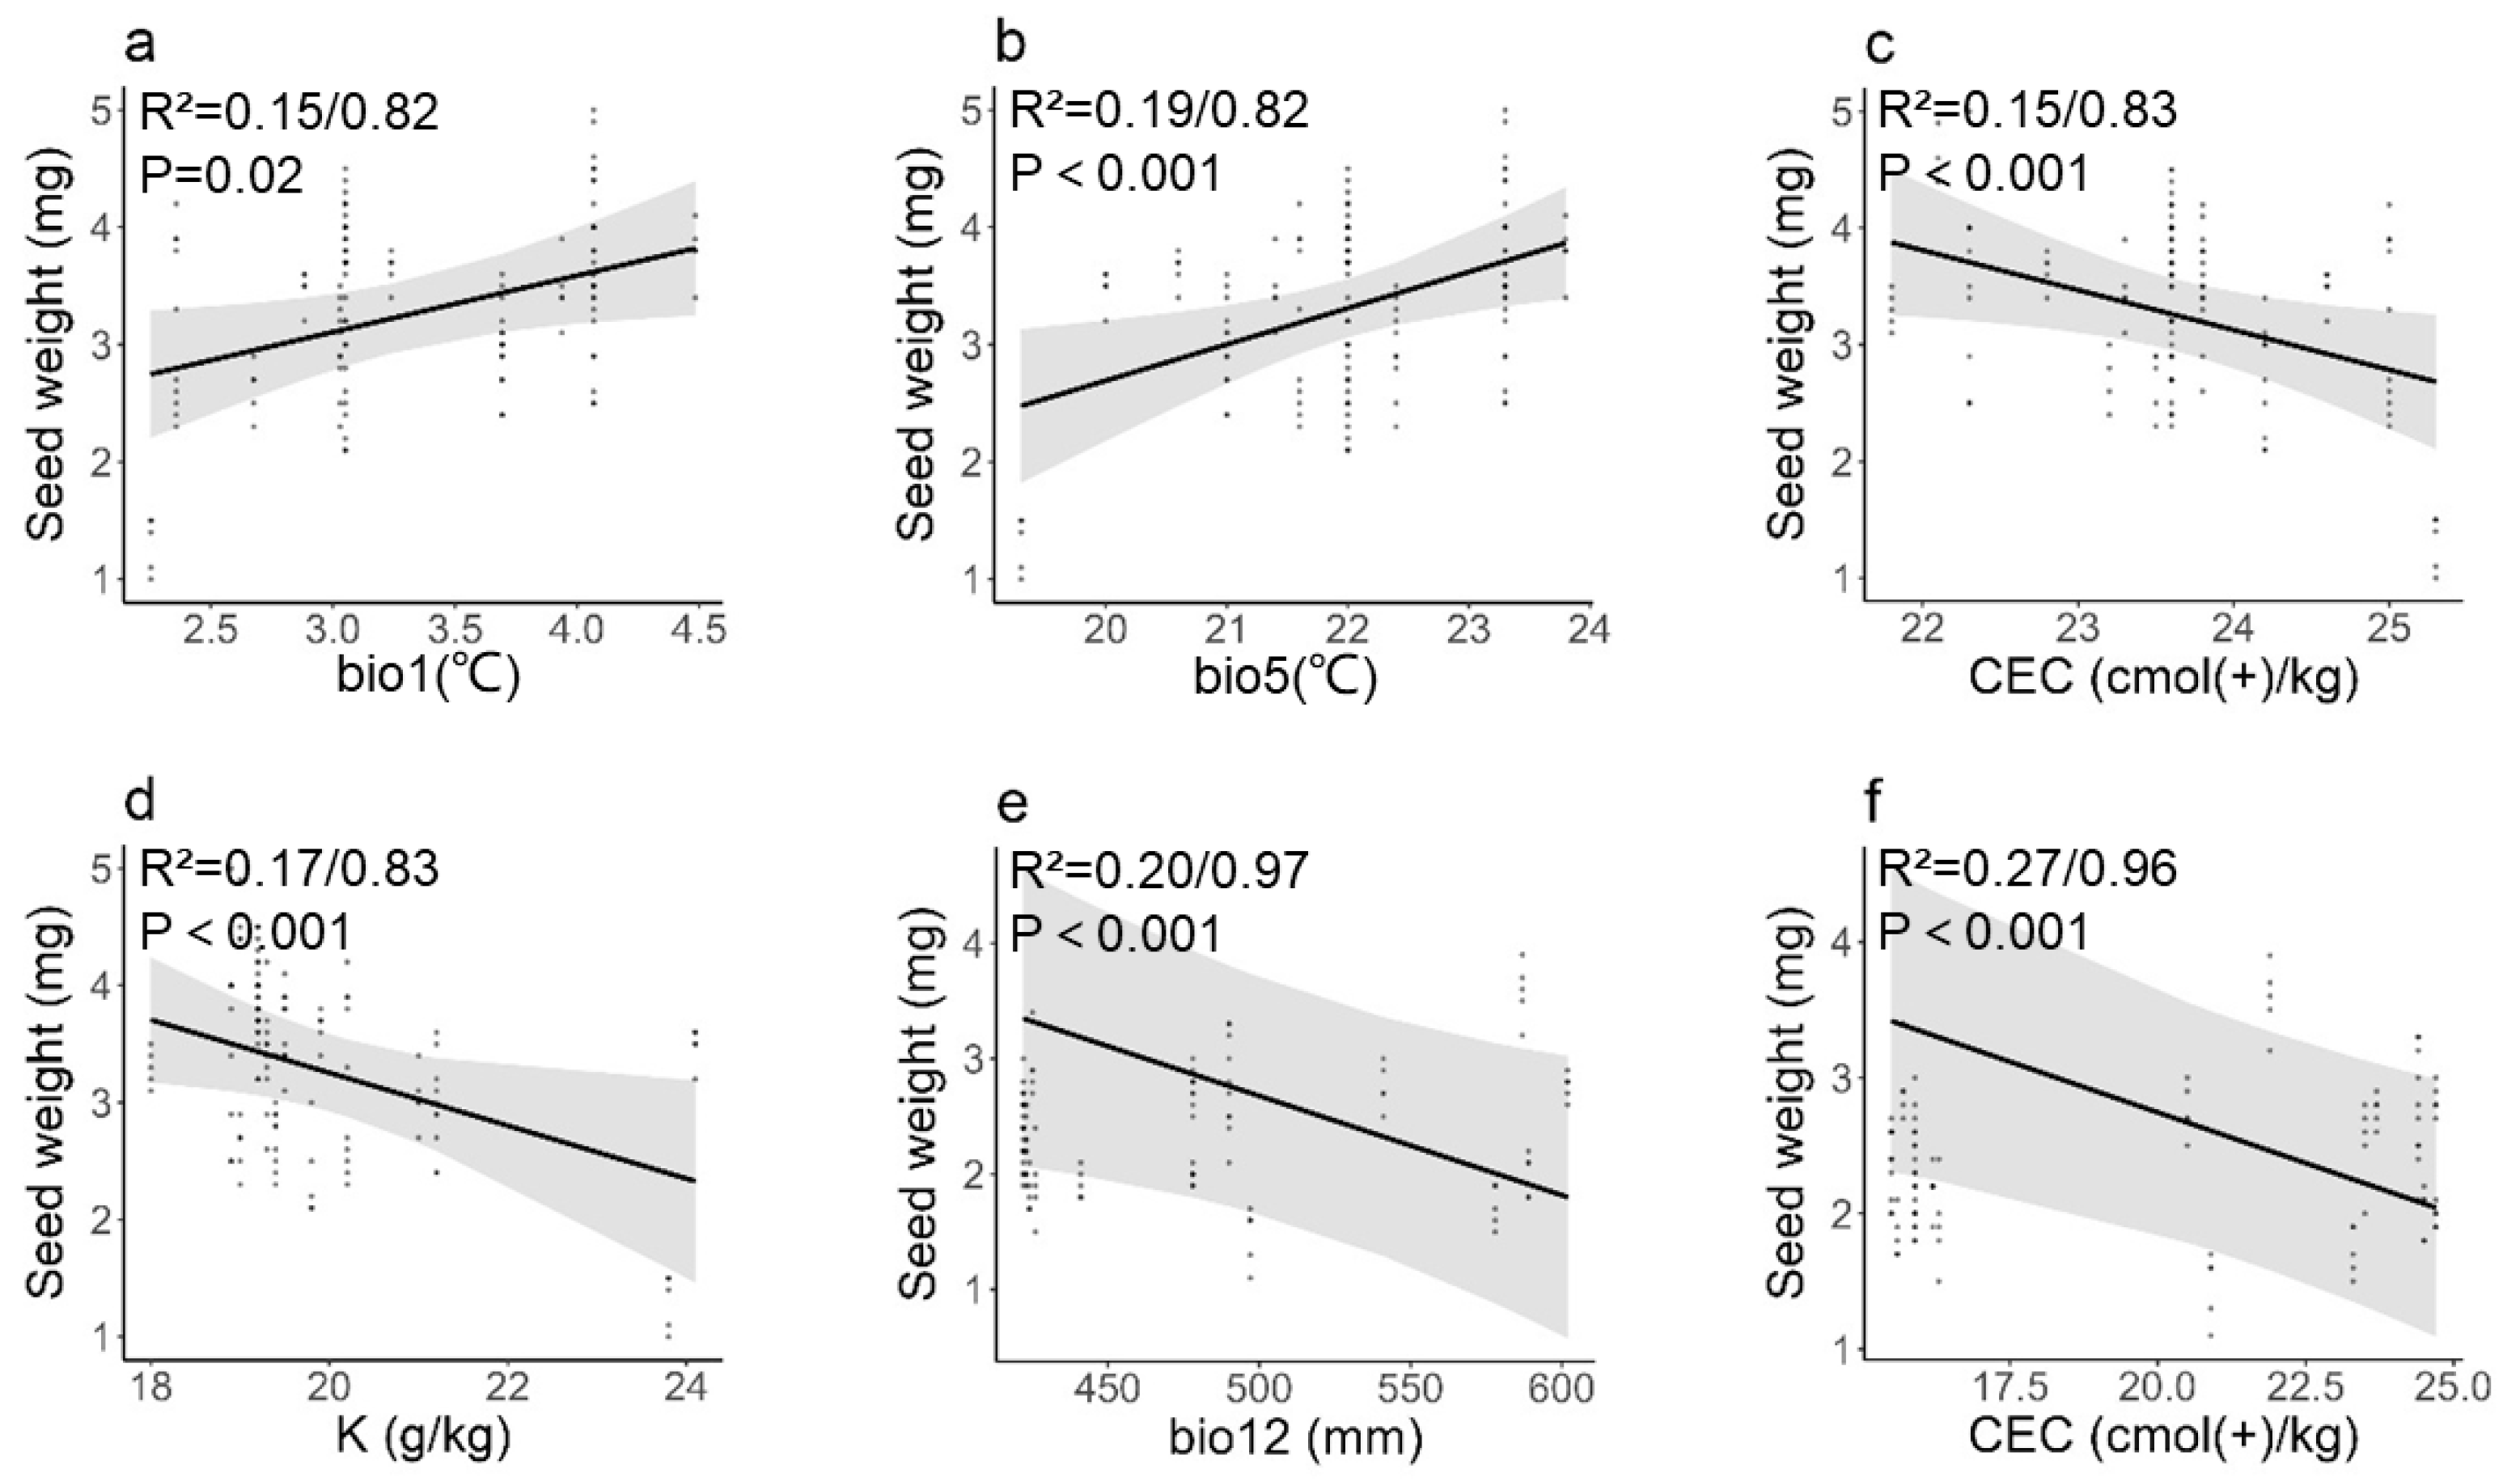
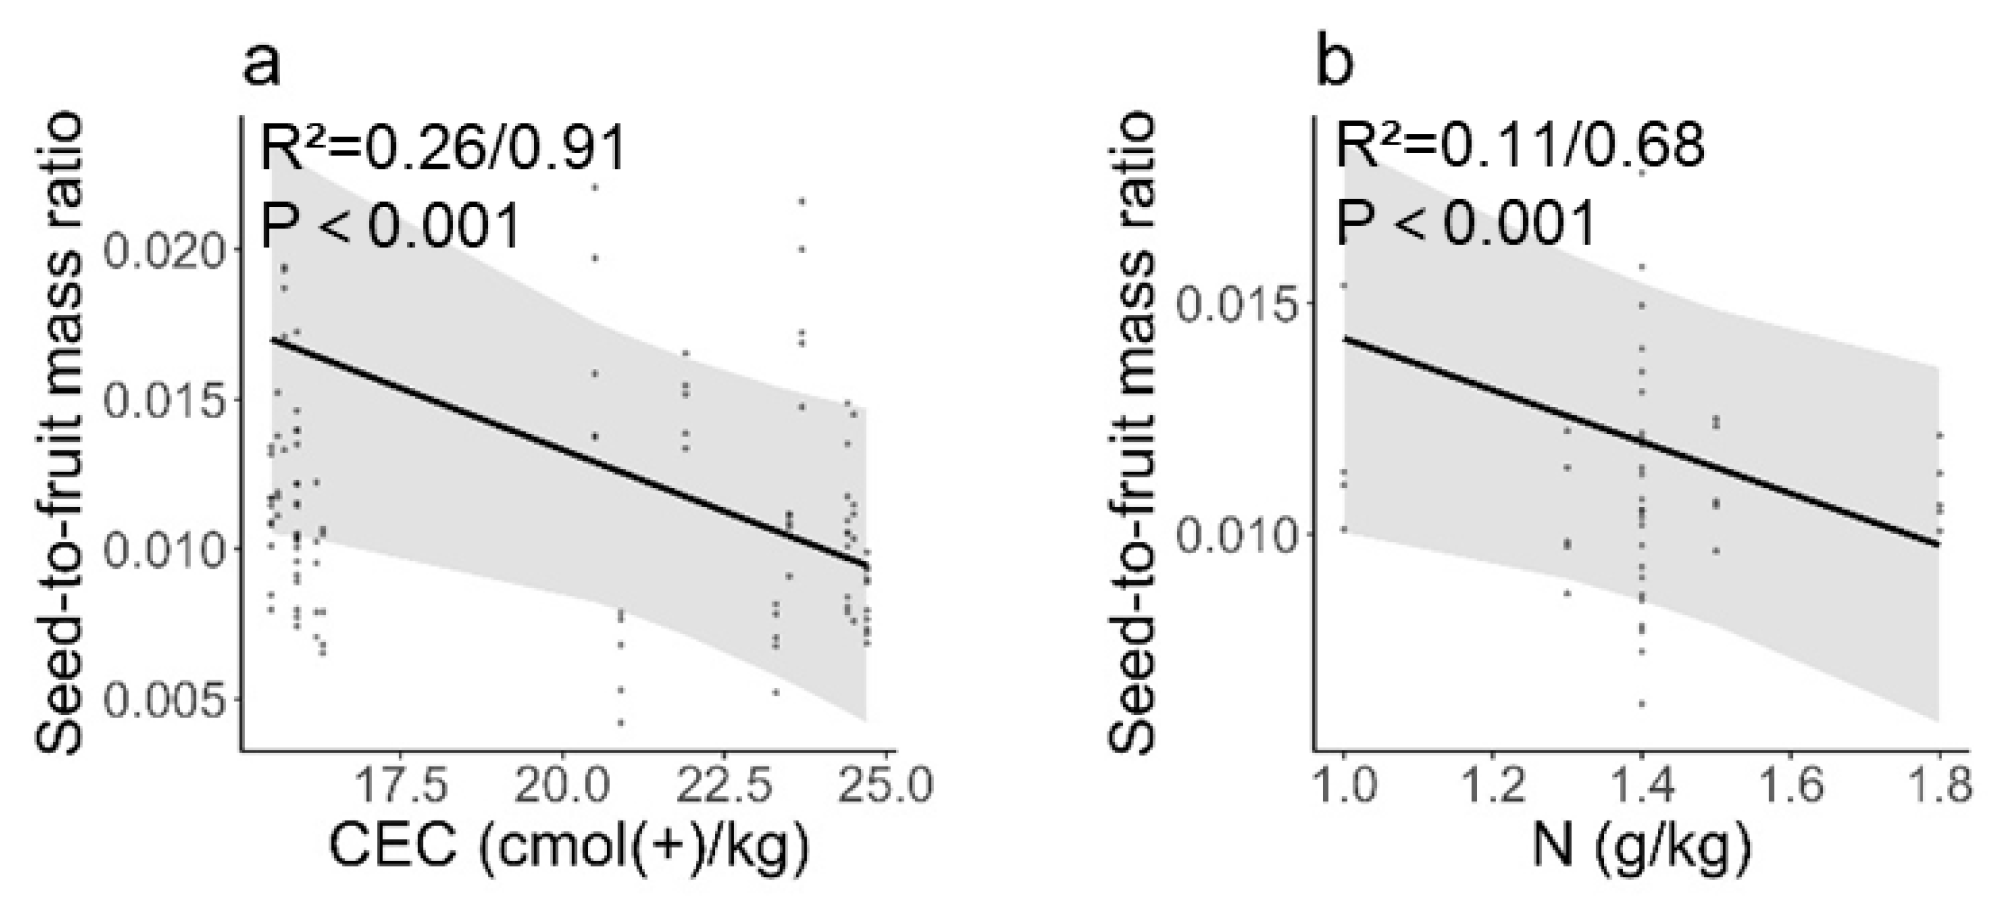
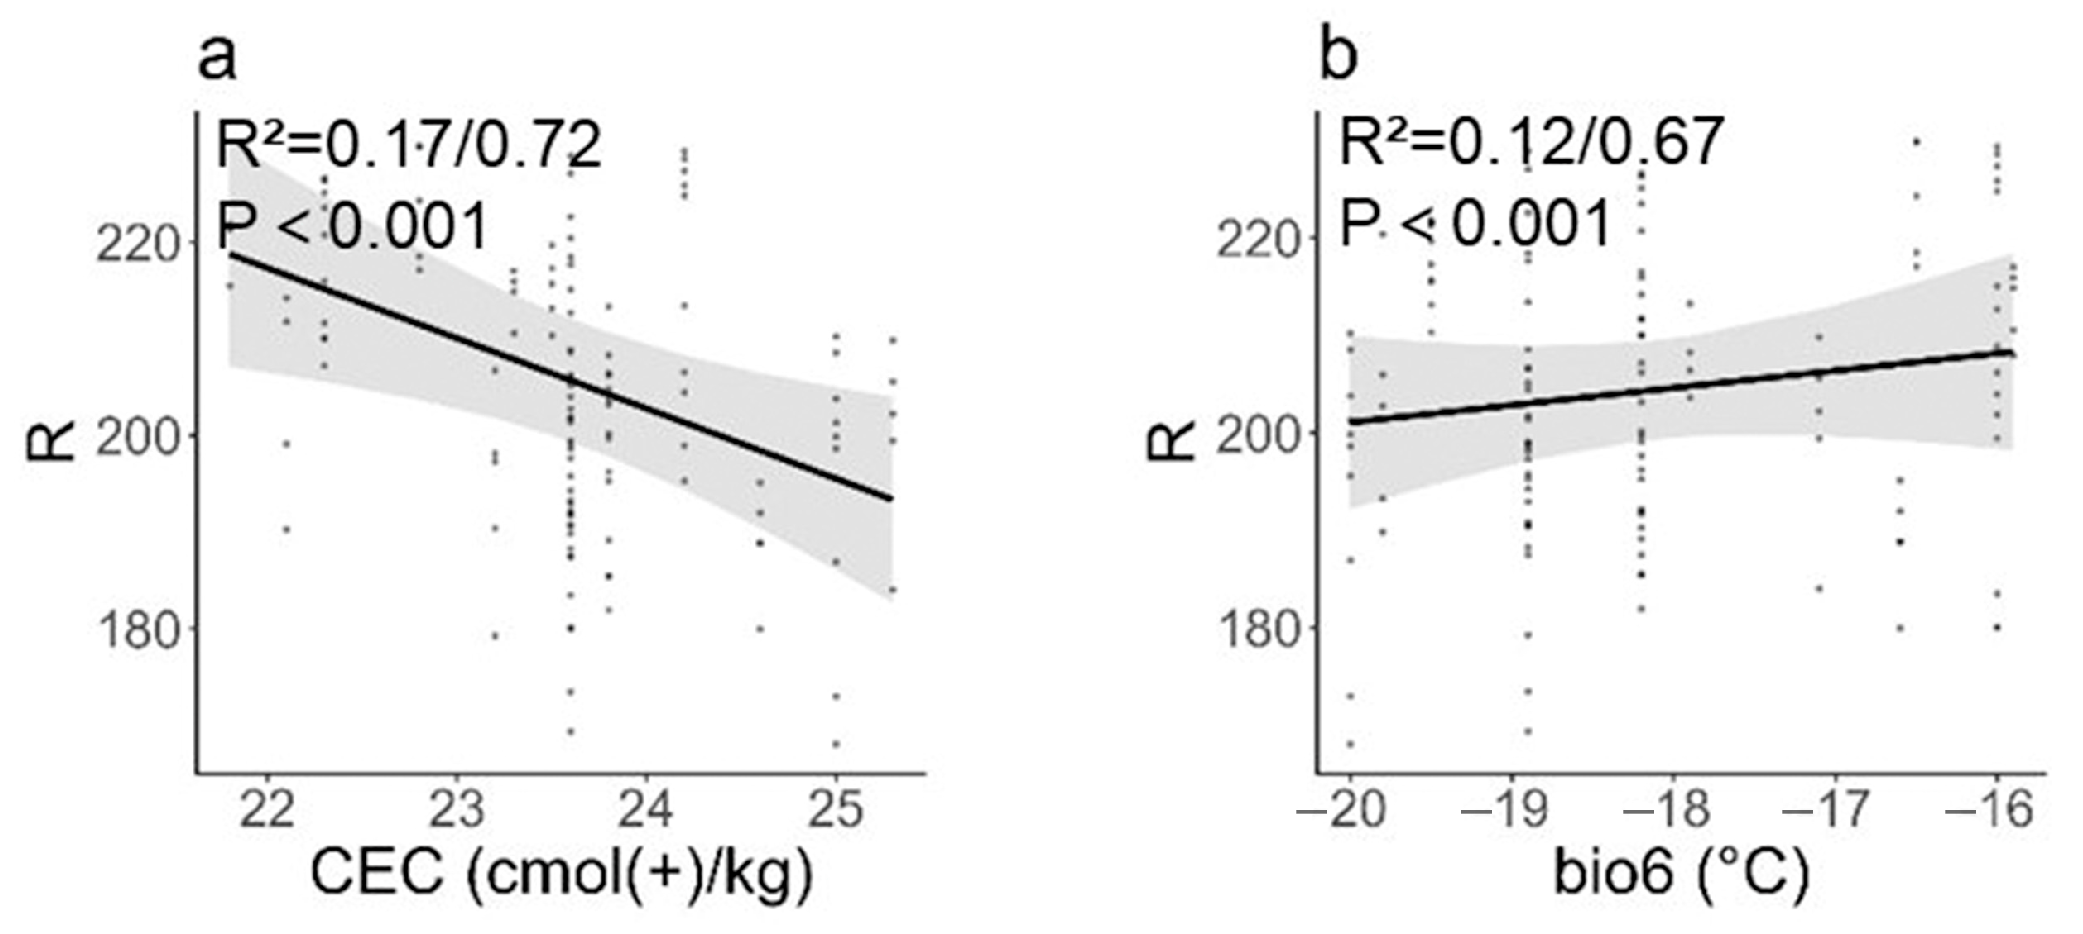
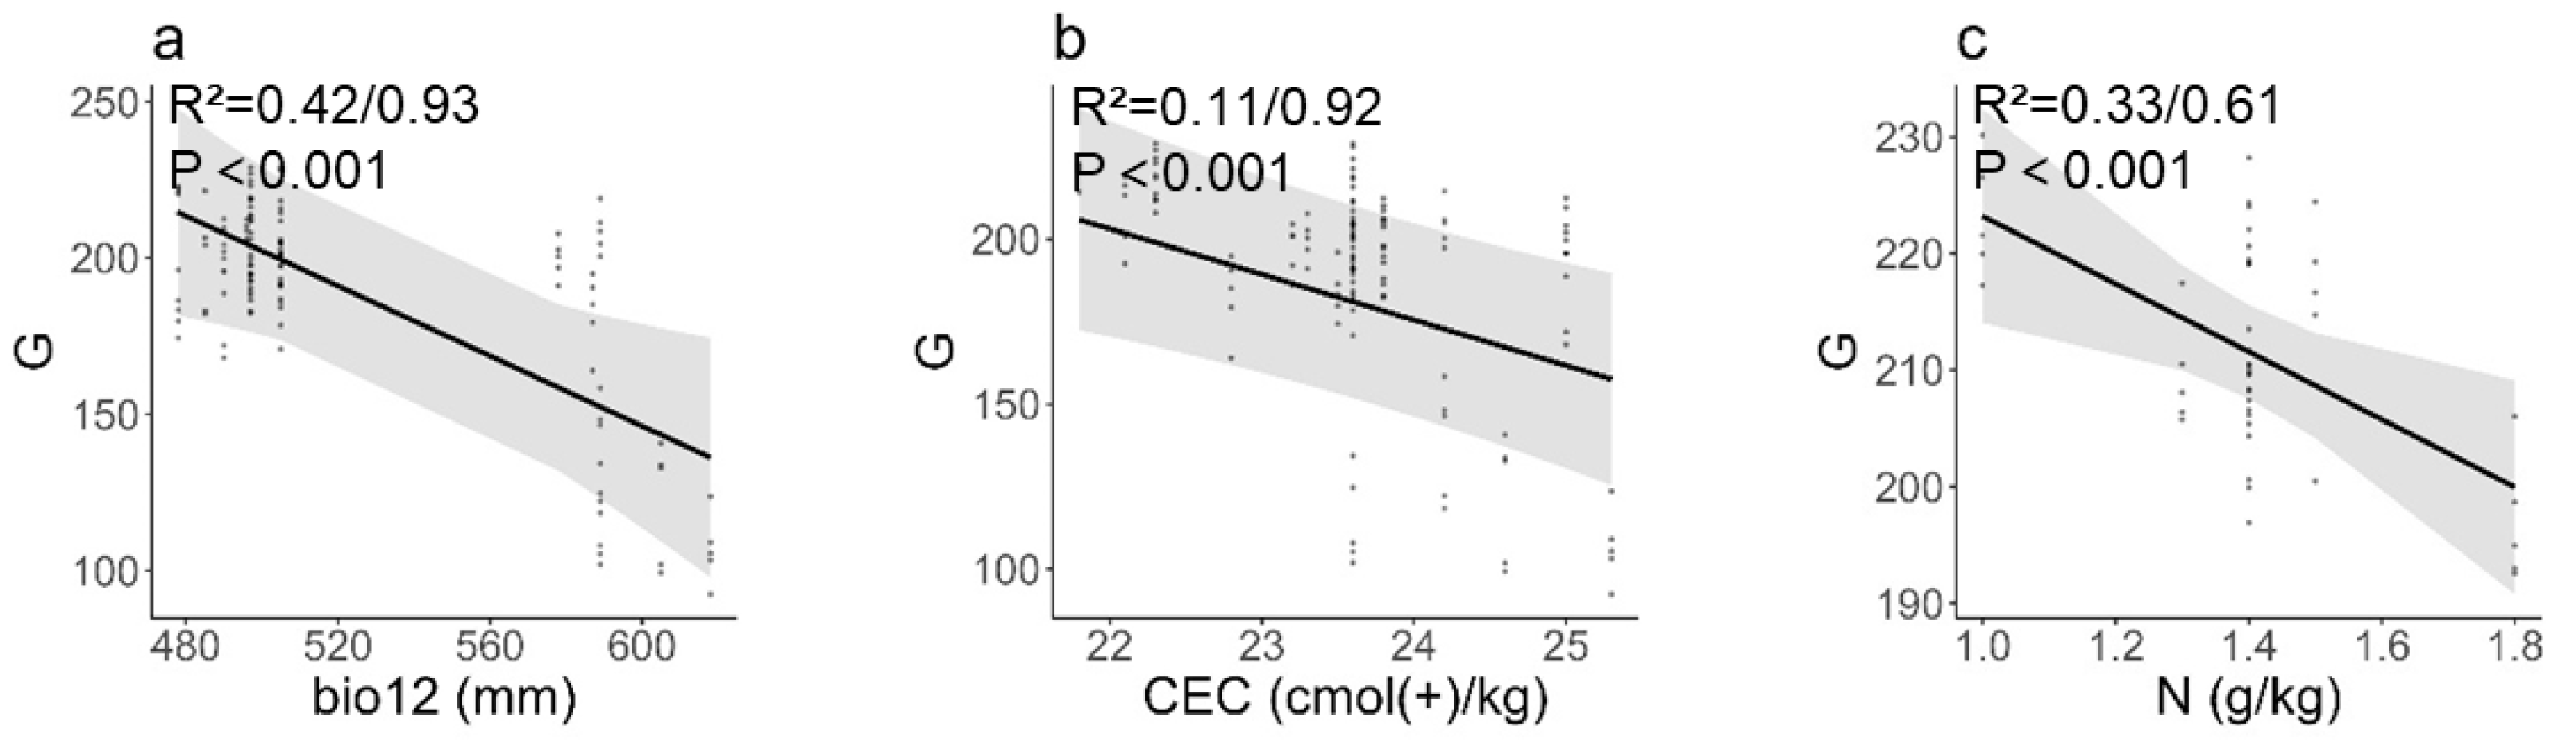
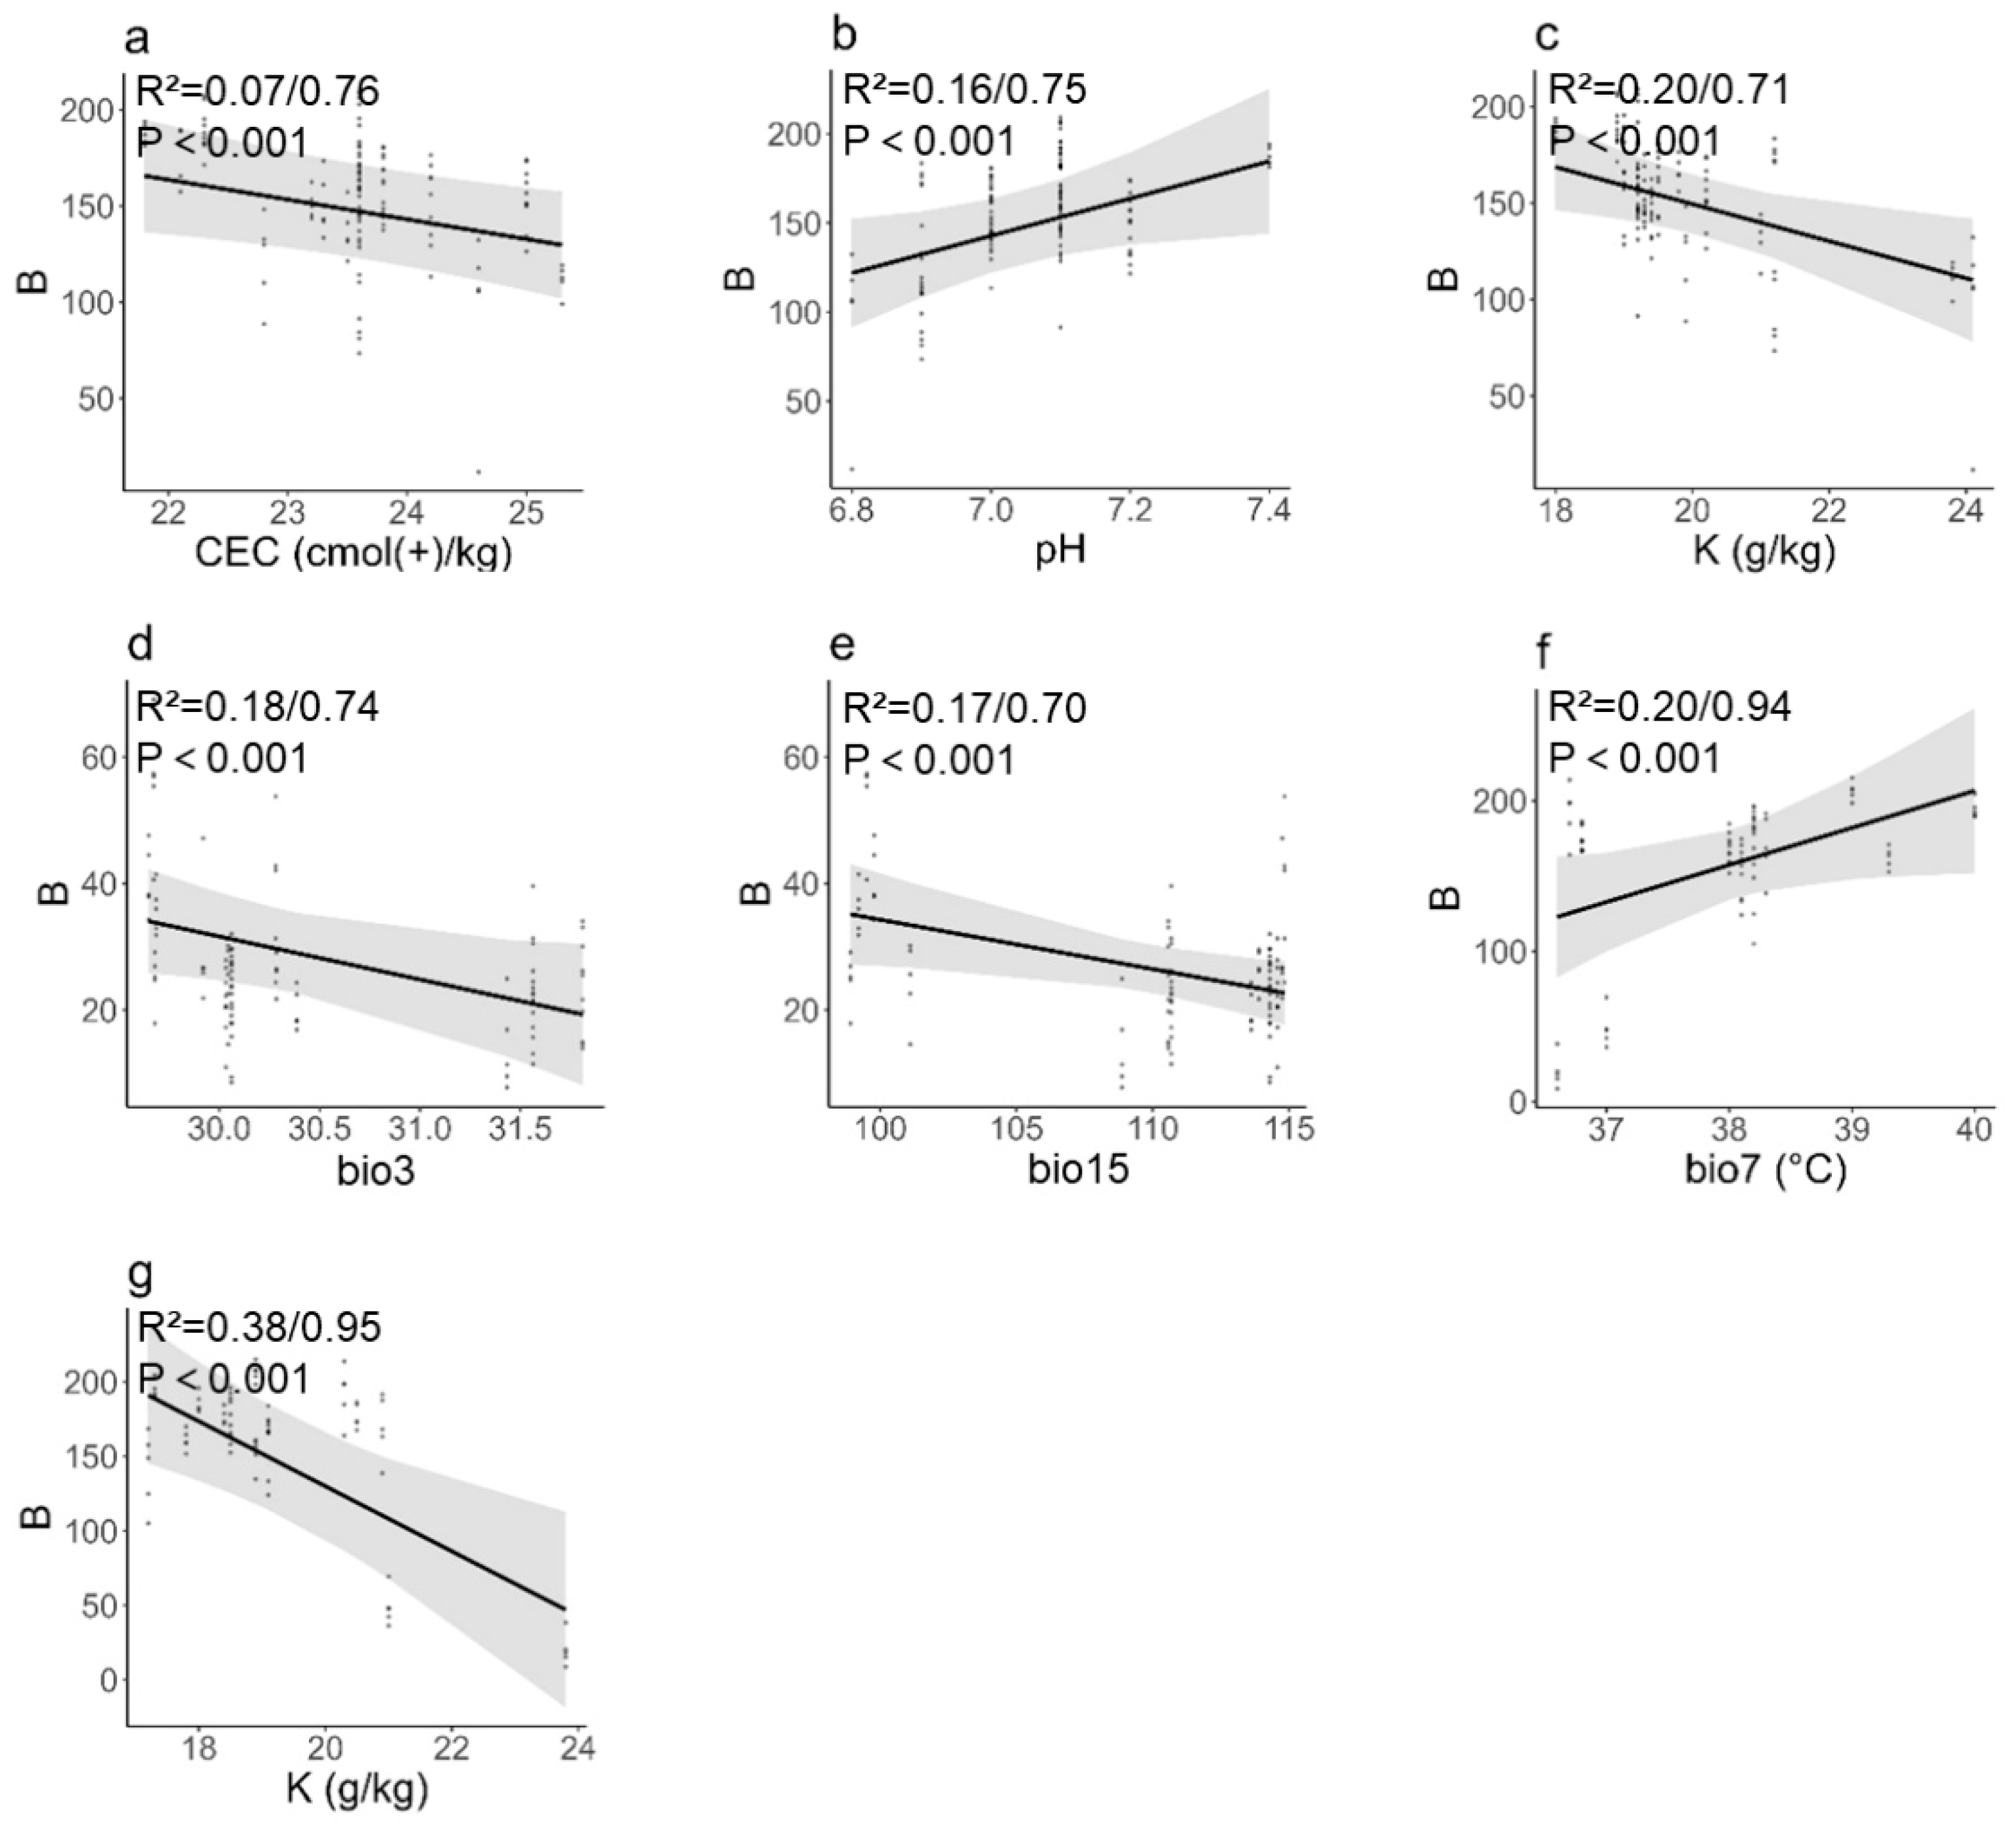
3.3. Influence of Environmental and Soil Factors on Seed and Fruit Phenotypic Traits

The fruit mass of S. hupehensis is positively associated with soil phosphorus content. Similarly, the fruit mass of S. pohuashanensis displays a positive correlation with the Min Temperature of Coldest Month (BIO6). Conversely, the fruit mass of S. koehneana shows a positive correlation with soil nitrogen content (Figure 4).
The seed mass of S. hupehensis is positively correlated with BIO1 and BIO5. However, it exhibits a negative correlation with CEC and K. On the other hand, the seed mass of S. pohuashanensis displays a negative correlation with BIO12 and CEC (Figure 5).
The ratio of fruit mass/seed mass of S. hupehensis exhibits a negative correlation with CEC. Conversely, for S. koehneana, it shows a negative correlation with nitrogen content (Figure 6).
The red (R) component of fruit colour for S. hupehensis is negatively correlated with CEC. In contrast, the red component of fruit colour for S. pohuashanensis is positively correlated with BIO6 (Figure 7).
The green (G) component of fruit colour for S. hupehensis is negatively correlated with BIO12 and CEC. Similarly, the green component of fruit colour for S. koehneana is negatively correlated with nitrogen content (Figure 8).
Regarding the blue (B) component of fruit colour, for S. hupehensis, it shows a negative correlation with CEC, K, and a positive correlation with PH. For S. pohuashanensis, the blue component is negatively correlated with BIO3 and BIO15. On the other hand, the blue component of fruit colour for S. discolor is positively correlated with BIO7 and negatively correlated with K (Figure 9).

3.4. Predicted Potential Distribution Zones

Based on 860 distribution points of Sorbus and 19 environmental variables, the Maxent model was employed to simulate and predict the potential distribution range of Sorbus. The model achieved a high AUC value of 0.97, indicating excellent simulation performance. Visualizing the results of the Maxent model fitting (Figure 2), it can be observed that the suitable habitat of S. hupehensis is primarily distributed in the southwestern region of Shanxi, close to Hebei and Henan provinces. In comparison to the northern part of Shanxi, this area exhibits significantly higher temperatures. On the other hand, the suitable habitat of S. pohuashanensis is concentrated in the eastern region, particularly in the eastern part of Xinzhou, Jinzhong, and the Taihang Mountains. As for S. discolor, it shows a broader distribution range, mainly concentrated in the central and southern regions of Taiyuan. S. koehneana, on the other hand, is distributed in the southeastern corner and Henan province.

4. Discussion

4.1. Environmental Stresses Enable Seeds to Gain More Mass Allocation Than Fruits

Under nutrient-limiting conditions, perennial plants tend to allocate a greater proportion of resources towards storage organs [30]. Conversely, in environments with higher nutrient availability, these two species of Sorbus tend to exhibit a significant increase in the allocation of resources towards fruit production. This is evident from the negative correlation observed between the fruit mass/seed mass ratio of S. hupehensis and S. koehneana with respect to the cation exchange capacity (CEC) and soil nitrogen content. Therefore, it can be inferred that the lower the soil nutrient levels in their habitat, the more these two Sorbus species prioritize resource allocation towards seed production.
Regarding fruit mass, an increase is observed in the fruit mass of S. hupehensis and S. koehneana with the increment of soil P and N. P is more heavily employed in protein synthesis, while N plays a crucial role in photosynthesis [31], both of which are essential for plant growth and development [32,33,34,35,36]. These factors have displayed a positive correlation with fruit mass, emphasizing the significance of soil fertility in determining fruit yield [37,38]. Nevertheless, among the four Sorbus species examined, the average seed mass only constitutes 1.47% of the average fruit mass, indicating a substantially high proportion of 98.53% allocated to flesh mass (Table 3). This outcome suggests that even under nutrient-deficient conditions (N and P), these two tree species still significantly diminish fruit flesh mass.
The seed mass of S. hupehensis exhibits a negative correlation with CEC and K, while the seed mass of S. pohuashanensis displays a negative correlation with BIO12 and CEC. Importantly, CEC represents a widely utilized metric for assessing soil fertility, reflecting its capacity to bind a diverse array of exchangeable ions, including K [39]. Consequently, these findings suggest a pronounced resource allocation towards seed production by these species in response to challenging environmental conditions, thereby ensuring the viability of the population. Nevertheless, it is noteworthy that in habitats characterized by higher CEC levels, denoting more favourable conditions, resources tend to be primarily directed towards individual growth rather than seed production.
One additional variation in seed characteristics is observed in S. pohuashanensis, where the seed mass exhibits a negative correlation with BIO12. The availability of water, an essential abiotic factor impacting plant growth and development [40], plays a crucial role. Similarly, when the water supply in the habitat is insufficient, S. pohuashanensis increases the provisioning of seed mass. This phenomenon aligns with the findings of previous studies [11,41]. Furthermore, having a high seed mass serves as a component of a competitive strategy, enabling seedlings to establish themselves in the presence of neighbouring plants [42]. Consequently, in water-deficient habitats, these species of Sorbus tend to produce larger seeds, thereby allowing seedlings to acquire more water resources. Similarly, in nutrient-poor soil conditions, the production of larger seeds by these Sorbus species enhances the offspring’s ability to obtain a greater share of nutrients in interspecific and intraspecific competitions. Moreover, seed mass directly influences a seedling’s capacity to withstand various environmental stresses [43].

4.2. Long-Term Adaptation Affects Fruit and Seed Mass

Long-term adaptation and environmental factors are known to have significant effects on the fruit and seed characteristics of plants. In the case of S. pohuashanensis, it has been observed that there exists a positive correlation between fruit mass and the minimum temperature experienced during the coldest month. The analysis using the Maxent model further demonstrates that the optimal distribution of S. pohuashanensis is predominantly found near 40° N (Figure 2), indicating its long-term adaptation to low temperatures. Hence, it can be inferred that prolonged adaptation and sufficient winter dormancy might play crucial roles in fruit development. Moreover, it is worth noting that adequate chilling temperatures contribute to the growth and reproductive success of deciduous fruit trees [44]. Consequently, it is plausible to suggest that S. pohuashanensis requires a period of sufficiently low temperatures to enter dormancy, thereby promoting its overall healthy growth and development. Moreover, the Maxent model provides additional insights into the thriving habitat of S. pohuashanensis, particularly in the Taihang Mountains located in the eastern part of the Shanxi province. This region is characterized by rocky terrains and limited precipitation. The adaptation to lower rainfall levels may explain the production of smaller seeds in this species.
Similarly, in the case of S. hupehensis, seed mass exhibits a positive correlation with both the Annual Mean Temperature (BIO1) and the Maximum Temperature of the Warmest Month (BIO5). This finding aligns with previous research suggesting a positive relationship between seed mass and temperature [45,46,47]. By employing the Maxent model, it has been determined that the optimal distribution range of this particular species lies in the southern part of the Shanxi province, where temperatures are notably higher compared to other regions within the province. Consequently, the long-term exposure to higher temperatures in their natural habitat likely influences the reproductive success of S. hupehensis. It can be inferred that higher temperatures contribute to an increased accumulation of matter in the seeds of S. hupehensis, resulting in larger seed size.

4.3. Impact on Fruit Colour

The mechanism of Sorbus fruit colouration is the result of the combined action of carotenoids and anthocyanins. According to the records in Flora of China, the fruit of S. pohuashanensis appears red or orangish red, while the fruit of S. hupehensis is white, sometimes with reddish stains. The fruit of S. discolor is white, and the fruit of S. koehneana is white and globose. Some plants in the genus Sorbus contain a large amount of carotenoids in their fruits, which are mainly composed of β-Carotenoids [48], and the degree of fruit colouring is usually related to β-Carotenoids. The accumulation of carotene is positively correlated [17]. The research showed that S. pohuashanensis had the highest pigment content in the fruit peel, and its degree of colouration was significantly positively correlated with pigment content. However, in S. discolor and S. koehneana, the pigment content was significantly lower than in S. pohuashanensis (Table 4). Additionally, previous studies have demonstrated a positive correlation between the degree of S. pohuashanensis colouration and fruit development. Conversely, S. discolor showed a decreasing accumulation of carotenoids as the fruit matured [49]. Hence, it can be concluded that the variation in carotenoid and anthocyanin levels among different Sorbus species leads to distinct differences in fruit colouration. This result has also been validated in Zymone [50].
The fruit colouration is significantly influenced by environmental factors. Pigment accumulation serves as a direct factor affecting the leaf colour phenotype of plants [51]. Carotenoids and anthocyanins, as natural plant pigments, are secondary metabolites that form the basis of leaf and fruit colour phenotypes, acting downstream of the genome. Therefore, the more favourable the environment, the more conducive it is to pigment accumulation and stability. Carotenoids are lipid-soluble pigments embedded in chloroplasts and chromoplast membranes, primarily exhibiting orange and yellow colours, while anthocyanins mainly exhibit red and blue colours [52]. In terms of the red (R) and blue (B) components of fruit colouration, there is a positive correlation with the pH index (PH), and Sorbus plants tend to exhibit a negative correlation between the R and B components in S. hupehensis fruits and soil cation exchange capacity (CEC), indicating a preference for acidic or slightly acidic soils. This suggests that higher soil fertility and stronger nutrient supply are beneficial for fruit growth and development, while carotenoid accumulation gradually decreases, resulting in a white fruit colour. The R component in S. pohuashanensis fruits shows a positive correlation with the minimum temperature of the coldest month (BIO6), indicating a significant increase in colouration during fruit development. This is consistent with previous research findings, supporting the adaptability of S. pohuashanensis to low-temperature environments. As for the green (G) component of fruit colouration, the G index in S. hupehensis fruits shows a negative correlation with the soil cation exchange capacity (CEC) and annual precipitation (BIO12). In S. koehneana fruits, the R index decreases with increasing nitrogen (N) content. Chlorophyll degradation is a key process in the fading of most fruits during the ripening process [53], indicating the importance of soil fertility and precipitation in the fruit peel colouration mechanism.
Pigment accumulation serves as a direct determinant of fruit colouration, with the pigment content directly dictating the colour of the fruits. Although the accumulation and stability of pigments are affected by environmental conditions, the ultimate factor lies in the genetic makeup [54]. Hence, it is imperative to explore the genetic patterns governing fruits of varying colours. Individual genome sequencing enables the identification of genes or gene regions linked to fruit colour, thus contributing to a comprehensive understanding of the mechanisms and origins of fruit colouration when combined with the results of this study.

5. Conclusions

This study investigates the adaptive strategies of Sorbus species under different environmental conditions. By employing linear mixed-effects models and Maxent models, the study analyzes the response of seed mass, fruit mass, and fruit colour, as phenotypic indicators, to external factors in Sorbus spp. The following conclusions can be drawn: the coefficient of variation in the seed–fruit mass ratio is the highest among the four Sorbus spp., followed by fruit mass and seed mass. Essential plant nutrients such as nitrogen and phosphorus play a vital role in enhancing fruit yield. Under adverse environmental conditions and in nutrient-poor soil, Sorbus spp. tend to allocate more resources for seed production, resulting in higher-mass seeds to increase the chance of offspring obtaining more nutrients in competition and ensuring the survival of the population. As the environmental nutrient availability increases, plants tend to allocate more resources towards fruit, promoting individual growth and development. Throughout their lengthy adaptation process, Sorbus plants have developed specific growth and reproductive strategies. Specifically, S. pohuashanensis is adapted to cold environments and promotes fruit development and overall healthy growth through long-term adaptation and adequate hibernation. According to the Maxent model’s predictions, its most suitable distribution area is located near 40° N, characterized by mountainous rocky terrain and limited precipitation, with lower temperatures than the central region, coinciding with the collection point locations. S. hupehensis is suited for relatively warmer areas, with higher temperatures helping promote seed material accumulation and resulting in larger seed size. According to the Maxent model’s predictions, its distribution range leans towards the central and southern regions, where temperatures are higher. The model’s prediction range for S. discolor is quite broad, covering most of the area, indicating that this species has a strong adaptability. Moreover, the content of carotenoids and anthocyanins in S. pohuashanensis fruits is significantly higher than in the other three rowan spp., and these contents are positively correlated with the suitability of environmental conditions. On the other hand, the content of carotenoids and anthocyanins in S. hupehensis, S. discolor, and S. koehneana shows a negative correlation with the suitability of environmental conditions. Therefore, understanding the response of plants to environmental factors is of significant importance for the conservation and utilization of tree species resources.

Author Contributions

T.L.: conceptualized the design and methodology of the study, collected and analyzed data, and wrote a manuscript. J.W.: conducted data collection and analysis. S.Z.: contributed to the conceptual design and methods, reviewed the paper. X.W. and Y.Z.: provided theoretical guidance and reviewed the paper. All authors have read and agreed to the published version of the manuscript.

Funding

This research was funded by the Science and Technology Innovation Project: Research on the Selection and Breeding Technology of High-Quality Tree of Sorbus (project No. LYZDYF2023-04). Natural Science Foundation Project of Shanxi Province: Research on the application potential of biomass waste in improving the function of urban soil carbon sink (project No. 202103021224142). Metabolic pathways and regulatory mechanisms of anthocyanin glycosides in autumn leaves of Pistacia chinensis Bunge were analyzed by metabonomics and transcriptomics. (project No. 202103021224144).

Institutional Review Board Statement

The experimental research and field studies on plants, including the collection of plant material, complied with relevant institutional, national, and international guidelines and legislation. The appropriate permissions and licenses for the collection of plant or seed specimens were obtained for the study. Prof. Xinping Li identified the plant material. The plant materials were deposited in the herbarium of the Shanxi Academy of Forestry and Grassland Sciences, China. The voucher IDs of the specimens were from LKY-20221208-093 to LKY-20221208-0157.

Data Availability Statement

Plot coordinates can be extracted from Table 1. Climate data can be sourced from WorldClim 2.1 (https://worldclim.org/data/worldclim21.html, accessed on 1 January 2020). Soil data can be obtained from the high-resolution basic soil property dataset of China (http://poles.tpdc.ac.cn/zh-hans/data/e1ccd22c-348f-41a2-ab46-dd1a8ac0c955/, accessed on 1 January 2020). The compiled datasets and R codes will be made available by the corresponding author upon reasonable request.

Acknowledgments

We would like to thank Shanxi Academy of Forestry and Grassland Sciences, Shanxi Agriculture University for providing the research facilities and resources for this study.

Conflicts of Interest

The authors declare no conflict of interest.

References

  1. Heide, O.M. Temperature rather than photoperiod controls growth cessation and dormancy in Sorbus species. J. Exp. Bot. 2011, 62, 5397–5404. [Google Scholar] [CrossRef] [PubMed]
  2. Khalil, M.N.; Beuerle, T.; Müller, A.; Ernst, L.; Bhavanam, V.B.; Liu, B.; Beerhues, L. Biosynthesis of the biphenyl phytoalexin aucuparin in Sorbus aucuparia cell cultures treated with Venturia inaequalis. Phytochemistry 2013, 96, 101–109. [Google Scholar] [CrossRef] [PubMed]
  3. Huntley, B. Species-richness in north-temperate zone forests. J. Biogeogr. 1993, 20, 163–180. [Google Scholar] [CrossRef]
  4. Li, M.; Ohi-Toma, T.; Gao, Y.-D.; Xu, B.; Zhu, Z.-M.; Ju, W.-B.; Gao, X.-F. Molecular phylogenetics and historical biogeography of Sorbus sensu stricto (Rosaceae). Mol. Phylogenetics Evol. 2017, 111, 76–86. [Google Scholar] [CrossRef] [PubMed]
  5. Šedivá, J.; Velebil, J.; Zahradník, D. Micropropagation as a Tool for the Conservation of Autochthonous Sorbus Species of Czechia. Plants 2023, 12, 488. [Google Scholar] [CrossRef] [PubMed]
  6. Schaal, B.; Leverich, W.J.; Rogstad, S. A Comparison of Methods for Assessing Genetic Variation in Plant Conservation Biology; Oxford University Press: New York, NY, USA, 1991; pp. 123–134. [Google Scholar]
  7. Larios, E.; Venable, D.L. Selection for seed size: The unexpected effects of water availability and density. Funct. Ecol. 2018, 32, 2216–2224. [Google Scholar] [CrossRef]
  8. Morales, A.; Teapal, J.; Ammerlaan, J.M.H.; Yin, X.; Evers, J.B.; Anten, N.P.R.; Sasidharan, R.; van Zanten, M. A high throughput method for quantifying number and size distribution of Arabidopsis seeds using large particle flow cytometry. Plant Methods 2020, 16, 27. [Google Scholar] [CrossRef]
  9. Drvodelić, D.; Oršanić, M.; Vuković, M.; Jatoi, M.A.; Jemrić, T. Correlation of Fruit Size with Morphophysiological Properties and Germination Rate of the Seeds of Service Tree (Sorbus domestica L.). South-East Eur. For. 2018, 9, 47–54. [Google Scholar] [CrossRef]
  10. Love, N.L.R.; Mazer, S.J. Geographic variation in offspring size: Long- and short-term climate affect mean seed mass of Streptanthus populations. Ecology 2022, 103, e3698. [Google Scholar] [CrossRef]
  11. Stromberg, J.C.; Boudell, J.A. Floods, drought, and seed mass of riparian plant species. J. Arid. Environ. 2013, 97, 99–107. [Google Scholar] [CrossRef]
  12. Yang, X.; Baskin, C.C.; Baskin, J.M.; Pakeman, R.J.; Huang, Z.; Gao, R.; Cornelissen, J.H.C. Global patterns of potential future plant diversity hidden in soil seed banks. Nat. Commun. 2021, 12, 7023. [Google Scholar] [CrossRef]
  13. Thomas, P.A. Biological Flora of the British Isles: Sorbus torminalis. J. Ecol. 2017, 105, 1806–1831. [Google Scholar] [CrossRef]
  14. Suhonen, J.; Jokimäki, J. Fruit removal from rowanberry (Sorbus aucuparia) trees at urban and rural areas in Finland: A multi-scale study. Landsc. Urban Plan. 2015, 137, 13–19. [Google Scholar] [CrossRef]
  15. Peng, S.; Zheng, Y.; Ma, M.; Zhang, C.; Li, T.; Ni, Y. Physiological adaptation of Sorbus pohuashanensis seedlings to heat stress. J. For. Res. 2011, 24, 602–608. [Google Scholar]
  16. Taulavuori, K.; Taulavuori, E.; Saravesi, K.; Jylänki, T.; Kainulainen, A.; Pajala, J.; Markkola, A.; Suominen, O.; Saikkonen, K. Competitive success of southern populations of Betula pendula and Sorbus aucuparia under simulated southern climate experiment in the subarctic. Ecol. Evol. 2017, 7, 4507–4517. [Google Scholar] [CrossRef]
  17. Mikulic-Petkovsek, M.; Krska, B.; Kiprovski, B.; Veberic, R. Bioactive components and antioxidant capacity of fruits from nine Sorbus genotypes. J. Food Sci. 2017, 82, 647–658. [Google Scholar] [CrossRef]
  18. Yu, X.; Wang, Z.; Shu, Z.; Li, Z.; Ning, Y.; Yun, K.; Bai, H.; Liu, R.; Liu, W. Effect and mechanism of Sorbus pohuashanensis (Hante) Hedl. flavonoids protect against arsenic trioxide-induced cardiotoxicity. Biomed. Pharmacother. 2017, 88, 1–10. [Google Scholar] [CrossRef] [PubMed]
  19. Yang, L.; Zhang, D.; Liu, H.; Wei, C.; Wang, J.; Shen, H. Effects of a nitric oxide donor and nitric oxide scavengers on Sorbus pohuashanensis embryo germination. J. For. Res. 2018, 29, 631–638. [Google Scholar] [CrossRef]
  20. Ma, Q.; Jiao, Y.; Ren, Y. Linear mixed-effects models to describe length-weight relationships for yellow croaker (Larimichthys Polyactis) along the north coast of China. PLoS ONE 2017, 12, e0171811. [Google Scholar] [CrossRef]
  21. Zuur, A.F.; Ieno, E.N.; Walker, N.; Saveliev, A.A.; Smith, G.M. Mixed Effects Models and Extensions in Ecology with R; Springer: New York, NY, USA, 2009. [Google Scholar]
  22. Potts, A.S.; Hunter, M.D. Unraveling the roles of genotype and environment in the expression of plant defense phenotypes. Ecol. Evol. 2021, 11, 8542–8561. [Google Scholar] [CrossRef]
  23. Westberg, E.; Ohali, S.; Shevelevich, A.; Fine, P.; Barazani, O. Environmental effects on molecular and phenotypic variation in populations of Eruca sativa across a steep climatic gradient. Ecol. Evol. 2013, 3, 2471–2484. [Google Scholar] [CrossRef]
  24. Wu, Z.; Raven, P.H.; Hong, D. Flora of China. Volume 9: Ulmaceae through Basellaceae; Science Press: Beijing, China, 2003. [Google Scholar]
  25. Lichtenthaler, F.W.; Cuny, E.; Weprek, S. Eine einfache und leistungsfähige Synthese acylierter Glyculosylbromide aus Hydroxyglycal-estern. Angew. Chem. 1983, 95, 906–908. [Google Scholar] [CrossRef]
  26. Pietrini, F.; Massacci, A. Leaf anthocyanin content changes in Zea mays L. grown at low temperature: Significance for the relationship between the quantum yield of PS II and the apparent quantum yield of CO2 assimilation. Photosynth. Res. 1998, 58, 213–219. [Google Scholar] [CrossRef]
  27. Zhang, K.M.; Li, Z.; Li, Y.; Kong, D.Z.; Wu, R.H. Carbohydrate accumulation may be the proximate trigger of anthocyanin biosynthesis under autumn conditions in Begonia semperflorens. Plant Biol. 2013, 15, 991–1000. [Google Scholar] [CrossRef] [PubMed]
  28. Liu, F.; Wu, H.; Zhao, Y.; Li, D.; Yang, J.-L.; Song, X.; Shi, Z.; Zhu, A.-X.; Zhang, G.-L. Mapping high resolution national soil information grids of China. Sci. Bull. 2022, 67, 328–340. [Google Scholar] [CrossRef] [PubMed]
  29. Liu, F.; Zhang, G.-L.; Song, X.; Li, D.; Zhao, Y.; Yang, J.; Wu, H.; Yang, F. High-resolution and three-dimensional mapping of soil texture of China. Geoderma 2020, 361, 114061. [Google Scholar] [CrossRef]
  30. Puijalon, S.; Piola, F.; Bornette, G. Abiotic stresses increase plant regeneration ability. Evol. Ecol. 2008, 22, 493–506. [Google Scholar] [CrossRef]
  31. Westoby, M.; Wright, I.J. Land-plant ecology on the basis of functional traits. Trends Ecol. Evol. 2006, 21, 261–268. [Google Scholar] [CrossRef]
  32. Cunha, H.F.V.; Andersen, K.M.; Lugli, L.F.; Santana, F.D.; Aleixo, I.F.; Moraes, A.M.; Garcia, S.; Di Ponzio, R.; Mendoza, E.O.; Brum, B.; et al. Direct evidence for phosphorus limitation on Amazon forest productivity. Nature 2022, 608, 558–562. [Google Scholar] [CrossRef]
  33. Ďurkovič, J.; Lengyelová, A.; Čaňová, I.; Kurjak, D.; Hladká, D. Photosynthetic performance and stomatal characteristics during ex vitro acclimatisation of true service tree (Sorbus domestica L.). J. Hortic. Sci. Biotechnol. 2009, 84, 223–227. [Google Scholar] [CrossRef]
  34. Lambers, H. Phosphorus acquisition and utilization in plants. Annu. Rev. Plant Biol. 2022, 73, 17–42. [Google Scholar] [CrossRef]
  35. Xu, G.; Fan, X.; Miller, A.J. Plant nitrogen assimilation and use efficiency. Annu. Rev. Plant Biol. 2012, 63, 153–182. [Google Scholar] [CrossRef]
  36. Zornoza, R.; Acosta, J.A.; Bastida, F.; Domínguez, S.G.; Toledo, D.M.; Faz, A. Identification of sensitive indicators to assess the interrelationship between soil quality, management practices and human health. J. Soil 2015, 1, 173–185. [Google Scholar] [CrossRef]
  37. Guo, K.; Peng, L.; Hong, Y.; Qiao, G. Optimizing Nitrogen, Phosphorus, and Potassium Fertilization Rates for Fruit Performance of Chinese Cherry (Prunus pseudocerasus Lindl.). Int. J. Fruit Sci. 2022, 22, 769–778. [Google Scholar] [CrossRef]
  38. Morugán-Coronado, A.; Linares, C.; Gómez-López, M.D.; Faz, Á.; Zornoza, R. The impact of intercropping, tillage and fertilizer type on soil and crop yield in fruit orchards under Mediterranean conditions: A meta-analysis of field studies. Agric. Syst. 2020, 178, 102736. [Google Scholar] [CrossRef]
  39. Paganová, V. Ecology and distribution of service tree Sorbus domestica (L.) in Slovakia. Ekológia (Bratislava) 2008, 27, 152–167. [Google Scholar]
  40. Ma, X.; Su, Z.; Ma, H. Molecular genetic analyses of abiotic stress responses during plant reproductive development. J. Exp. Bot. 2020, 71, 2870–2885. [Google Scholar] [CrossRef] [PubMed]
  41. Mazer, S.J. Ecological, taxonomic, and life history correlates of seed mass among indiana dune angiosperms: Ecological archives M059-001. Ecol. Monogr. 1989, 59, 153–175. [Google Scholar] [CrossRef]
  42. Jensen, K.; Gutekunst, K. Effects of litter on establishment of grassland plant species: The role of seed size and successional status. Basic Appl. Ecol. 2003, 4, 579–587. [Google Scholar] [CrossRef]
  43. Stromberg, J.C.; Butler, L.; Hazelton, A.F.; Boudell, J.A. Seed size, sediment, and spatial heterogeneity: Post-flood species coexistence in dryland riparian ecosystems. Wetlands 2011, 31, 1187–1197. [Google Scholar] [CrossRef]
  44. Salama, A.-M.; Ezzat, A.; El-Ramady, H.; Alam-Eldein, S.M.; Okba, S.K.; Elmenofy, H.M.; Hassan, I.F.; Illés, A.; Holb, I.J. Temperate fruit trees under climate change: Challenges for dormancy and chilling requirements in warm winter regions. Horticulturae 2021, 7, 86. [Google Scholar] [CrossRef]
  45. Azcárate, F.M.; Manzano, P.; Peco, B. Testing seed-size predictions in Mediterranean annual grasslands. Seed Sci. Res. 2010, 20, 179–188. [Google Scholar] [CrossRef]
  46. Murray, B.R.; Brown, A.H.D.; Dickman, C.R.; Crowther, M.S. Geographical gradients in seed mass in relation to climate. J. Biogeogr. 2004, 31, 379–388. [Google Scholar] [CrossRef]
  47. Wu, H.; Meng, H.; Wang, S.; Wei, X.; Jiang, M. Geographic patterns and environmental drivers of seed traits of a relict tree species. For. Ecol. Manag. 2018, 422, 59–68. [Google Scholar] [CrossRef]
  48. Deren’ko, S.A. Carotenoids of the fruit of Sorbus aucuparia. Chem. Nat. Compd. 1978, 14, 454–455. [Google Scholar] [CrossRef]
  49. Yu, X.-D.; Zhang, C.-H.; Zheng, Y.-Q.; Xia, X.-H.; Huang, L. Relationship between carotenoid component and fruit color of two Sorbus species. For. Res. 2021, 34, 71–79. [Google Scholar]
  50. Zymone, K.; Raudone, L.; Raudonis, R.; Marksa, M.; Ivanauskas, L.; Janulis, V. Phytochemical profiling of fruit powders of twenty Sorbus L. cultivars. Molecules 2018, 23, 2593. [Google Scholar] [CrossRef]
  51. Yue, C.; Wang, Z.; Yang, P. The effect of light on the key pigment compounds of photosensitive etiolated tea plant. Bot. Stud. 2021, 62, 21. [Google Scholar] [CrossRef]
  52. Hu, C.; Shang, H.; Xia, X.; Li, A. A brief description of the coloration mechanism of color-leaved plants. J. South China Agric. 2014, 8, 162–163. [Google Scholar]
  53. Hörtensteiner, S.; Kräutler, B. Chlorophyll breakdown in higher plants. Biochim. Biophys. Acta (BBA) Bioenerg. 2011, 1807, 977–988. [Google Scholar] [CrossRef]
  54. Zhang, X.; Xiong, L.; Wen, B.; Wang, K.; Liu, Z.; Huang, J.A.; Li, J. Advances in leaf color variation of tea plant (Camellia sinensis). J. Plant Physiol. J. 2020, 56, 643–653. [Google Scholar]
Figure 1. Collection area map.
Forests 14 02390 g001
Figure 2. Potential suitable distribution areas of Sorbus spp. in Shanxi and its surrounding areas. (A): S. hupehensis. (B): S. pohuashanensis. (C): S. discolor. (D): S. koehneana. distribution probability ≥0.9.
Forests 14 02390 g002
Figure 3. Fruit colours among four species of Sorbus spp. (A) (first line): S. hupehensis. (B) (Second line): S. pohuashanensis. (C) (Third line): S. discolor. (D) (Fourth line): S. koehneana. The letters represent different provenances. The number represents the family identifiers. HC: Heicha Mountain, LYS: Luya Mountain, TY: Taiyue Mountain, LS: WT: Wutai Forest Bureau, ZQ: Zuoquan County, SG: Shigao Mountain. (See Table 1 for details).
Forests 14 02390 g003
Figure 4. Fruit mass and environmental Factors. (a): S. hupehensis, (b): S. pohuashanensis, (c): S. koehneana. P: Phosphorus, bio6 (°C): min temperature of coldest month, N: nitrogen. The shaded areas represent 95% confidence intervals. R2: Marginal R2/Conditional R2, p < 0.01: highly significant.
Forests 14 02390 g004
Figure 5. Seed mass and environmental Factors. (ad): S. hupehensis, (e,f): S. pohuashanensis; bio1 (°C): annual mean temperature, bio5 (°C): max temperature of warmest month, CEC (cmol(+)/kg): cation exchange capacity, K: potassium, bio12 (mm): annual precipitation. The shaded areas represent 95% confidence intervals (same as above).
Forests 14 02390 g005
Figure 6. Fruit mass/seed mass and environmental factors. (a): S. pohuashanensis, (b): S. koehneana. CEC(cmol(+)/kg): cation exchange capacity, N: nitrogen (same as above).
Forests 14 02390 g006
Figure 7. Fruit colour (DNR) and environmental Factors. (a): S. hupehensis, (b): S. pohuashanensis. R: DNR, representing the digital numbers in the red colour channel. CEC (cmol(+)/kg): cation exchange capacity; bio6 (°C): min temperature of coldest month (same as above).
Forests 14 02390 g007
Figure 8. Fruit colour (DNG) and environmental factors. (a,b): S. hupehensis, (c): S. koehneana. G: DNG, representing the digital numbers in the green color channel; bio12 (°C): annual precipitation; CEC (cmol(+)/kg): cation exchange capacity; N: nitrogen (same as above).
Forests 14 02390 g008
Figure 9. Fruit colour (DNB) and environmental factors. (ac): S. hupehensis, (d,e): S. pohuashanensis, (f,g): S. discolor. B: DNB, representing the digital numbers in the blue colour channel. CEC (cmol(+)/kg): cation exchange capacity; bio3 (°C): isothermality; bio15 (°C): precipitation seasonality; bio7 (°C): temperature annual range; K: potassium (same as above).
Forests 14 02390 g009
Table 1. Geographical and climatic information of the collection sites.
SpeciesFamilyLongitudeLatitudeAltitude/mAnnual Mean Temperature/°CAnnual Mean Precipitation/mm
AHC1~HC13111.46~111.4838.31~38.331738~20493.05~4.48496~505
LYS1~LYS5112.07~112.0938.85~38.871829~19862.35~3.03478~490
TY1~TY4111.96~111.9836.7~36.92139~24342.23~3.69587~618
LS1~LS3111.95~111.9836.81~36.82026~21393.69~3.93578~589
BLYS6~LYS10112.08~112.0938.85~38.871829~19862.35~3.03478~490
TY5~TY6111.97~111.9836.82~36.852141~23082.66~3.23587~602
LS4~LS6111.96~111.9836.83~36.81626~20263.69~6.13541~589
WT1~WT11113.63~113.9238.7~38.9727~16883.67~9.31422~497
CZQ1~ZQ9113.48~113.6337.15~37.21391~19194.3~6.86579~632
TY7~TY10111.97~111.9936.82~36.842285~23122.53~2.88602~605
LS7111.9536.8321393.69589
SG1~SG2111.92~111.9336.73~36.751238~13677.57~8.07514~522
DTY11~TY12111.98~111.9936.82~36.8422852.24~2.53604~613
LS8~LS14111.95~111.9836.81~36.862139~23852.24~3.69589~613
(1) A: Sorbus hupehensis C. K. Schneid; B: s Sorbus pohuashanensis (Hance) Hedl; C: Sorbus discolor (Maxim.) Maxim; D: Sorbus koehneana C. K. Schneid. (2) HC: Heicha Mountain, LYS: Luya Mountain, TY: Taiyue Mountain, LS: WT: Wutai Forest Bureau, ZQ: Zuoquan County, SG: Shigao Mountain.
Table 2. Climate and Soil Factors.
CodeMeanUnitExplanation
BIO1Annual Mean Temperature°CMean annual daily mean air Temperatures averaged over 1 year
BIO3Isothermality-Ratio of diurnal variation to annual Variation in temperatures
BIO5Max Temperature of Warmest Month°CThe highest temperature of any monthly daily mean maximum temperature
BIO6Min Temperature of Coldest Month°CThe lowest temperature of any monthly daily mean maximum temperature
BIO7Temperature Annual Range°CThe difference between the Maximum Temperature of Warmest month and the Minimum Temperature of Coldest month
BIO12Annual PrecipitationmmAccumulated precipitation amount over 1 year
BIO15Precipitation Seasonality-The Coefficient of Variation is the standard deviation of the monthly precipitation estimates expressed as a percentage of the mean of those estimates (i.e., the annual mean)
NNitrogeng/kgThe nitrogen content in the soil
PPhosphorusg/kgThe phosphorus content in the soil
KPotassiumg/kgThe potassium content in the soil
CECCation Exchange Capacitycmol(+)/kgThe ability of soil to retain and exchange positively charged ions affects soil fertility and nutrient availability for plant growth
pHPotential of hydrogen-The acidity and alkalinity of soil or other media
Table 3. Differences in seed and fruit phenotypic traits among four species of Sorbus spp.
SpeciesIndexSeed Mass/mgFruit Mass/mgFruit Mass/Seed MassDNRDNGDNB
Sorbus L.Average3.15 ± 0.87213.67 ± 76.010.02 ± 0.01201 ± 17151 ± 17120 ± 68
F-value65.26 **83.30 **64.80 **17.70 **925.01 **442.77 **
CV/%27.6535.5745.738.4748.7657.11
AAverage3.1 ± 0.7188 ± 45.350.02 ± 0.01206.17 ± 13.4178.95 ± 23.86145.61 ± 23.27
F-value8.73 **14.86 **19.78 **4.18 **59.21 **35.11 **
CV/%20.7524.2430.896.5414.4516.89
BAverage2.5 ± 0.4 220.1 ± 46.8 0.01 ± 0.00 194.7 ± 16.1 44.4 ± 13.6 28.3 ± 8.4
F-value15.66 **11.01 **10.25 **6.44 **3.64 *11.88 **
CV/%18.21 21.92 24.20 8.32 30.02 29.92
CAverage3.4 ± 0.5 223.5 ± 39.8 0.02 ± 0.00 203.5 ± 13.2 192.2 ± 15.6 136.1 ± 26.8
F-value9.06 **11.55 **9.00 **1.997.93 **15.78 **
CV/%14.93 19.01 24.10 6.49 8.08 20.36
DAverage3.9 ± 0.8 355.0 ± 97.2 0.01 ± 0.00 205.7 ± 8.5 208.6 ± 8.4 176.5 ± 11.1
F-value15.74 **2.46 5.377 *9.075 *12.23 **3.89
CV/%20.80 26.82 19.49 4.12 4.01 6.29
(1) A: S. hupehensis; B: S. pohuashanensis; C: S. discolor; D: S. koehneana. (2) DNR, DNG, DNB: representing the digital numbers in the red, green, and blue colour channels, respectively. *: p < 0.05, **: p < 0.01. CV/%: Coefficient of variation among provenances.
Table 4. The Content of Pigment in the Peel of Four Species of Sorbus spp.
SpeciesFamilyCarotenoids ContentAnthocyanin Content
Sorbus 0.0533 ± 0.0164 bB0.0251 ± 0.0076 bB
1.1016 ± 0.2264 aA0.2943 ± 0.0709 aA
0.0254 ± 0.0083 bB0.0061 ± 0.0020 bB
0.0361 ± 0.0112 bB0.0123 ± 0.0027 bB
S. hupehensisHC0.0460 ± 0.0143 aA0.0236 ± 0.0078 cC
LYS0.0591 ± 0.0168 aA0.0311 ± 0.0020 cC
TY0.0555 ± 0.0117 aA0.1721 ± 0.0056 aA
LS0.0558 ± 0.0173 aA0.0847 ± 0.0008 bB
S. pohuashanensisLYS1.3784 ± 0.0546 aA0.3446 ± 0.0125 bB
TY1.2238 ± 0.0160 bB1.1607 ± 0.0278 aA
LS0.6808 ± 0.0290 dD0.3792 ± 0.0275 bB
WT1.0306 ± 0.0129 cC0.2402 ± 0.0432 cC
S. discolorZQ0.0252 ± 0.0077 aA0.0029 ± 0.0004 cB
TY0.0261 ± 0.0073 aA0.0057 ± 0.0016 bAB
LS0.0090 ± 0.0011 aA
SG
S. koehneanaTY0.0168 ± 0.0022 bB0.0048 ± 0.0031 aA
LS0.0397 ± 0.0084 aA0.0148 ± 0.0049 aA
(1) Sorbus: Comparison of significant differences was performed among the four species, the rest are significant differences between families under the species classifications. HC: Heicha Mountain, LYS: Luya Mountain, TY: Taiyue Mountain, LS: Lingshi County, WT: Wutai Forest Bureau, ZQ: Zuoquan County, SG: Shigao Mountain. Note: “−” indicates that the indicator was not included in the model. (2) Different lowercases and uppercases in the same column indicate the significant differences at 0.05 and 0.01 levels, respectively.
Disclaimer/Publisher’s Note: The statements, opinions and data contained in all publications are solely those of the individual author(s) and contributor(s) and not of MDPI and/or the editor(s). MDPI and/or the editor(s) disclaim responsibility for any injury to people or property resulting from any ideas, methods, instructions or products referred to in the content.

