Abstract
The Chinese pine (Pinus tabuliformis) community on the ridge is one of the most important zonal forest communities on the southern slope of the mid-Qinling Mountains. This study aimed to investigate the driving factors of Chinese pine population distribution in the ridge habitats and its adaptability characteristics. Population age structure and the relationship between regeneration dynamics and environmental factors were investigated in 32 plots in the Huoditang Forest region. The results showed that the niche of Chinese pine was wide but overlapped greatly with that of Quercus aliena var. acutiserrat, an oak species. The population in the ridge habitats exhibited an expansion trend, while that inhabiting slope habitats was declining. Seedling density in ridge habitats was much higher than that of the understory in the slope habitats. Still, the seedling growth rate in both ridge and understory habitats was much lower than that characteristic of gap habitats. Seedling density positively correlated with understory solar conditions, while growth positively correlated with soil fertility, indicating that environmental factors significantly influence the regeneration process. Thus, light conditions and intrinsic biological traits of Pinus tabuliformis influence its distribution. In ridge habitats, sufficient light conditions promote Pinus tabuliformis regeneration and recruitment of larger classes, but poor soil conditions also limit its growth.
1. Introduction
Even after decades of research, the problem of plant species distribution remains fascinating for ecologists, as it concerns processes of community assembly and adaptive mechanisms of species as well as the direction of population and community development in the background of a changing environment and climate [1,2]. Scientists have developed a conceptual framework that summarizes the main factors driving species distribution, including abiotic constraints, dispersal limitations, and biotic interactions [3,4,5]. Abiotic constraints affect the distribution of species by limiting their fundamental niches, while dispersal limitations may limit a species’ distribution range by preventing its spread to suitable sites [6]. Both of these types of factors play a leading role in species distribution on a large scale [7,8]. Biotic interactions indirectly affect species distribution by modifying the local abiotic environment and the availability of resources on a small scale [9,10,11]. It is well accepted that the contribution of biotic interactions to the determination of species distributions is indispensable [12,13]; however, this contribution is often overlooked in studies of population distribution because of both the complexity of the process itself and the question of scale applicability [14,15].
Studies have found competition to be the main factor affecting the distribution pattern of species in small-scale biological interactions by changing the age structure and regeneration dynamics of plant populations [16,17]. Generally, population demography provides valuable information about population dynamics [18,19,20], whereas the distribution of adult trees is considered a response to past environmental conditions and the performance of young life stages (seedlings and saplings) represents a response to the current environment [21]. Therefore, comparing and analyzing the performance of adult and regenerated individuals across different habitats at small spatial scales is a well-established approach to predict whether the population of a species is declining, stable, or expanding in different habitats [22,23]. There is a need to further understand the role of competition and other factors affecting the dynamics of species distribution. Regeneration is an essential factor driving population dynamics, as it is sensitive to environmental changes [24,25].
Some ecological changes caused by competition often become limiting factors, resulting in poor recruitment and growth of local populations [26,27]. Therefore, it is important to consider both number and growth characteristics of regeneration, which can shape population dynamics [28]. Most previous studies have focused on the population structure and/or quantitative regeneration dynamics within a species’ distribution range [29] whilst ignoring the response of population density and growth characteristics to different biotic and abiotic factors. Therefore, it is of great significance to comprehensively analyze the response of a population age structure and regeneration growth to different habitats to predict distribution range dynamics [12].
The Chinese pine (Pinus tabuliformis) is one of the most widely distributed native conifer species in northern China and plays essential roles in soil and water conservation and biodiversity maintenance in temperate forest communities. The distribution areas of Pinus tabuliformis gradually decrease along the Qinling Mountains from west to east, with Huoditang, Ningshan County, on the southern slope of the mid-Qinling Mountains representing one of the most important areas where the species presents a dense distribution [30]. Zhu [31] and Xu [32] found that most Pinus tabuliformis individuals were zonally distributed on ridges or had small-area patches inlaid on the oak forest of the slope habitats, forming pine–oak mixed forests. Recent studies have focused on the community type, diversity, regeneration, and spatial pattern of stands in different environments to understand the status of the Pinus tabuliformis community [33]. Within such studies, focus has been placed on species characteristics such as functional traits [34], seed dispersal [35], tree growth response to climatic factors [36], and composition and diversity of ectomycorrhiza [37], while the driving factors of Pinus tabuliformis populations in ridge habitats and the adaptability characteristics of the species have been largely ignored. The distribution pattern of the Pinus tabuliformis population in Huoditang holds particular promise for the exploration of its distribution drivers and adaptability, as its population characteristics are shaped by large changes in terrain and associated environmental conditions over a relatively small area.
This study examined Pinus tabuliformis population age structure and regeneration dynamics in ridge and slope habitats across its distribution range in Huoditang. This comparative study of population dynamics and seedling growth variation correlating with environmental factors aimed to determine (1) the main factors driving the Pinus tabuliformis population distribution in ridge habitats and (2) the adaptability of Pinus tabuliformis population to ridge habitats.
2. Materials and Methods
2.1. Site Description
This experiment was conducted in the Huoditang forest region, in the middle Qinling mountains of Shaanxi Province, China (NSTEC; 108°21′ E, 33°18′ N to 108°29′ E, 33°28′ N). The climate is transitional between northern subtropical and warm temperate, with mean annual temperature (MAT) and mean annual precipitation (MAP) ranging from 8 °C to 10 °C and 1000 mm to 1200 mm, respectively. In addition, 70% of precipitation occurs as rain from June to September. The dominant soil type is brown forest soil, with an average thickness of 50 cm and a pH of 6.5. The vegetation in the study area is dominated by temperate coniferous and broad-leaved mixed forest and frigid coniferous forest and the percentage of forest cover is approximately 93.8%. The dominant tree species are Quercus aliena var. acuteserrata, Pinus tabuliformis, Pinus armandii, Tsuga chinensis, Picea asperata, and Betula albosinensi. Currently, 95% of the forest is secondary forest restored after heavy felling in the 1960s and the 1970s [38].
2.2. Field Sampling
In August 2021, 32 tree quadrats (20 m × 20 m) were set in ridge and slope habitats with similar elevations (1200 m and 1500 m, respectively) and slopes (25° and 35°, respectively) in the Pinus tabuliformis distribution range for a community survey. Within each tree quadrat, a 4 m2 shrub plot was established in the four corners and center of the tree plots and a 1 m2 herb plot was established in each shrub plot (Figure 1). In order to analyze the growth adaptation of the Chinese pine population in ridge habitats by comparing the growth rates of Chinese pine seedlings on ridges and slopes under similar lighting conditions, five gap plots in Chinese pine forests within slope habitats were found. In each tree quadrat, tree name, diameter at breast height (DBH), height, and coverage were recorded. Species name, height, number of individuals, coverage, tree seedling height, basal diameter, DBH (height > 1.3 m), and age were recorded in the shrub, herb, and gap plots. In each tree and gap plot, topographic factors such as geographical coordinates, elevation, and bedrock exposure rate were recorded.
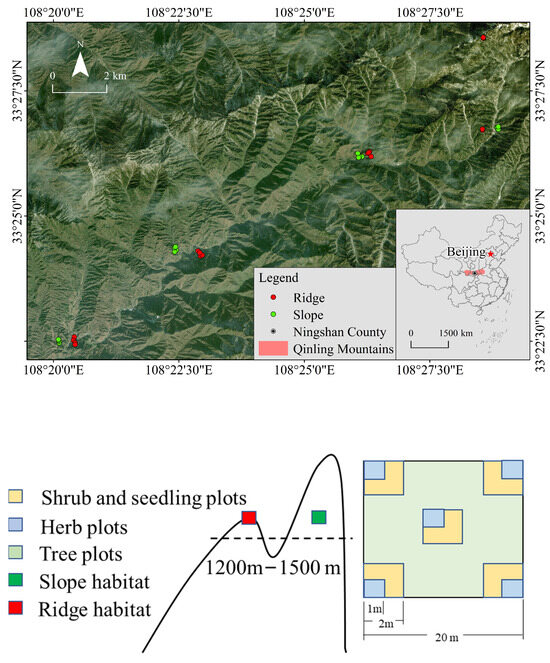
Figure 1.
Location of the study area and the experimental design layout of sample plots.
For soil sampling, nine replicated points were selected along an “S” shape in each tree plot. After removing the litter layer, seven soil samples (0–20 cm depth) were collected from each point using a 5 cm diameter stainless-steel auger on the same day and then fully homogenized to provide one composite sample per plot. A total of 37 soil samples (two habitats, ×16 tree plots, and five gaps) were collected. All soil samples were air-dried and stored at room temperature for physicochemical analysis after being sieved through a < 2 mm mesh to remove visible litter, animal residue, roots, stones, and debris.
2.3. Measurement of Soil Properties
The soil properties were measured following the method described by Bao [39]. Soil pH was determined using a pH meter after shaking a soil:distilled water (1:2.5, w/v) suspension for 30 min at 200 rpm. The soil organic carbon (SOC) content of the soil samples was measured using the K2Cr2O7 oxidation method. Soil total nitrogen (TN) concentration was determined by a semi-automatic Kjeldahl apparatus after digestion with K2SO4:CuSO4·5H2O (10:1, w/w)–H2SO4 and soil total phosphate (TP) concentration was determined via colorimetry using a UV spectrophotometer after digestion with HClO4–H2SO4.
2.4. Calculations and Statistical Analyses
Two species diversity indices were calculated: the Simpson’s index and Shannon’s index. The Simpson’s index was calculated as:
where D = diversity index, is the proportion of individuals of species i, N = number of individuals of all i, and = number of individuals of i.
The Simpson’s index was calculated as:
Species evenness was calculated using Shannon’s evenness index,
where is the Shannon–Wiener diversity index and S is the species number. Species richness R was instead determined by S [40].
Generally, the age structure of the tree is replaced by the DBH class. According to our survey data of DBH values, nine DBH classes and three age stages of our Pinus tabuliformis populations were classified. Class 1 was DBH < 5 cm and 5 cm was added for each class from classes 2 to 9. Stage 1: seedling and sapling, DBH < 5 cm; stage 2: middle-aged trees, 5 cm ≤ DBH < 20 cm; stage 3: adult trees, DBH ≥ 20 cm [41] (Table 1). Based on the characteristics of conifer tree species with obvious terminal bud scars and whorl branches, the age of Pinus tabuliformis seedlings was estimated by counting the terminal bud scars and layers of whorl branches.

Table 1.
Age structure division standard based on the range of DBH.
Seedling density and environmental factors were subjected to analysis of variance (ANOVA) to determine the differences among habitats; significant differences were determined at a 0.95 confidence level (p < 0.05) and post hoc Duncan’s multiple range tests and LSD tests were used for multiple comparisons.
A stepwise multiple regression model was used to determine the relationship between seedling density and various environmental factors, and a random forest model (RFM) was used to rank the explanatory degree and significance of each environmental factor on seedling density. Pearson’s correlation analysis was used to analyze the relationship between seedling growth and environmental factors at different ages.
All data were sorted by Microsoft Excel 2019. Species diversity index calculation, stepwise multiple regression, and RFM were conducted using R 4.03 for Windows, ANOVA and Pearson’s correlation analyses were conducted using SPSS 23.0, and all photos were plotted using Origin 2021 pro.
3. Results
3.1. Environment and Vegetation Characteristics
3.1.1. Environment Characteristics
As shown in Table 2, soil nitrogen and phosphorus content in slope habitats were significantly higher than those in ridge habitats, nitrogen content in gap habitats was significantly higher than that in slope habitats, and there was no significant difference in phosphorus content between gap and slope habitats (p < 0.05). Soil pH was less than 7 in all habitats but was lower in ridge habitats than in slope and gap habitats. Generally, soil fertility of slope and gap habitats was better than that of the ridge.

Table 2.
Biotic and abiotic factors across the three habitats.
3.1.2. Vegetation Characteristics
The results show that crown density and shrub coverage in slope and gap habitats were significantly higher than those in ridge habitats (p < 0.05), but there were no significant differences in the average height and coverage of the herb layer. The forest had a distinct tree, shrub, and herb layer system, and 121 species were recorded in ridge and slope habitats (slope: 111; ridge: 57), including 41 trees (slope: 33; ridge: 24), 57 shrubs (slope: 57; ridge: 22), and 23 herbs (slope: 21; ridge: 11). The species diversity of slope habitats was significantly higher than that of ridge habitats (p < 0.05). In slope habitats, the diversity of the tree and herb layers was significantly higher than that in the ridge. There was no significant difference in diversity in the shrub layer between ridge and slope habitats (Figure 2). Detailed information on the species composition is shown in Table 3.
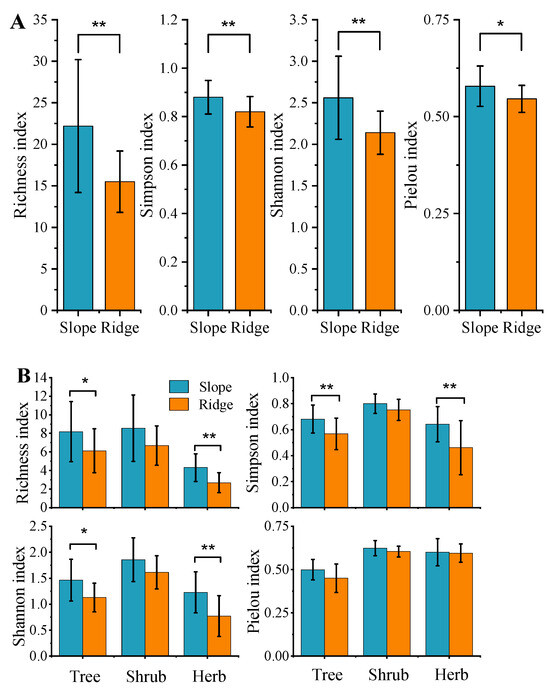
Figure 2.
Species diversity of Pinus tabuliformis community at different habitats. “*” indicates the index differing significantly between two habitats (p < 0.05), “**” indicates the index differing by an extreme amount between two habitats (p < 0.01), and the error bars show the SD of the means. (A,B) indicate all species diversity and species diversity of each layer.

Table 3.
Species composition and important value (IV) of Pinus tabuliformis community in slope and ridge habitats.
3.2. Niche and Competitive Characteristics
The niche breadth and niche overlap of the Pinus tabuliformis community are shown in Figure S1. Species with a relatively wider Levins species niche breadth included Pinus tabuliformis (0.96), Quercus aliena var. acutiserrata (0.54), and Pinus armandii (0.39). Species with a large niche overlap with Pinus tabuliformis were Quercus aliena var. acutiserrata (0.65) and Pinus armandii (0.63).
Hegyi’s single-tree competition index model was used to quantitatively analyze the intra- and interspecific competition intensities within the Pinus tabuliformis population. A total of 40 and 46 object woods and 739 and 1081 competitive woods were investigated in the slope and ridge habitats, respectively, and the proportion of other tree species in the ridge habitat (32.3%) was lower than that in the slope habitat (38.6%), indicating that intraspecific competition dominated the Pinus tabuliformis community in the study area. The competition index of the Pinus tabuliformis population in the ridge and slope habitats decreased with increasing DBH (Figure 3).
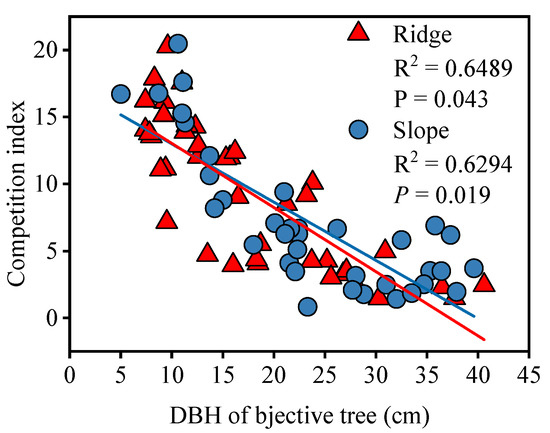
Figure 3.
Relationship between individual competition index and DBH (cm). A p < 0.05 indicates a significant correlation between the competition index and DBH.
3.3. Pinus Tabuliformis Population DBH Structure in Different Habitats
A total of 570 and 418 Pinus tabuliformis individuals were recorded in the ridge and slope habitats, respectively. According to the polynomial fitting results (Figure 4), DBH of the population in ridge habitats showed an inverted “J” distribution, with young and medium trees (DBH < 20 cm) being more abundant than large trees (DBH > 20 cm). In slope habitats, the DBH distribution followed a unimodal distribution and large trees were more productive than young and medium trees. These results indicate that the population in ridge habitats was experiencing an expansion trend at the time of the study, while that in slope habitats was declining.
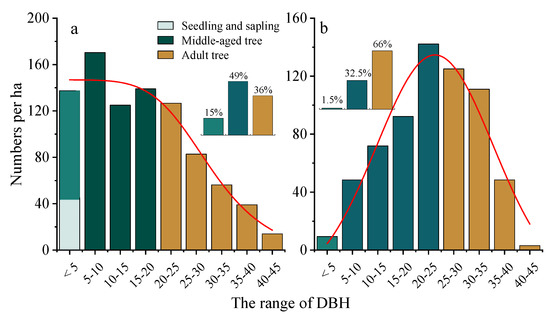
Figure 4.
DBH structure of Pinus tabuliformis population in different habitats. (a) Ridge habitats and (b) slope habitats.
3.4. Density and Growth of Seedlings in Different Habitats
Seedling density and the height and basal diameter of plants of the same age are usually used to determine plant survival and growth responses to different environments. During the sample plot survey, we found that the number of seedlings in ridge habitats was significantly higher than that in slope habitats. To understand the dynamics of Pinus tabuliformis seedlings with respect to different habitats, seedling density and growth characteristics were compared between understory and gap habitats on slopes, too. As shown in Figure 5 and Figure 6, the density of seedlings in ridge habitats was significantly higher than that in slopes, the age structure of seedlings on the slopes was uneven, and seedlings aged 1–2 years and >5 years were rare. The age structure of seedlings in the ridge habitats was continuous and the number of seedlings in each age group was higher than in slope habitats. The number of seedlings in gaps of slope habitats was significantly higher than that in understory habitats, and the surviving seedlings from each age group in gaps were obviously higher than in slope habitats.
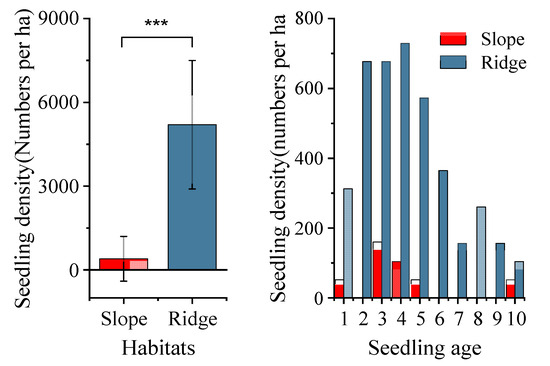
Figure 5.
Seedling density and age structure of Pinus tabuliformis in slope and ridge habitats. “***” indicates the index differing by an extreme amount between two habitats (p < 0.001).
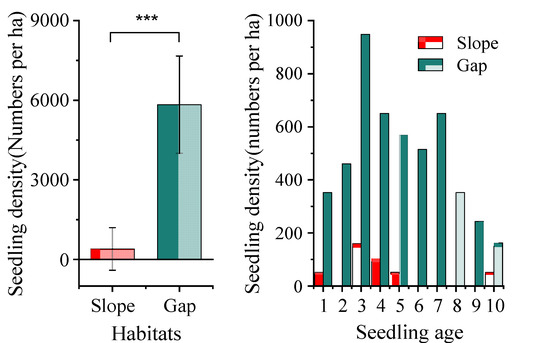
Figure 6.
Seedling density and age structure of Pinus tabuliformis in slope and gap habitats. “***” indicates the index differing by an extreme amount between two habitats (p < 0.001).
Regarding the seedling growth characteristics, as shown in Figure 7 and Figure 8, there was no significant difference in the height of seedlings below 5 years of age between slope and ridge habitats, and there was no significant difference in the base diameter of seedlings below 3 years of age; however, beyond 3 years of age, seedlings in ridge habitats exhibited larger base diameter than those in slope habitats. When comparing seedling height and base diameter between the gap and understory habitats on slopes, it was found that seedling height in gaps was higher than that in understory habitats, and, after 2 years, the difference reached significant levels (p < 0.01). Seedling base diameter between gaps and understory habitats showed trends similar to those exhibited by seedling height.
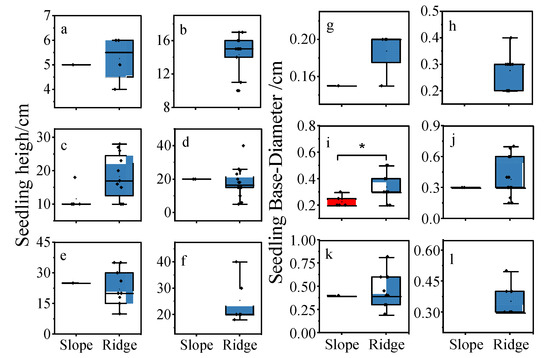
Figure 7.
Seedling height and base diameter comparing each age of Pinus tabuliformis between slope and ridge habitats. (a–l) represent ages 1 to 6, “*” indicates the index differing significantly between two habitats (p < 0.05).
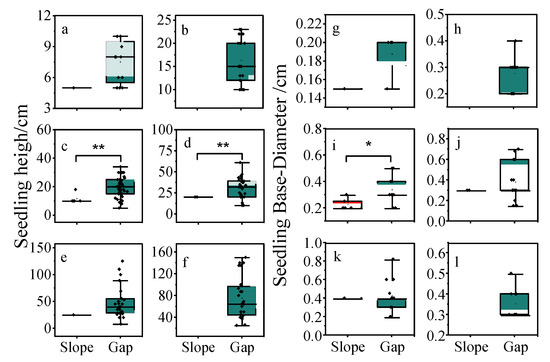
Figure 8.
Seedling height and base diameter comparing each age of Pinus tabuliformis between slope and gap habitats. (a–l) represent ages 1 to 6, “*” indicates the index differing significantly between two habitats (p < 0.05), “**” indicates the index differing by an extreme amount between two habitats (p < 0.01).
3.5. Effects of Environmental Factors on Number and Growth Dynamics of Pinus Tabuliformis Seedlings
Based on the stepwise multiple regression model results, the shrub density, canopy density, and SOC were entered into the interpretation model for seedling density. The model was significant (Adj-R2 = 0.68, p < 0.001) and was determined as:
where is the seedling density, is the density of shrub, is the crown density of the forest, and is the SOC.
The random forest model analyzed the ranking of environmental factors to explain seedling density and showed results similar to those produced by the multiple regression model (Figure 9).
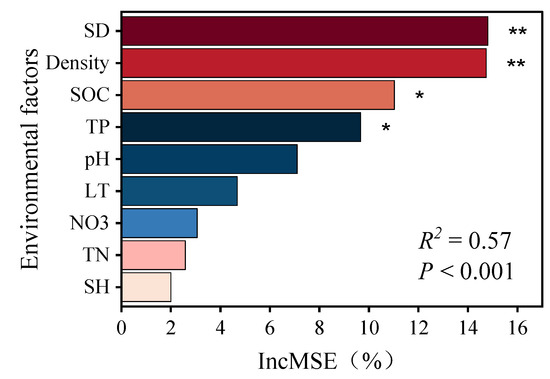
Figure 9.
Explanatory degree rank and significance of each environmental factor on seedling density. “*” represents significant (p < 0.05) and “**” represents extremely significant (p < 0.01).
Pearson’s correlation analysis of seedling height and basal diameter with environmental factors showed that seedling height was significantly and positively correlated with soil fertility indices (SOC, TN, and TP) but significantly and negatively correlated with crown density. There was no significant correlation between environmental factors and the basal diameter of seedlings from the ages of 1 to 4 years (Figure 10).
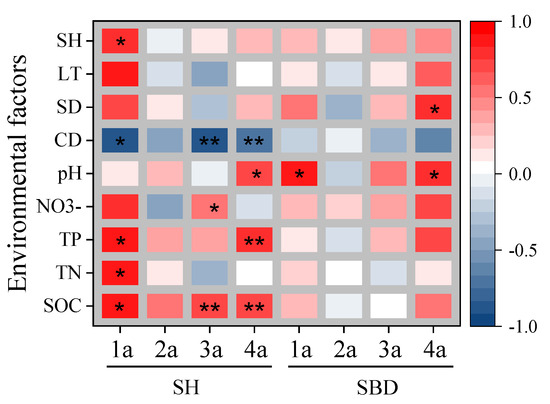
Figure 10.
Relationship between seedling growth and environmental factors. “*” represents significant correlation (p < 0.05), “**” represents an extremely significant correlation (p < 0.01), and the absence of a symbol indicates absence of significant correlation. 1a–4a represent ages 1 to 4 years. SH: seeding height, SBD: seedings base diameter.
4. Discussion
4.1. Driving Factors of Pinus Tabuliformis Population Distribution in Ridge Habitats
The distribution of species is affected by many factors; however, on a small scale, the distribution differences in species are mostly caused by competition. Competition indirectly affects plant distribution by altering the original living environment and resource conditions [42]. The dynamics of age structure and quantitative seedling characteristics of long-lived plant populations can be used as indicators of change in environmental and resource conditions caused by competition [43,44]. The age structure of a plant population refers to the age-matching status of individuals in the population, and the number of individuals at different age stages reflects dynamics changes and development trends of the population to a certain extent [45].
In the study area, most Pinus tabuliformis individuals were zonally distributed on ridges or had small-area patches inlaid on the oak forest of the slope habitats. Results show that the DBH structure of the Pinus tabuliformis population on slope habitats was a partially normal distribution and the number of middle-aged and elderly individuals was greater than that of young individuals, indicating that the Pinus tabuliformis population self-renewal ability is weak and has low potential in community competition [46,47]. The DBH structure of the Pinus tabuliformis population in ridge habitats showed an inverted ‘J‘ type, indicating that populations in ridge habitats belong to an increasing type of population [48]. Studies have shown that plant population structure and dynamics are influenced by a combination of plant reproductive characteristics and plant–environmental-factor interaction [49]. Comparing the population structure of Pinus tabuliformis between ridge and slope habitats, we found there is an obvious regeneration bottleneck in the slope habitat, as the density of seedlings was significantly lower than that in ridge and gap habitats. The regeneration bottleneck is probably caused by the asymmetric competition for light between individuals in different forest layers [50]. A stepwise multiple regression model revealed that the greater canopy light competition in the slope habitat prevents seedling supplementation and growth, confirming the above opinion. In ridge habitats, sufficient understory light caused by the high bedrock exposure rate is conducive to the recruitment of seedlings, and sufficient supplementation of Pinus tabuliformis seedlings ensures the number of individuals supplemented in the crown layer [51]. Pinus tabuliformis, as a light-demanding tree species, requires sufficient lighting conditions for the recruitment and growth of its seedlings [52], and the limited light resources under the forest in slope habitats result in the death of seedlings through competition, resulting in few seedlings transitioning to the middle and elderly age, thereby affecting the age structure distribution of the population. Gap disturbance plays an important role in increasing the regeneration potential of natural forests and promoting seedling growth [53], but the natural secondary forest of the study area is restored after heavy felling in the 1960s and the 1970s [54] and has few natural forest gaps due to the falling of senescent trees, all of which is not conducive to the Pinus tabuliformis extensive natural regeneration in slope habitats. Therefore, the sufficient light conditions characteristic of ridge habitats and the intrinsic biological traits of Pinus tabuliformis have led to the distribution of its populations in the ridge habitat on the southern slope of the middle Qinling Mountains.
4.2. Relationship between the Regeneration Dynamics and Environmental Factors
The distribution of a species at a particular stage of development varies depending on the environment [55]. A range of factors contribute to the distribution characteristics of a population in a particular habitat, reflecting its preference and adaptability to diverse habitats. In forests, disturbances are common and often affect the age structure and regeneration dynamics of plant populations [56]. Natural disturbances improve the regeneration of closed-canopy forests by canopy opening to create establishment and growth opportunities for seedlings [57]. Previous studies have found that forest gap interference significantly improves the density and growth rate of Pinus tabuliformis seedlings [58]. Microenvironmental factors such as soil moisture and fertility usually affect population development by influencing seedling growth but not survival [59,60]. Research suggests that there is a gradual transition of soil characteristics from the upper to the lower part of the slope. Transitioning from denudation to accumulation, the soil texture gradually changes from coarse to fine, and the soil water content increases [61]. Under better conditions, the age structure of long-lived plant populations generally exhibits an inverted J-type and the growth rate is faster [47,62]. This is because limiting factors can inhibit normal plant establishment and growth [63,64].
This study sampled the Pinus tabuliformis population at similar elevations (gap and ridge habitats) and slope (slope habitats) within its typical distributional range, excluding the effects of climate and dispersal on its distribution and growth. The results show that seedling densities were significantly higher in ridge habitats than in slope habitats and were not significantly different from gap seedling densities. However, seedling height and basal growth rate in individuals beyond 3 years of age were significantly lower than those recorded in the gap habitats of the slope. The smaller amount of Pinus tabuliformis seedlings in slope habitats compared to ridges might be linked to the influences of understory shrubs on successful seedling establishment and survival [65], and the growth rate of seedlings in ridge habitats was lower than in gaps in the slope due to, perhaps, differences in soil nutrient. Ryunosuke et al. studied the distribution and structure of tree species in different terrains and found that topography-mediated soil nutrients and light conditions differences have important effects on the species regeneration process [66]. Correlation analyses between seedling density, growth rate, and environmental factors confirmed the above conjecture: understory solar condition was found to be the main factor affecting seedling recruitment, whereas understory solar condition and soil fertility were important factors affecting seedling growth. These results indicate that the sufficient solar conditions on the ridges ensure the replenishment of seedlings, but the relatively harsh water and fertilizer conditions inhibit the growth of seedlings.
5. Conclusions
The sufficient light conditions in ridge habitats, the intrinsic biological traits of Pinus tabuliformis, and seedling recruitment and growth limitations in slope understory habitats have led to the distribution of its populations in the ridge habitat on the southern slope of the middle Qinling Mountains. In ridge habitats, sufficient light conditions promote Pinus tabuliformis regeneration and recruitment of larger classes. Still, poor soil conditions in ridge habitats limit the growth of Pinus tabuliformis seedlings while filtering out some competitors. Areas with sufficient solar radiation and soil fertility are suitable for Pinus tabuliformis regeneration; however, Quercus aliena var. acutiserrata and Pinus Amanda have a potential competitive advantage under good water and fertilizer conditions in forest stands in the Qinling Mountains. Thus, in order to promote the development of the Pinus tabuliformis population in slope habitats, transparent cutting of forest canopy plants should be carried out to promote its population regeneration.
Supplementary Materials
The following supporting information can be downloaded at: https://www.mdpi.com/article/10.3390/f14112252/s1, Figure S1. Main species Levins’ niche breadth and niche overlap of Pinus tabuliformis community.
Author Contributions
H.Y., D.W. and Y.P. designed the research. H.Y., Y.S., H.K. and Y.X. carried out fieldwork. H.Y. analyzed the data and wrote the manuscript. D.W., Y.S., Y.P. and H.K. reviewed the manuscript. All authors have read and agreed to the published version of the manuscript.
Funding
This work was supported by the National Natural Science Foundation of China (grant number 32271861).
Data Availability Statement
The data presented in this study are available on request from the corresponding author (email: wangdx66@126.com) or the first author (email: yhang07@nwafu.edu.cn) of this article.
Conflicts of Interest
The authors declare that the research was conducted in the absence of any commercial or financial relationships that could be construed as a potential conflict of interest.
References
- Ehrlén, J.; Morris, W.F. Predicting changes in the distribution and abundance of species under environmental change. Ecol. Lett. 2015, 18, 303–314. [Google Scholar] [CrossRef] [PubMed]
- Boulangeat, I.; Gravel, D.; Thuiller, W. Accounting for dispersal and biotic interactions to disentangle the drivers of species distributions and their abundances. Ecol. Lett. 2012, 15, 584–593. [Google Scholar] [CrossRef] [PubMed]
- Welk, A.; Welk, E.; Baudis, M.; Böckelmann, J.; Bruelheide, H. Plant species’ range type determines local responses to biotic interactions and land use. Ecology 2019, 100, e02890. [Google Scholar] [CrossRef]
- Soberon, J. Grinnellian and Eltonian niches and geographic distributions of species. Ecol. Lett. 2007, 10, 1115–1123. [Google Scholar] [CrossRef] [PubMed]
- Liu, K.; Zheng, Z.; Gong, D. Elevational patterns of species richness and their underlying mechanism. Chin. J. Ecol. 2017, 36, 14. [Google Scholar] [CrossRef]
- Vellend, M.; Verheyen, K.; Flinn, K.M.; Jacquemyn, H.; Kolb, A.; Van Calster, H.; Peterken, G.; Graae, B.J.; Bellemare, J.; Honnay, O.; et al. Homogenization of forest plant communities and weakening of species-environment relationships via agricultural land use. J. Ecol. 2007, 95, 565–573. [Google Scholar] [CrossRef]
- Figueiredo, F.O.G.; Zuquim, G.; Tuomisto, H.; Moulatlet, G.M.; Balslev, H.; Costa, F.R.C. Beyond climate control on species range: The importance of soil data to predict distribution of Amazonian plant species. J. Biogeogr. 2018, 45, 190–200. [Google Scholar] [CrossRef]
- Chauvier, Y.; Thuiller, W.; Brun, P.; Lavergne, S.; Descombes, P.; Karger, D.N.; Renaud, J.; Zimmermann, N.E. Influence of climate, soil, and land cover on plant species distribution in the European Alps. Ecol. Monogr. 2021, 91, e01433. [Google Scholar] [CrossRef]
- Zhu, Y.; Mi, X.C.; Ma, K.P. A mechainism of plant species coexisistence: The negative density-dependent hypothesis. Biodivers. Sci. 2009, 17, 594–604. [Google Scholar] [CrossRef]
- Adler, P.B.; Smull, D.; Beard, K.H.; Choi, R.T.; Furniss, T.; Kulmatiski, A.; Meiners, J.M.; Tredennick, A.T.; Veblen, K.E. Competition and coexistence in plant communities: Intraspecific competition is stronger than interspecific competition. Ecol. Lett. 2018, 21, 1319–1329. [Google Scholar] [CrossRef]
- Louthan, A.M.; Doak, D.F.; Angert, A.L. Where and When do Species Interactions Set Range Limits? Trends Ecol. Evol. 2015, 30, 780–792. [Google Scholar] [CrossRef] [PubMed]
- Godsoe, W.; Murray, R.; Plank, M.J. The effect of competition on species’ distributions depends on coexistence, rather than scale alone. Ecography 2015, 38, 1071–1079. [Google Scholar] [CrossRef]
- Wisz, M.S.; Pottier, J.; Kissling, W.D.; Pellissier, L.; Lenoir, J.; Damgaard, C.F.; Dormann, C.F.; Forchhammer, M.C.; Grytnes, J.A.; Guisan, A.; et al. The role of biotic interactions in shaping distributions and realised assemblages of species: Implications for species distribution modelling. Biol. Rev. 2013, 88, 15–30. [Google Scholar] [CrossRef]
- Wiens, J.J. The niche, biogeography and species interactions. Philos. Trans. R. Soc. B-Biol. Sci. 2011, 366, 2336–2350. [Google Scholar] [CrossRef] [PubMed]
- Soberon, J.M. Niche and area of distribution modeling: A population ecology perspective. Ecography 2010, 3, 159–167. [Google Scholar] [CrossRef]
- Lortie, C.J.; Brooker, R.W.; Choler, P.; Kikvidze, Z.; Michalet, R.; Pugnaire, F.I.; Callaway, R.M. Rethinking plant community theory. Oikos 2004, 10, 433–438. [Google Scholar] [CrossRef]
- Aschehoug, E.T.; Brooker, R.; Atwater, D.Z.; Maron, J.L.; Callaway, R.M. The Mechanisms and Consequences of Interspecific Competition Among Plants. Annu. Rev. Ecol. Evol. Syst. 2016, 47, 263–281. [Google Scholar] [CrossRef]
- Gao, W.Q.; Ni, Y.Y.; Xue, Z.M.; Wang, X.F.; Kang, F.F.; Hu, J.; Gao, Z.H.; Jiang, Z.P.; Liu, J.F. Population structure and regeneration dynamics of Quercus variabilis along latitudinal and longitudinal gradients. Ecosphere 2017, 8, e01737. [Google Scholar] [CrossRef]
- Bell, D.M.; Bradford, J.B.; Lauenroth, W.K. Early indicators of change: Divergent climate envelopes between tree life stages imply range shifts in the western United States. Glob. Ecol. Biogeogr. 2014, 23, 168–180. [Google Scholar] [CrossRef]
- Zhao, Y.; Qi, R.; Jiao, J.; Chen, X.L.; Cao, J.H.; Feng, Y.M.; Yang, M.M. Population structure and dynamic characteristics of Picea Purpurea at the Gahai-Zecha area. Acta Ecol. Sin. 2018, 38, 7447–7457. [Google Scholar] [CrossRef]
- Urbieta, I.R.; García, L.V.; Zavala, M.A. Mediterranean pine and oak distribution in southern Spain: Is there a mismatch between regeneration and adult distribution? J. Veg. Sci. 2011, 22, 18–31. [Google Scholar] [CrossRef]
- Poorter, L.; Bongers, F.; VanRompaey, R.S.A.R.; DeKlerk, M. Regeneration of canopy tree species at five sites in West African moist forest. For. Ecol. Manag. 1996, 84, 61–69. [Google Scholar] [CrossRef]
- Kumar, D.; Bhardwaj, D.R.; Sharma, P.; Bharti; Sankhyan, N.; Al-Ansari, N.; Linh, N.T.T. Population Dynamics of Juniperus macropoda Bossier Forest Ecosystem in Relation to Soil Physico-Chemical Characteristics in the Cold Desert of North-Western Himalaya. Forests 2022, 13, 1624. [Google Scholar] [CrossRef]
- Yin, Z.; Fan, X.H. Effects of herbs on tree seedlings in different succession stages of temperate forests in Changbai Mountain, China. Acta Ecol. Sin. 2020, 40, 2194–2204. [Google Scholar] [CrossRef]
- Li, W.Y.; Li, H.C.; Gan, X.H.; Zhang, X.M.; Fan, Z.L. Population structure and dynamics of the endangered tree Tetracentron sinense Oliver. Pak. J. Bot. 2020, 52, 613–619. [Google Scholar] [CrossRef]
- Kambo, D.; Danby, R.K. Danby, Factors influencing the establishment and growth of tree seedlings at Subarctic alpine treelines. Ecosphere 2018, 9, e02176. [Google Scholar] [CrossRef]
- Lombaerde, E.D.; Baeten, L.; Verheyen, L.; Perring, M.P.; Ma, S.; Landuyt, D. Understorey removal effects on tree regeneration in temperate forests: A meta nalysis. J. Appl. Ecol. 2020, 58, 9–20. [Google Scholar] [CrossRef]
- Rugemalila, D.M.; Cory, S.T.; Smith, W.K.; Anderson, T.M. The role of microsite sunlight environment on growth, architecture, and resource allocation in dominant Acacia tree seedlings, in Serengeti, East Africa. Plant Ecol. 2020, 221, 1187–1199. [Google Scholar] [CrossRef]
- Bolibok, L.; Janek, M.; Pawlak, B.; Dobrowolska, D. Spatial determinants of tree recruitment in mixed stands in southeastern Poland- silver fir’s interaction with lowland tree species. For. Ecol. Manag. 2023, 531, 120788. [Google Scholar] [CrossRef]
- Wu, G.; Feng, Z. Study on community characteristics and biomass of Pinus tabuliformis forest in China. Acta Ecol. Sin. 1994, 4, 415–422. [Google Scholar]
- Zhu, Z. Preliminary Study on Pinus tabuliformis forest in the Northern Slope of Qinling Mountains and Loess Plateau of Northern Shaanxi. Acta Bot. Boreali-Occident. Sin. 1987, 2, 73–82. [Google Scholar]
- Xu, H.C.; Sun, Z.F.; Guo, G.R.; Feng, L. Geographical distribution and provenance division of natural Pinus tabuliformis forest. Sci. Silvae Sin. 1981, 3, 258–270. [Google Scholar]
- Yin, W.K.; Hu, L.L.; Lu, X.; Gao, Y.; Kang, B. Species diversity of Pinus tabuliformis natural secondary forest community in Qinling Mountains. J. Northwest A F Univ. 2016, 44, 55–63. [Google Scholar]
- Tian, Y.L. Feature of Needle Functional Traits of Pinus tabuliformis and Their Response to Soil and Altitude in Qinling Mountains. Master’s Thesis, Northwest A&F University, Xianyang, China, 2021. [Google Scholar]
- Yu, F. Seed Dispersal Process and Natural Regeneration Pattern of Construct Species in the Pine-Oak Forests of the Qinling Mountains, China. Doctoral Thesis, Northwest A&F University, Xianyang, China, 2015. [Google Scholar]
- Li, Y.H.; Qi, G.Z.; Feng, R.R.; Liu, K. Responses of radial growth of Pinus tabuliformis to climate change at the northern slopes of Qinling Mountains, China. Chin. J. Appl. Ecol. 2022, 33, 2043–2050. [Google Scholar] [CrossRef]
- Wang, H.H. Seasonal Dynamics of Rhizospheric and Root Endophytic Microbe Communities of Pinus tabuliformis and Pinus armandii in Qinling Huoditang. Master’s Thesis, Northwest A&F University, Xianyang, China, 2016. [Google Scholar]
- Chai, Z.Z.; Wang, D.X. Environmental influences on the successful regeneration of pine-oak mixed forests in the Qinling Mountains, China. Scand. J. For. Res. 2015, 31, 368–381. [Google Scholar] [CrossRef]
- Bao, S.D. Soil and Agricultural Chemistry Analysis; China Agriculture Press: Beijing, China, 2000. [Google Scholar]
- Shaheen, H.; Ullah, Z.; Khan, S.M.; Harper, D.M. Species composition and community structure of western Himalayan moist temperate forests in Kashmir. For. Ecol. Manag. 2012, 278, 138–145. [Google Scholar] [CrossRef]
- Kang, D.; Guo, Y.X.; Ren, C.J.; Zhao, F.Z.; Feng, Y.Z.; Han, X.H.; Yang, G.H. Population Structure and Spatial Pattern of Main Tree Species in Secondary Betula platyphylla Forest in Ziwuling Mountains, China. Sci. Rep. 2014, 4, 6873. [Google Scholar] [CrossRef] [PubMed]
- Zhu, C.Q. Niche theory and its application in forest ecology. Chin. J. Ecol. 1993, 4, 41–46. [Google Scholar]
- Dang, H.S.; Zhang, K.R.; Zhang, Y.J.; Tong, X.Z.; Zhang, Q.F. Regeneration dynamics of subalpine fir (Abies fargesii) forest across the altitudinal range in the Shennongjia Mountains, central China. J. Plant Ecol. 2013, 6, 36–47. [Google Scholar] [CrossRef][Green Version]
- Brubaker, L.B. Responses of tree populations to climatic-change. Plant Ecol. 1986, 67, 119–130. [Google Scholar] [CrossRef]
- Benson, E.J.; Hartnett, D.C. The role of seed and vegetative reproduction in plant recruitment and demography in tallgrass prairie. Plant Ecol. 2006, 187, 163–177. [Google Scholar] [CrossRef]
- Wang, T.; Liang, Y.; Ren, H.B.; Yu, D.; Ni, J.; Ma, K.P. Age structure of Picea schrenkiana forest along an altitudinal gradient in the central Tianshan Mountains, northwestern China. For. Ecol. Manag. 2004, 196, 267–274. [Google Scholar] [CrossRef]
- Holz, A.; Veblen, T.T. Tree regeneration responses to Chusquea montana bamboo die-off in a subalpine Nothofagus forest in the southern Andes. J. Veg. Sci. 2006, 17, 19–28. [Google Scholar] [CrossRef]
- Guo, Y.X.; Kang, B.; Li, G.; Wang, D.X.; Yang, G.H.; Wang, D.W. Species composition and point pattern analysis of standing trees in secondary Betula albo-sinensis forest in Xiaolongshan of west Qinling Mountains. Chin. J. Appl. Ecol. 2011, 22, 2574–2580. [Google Scholar] [CrossRef]
- Xue, W.Y.; Yang, B.; Zhang, W.H.; Yu, S.C. Spatial pattern and spatial association of Quercus acutissima at different developmental stages in the Qiaoshan Mountains. Acta Ecol. Sin. 2017, 37, 3375–3384. [Google Scholar]
- Wang, H.J.; Zhang, X.P.; Xu, X.M.; Wang, M.Q.; Tian, Q.L. Changes in species composition and structure during vegetation community succession in Ziwuling forest area. Bull. Soil Water Conserv. 2023, 43, 119–128. [Google Scholar]
- Lu, J.M.; Johnson, D.J.; Qiao, X.J.; Lu, Z.J.; Wang, Q.G.; Jiang, M.X. Density dependence and habitat preference shape seedling survival in a subtropical forest in central China. J. Plant Ecol. 2015, 8, 568–577. [Google Scholar] [CrossRef]
- Huang, Y. Community Structure, Population Structure and Dynamics of Chinese Pine (pinus tabuliformis) Distributed on Ridge in the Middle of Qinling Mountains. Master’s Thesis, Nrothwest A&F University, Xianyang, China, 2016. [Google Scholar]
- Chen, B.; He, Z.S.; Jiang, L.; Xie, Z.Y.; Li, Y.D.; Li, J.X.; Li, M.J.; Wei, C.S.; Xing, C.; Liu, J.F. Taxonomic and phylogenetic diversity of plants in a Castanopsis kawakamiinatural fores. Biodivers. Sci. 2021, 29, 439–448. [Google Scholar] [CrossRef]
- Kang, H.B.; Xue, Y.; Yan, C.L.; Lu, S.; Yang, H.; Zhu, J.Q.; Fu, Z.J.; Wang, D.X. Contrasting patterns of microbial nutrient limitations between rhizosphere and bulk soil during stump sprout restoration in a clear-cut oak forest. For. Ecol. Manag. 2022, 515, 10. [Google Scholar] [CrossRef]
- Xue, J.H. Forest Ecology; China Forestry Press: Beijing, China, 2006. [Google Scholar]
- Firm, D.; Nagel, T.A.; Diaci, J. Disturbance history and dynamics of an old-growth mixed species mountain forest in the Slovenian Alps. For. Ecol. Manag. 2009, 257, 1893–1901. [Google Scholar] [CrossRef]
- Jiang, L.; Wei, C.S.; He, Z.W.; Zhu, J.; Xing, C.; Wang, X.L.; Liu, J.F.; Shen, C.X.; Shi, Y.W. Functional trait variation of plant communities in canopy gaps of Castanopsis kawakamii natural forest. Chin. J. Plant Ecol. 2022, 46, 13. [Google Scholar] [CrossRef]
- Wang, Z.; Yang, H.; Wang, D.; Zhao, Z. Spatial distribution and growth association of regeneration in gaps of Chinese pine (Pinus tabuliformis Carr.) plantation in northern China. For. Ecol. Manag. 2019, 432, 387–399. [Google Scholar] [CrossRef]
- Viani, R.A.G.; Rodrigues, R.R.; Dawson, T.E.; Oliveira, R.S. Savanna soil fertility limits growth but not survival of tropical forest tree seedlings. Plant Soil 2011, 349, 341–353. [Google Scholar] [CrossRef]
- Liu, B.; Chen, W.; Chen, F.S.; Tang, R.Y.; Wang, X.D.; Chen, Y.Q.; Bu, W.S. Responses of seedling growth in subtropical secondary broad-leaved forest to nitrogen and phosphorus addition in Jiulian Mountain, China. Chin. J. Appl. Ecol. 2020, 31, 2533–2540. [Google Scholar] [CrossRef]
- Zhou, P.; Liu, G.B.; Hou, X.L. Study on Soil Physical and Nutrients Properties of Different Slope Aspects and Positions in Eroded Loess Hilly Region. J. Soil Water Conserv. 2008, 1, 7–12. [Google Scholar] [CrossRef]
- Taylor, A.H.; Zisheng, O. Tree replacement patterns in subalpine Abies-Betula forests, Wolong Natural Reserve, China. Vegetatio 1988, 78, 141–149. [Google Scholar] [CrossRef]
- Beals, K.K.; Scearce, A.E.; Swystun, A.T.; Schweitzer, J.A. Belowground mechanisms for oak regeneration: Interactions among fire, soil microbes, and plant community alter oak seedling growth. For. Ecol. Manag. 2022, 503, 119774. [Google Scholar] [CrossRef]
- Sangsupan, H.A.; Hibbs, D.E.; Withrow-Robinson, B.A.; Elliott, S. Effect of microsite light on survival and growth of understory natural regeneration during restoration of seasonally dry tropical forest in upland northern Thailand. For. Ecol. Manag. 2021, 489, 119061. [Google Scholar] [CrossRef]
- Wang, B.; Tian, X.L.; Cao, T.J. Uncertainty analysis of height predictions for young Pinus tabuliformis using a bayesian approach. Sci. Silvae Sin. 2020, 56, 73–86. [Google Scholar] [CrossRef]
- Tateno, R.; Takeda, H. Forest structure and tree species distribution in relation to topography-mediated heterogeneity of soil nitrogen and light at the forest floor. Ecol. Res. 2003, 18, 559–571. [Google Scholar] [CrossRef]
Disclaimer/Publisher’s Note: The statements, opinions and data contained in all publications are solely those of the individual author(s) and contributor(s) and not of MDPI and/or the editor(s). MDPI and/or the editor(s) disclaim responsibility for any injury to people or property resulting from any ideas, methods, instructions or products referred to in the content. |
© 2023 by the authors. Licensee MDPI, Basel, Switzerland. This article is an open access article distributed under the terms and conditions of the Creative Commons Attribution (CC BY) license (https://creativecommons.org/licenses/by/4.0/).