Article

Comparison of the Stand Structure Diversity of Open Pinus brutia Ten. Forests in Areas of Different Productivity in Central Cyprus

1
Department of Forests, Ministry of Agriculture, Rural Development and Environment, 1414 Nicosia, Cyprus
2
Department of Forestry and Management of the Environment and Natural Resources, Democritus University of Thrace, Pantazidou 193, 682 00 Orestiada, Greece
*
Author to whom correspondence should be addressed.
Forests 2023, 14(11), 2200; https://doi.org/10.3390/f14112200
Submission received: 28 September 2023 / Revised: 22 October 2023 / Accepted: 3 November 2023 / Published: 6 November 2023
(This article belongs to the Section Forest Biodiversity)

Abstract

:
The goal of this study is to compare the diversity of the stand structure of open P. brutia forests in areas of different productivity at middle elevations in central Cyprus. This will help us figure out how much biodiversity they can hold. Two plots of 4 ha were randomly established. One 200 m × 200 m square-shaped plot was established in a P. brutia formation in a medium productivity site, and one in a P. brutia formation in a bad productivity site. In each plot, dendrometrical data were recorded. In total, 160 hemispherical photographs were taken on both plots. The stand structure is more heterogeneous and complex at medium productivity sites compared to bad productivity sites. P. brutia formations in medium productivity sites can support greater biodiversity than the corresponding formations in bad productivity sites. In the open P. brutia formations of central Cyprus, forest practice must aim to increase the density of P. brutia trees in some tree groups to reduce light intensity under the group canopy. Moreover, trees with large diameters and/or heights must be protected from disturbances. This approach will increase the ability of formations to support biodiversity.

1. Introduction

Global warming influences forest ecosystems, and as time passes, its impact will become stronger and stronger. Practices in the forest must take into account methods for preserving different forest types and ecosystems as well as for restoring ecosystems that have suffered damage due to global warming [1]. To be prepared for the adverse situations that will come, the forest ecosystems that are under pressure today have to be analyzed. Their stand structure has to be analyzed and should be fully understood.
Among others, forest-stand structure refers to the distribution of trees, their characteristics, or their parts at a specific time [2,3]. Stand-structure analysis is a valuable tool in the disposal of forest practice for the understanding of forest ecosystems and for the determination of forest species ecology to treat forests [2,3].
In this context, stand structure is strongly related to the abiotic and biotic conditions created in forests [2,3,4,5,6,7], and, thus, its heterogeneity is used as a surrogate of biodiversity in forests [4]. One of the most significant abiotic factors determined by stand-structure characteristics is light conditions under the stand canopy [3,4,5,6,7], as well as temperature conditions that are closely connected to light regime since both comprise solar radiation [5]. Moreover, stand-structure characteristics such as tree density and tree dimensions influence wind intensity inside a forest stand [3,5,8]. Practically, stand structure through tree species composition, tree and crown density, as well as canopy gaps determines the climatic conditions inside a stand, including the amount of rain and snow water that reach forest floor and soil, and stand evapotranspiration [2,3,5,6,8]. Thus, through climatic conditions, stand structure influences biotic community that is developed under the stand canopy, in forest floor, and in upper soil [2,3,5,6,8].
Moreover, trees are the base of many food chains and are incorporated into a large number of niches [5,6]. So, stand structure is not only the woodstock, and its analysis is not only fundamental for the design of treatments for wood production. On the contrary, as mentioned above, stand structure and its diversity determine biodiversity in forests [4].
As a result, regardless of the ability of a forest to provide economically viable and sustainable wood production, its stand-structure description and variability assessment are crucial for determining the forest’s potential to support biodiversity.
Pine forests are a very important and dominant element of the vegetation in the Mediterranean basin. They cover an area of approximately 13 million ha, which is 5% of the total area of the region and 25% of its forest land [9]. P. brutia spreads in the eastern Mediterranean and is one of the most characteristic species of its vegetation, since according to recent calculations, the area it covers probably exceeds 6 million ha [10].
The areas where P. brutia grows are mainly characterized by a Mediterranean climate, where summers are hot and dry while winters are mild and rainy [11]. Average annual precipitation in the areas where P. brutia spread is between 400 mm and 2000 mm, while average annual temperatures range from 12 °C to 20 °C [12]). P. brutia is not a site-demanding species, occurs on most types of bedrock, and can adapt to most types of soils [11,13]. Although it is a photophilous species [5], it can form extensive forests in the “climax” stage [11,12]. The economic value and importance of P. brutia forests are very high in the countries where they spread, since in many of them they are the only source of timber [14,15]. P. brutia forests are an important habitat for biodiversity protection since they support a significant number of both endemic plants and animals (see [10]).
According to many historical accounts, Cyprus was an island whose almost entire area was covered with forests [16]. Many people who dominated the Mediterranean region in the past built their mighty fleets from timber that came from the Cypriot forests [16]. Many of the forest products were exported many times to other countries, mainly for construction use. Another factor that caused intense exploitation of the Cypriot forests in the third millennium BC was the mining and processing of copper. This ‘industry’ required vast quantities of timber to process the copper medal ores [17]. The forests of Cyprus were heavily exploited both during the Roman period and during the Middle Ages [16]. Over the centuries until the Turkish occupation, the forests of Cyprus suffered severe and even irreparable damage. Many areas were reclaimed (even barren slopes with steep gradients) to be cultivated as vineyards and olive groves. What forests remained were heavily exploited with illegal logging, grazing, deliberate fires for pasture enrichment, and resinization of conifers [17]. Cyprus began to recover in 1878 when the island came under British rule. During this period, the state was organized, and at the same time, the forests ceased to be under so much pressure. Laws prohibited illegal logging and grazing in forests [17]. It is noteworthy that in the last 50–120 years, for various socio-economic reasons, many lands that were managed as olive groves and vineyards were abandoned. This resulted in the re-establishment of forest species in them.
P. brutia is the main and most important forest species in Cyprus, as it covers approximately 65% of the island’s forests. It covers a total area of 193,272 ha out of the total of 300,277 ha, which constitutes the total area of the forest land of Cyprus [18]. It grows all over the island, from sea level up to 1600 m altitude. Between 1300 m and 1600 m above sea level, it creates mixed stands with black pine (Pinus nigra ssp. pallasiana (Lamb.) Holmboe) [19,20,21,22]. A significant part of the Cypriot P. brutia state forests (16,835 ha) has been classified either as National Forest Parks, mainly to provide recreation to the public, or as Nature Conservation Areas, with the primary objective of protecting and conserving these ecosystems [23]. Of the total P. brutia forests in Cyprus, only 41,399 ha are considered exploitable for timber production, while the rest are currently assessed as unexploitable [23].
A major threat to P. brutia forests in Cyprus is forest fires, while damage caused by insects and fungi is less important [21,22]. [21] reports that although P. brutia shows remarkable resistance to the two extreme elements of the Cyprus climate, drought and the long period of high temperatures, it is not rare that tree deaths are observed in mainly wind-swept areas due to these climatic elements. Mediterranean ecosystems, such as those of Cyprus, are characterized by hot and dry summers of long duration with high-intensity solar radiation, high temperatures, and little or no precipitation [24]. Throughout the period when these conditions prevail, the plants are in a state of intense stress.
The P. brutia forests in the middle elevations of the central part of Cyprus were established in the last century, mainly in abandoned vines and olive yards [25]. In the middle elevations of the central part of the island, dense or “closed” P. brutia formations covering a large area are observed in very few cases. On the other hand, “open” (the ground cover of the tree canopy projection is rather low) P. brutia stands dominate the landscape.
The aim of this study is to compare the diversity of the stand structure of open P. brutia forests in areas of different productivity at middle elevations in central Cyprus as a basis for the assessment of their biodiversity-carrying capacity.

2. Materials and Methods
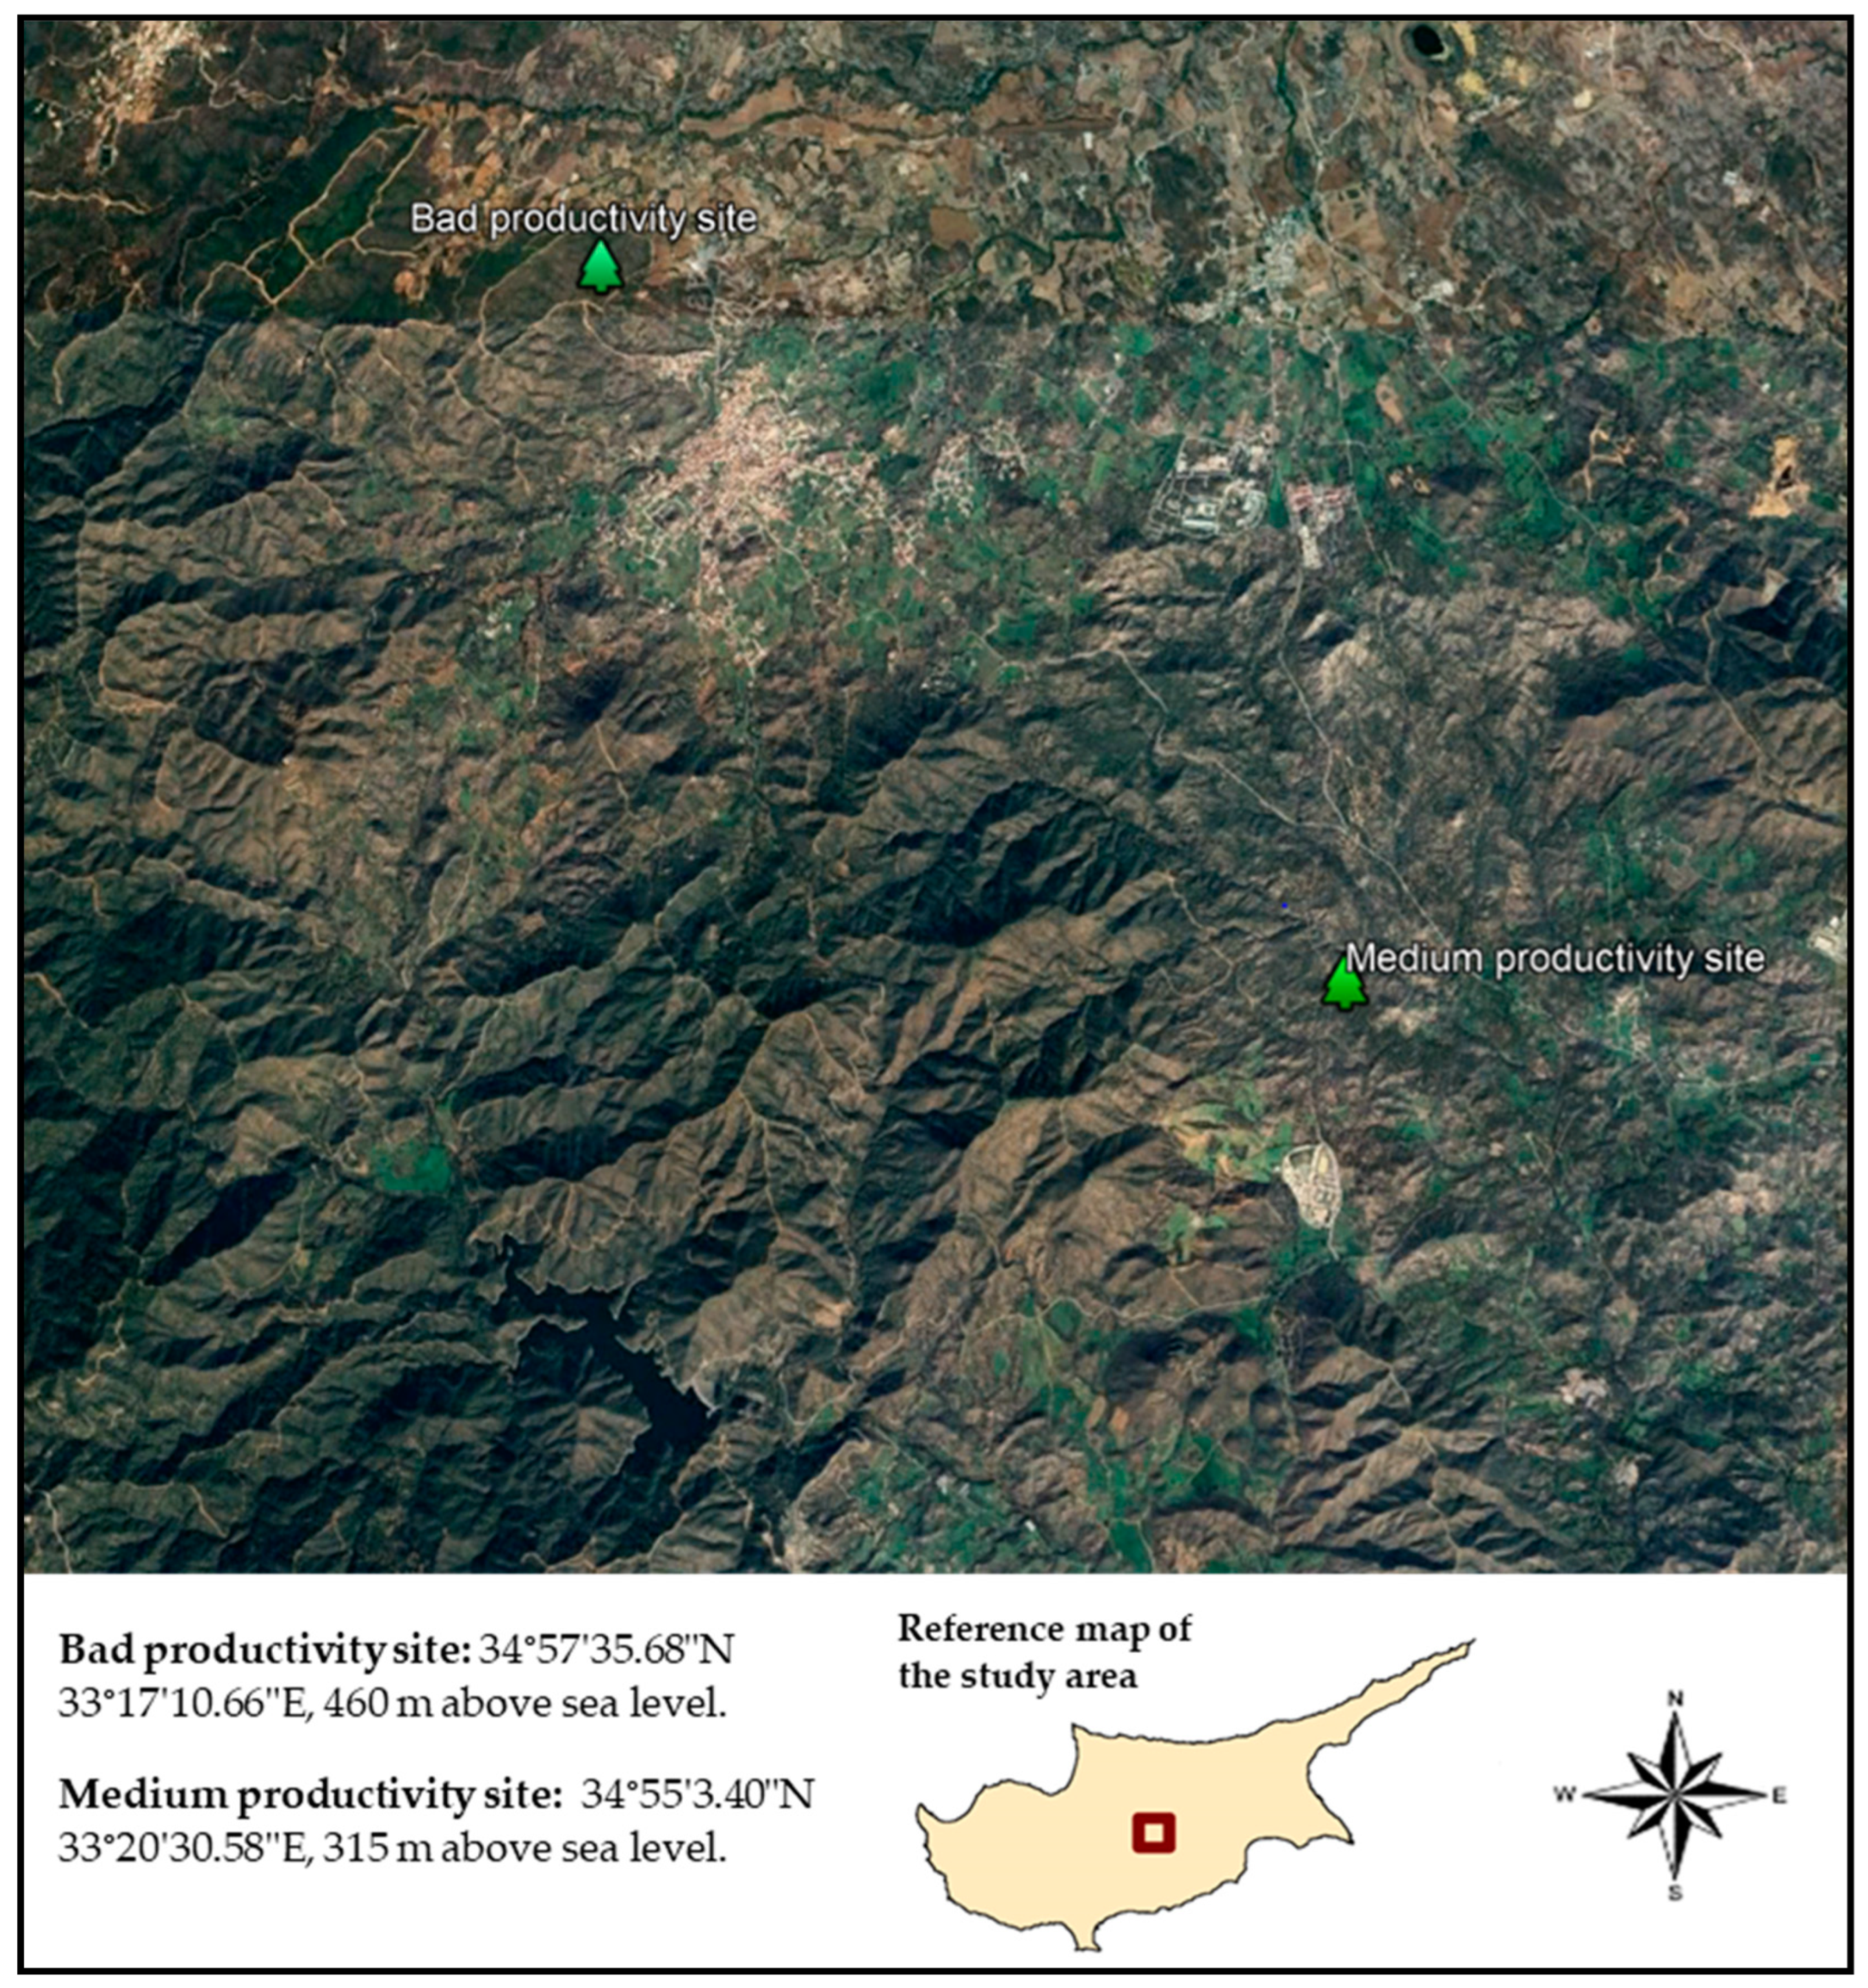
2.1. Study Area

The area where the research was carried out is in central Cyprus (34°56′0.00″ N, 33°17′0.00″ E) at middle elevations. The P. brutia forests in the middle elevations of the central part of Cyprus were mostly established in abandoned vines and olive yards throughout the last century [25]. In this study, altitudes ranging from 300 m to 750 m above sea level were considered middle elevations. The total area is 14,000 ha. The study site is not a designated protected area.
The closest meteorological station where both temperature and rainfall data are recorded is in Kornos, where the mean yearly temperature is 18.4 °C, and the rainfall annually is 477.1 mm (for 1991–2000). In the study area, the substrate belongs to volcanic sequence diabase dykes with pillow lava screens [26]. The texture of the soil issandy loam to sandy clay loam, and the pH of the soil is slightly acidic to slightly alkaline [27]. Apart from P. brutia, the other species found under pines and in the interspaces are Pistacia terebinthus L., P. lentiscus L., Cistus salviifolius L., C. creticus L., Lavandula stoechas L., Thymus capitatus L., Calicotome villosa (Poir.) Link, Olea europaea L., etc.
In the larger study area, [27] found that there were three types of sites in the P. brutia formations based on how productive they were: sites with good productivity, sites with medium productivity, and sites with bad productivity. These were based on the annual increments of cores taken from the stump height of 30 cm and the depth of the soil. Soil depth in sites of bad productivity is approximately 15–30 cm; in sites of medium productivity, it is 40–80 cm; and in sites of good productivity, it is over 100 cm [27].

2.2. Research Method

As mentioned in the introduction section, open P. brutia formations dominate the landscape. In this study, “open” is considered any P. brutia formation in which the percentage of ground cover of the tree canopy projection is lower than 75% of the formation area. P. brutia open forest areas in the middle elevation of central Cyprus are mainly found in sites of medium and bad productivity. Moreover, good productivity sites of P. brutia formations appear scattered, having small areas.
In order to present and compare the stand structure and its diversity among P. brutia formations in large contiguous areas, the study took place in P. brutia formations growing in medium and bad productivity sites.
In 2014, in P. brutia open formations growing in medium and bad productivity sites, two plots of 4 ha were randomly established in areas with slopes up to 20% (Figure 1). One 200 m × 200 m square-shaped (4 ha) plot was established in a P. brutia formation in a medium productivity site, and one in a formation in a bad productivity site.
These plots were then divided into four square-shaped sub-plots of 1 ha, eight square-shaped sub-plots of 0.5 ha, and finally sixteen square-shaped sub-plots of 0.25 ha (see [28]).
In the areas where the two plots were established, soil profiles were made, and increment cores were taken from dominant and codominant trees. The soil depth confirmed the classification of the areas in the two types of site productivity, while the mean annual increment of trees (total height divided by the total age of the tree) [29] verified the same classification based on the P. brutia site index curves developed for central Cyprus by [30].
On each plot, the number and species of living trees with a height greater than 1.5 m and their Diameter at Breast Height (DBH) were measured using a diameter tape. In each plot of 4 ha in one of the four sub-plots with an area of 1 ha, which was randomly selected, the total height of the trees was measured. The measurements of the heights of the trees were carried out with the Haga altimeter. In addition, the age of the trees was measured by taking 50 increment cores from each of the two productivity sites at a height of 0.3 m from the ground (stump height). Increment cores were taken from randomly selected trees in different diameter classes. Within each subplot of 0.25 ha, in each plot of 4 ha (16 sub-plots in each plot), five points were randomly selected, and hemispherical photographs were taken over each point at a height of 1.5 m above the ground. In total, 160 hemispherical photographs (80 in each plot) were taken to determine the light conditions in each plot. The hemispherical photograph was taken using a horizontally leveled digital camera (a Nikon Coolpix 900 digital camera with a fisheye lens). The photographs were taken after sunset or before sunrise under homogeneous sky conditions (clear sky). Hemiview canopy analysis software version 2.1 [31] was used for the analysis of the photos. Visible Sky (or gap fraction or canopy openness) (VS) is the part of the sky that is seeable as a proportion of the total hemisphere when it is seen from a single point [32]. The VS value is related to the amount of solar radiation incident on the specific point [31,32,33]. When VS takes the value 0, it means that the total sky is blocked. On the other hand, when VS takes the value 1, it means that the total sky is seeable.

2.3. Statistical Analysis

The Hill Numbers-True Diversity [34,35] were used to look at the differences in DBH and height distributions between the P. brutia stands (or formations-plots) in the two different productivity sites. The calculations in these comparisons were made using the template of [36], using the data of the two plots of 200 m × 200 m for the diameter and VS distributions the data of the sub-plots where the height of the trees was measured. These comparisons were made by applying the z-test, according to the template of [36], where the proportion of Hill Numbers was defined as the Hill Number divided by the number of classes. For the creation of diameter and height distributions in each DBH or height class, the diameters and heights of the other species were added to the diameters and heights of the P. brutia trees. The order q refers to the richness and abundance that constitute diversity. When q = 0, we only take into account richness (i.e., the number of classes). As q increases, abundance (i.e., the number of trees per class) has an increased impact on biodiversity. This means that when q is greater than 0, diversity is not only determined by the number of different classes present but also by the uneven number of trees within each class. The higher the value of q, the more weight is given to uneven tree distribution in calculating biodiversity.
The VS means between the two productivity sites were compared using the t-test.
To examine which typical distribution fitted better to total DBH and total height distributions (diameters and heights of the other species were added to the diameters and heights of the P. brutia trees) of the plots (and sub-plots for heights), the Anderson–Darling statistic was applied. Sixty-one distributions were tested for their fit using the EasyFit 5.4 software [37]. The distribution exhibiting the lowest value in the Anderson–Darling statistic had the closest fit [38]. p-values were not available in some cases for some of the distributions that were tested. As a result, the decision regarding the distributions that fit better was taken using the value of the Anderson–Darling statistic only [39].

3. Results

The other species component of the medium productivity site consisted of Olea europaea, Pistacia lentiscus, and P. terebinthus trees, while the bad productivity site consisted of Olea europaea, Crataegus azarolus L., and P. terebinthus trees. The range of DBH classes where P. brutia trees appeared in the medium productivity site was greater than that of the bad productivity site. In the medium productivity site, pines appeared from a DBH class of two cm up to 58 cm, having a higher density in the class of six cm. The corresponding values for P. brutia trees in the bad productivity site were two up to the class of 38 cm and six cm (Figure 2).
Correspondingly, the range of height classes where P. brutia trees appeared in the medium productivity site was greater than that of the bad productivity site (Figure 3). Even though in both sites P. brutia trees appeared in the height class of 1 m, in the medium productivity site pines appeared up to the class of 19 m, while in the bad productivity site, they appeared up to the class of 9 m.
On the contrary, in the VS distribution, the opposite pattern was observed. In the bad productivity site, the VS values appeared from the class of 0.25 to the class of 0.85, while in the medium productivity site, the VS values appeared from the class of 0.25 to the class of 0.65 (Figure 4).
In the smallest DBH class (0–8 cm), in the medium productivity site, the age of trees was 40–65 years, while in the largest DBH class (56–64 cm), it was 100–119 years. Respectively, in the bad productivity site, in the smallest DBH class (0–8 cm), the age range in the stump height was 43–68 years, while in the largest diameter class (32–40 cm), it was 85–98 years (Table 1). In the medium productivity site, the oldest tree (where the increment core was taken) was 125 years old, and the age difference between the youngest and the oldest tree was 85 years. In the bad productivity site, the oldest tree was 98 years old, while the age difference between the youngest and the oldest tree was 55 years (Table 1).
In the medium productivity site, the density of P. brutia trees was 227 n/ha, while in the bad productivity site, it was 285 n/ha. The basal area of P. brutia trees in the medium productivity site was 8.740 m2/ha, which was higher than that of the bad productivity site, which was 4.407 m2/ha (Table 2).
When we look at the diameter and height distribution diversity of the medium and bad productivity sites next to each other, we can see that the bad productivity site has statistically significantly less diversity from order q = 0 to q = ∞ (Table 3). This suggests that the bad productivity site not only has fewer diameter and height classes than the medium productivity site, but also a more uniform distribution of diameters and heights compared to the medium productivity site.
The JohnsonSB distribution fitted better with the distributions of the total diameters and total heights at the medium productivity site, while at the corresponding diameters at the bad productivity site, the Dagum distribution fitted better (Figure 5). In the case of the total height distribution at the bad productivity site, the Gamma distribution fitted better (Figure 6).
The mean value of VS in the bad productivity site (0.572) was greater than that of the medium productivity site (0.418) (t = −7.382, p = 0.000).

4. Discussion

The distributions of total DBH and total height were different in the two productivity sites (Figure 2 and Figure 3). Moreover, both distributions of total DBH and total height in P. brutia formation in the medium productivity site were more diverse (p < 0.05) than in the formation of the bad productivity site. This diversity difference comprised a difference in the numbers of DBH and height classes (in the distributions) as well as a variability in the distributions of trees in the various DBH and height classes (Table 3). The observed differences between the P. brutia formations in the two productivity sites indicate that the stand structure is more heterogeneous and complex in medium productivity sites compared to bad productivity sites, and thus P. brutia formations in medium-productivity sites can support greater biodiversity than the corresponding formations in bad productivity sites. According to [4], greater stand-structure heterogeneity and complexity are related to higher biodiversity. Moreover, trees with large dimensions add biodiversity to a stand since faunal populations are related to them [4]. The highest diameter class where P. brutia trees occurred in the medium productivity site was the 58 cm class (58 is the center of the class). The pines were distributed in all diameter classes, from the lowest (of 2 cm) to the highest (of 58 cm). On the contrary, in the bad productivity site, the tree with the largest DBH was by far smaller than that of the medium productivity site and belonged to the class of 38 cm. The same pattern was observed in the tallest trees in the P. brutia formations at the two productivity sites. In the P. brutia formation of the medium productivity site, the tallest trees (which belonged to the height class of 19 m) were by far taller than those (which belonged to the height class of 9 m) in the formation of the bad productivity site (Figure 2).
In the formation of the medium productivity site, the basal area was almost double that in the formation of the bad productivity site (Table 2), indicating that P. brutia formations of medium productivity sites can support biodiversity more efficiently compared to formations of bad productivity sites. Ref. [40] used the total quantity of wood stock (m3/ha) as a criterion to measure biodiversity in stands of Greek forests in their Biodiversity Assessment Index. The higher the wood stock, the better for biodiversity. Moreover, the total wood stock was considered the best criterion in that index [40]. Light conditions influence the abiotic conditions inside forests and affect biodiversity [2,3,5,8]. In the formation of the bad productivity site, the VS was distributed in more classes than in the medium productivity site (Figure 4). However, the VS (and consequently light intensity) under the canopy of trees was lower (p < 0.05) in the medium productivity site formation than in the bad productivity site.
In the case of central Cyprus, the existence of shaded areas in P. brutia formations is more significant for biodiversity than the existence of gaps and more lighted areas since areas with low light are rare. It must be noted that the lowest VS class where VS values appeared in both plots was the class of 0.25 (Figure 4). On the other hand, there were many areas with sparse P. brutia trees with high light availability in the landscape of central Cyprus in medium elevations. In the medium productivity site plot, there were more photographs with VS values (12 photographs) in the class of 0.25 compared to those of the bad productivity site (2 photographs).
Based on the previously mentioned facts, it can be concluded that the light conditions seem to be more favorable for biodiversity at medium productivity sites compared to bad productivity sites.
At both productivity sites, the P. brutia formations are unevenly aged. In the medium productivity site, a greater age difference was observed. In particular, the age difference in trees on the plot at that site was 85 years. It must be mentioned that this age difference was observed in an area of 4 ha. It seems that, in most cases, the trees in both productivity sites were not established after a single major disturbance that acted in a large area but after a number of minor disturbances that affected small areas. However, mainly in bad productivity sites, in some cases, the adverse site conditions might have delayed the full occupation of growing space by trees, leading to a great age difference between them [2].
The stand-structure analysis and the assessment of stand-structure heterogeneity differences, as well as the analysis of VS characteristics in the studied formations, will provide valuable information for their conservation and their ability to support biodiversity. Moreover, these analyses will help forest practices carry out targeted manipulations to increase the suitability of P. brutia formation structural characteristics for higher biodiversity.
Forest practice, through the appropriate silvicultural treatments, can achieve various goals in forest stands [41]. In the open P. brutia formations of central Cyprus, forest practice must increase the density of P. brutia trees in some tree groups to reduce light intensity under the group canopy. This can be carried outby planting P. brutia trees at the edges of groups with high density compared to adjacent areas. However, the goal is not to close the gaps between the groups. Moreover, trees with large diameters and/or heights must be protected from disturbances (for example, illegal cuttings) in order for their density to not be reduced and, as time passes, to increase their dimensions (mainly diameter). This approach will increase the ability of formations to support biodiversity. These actions are important to start and be more intense at bad productivity sites.

5. Conclusions

Both distributions of total DBH and total height in P. brutia formation at the medium productivity site were more diverse than in formation at the bad productivity site. This diversity difference comprised a difference in the numbers of DBH and height classes (in the distributions) as well as a variability in the distributions of trees in the various DBH and height classes. Thus, the stand structure was more heterogeneous and complex at sites with medium productivity compared to those with bad productivity. In the medium productivity site, the trees with the largest dimensions were greater than those in the bad productivity site, while in the formation of the medium productivity site, the basal area was almost double that in the bad productivity site. Based on the previously mentioned evidence, it is concluded that P. brutia formations in medium-productivity sites can support greater biodiversity than the corresponding formations in bad productivity sites. Moreover, the light conditions seem to be more favorable for biodiversity in medium productivity sites compared to bad productivity sites. In the open P. brutia formations of central Cyprus, forest practice must increase the density of P. brutia trees in some tree groups to reduce light intensity under the group canopy. However, the goal is not to close the gaps between the groups. Moreover, trees with large diameters and/or heights must be protected from disturbances. This approach will increase the ability of formations to support biodiversity. These actions are important to start, and to be carried out more intensively, at bad productivity sites.

Author Contributions

Conceptualization, P.P., E.M. and K.K.; methodology, P.P., K.K., E.M. and A.S.; software, P.P., K.K., E.M. and A.S.; validation, K.K. and A.S.; formal analysis, P.P., K.K., E.M. and A.S.; investigation, P.P.; data curation, P.P., K.K. and A.S.; writing—original draft preparation, P.P., E.M. and K.K.; writing—review and editing, K.K. and A.S.; visualization, K.K.; supervision, E.M. All authors have read and agreed to the published version of the manuscript.

Funding

This research received no external funding.

Data Availability Statement

Data are contained within the article. The data presented in this study are available in the tables and figures of this article.

Acknowledgments

The authors wish to thank the Department of Forests (Cyprus) for its support.

Conflicts of Interest

The authors declare no conflict of interest.

References

  1. Milios, E. Facilitation process and sprouting ability as silvicultural tools in the frame of climate change. In Forest Ecosystems and Climate Changes, Proceedings of the Plenary Lectures of the International Scientific Conference: Forest Ecosystems and Climate Changes, Belgrade, Serbia, 9–10 March 2010; Institute of Forestry: Belgrade, Serbia, 2010; pp. 137–142. [Google Scholar]
  2. Oliver, C.D.; Larson, B.C. Forest Stand Dynamics; John Wiley & Sons, Inc.: New York, NY, USA, 1996. [Google Scholar]
  3. Smith, D.M.; Larson, B.C.; Kelty, M.J.; Ashton, P.; Mark, S. The Practice of Silviculture, 9th ed.; John Wiley & Sons, Inc.: New York, NY, USA, 1997. [Google Scholar]
  4. Lindenmayer, D.B.; Franklin, J.F. Conserving Forest Biodiversity: A Comprehensive Multiscaled Approach; Island Press: Washington, DC, USA, 2002. [Google Scholar]
  5. Dafis, S. Forest Ecology; Giahoudis-Giapoulis: Thessaloniki, Greece, 1986. [Google Scholar]
  6. Barnes, B.V.; Zak, D.R.; Denton, S.R.; Spurr, S.H. Forest Ecology, 4th ed.; John Wiley & Sons, Inc.: New York, NY, USA, 1998. [Google Scholar]
  7. O’Hara, K. Multiaged Silviculture: Managing for Complex Forest Stand Structures; Oxford University Press: Oxford, UK, 2014. [Google Scholar]
  8. Dafis, S. Applied Silviculture; Giahoudis-Giapoulis: Thessaloniki, Greece, 1992. [Google Scholar]
  9. Richardson, D.M.; Rundel, P.W. Ecology and Biogeography of Pinus: An Introduction. In Ecology and Biogeography of Pinus; Cambridge University Press: Cambridge, UK, 1998; pp. 3–40. [Google Scholar]
  10. Demiguel, S. Growth and Yield Modelling for Optimal Multi-Objective Forest Management of Eastern Mediterranean Pinus brutia. Diss. For. 2014, 170, 59. [Google Scholar] [CrossRef]
  11. Boydak, M. Silvicultural Characteristics and Natural Regeneration of Pinus brutia Ten.—A Review. Plant Ecol. 2004, 171, 153–163. [Google Scholar] [CrossRef]
  12. Boydak, M.; Dirik, H.; Çalıkoğlu, M. Forest Stand Dynamic, Regeneration and Fire in Pinus brutia Ecosystems. In Biology and Silviculture of Turkish Red Pine (Pinus brutia Ten.); Istanbul Universitesi Orman Fakultesi: Ankara, Turkey, 2006. [Google Scholar]
  13. Quézel, P. Taxonomy and biogeography of Mediterranean pines (Pinus halepensis and P. brutia). In Ecology, Biogeography and Management of Pinus halepensis and P. brutia Forest Ecosystems in the Mediterranean Basin; Neeman, L., Trabaud, L., Eds.; Backhuys Publishers: Leiden, The Netherlands, 2000; pp. 1–12. [Google Scholar]
  14. Gezer, A. The sylviculture of Pinus brutia in Turkey. In Le Pin d’Alep et le Pin Brutia Dans la Sylviculture Méditerranéenne; CIHEAM: Paris, France, 1986; pp. 55–66. [Google Scholar]
  15. Fischer, R.; Lorenz, M.; Köhl, M.; Becher, G.; Granke, O.; Christou, A. The Condition of Forests in Europe: 2008 Executive Report; United Nations Economic Commission for Europe, Convention on Long-Range Transboundary Air Pollution: Hamburg, Germany, 2008; p. 23. [Google Scholar]
  16. Paionidis, L. Forestry in Cyprus (115 Years of Contribution to the Country 1879–1994); Ministry of Agriculture, Natural Resources and Environment, Department of Forestry of Cyprus: Aglantzia, Cyprus, 1994.
  17. Thirgood, J.V. Cyprus: A Chronicle of Its Forests, Land and People; University of British Columbia Press: Vancouver, BC, Canada, 1987; ISBN 978-0-7748-0268-0. [Google Scholar]
  18. Forests Department of Cyprus. Mapping of Woody Forest Vegetation in Cyprus; Forests Department of Cyprus: Nicosia, Cyprus, 2020.
  19. Meikle, D.R. Flora of Cyprus; Bentham—Moxon Trust Royal Botanic Gardens Kew: Richmond, UK, 1977; Volume I, p. 832. [Google Scholar]
  20. Greuter, W.; Burdet, H.M.; Long, G. Med-Checklist; Conservatoire et Jardin botaniques de la Ville de Genève: Geneva, Switzerland, 1984; Volume 4, Available online: http://ww2.bgbm.org/mcl/ (accessed on 8 August 2023).
  21. Pantelas, V. The forest of brutia pine in Cyprus. Options Mediterr. Ser. Stud. 1986, 1, 43–46. [Google Scholar]
  22. Tsintidis, T.; Hadjikyriakos, G.N.; Christodoulou, C.S. Trees and Shrubs in Cyprus; Cyprus Forest Association: Nicosia, Cyprus, 2002; p. 442. [Google Scholar]
  23. FAO. Global Forest Resource Assessment 2010; Report Cyprus; Food and Agriculture Organization of the United Nation: Rome, Italy, 2010. [Google Scholar]
  24. Valladares, F.; Pearcy, R.W. Drought Can Be More Critical in the Shade than in the Sun: A Field Study of Carbon Gain and Photo-Inhibition in a Californian Shrub during a Dry El Niño Year. Plant Cell Environ. 2002, 25, 749–759. [Google Scholar] [CrossRef]
  25. Petrou, P.; Milios, E. Investigation of the Factors Affecting Artificial Seed Sowing Success and Seedling Survival in Pinus brutia Natural Stands in Middle Elevations of Central Cyprus. Forests 2020, 11, 1349. [Google Scholar] [CrossRef]
  26. Geological Survey Department of Cyprus. Geological Map of Cyprus, Revised ed.; Press and Information Office: Nicosia, Cyprus, 1995.
  27. Petrou, P. Regeneration, Growth and Structure of Calabrian Pine (Pinus brutia Ten.) Stands in the Middle Elevations of Central Cyprus. Ph.D. Thesis, Democritus University of Thrace, Orestiada, Greece, 2015. [Google Scholar]
  28. Sagheb-Talebi, K.; Schütz, J.-P. The Structure of Natural Oriental Beech (Fagus orientalis) Forests in the Caspian Region of Iran and Potential for the Application of the Group Selection System. Forestry 2002, 75, 465–472. [Google Scholar] [CrossRef]
  29. Husch, B.; Miller, C.I.; Beers, T.W. Forest Mensuration; John Wiley & Sons, Inc.: New York, NY, USA, 1982. [Google Scholar]
  30. Kitikidou, K.; Petrou, P.; Milios, E. Dominant height growth and site index curves for Calabrian pine (Pinus brutia Ten.) in central Cyprus. Renew. Sustain. Energy Rev. 2012, 16, 1323–1329. [Google Scholar] [CrossRef]
  31. Delta-T Devices Ltd. HemiView User Manual; Delta-T Devices Ltd.: Cambridge, UK, 1999. [Google Scholar]
  32. Hale, S.E. Light regime beneath Sitka spruce plantations in northern Britain: Preliminary results. For. Ecol. Manag. 2001, 151, 61–66. [Google Scholar] [CrossRef]
  33. Montgomery, R.A. Effects of understory foliage on patterns of light attenuation near the forest floor. Biotropica 2004, 36, 33. [Google Scholar] [CrossRef]
  34. Rényi, A. On Measures of Information and Entropy. In Proceedings of the 4th Berkeley Symposium on Mathematics, Statistics and Probability, Berkeley, CA, USA, 20 June–30 July 1960; University of California Press: Berkeley, CA, USA, 1961; pp. 547–561. [Google Scholar]
  35. Jost, L. Entropy and Diversity. Oikos 2006, 113, 363–375. [Google Scholar] [CrossRef]
  36. Kitikidou, K.; Milios, E.; Stampoulidis, A.; Pipinis, E.; Radoglou, K. Within-Forest Stand (or Formation, or Plot) and between-Forest Stand (or Formation, or Plot) Biodiversity Indices. MethodsX 2022, 9, 101919. [Google Scholar] [CrossRef] [PubMed]
  37. Schittkowski, K. EASY-FIT: A Software System for Data Fitting in Dynamical Systems. Struct. Multidiscip. Optim. 2002, 23, 153–169. [Google Scholar] [CrossRef]
  38. Anderson, T.W.; Darling, D.A. A Test of Goodness of Fit. J. Am. Stat. Assoc. 1954, 49, 765–769. [Google Scholar] [CrossRef]
  39. IBM Corp. Released IBM SPSS Statistics for Windows, Version 21.0; IBM Corp: Armonk, NY, USA, 2012. [Google Scholar]
  40. Bourma, K.; Milios, E.; Radoglou, K.; Kitikidou, K. Development of a Graded Biodiversity Assessment (GBA) Index for the Assessment of the Biodiversity of Managed Natural Forests. Ecologies 2023, 4, 614–626. [Google Scholar] [CrossRef]
  41. Stampoulidis, A.; Pipinis, E.; Petrou, P.; Kitikidou, K. Regeneration Analysis of the Juniperus Excelsa Mixed Stands in Prespa National Park of Greece as a Base for the Assessment of the Appropriate Silvicultural Treatment for the Conservation of the Species. South-East Eur. For. 2023, 14, 47–52. [Google Scholar] [CrossRef]
Figure 1. Location of the two P. brutia experimental plots.
Forests 14 02200 g001
Figure 2. Tree DBH distributions in the two productivity sites.
Forests 14 02200 g002
Figure 3. Tree height distributions in the two productivity sites.
Forests 14 02200 g003
Figure 4. VS distributions in the two productivity sites.
Forests 14 02200 g004
Figure 5. Best-fit distributions to total diameter data.
Forests 14 02200 g005
Figure 6. Best-fit distributions to total height data.
Forests 14 02200 g006
Table 1. Age range of P. brutia trees having different diameters in the two productivity sites.
DBH Range
(cm)
Age Range (Years)
Medium Productivity SiteBad Productivity Site
0–840–6543–68
8–1656–6544–90
16–2462–7575–96
24–3277–9078–94
32–4081–10285–98
40–48108–125
48–56107–115
56–64 (58.3 *)100–119
* 58.3 is the largest DBH that was measured in the medium productivity site.
Table 2. Structural data of P. brutia formation in the two productivity sites.
Medium Productivity Site
SpeciesDBH
(cm)
Height
(m)
Basal Area (m2/ha)Density
(n/ha)
MeanS.D.Min.Max.MeanS.D.Min.Max.TotalTotal
P. brutia18.4912.6141.058.39.853.9281.318.08.740227
Other species3.7012.6021.09.63.263.9032.05.50.02719
Bad Productivity Site
SpeciesDBH
(cm)
Height
(m)
Basal Area (m2/ha)Density
(n/ha)
MeanS.D. *Min.Max.MeanS.D. *Min.Max.TotalTotal
P. brutia12.107.3820.638.24.051.3741.78.24.407285
Other species3.497.3661.09.52.281.4211.603.00.02420
* S.D.: Standard deviation.
Table 3. Distribution diversity comparison by applying the Hill Numbers z-test.
Order
q
DBHHeight
Proportionsz-
Value
p-
Value
Bad Site’s Diversity,
Compared with the
Medium Site’s Diversity
Proportionsz-
Value
p-
Value
Bad Site’s Diversity,
Compared with the
Medium Site’s Diversity
00.6009.3340.000Significantly
Decreasing
0.6678.5670.000Significantly
Decreasing
0.4000.333
10.4307.7850.000Significantly
Decreasing
0.5199.0610.000Significantly
Decreasing
0.2720.186
20.3817.0180.000Significantly
Decreasing
0.4628.4120.000Significantly
Decreasing
0.2430.163
30.3546.5610.000Significantly
Decreasing
0.4287.7860.000Significantly
Decreasing
0.2270.156
40.3546.5610.000Significantly
Decreasing
0.4287.7860.000Significantly
Decreasing
0.2270.156
0.2404.5000.000Significantly
Decreasing
0.2874.4810.000Significantly
Decreasing
0.1630.145
Disclaimer/Publisher’s Note: The statements, opinions and data contained in all publications are solely those of the individual author(s) and contributor(s) and not of MDPI and/or the editor(s). MDPI and/or the editor(s) disclaim responsibility for any injury to people or property resulting from any ideas, methods, instructions or products referred to in the content.

