Article

Individual Tree Height Increment Model for Quercus mongolica Secondary Forest in the Northeastern China Using Generalized Nonlinear Two-Level Mixed-Effects Model

1
Beijing Key Laboratory of Greening Plants Breeding, Beijing Academy of Forestry and Landscape Architecture, Beijing 100102, China
2
Research Institute of Forest Resource Information Techniques, Chinese Academy of Forestry, Beijing 100091, China
3
Experimental Center of Forestry in North China, Chinese Academy of Forestry, No. 1 Shuizha West Road, Mentougou District, Beijing 102300, China
*
Author to whom correspondence should be addressed.
Forests 2023, 14(11), 2162; https://doi.org/10.3390/f14112162
Submission received: 22 September 2023 / Revised: 24 October 2023 / Accepted: 25 October 2023 / Published: 30 October 2023
(This article belongs to the Special Issue New Theories and Methods in Tree and Stand Measurement and Modeling)

Abstract

:
(1) Background: Mongolian oak secondary forest is widely distributed in the northeast of China, and most of these forests are formed after the overcutting of broad-leaved Pinus koraiensis mixed forest. Most of the forest productivity is low and the ecological function is degraded, due to insufficient understanding of Mongolian oak and lack of scientific management. Deepening the research on exploring reasonable management measures of Mongolian oak secondary forest to an improved stand status is the basis for improving its quality and promoting its forward succession process. (2) Methods: Twelve permanent plots with an area of 1 ha were established in the Mongolian oak secondary forest on Tazigou forest farm in Wangqing, Jilin Province of northeastern China. The response of tree height increment of Mongolian oak secondary forest is studied based on the survey data of 2013 and 2018. Two-level nonlinear mixed-effects models were constructed to predict the height of a single tree using sample plots and tree species as random effects, combined with a variety of tree size factors, site factors, and competitive factors as independent variables. (3) Results: The significant factors related to the height increment of Mongolian oak secondary forest are the initial diameter at breast height as the size of the tree itself (DBH), height (H), crown height ratio (CR), and site productivity index reflecting site quality (SPI). The distance-dependent and distance-independent competition indexes have no significant effect on tree height increment. The fitting accuracy of the two-level mixed-effects model that introduces plots and tree species as random effects has been greatly improved (coefficient of determination R2 increased by 51.8%). The prediction results show that the two trees with the largest DBH have the strongest prediction ability. (4) Conclusions: The generalized nonlinear two-level mixed-effects model constructed in this study can describe the height increment of an individual tree in the Mongolian oak secondary forest. Two sample trees, namely the two largest trees in each sub-plot, were applied for estimating the random effects when both measurement cost and potential errors of prediction were balanced.

1. Introduction

Quercus mongolica has vigor roots, strong adaptability, and high resistance to natural disasters. It is the main group species of coniferous and broad-leaved mixed forests in North and Northeast China, and plays an important role in maintaining regional ecology balance and ecosystem rehabilitation and restoration [1,2]. Mongolian oak secondary forest is widely distributed in Northeast China, its growth condition is generally poor, and it has not been paid adequate attention in management and practice. However, with the increasing environmental threats caused by climate change, the precise improvement of forest quality of oak tree species is becoming increasingly important due to their good environmental adaptability and the ability to produce high-quality wood. Therefore, it is significant to study the growth dynamics of Mongolian oak secondary forest, which provides a basis for guiding the management of such forests.
Currently, research on the growth dynamics of forest stands mainly focuses on basal area growth models, mortality models, and diameter increment models. There is less research on tree height increment models, and most tree height increment models focused on even-aged pure forests or a certain tree species, let alone uneven-aged forests with complex stand condition [3,4,5]. The independent variables used to establish a tree height increment model typically include total tree height (H), diameter at breast height (DBH), DBH increment (DI), stand density, competition, tree species composition, and productivity [6,7].
The individual tree height increment (HI) model is often used to simulate stands dynamics with complex structure and multiple tree species [8,9]. According to current research, individual tree height increment models could be divided into two categories: (1) It is believed that tree height increment is comprehensively influenced by three factors: site quality, tree size, and competition; (2) The potential productivity correction model, which considers the increment of the individual tree height would be determined by factors such as the maximum potential tree height increment and competition in the forest stand. Compared with models at the stand level, such models can provide information on tree size and can be used to infer the increment effects raised by traditional or advanced stand management methods. Some scholars believed that the first derivative of the individual tree height increment model can be used to deduce the tree height increment model, but the condition is limited to cases when the independent variable includes age and is not complex [10]. Since it is unrealistic to obtain the age of every tree in uneven-aged forests, especially in natural forest, it is imperative to establish an age-independent tree height increment model.
In this study, Mongolian oak secondary forest was taken as the research object. The age-independent individual tree height increment model of Mongolian oak secondary forest was established by using the two phases monitoring data of permanent sample plots. This paper aims to (1) establish two-level nonlinear mixed-effects models to predict the height increment of a single tree with sample plots and tree species as random effects, (2) evaluate the effects of tree size factors, site factors, and competitive factors on the height increment of Mongolian oak secondary forest, and (3) determine the optimal sampling number on balancing the prediction accuracy and cost of mixed-effects models. Moreover, the research results can provide a basis for better management of such forests.

2. Materials and Methods

2.1. Data Collection

The research area is located in Tazigou Forest Farm, Wangqing Forestry Bureau, Yanbian Korean Autonomous Prefecture, Jilin Province, China, with geographical coordinates of 129°97′–130°22′ E and 43°32′–43°49′ N. The topography terrain is mainly composed of low mountains and hills, with slopes ranging from 5° to 25°, and the altitude is between 300 and 1200 m. The research area belongs to temperate continental monsoon climate, with an average annual temperature of around 3.9 °C and a total annual temperature of 2144 °C. The lowest average temperature is about −32 °C in January; the highest average temperature is around 22 °C in July. The average annual precipitation is about 500–600 mm, and most of precipitation concentrated in summer. The soil mainly consists of dark brown soil, and the valleys are composed of meadow soil, swamp soil, peat soil, or alluvial soil. The vegetation in the study area belongs to the flora of Paektu Mountain, and the main tree species are Quercus mongolica, Betula platyphylla, Pinus koraiensis, Picea asperata, Abies nephrolepis, Larix olgensis, Betula costata, Tilia tuan, Betula dahurica, Populus ussuriensis, Acer pictum, Ulmus japonica, Fraxinus mandschurica, etc.
Representative Mongolian oak Secondary forests were selected in Tazigou Forest Farm of Wangqing Forestry Bureau in 2013, and 12 sample plots with an area of 1 ha were set up. Every individual tree (DBH equals or larger than 5 cm) in the sample plots was measured including these indexes: the tree species, tree health, and tree classification. The DBH, H, height to crown base (HCB), crown width (CW) (in the four directions of south, east, north, and west), as well as the relative coordinate information of individual trees were measured. The second measurement was conducted on the sample plots in 2018 with the same content of the first time. The overview of the sample plots is shown in Table 1.
There are measuring errors in tree height, especially in mountainous areas with steep slope. For broad-leaved tree species, due to the crown recognition, it is not as easy as coniferous tree species, it will lead to comparable larger errors. For slower-growing tree species, the measurement errors may even exceed the increment in a certain period. Therefore, it can be understood that there are some cases of negative values in the dataset, and these data were screened and excluded in our study.

2.2. Methods

2.2.1. Candidate Models

The candidate models were mainly used to show the basic trend of height increment of Mongolian oak natural secondary forest. The Box Lucas equation [11,12] and the exponential equation [13] were selected as the basis models. Some studies have shown when tree height H was used as the independent variable, the model would be more accurate [8,14,15], and some scholars recommend to use DBH. In the process of building the basic model, both H and DBH were introduced, and the square or logarithmic form of DBH and H would be used to develop models. To avoid overfitting, the following 8 basic models were selected for this study.
H I = a 1 a 1 a 2 ( e a 2 H e a 1 H )
H I = a 1 a 1 a 2 ( e a 2 D B H e a 1 D B H )
H I = a 1 e a 2 ln H a 3 H
H I = a 1 e a 2 ln D B H a 3 D B H
H I = a 1 e a 2 ln H a 3 H 2
H I = a 1 e a 2 ln D B H a 3 D B H 2
H I = a 1 e a 2 ln D B H a 3 H
H I = a 1 e a 2 ln D B H a 3 H 2
where HI represents the annual average height increment of trees (m/year), H represents the initial height of trees (m), and DBH represents the initial diameter at breast height (cm). a1, a2, and a3 represent the parameters that need to be estimated.

2.2.2. Variables Selection

The main factors affecting the individual tree height increment include three aspects: the size of individual trees, competition from neighbor trees, and site quality. Overall, 16 variables were selected based on their ecological meaning and the correlation between tree height increment and them. Among these 16 variables, DBH, basal area (BA), DI, basal area increment(BAI), H, mean crown width (MCW), ratio of H to DBH (HDR), and ratio of crown length to H (CR) reflected individual tree sizes. The competition factors were taken into account simultaneously, including the competition factors related to distance between subject trees and competition trees including Hegyi index and aCI index based on intersection and crowding. The distance-independent competition indexes including the sum basal area of all of trees whose DBH larger than subject tree, the total basal area of the forest (BASUM), the ratio of the basal area of the subject tree species to the basal area of the forest (SC), and the ratio of the DBH of the subject tree to the stand average DBH (CI). The site quality of forest reflects the external environment of trees growth. Site index and site form are usually used to express the site quality. Site index is more suitable to reflect the site quality of even-aged pure forest [16]. Mongolian oak secondary forest is composed of multiple tree species and the age structure is comparably complex, so it is not suitable to consider site index and age in this case [10,14]. Therefore, this study would use the relationship between tree height and DBH to represent site productivity (SPI) [10], which is determined by the relationship between tree height and DBH of dominant and sub-dominant trees.
S P I = 1.3 + a 1 1 H 1.3 a 20 D B H c
H t , i k = 1.3 + ( H t , i j 1.3 ) × 1 e b D B H i k 1 e b D B H i j k b + ε i k
where Ht,ik represents the stand dominant height of the i-th sample plot in the k-th survey, Ht,ij represents stand dominant height in the j-th survey of the i-th sample plot, DBHik represents the dominant diameter at breast height of the i-th sample plot in the k-th survey, DBHij represents the dominant diameter at breast height of the i-th sample plot in the j-th survey, b represents the parameter, and k represents the slope parameter.
After determining the basic models, these candidate variables were introduced gradually. These variables and these variables’ logarithmic form would be combined in the model to test whether it is suitable to do that and to test the accuracy improvement degree. The VIF (variance inflation factor) would be used to exclude variables with high collinearity; priority is given to variables with significant estimated coefficients and significant improvement in fitting accuracy, and a more concise model form is determined using likelihood ratio test for nested models. Finally, three variables (DBH, H, and CR) reflecting the individual tree sizes and the variable SPI reflecting the site quality were used as independent variables to develop the generalized model of tree height increment of Mongolian oak natural secondary forest.

2.2.3. Two-Level Nested Tree Height Increment Mixed-Effects Model

The generalized model of tree height increment of Mongolian oak secondary forest was determined, and then the random interference of sample plots and tree species on tree height increment was considered. The model expression is as follows:
H I i j k = e a 1 + a 2 + u 1 i + v 1 i j ln D B H i j k + a 3 + u 2 i H i j k 2 + a 4 + u 3 i + v 2 i j ln C R i j k + a 5 S P I i j + ε i j k u i = ( u 1 i , u 2 i , u 3 i ) ~ N ( 0 , Ψ 1 ) , v i j = ( v 1 i j , v 2 i j ) ~ N ( 0 , Ψ 2 ) , ε i j k ~ N ( 0 , σ 2 ) , i = 1 , , 14 , j = 1 , , 12 .  
where HIijk represents the average annual height increment of the k-th tree in the i-th tree species and j-th sample plot (m/year), Hijk represents the initial height of the k-th tree in the i-th tree species and j-th sample plot (m), DBHijk represents the initial diameter at breast height of the k-th tree in the i-th tree species and j-th sample plot (cm), CRijk represents the initial crown length ratio of the k-th tree in the i-th tree species and j-th sample plot, and SPIij represents the site form of the i-th tree species and j-th sample plot (m), εIjk refers to the random error of the k-th tree in the j-th sample plot of the i-th tree species, ui and vij refer to the random-effects vectors of the tree species level and the sample plot level, Ψ1 and Ψ2 refer to the corresponding random-effects variance–covariance matrixes, and σ2 refers to the random error variance. a1, a2, a3, a4, and a5 refer to the parameters to be estimated [16,17].
The two-level nested mixed-effects model for tree height increment of Mongolian oak secondary forest not only considered the fixed effects of DBH, H, CR and SPI, but also introduced the random effects of 12 sample plots and 14 tree species. All the data were used to confirm the best combination of random effects and fixed effects by the minimum Akchi information (AIC), Root-mean-square deviation (RMSE), total relative error (TRE) and the maximum coefficient of determination (R2), and the likelihood ratio test (LRT) was used to avoid over fitting of mixed-effects models.
The basic model of height increment of Mongolian oak secondary forest and the parameter estimation of mixed-effects model were all completed in R 4.2.1, and the mixed-effects model was calculated using the nlme package [18].

2.2.4. The Prediction of Tree Height Increment Mixed-Effects Model

Two-level nested mixed-effects models for predicting tree height increment of Mongolian oak natural secondary forest are usually divided into two categories: ignoring random effects and predicting random effects. The former prediction does not require prior investigation of the tree height increment information of some trees in the predicted sample plot, and the estimated result is usually referred to as the average response. However, the latter prediction requires investigating the height increment of these trees, in order to estimate the random effects of this type of sample plot, and then predict the total height increment of all trees on this type of sample plot. This process is also known as model correction. Sometimes the random effect cannot be predicted due to objective reasons, and the average response of the mixed-effects model or the generalized model should be considered to predict the height increment of the Mongolian oak secondary forest.
The empirical best linear unbiased prediction theory can be used to predict random effects [19,20]:
u ^ i = Ψ ^ Z i T ( R ^ i + Z i Ψ ^ Z i T ) 1 e i = Ψ ^ Z i T ( R ^ i + Z i Ψ ^ Z i T ) 1 H i f β ^ , u i , D B H i + Z i u i    
where u ^ i = ( u ^ i 1 , u ^ i 2 , , u ^ i k ) T is the estimated value of the random effect of i-th tree species nested in the management measures ( i = 1,2 , , M ); u ^ i j , j = 1,2 , , k is the estimated value of the random effect at the tree species level; u i = ( u i 1 , u i 2 , , u i k ) T is the empirical best linear unbiased prediction value of the corresponding random effect u i = ( u i 1 , u i 2 , , u i k ) T ; k represents the number of random-effects parameters; β ^ is the estimated value of the corresponding fixed-effects parameter β ; Ψ ^ is the estimated value of the variance–covariance matrix Ψ of the random effect u i at the level of management measures and tree species; R ^ i = d i a g ( R ^ i 1 , , R ^ i n i ) is the estimated value of the variance–covariance matrix R of the intra-group random error ε ; f ( ) is the function form of tree height increment mixed-effects model; and Z ^ i is the estimated value of the partial derivative of the function f ( β , u , D B H ) with respect to the random-effects parameter, and the specific estimation form is as follows:
Z ^ i = f ( β , u i , D B H i ) u i β ^ , u i          
The specific algorithm for calculating the estimated value of random effects adopts the three-step iterative algorithm proposed by Meng and Huang [20]: the first step is to assume a value of u i is 0 and to calculate the initial value of the random effect, namely
u ^ i ( 0 ) = Ψ ^ Z i T ( R ^ i + Z i Ψ ^ Z i T ) 1 [ H i f ( β ^ , 0 , D B H i ) ] ,
where
Z ^ i ( 0 ) = f ( β , u i , D B H i ) u i β ^ , u i = 0 .
Step two involves the following calculation:
u ^ i k = Ψ ^ ( Z i k ) T ( R ^ i + Z i k Ψ ^ ( Z i k ) T ) 1 × [ H i f ( β ^ , u ^ i ( k 1 ) , D B H i ) + Z i ( k ) u ^ i ( k 1 ) ]
where
Z ^ i ( k ) = f ( β , u i , D B H i ) u i β ^ , u i = u ^ i ( k 1 ) , k = 1,2 ,
In step three, repeat step two until the convergence accuracy meets, such as, u ^ i ( k ) u ^ i ( k 1 ) < 0.0000001 , and then the estimated random-effects value is:
u ^ i = u ^ i ( k )        
In fact, using the mixed-effects model to predict the height increment of each tree species in these new sample plots of Mongolian oak natural secondary forest requires the prediction of the random effect at the tree species level, so it is necessary to investigate the measured value of the height increment of several trees of each tree species in the sample plots. The more trees are extracted, the higher the accuracy of the mixed-effects model prediction, but the corresponding investigation cost will also increase.
How to balance the prediction accuracy and cost of mixed-effects models has been studied in many studies to determine the optimal sampling number [21,22]. In order to better find the potential influencing factors, four sampling methods of different tree species in the Mongolian oak natural secondary forest were considered:
(i)
Randomly select 1–10 trees of different tree species from each type of management trials;
(ii)
Randomly select 1–10 trees (medium) of the middle size (quantile of DBH between 0.4 and 0.6) of all different tree species in each type of management trials;
(iii)
Select 1–10 large trees with the largest DBH for different tree species in each type of management trials;
(iv)
Select 1–10 small trees with the smallest DBH for different tree species in each type of management trials.
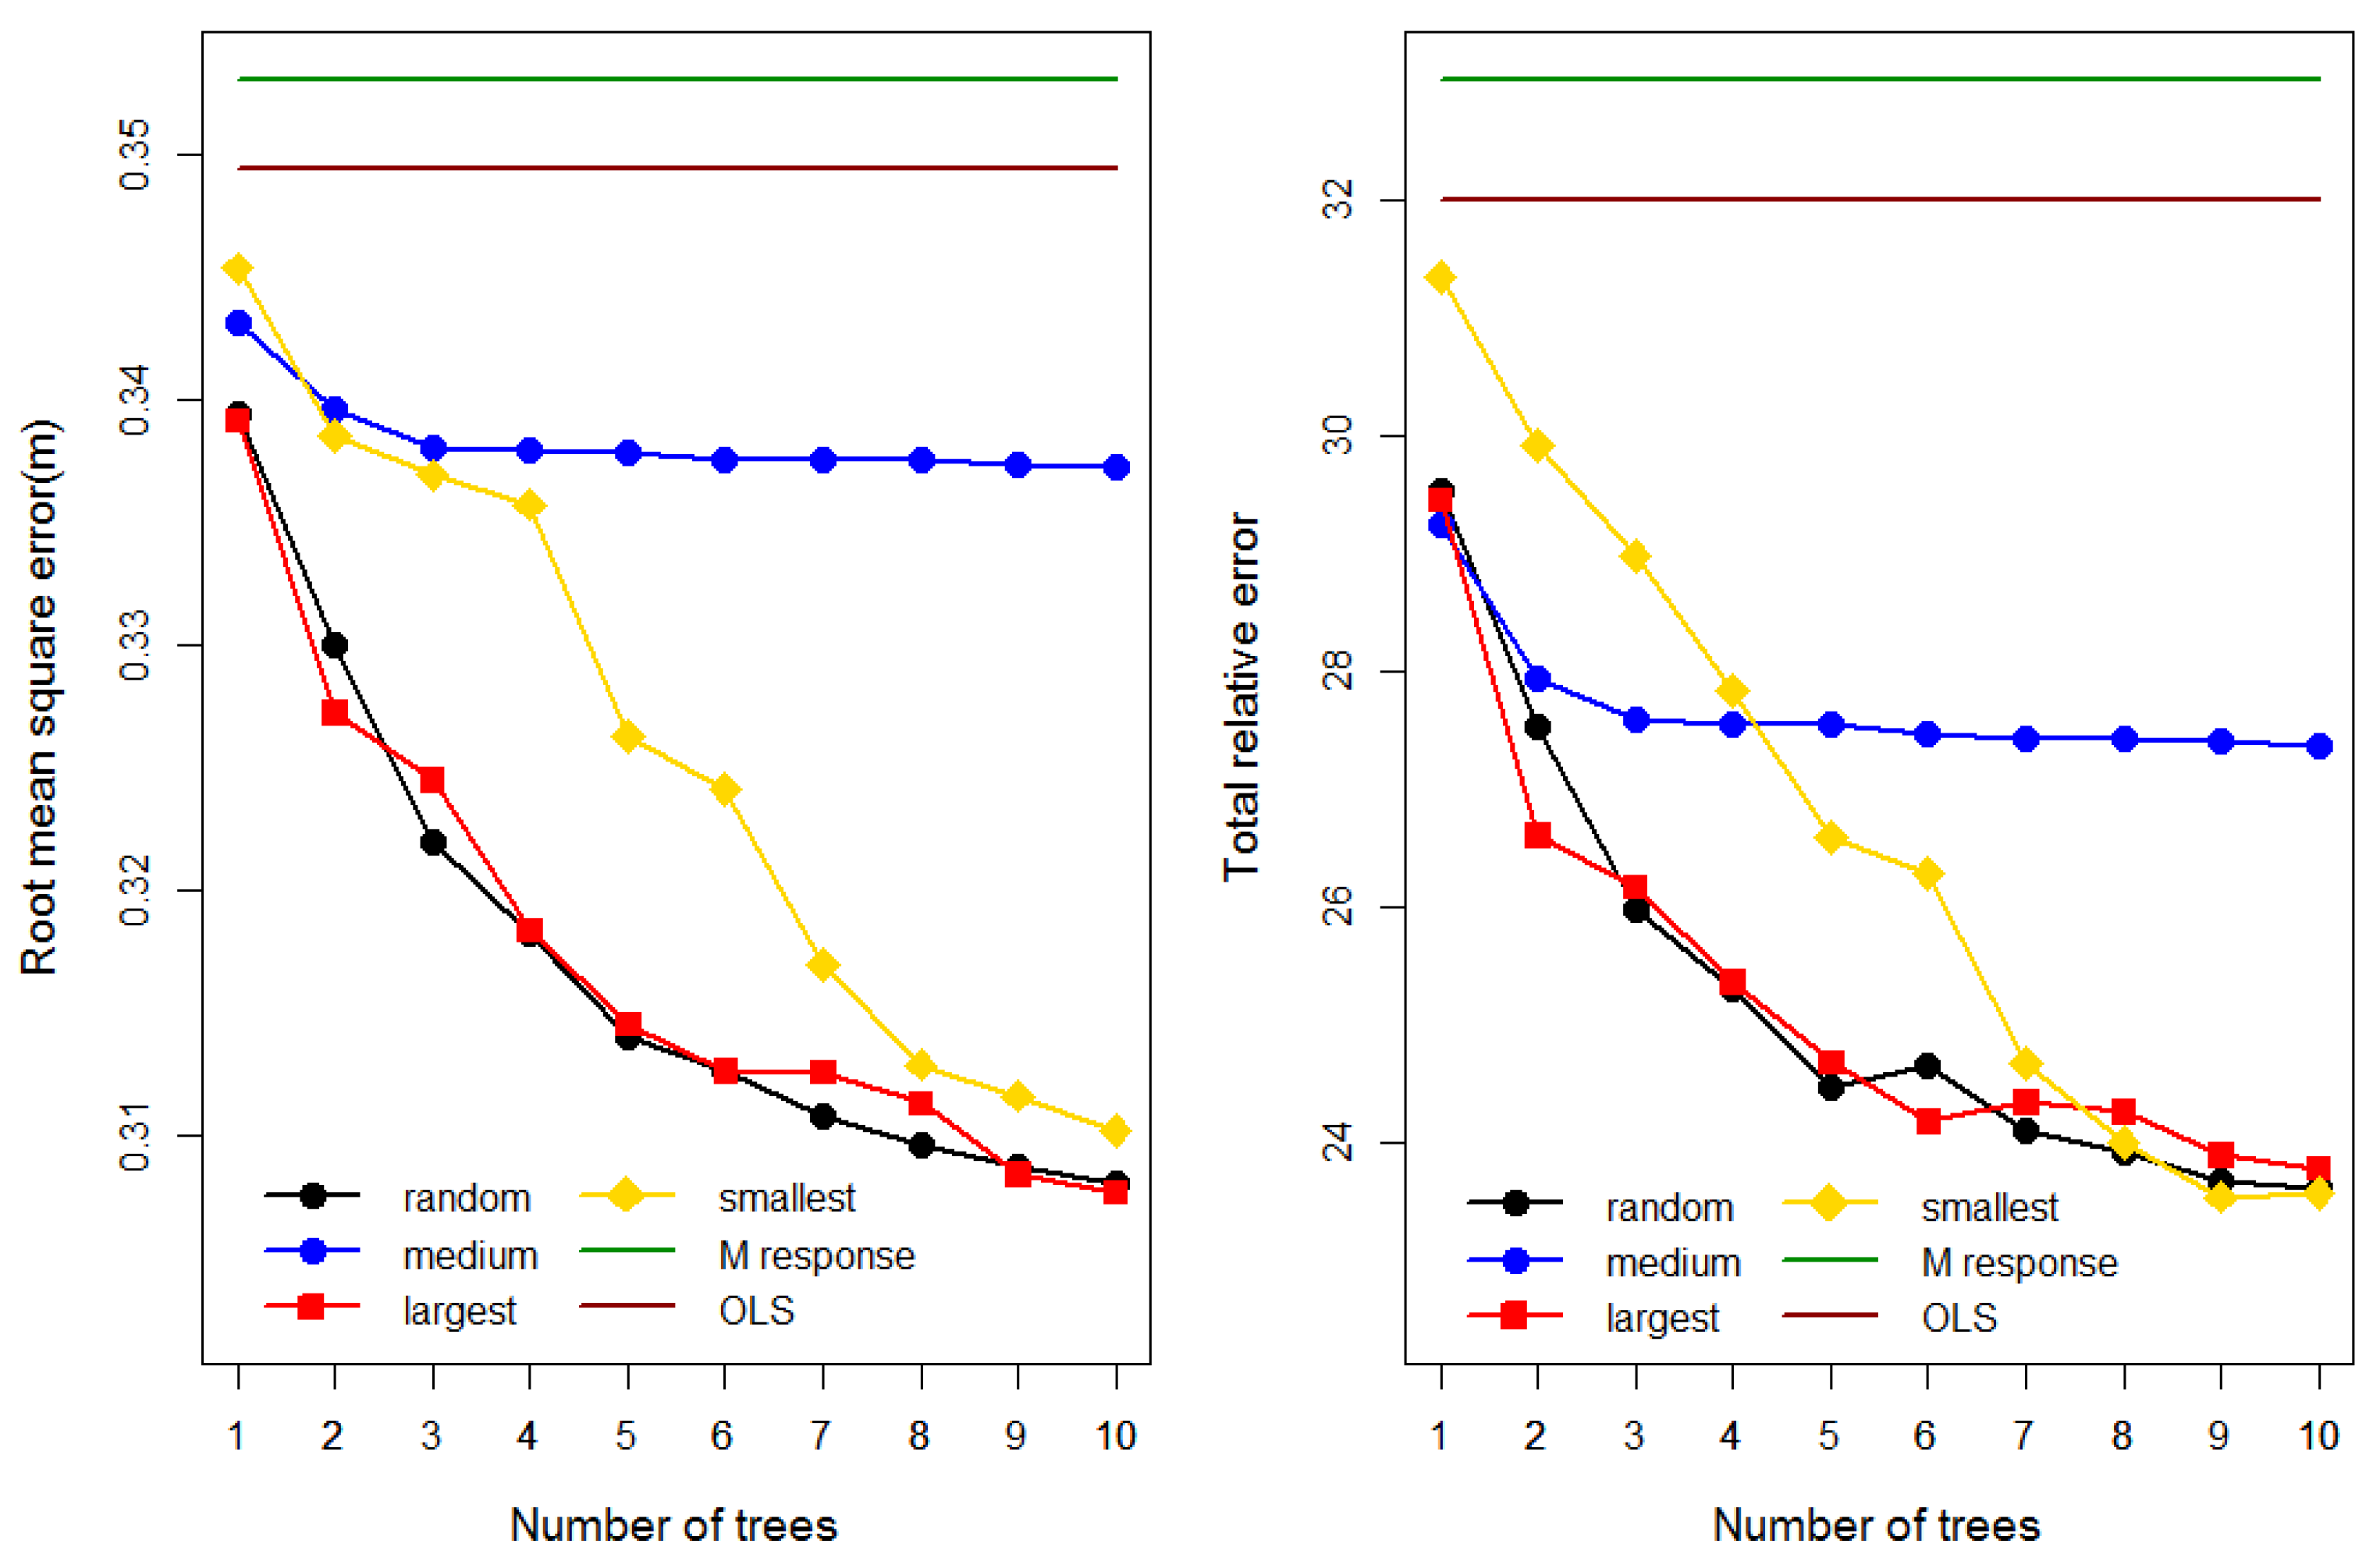
In order to ensure the stability of random-effects estimation, repeat sampling 30 times for random and medium sampling scenarios to calculate the height increment of each tree species predicted by the mixed-effects model for each sampling, and finally take the average of these tree height increment amounts as the predicted value. Based on these predicted and observed values, Root-mean-square error (RMSE) and total relative error (TRE) were calculated to evaluate the schemes used to predict random effects for 1 to 10 trees of the four sampling methods.

2.2.5. Model Evaluation

Generally, the dataset would be divided into modeling set and validation set. The modeling set is used to develop the model and estimate parameters, while the validation set is used to evaluate the extrapolation ability of the model. Due to the complexity and difficulty of tree height measurement, in order to utilize all the dataset better, this study did not use the method of partitioning validation set to evaluate the model; alternatively, the method of cross validation was to evaluate the prediction accuracy of the two-level mixed-effects model. The data structure of this study is based on 12 sample plots. The cross-validation method would take one of the sample plots as the validation dataset each time, and the remaining 11 sample plots as the modeling dataset for model development. The developed model would be used to predict the one sample plot which represents the validation dataset, and the predicted values of these 12 sample plots would be obtained through 12 cycles. These evaluation indexes including mean error (ME), Root-mean-square deviation (RMSE), total relative error (TRE), and the maximum coefficient of determination (R2) of are calculated based on the observed and predicted values of tree height increment. The stronger the predictive ability of the model, the smaller the values of RMSE and TRE and the larger the R2.
The evaluation indicators calculation formula including R2, RMSE, TRE, and AIC of candidate models are shown as follows:
R 2 = 1 ( H I i H ^ I i ) 2 ( H I i H ¯ I ) 2
R M S E = ( H I i H ^ I i ) 2 n
T R E = ( H I i H ^ I i ) H ^ I i × 100
A I C = 2 ln l + 2 p
where n is the total number of trees, HIi is the measured value of the i-th tree height increment, H I ^ i is the estimated value of the i-th tree height increment, H I ¯ i is the average value of height increment, p is the number of parameters in the model, and l is the maximum likelihood function estimation value of the model.

3. Results

3.1. Candidate Models Selection

The fitting indicators of the basic models (1)–(8) are shown in Table 2. The fitting indicators of models (2), (4), and (6) have significantly improved compared to the corresponding models (1), (3), and (5), indicating that the impact of the initial DBH on tree height increment is higher than that of the initial tree height. The fitting results of models (3) and (4) are better than those of models (1) and (2), suggesting that the exponential form is more suitable for describing the height increment of individual trees in the natural secondary forest of Mongolian oak. The fitting indexes of model (5) are better than that of model (3), indicating that the term of H2 has a more significant impact on tree height increment compared to H. However, there is only a little difference in the fitting indexes of models (6) and (4), indicating that the term of DBH2 has little effect on tree height increment compared to DBH. The fitting indicators of models (7) and (8) have significantly improved compared to models (1)–(6), revealing that depicting tree height increment should not only consider a single factor H or DBH, but also consider the combination form of H and DBH. The fitting indexes of model (8) are better than that of model (7), indicating once again that the term of H2 has a better effect.
In summary, the fitting accuracy of model (8) is the best, with R2 being the highest of 0.2455, RMSE being the lowest of 0.3579 m, and TRE being the lowest of 34.61%. The parameter estimation results are shown in Table 3, and the parameters are all significant (at level 0.001). Therefore, model (8) was determined as the basic model to describe the height increment of individual trees in the natural secondary forest of Mongolian oak.
To accurately predict the dynamics of the tree height increment, factors such as site productivity and competition are introduced into the model. It is generally believed that the higher the productivity of the site, the faster the increment of trees. Competition has a significant impact on the increment of DBH, and some studies have shown that moderate competition promotes the tree height increment, while excessive competition inhibits the tree height increment [5].

3.2. Generalized Model

This study introduced commonly used competition indices such as Hegyi and BAL to model (8), and found that their effects were not significant or their contribution were little. In order to avoid overfitting, CR and SPI are finally selected as supplementary variables for the height increment of individual trees in the Mongolian oak natural secondary forest. The model form is:
H I i j k = e a 1 + a 2 ln D B H i j k + a 3 H i j k 2 + a 4 ln C R i j k + a 5 S P I i j + ε i j k
where H I i j k represents the average annual height increment (m/year) of the k-th tree in the j-th sample plot of the i-th tree species, H i j k represents the initial tree height (m) of the k-th tree in the j-th sample plot of the i-th tree species, D B H i j k represents the initial DBH (cm) of the k-th tree in the j-th sample plot of the i-th tree species, C R i j k represents the initial crown length ratio of the k-th tree in the j th sample plot of the i-th tree species, S P I i j represents the site form(m) of the j-th sample plot of the i-th tree species, and ε i j k represents the random error of the i-th tree species of k-th tree species in the j-th sample plot. a1, a2, a3, a4, and a5 represent the parameters to be estimated.
The parameters estimation and fitting indicators of model (23) are shown in Table 3, and the parameters are significant (at level 0.001). All evaluation indicators have significantly improved compared to model (8), with RMSE decreasing by 3.10%, R2 increasing by 18.5%, TRE decreasing by 8.19%, and AIC decreasing by 7.87%.
The generalized model (23) was used to plot the tree height increment–DBH curves under the influence of various independent variables (Figure 1). Figure 1 shows that each independent variable significantly explains the variability of the tree height increment. The increment of the tree height increases with the increase in DBH, while it decreases with the increase in tree height H, crown length ratio CR, and site productivity SPI. In terms of explaining the variability of the tree height increment, tree height H has the greatest impact, followed by crown length ratio CR, and site productivity SPI has the smallest impact.

3.3. Mixed-Effects Model

Model (23) has 5 parameters (a1, a2, a3, a4, and a5), and there are 665 different combinations of the random effects of tree species level and sample plot level introduced in these parameters. Each combination forms a mixed-effects model for tree height increment. In order to find the best combination of random effects of tree species and sample plots, the covariance matrix of random effects of tree species and sample plots is first set as the diagonal matrix in terms of the convergence of the mixed-effects model. Meanwhile, according to the evaluation indicators of the mixed-effects model (Table 4), the variance in tree species and sample plot random effects on different parameters was considered, and the larger the variance, the greater the impact of random effects on this parameter. It is determined that the random effects of tree species are added to parameters a2, a3, and a4, and the random effects of sample plots are added to a2 and a4. The evaluation indicators of the mixed-effects model for the tree height increment are the best. Consequently, the variance–covariance matrix structure of tree species and sample plot random effects are considered, and the likelihood ratio test is used to avoid overfitting. Finally, these evaluation indexes reach the best when random-effects variance–covariance matrix of tree species is a diagonal matrix and unstructured matrix for sample plots. Therefore, the two-level mixed-effects model of the height increment of Mongolian oak natural secondary forest is finally determined as:
H I i j k = e 1.60 + ( 0.935 + u 1 i + v 1 i j ) ln D B H i j k + ( 0.00457 + u 2 i ) H i j k 2 + ( 0.309 + u 3 i + v 2 i j ) ln C R i j k 0.0674 S P I i j + ε i j k
u i = u 1 i u 2 i u 3 i ~ N 0 0 0 , Ψ 1 = 6.08 1 0 11 0 0 0 8.76 × 10 7 0 0 0 7.01 × 10 6 ,
v i j = v 1 i j v 2 i j ~ N 0 0 , Ψ 2 = 0.00472 0.0192 0.0192 0.116
ε i j k N ( 0,0.0989 )
The meaning of the variables in the formula can be found in Section 2.2.3 and Formula (23).
The estimated fixed-effects parameters and fitting indexes of model (24) are shown in Table 3, and all the parameters are significant (at level 0.001). All evaluation indexes have significant improvement compared to model (23), with RMSE decreasing by 11.9%, R2 increasing by 51.8%, TRE decreasing by 27.4%, and AIC decreasing by 7.32%. These indexes indicate that the introduction of the random effects of tree species and sample plots has greatly improved the fitting accuracy of the model. Model (24) can be used to describe the height increment of Mongolian oak natural secondary forest.

3.4. Model Prediction

The prediction results of the four sampling methods (random, medium, largest, and smallest) of the mixed-effects model (24) are shown in Figure 2. The two evaluation indicators RMSE and TRE both showed consistent trends in the predicted results of the four sampling methods; that is, the corresponding values of the evaluation indicators decreased as the number of sampled number increased. Regardless of the number of sampling number (1 to 10), the prediction accuracy of the mixed-effects model (24) is superior to the average response prediction accuracy (M response) of model (24) and the prediction accuracy (OLS) of model (23). Among them, two sampling methods, random sampling and largest sampling have the best performance. As the sampling number increased, the prediction accuracy showed a significant decreasing trend. When the number of sampling trees exceeded 5, the decreasing trend slowed down. When the sampling number exceeded 7, the prediction accuracy of smallest sampling method also performed well. However, when the sampling number exceeded 3, the prediction accuracy of medium sampling method tended to be flat. The reason is that sampling number is limited. The number of every species in one plot is around 10, in which approximately 3 trees are of medium size. When the sampling number of trees is 1 or 2, both RMSE and TRE show that the sampling method largest is slightly better than random. It is evident from Figure 2 that the RMSE and TRE of models (24) have the greatest decrease when largest sampling method is used, and the RMSE and TRE decreased by 7.37% and 19.4% compared to the average response prediction accuracy of model (24), respectively. Although RMSE and TRE will continue to decrease as the sampling number increases, the cost of time and investigation will also increase. Therefore, selecting the appropriate sampling number is crucial for forest management, as it can meet the prediction accuracy and balance the survey cost simultaneously. According to the performance of prediction accuracy, to sample two largest DBH trees is recommended when the random effects of tree species and sample plots need to be estimated. The prediction accuracy of model (24) is guaranteed and the survey cost is balanced.

3.5. Model Evaluation

Based on the cross-validation method, the prediction evaluation indexes of the three prediction methods (average response, tree species-level random-effects prediction, and sample plot-level random-effects prediction) of model (23) and model (24) is shown in Table 5. The results of model (24) based on different levels of random-effects prediction are better than their average response prediction and model (23) prediction, with smaller RMSE and TRE, and larger R2. In particular, model (24) has the highest prediction accuracy based on the sample plot level. Compared with the average response of model (23), as well as the average response and tree species-level prediction of model (24), its RMSE decreased by 12.6%, 13.6%, and 7.29%, respectively, and R2 increased by 61.6%, 70.8%, and 25.3%, respectively. The significant random effects of tree species and sample plots can improve the prediction accuracy of the model (24) greatly. Therefore, the mixed-effects model (24) is recommended to predict the height increment of individual trees in the Mongolian oak natural secondary forest.
The mixed-effects model (24) was utilized to draw the tree height increment curve of Mongolian oak natural secondary forest at nested sample plot level under the tree species level, which was shown in Figure 3 in combination with the measured value of the tree height increment. From these figures, it can be seen that the curve of the tree height increment runs well through the measured value of the tree height increment in the Mongolian oak natural secondary forest, and once again verifies the effectiveness of the two-level mixed-effects model (24) for the Mongolian oak natural secondary forest.

4. Discussion

In this study, a generalized nonlinear two-level mixed-effects model was developed to describe the height increment of Mongolian oak natural secondary forest in northeast China. The composition of the Mongolian oak natural secondary forest is complex. It is necessary to use random effects to find the differences between trees in the forest. Moreover, there are differences among the 12 sample plots due to the interference of the forest itself, surrounding competition, and external environment, and random effects can explain these differences. The mixed-effects model at the tree species and sample plot levels certificate the existing differences above. The cross validation of the tree height increment model of the Mongolian oak natural secondary forest indicates the random effects at the tree species and sample plot levels, respectively, thus improving the prediction accuracy (Table 5).
There are many factors that affect the height increment of individual trees in forest stand, especially in natural mixed forests. This study shows the variables that have a significant effect on the height increment of an individual tree in the Mongolian oak natural secondary forest are DBH, which reflects the size of the tree itself, and H, CR, and SPI, which reflects the site quality. There is a positive power function relationship between the tree height increment and DBH, indicating that DBH can promote the tree height increment. In fact, DBH represents the competitive status of the individual tree in the stand and is a symbol of the increment vitality [4,23,24]. On the contrary, in model (23), there is a negative correlation between the tree height increment and the square term of the initial tree height H. This relationship reflects that the introduction of the square term of the initial tree height H limits a maximum increment of tree height, and then the tree height increment slows down until ceased, which is consistent with the conclusions of many studies in the literature [4,5,25]. There is a negative correlation between the tree height increment and both CR and SPI; that is, the larger the CR and SPI, the smaller the tree height increment.
Related studies have shown that competition can affect the tree height increment. In some crowded stand environments, some trees allocate more stem increment to tree height rather than diameter, thereby making the tree height as high as possible compared to adjacent trees to obtain more sunlight [26]. Similarly, in forest stands with high stand density, the swaying of trees in these forest stands with the wind is relatively small, which slows down the diameter increment of the trees and increases the ratio of tree height to diameter [27]. Violent competition will to some extent inhibit the increment of the tree height [28]. In this study, however, competition indices distance-dependent Hegyi and aCI, as well as competition indices distance-independent BAL, BASUM, and SC were used to fit model, and the results indicated these variables were all not significant. It is due to the non-spatial structure of the sample plot showing that it is in the early succession stage with more sunward tree species, such as Mongolian oak, Populus cathayana, and Betula platyphylla, and the stage is relatively stable, so the competition factors have little impact on the tree height increment. In fact, the competition factors have a significant impact on the single-tree diameter increment model of Mongolian oak secondary forest. Relevant studies have shown that site quality has a significant impact on the tree height increment, while competition factors have a significant impact on the diameter. This study also certificated these findings [29]. In addition, the impact of competition factors may have already affected the size of the tree itself (such as DBH and CR), which will lead to a decreasing contribution of competition factors in the tree height increment model.
An obvious advantage of the mixed-effects model is that the improvement of model prediction accuracy could be achieved by sampling a small number of trees from the sample plot [20,22]. Some factors that affect the tree height increment in the forest may not have been observed, but randomly sampling a small number of sample trees from the forest stand can capture the effects, and thus, the model’s predictive ability would be improved. The prediction results of four sampling methods in the two-level mixed-effects model under tree species and sample plot level in this study indicate that randomly sampling trees from the trees with the largest DBH or all trees has the best prediction ability, followed by sampling trees with the smallest DBH, and the worst prediction ability came when sampling from the trees with medium DBH (Figure 2). In fact, after selecting eight sample trees, the prediction accuracy of sampling based on the minimum DBH is similar to that of sampling based on the maximum DBH or random sampling. According to the sampling of medium DBH, the prediction accuracy did not change significantly after selecting three sample trees. The TRE indicator shows when sampling trees number lower than four trees, the prediction accuracy of sampling based on the minimum DBH is lower than that of sampling based on the medium DBH.
All the phenomenon indicated that extracting the sample trees with the largest DBH can effectively reflect the random effects at the sample plot level. This may be because the sample trees with the largest DBH are usually considered as the dominant trees in the sample plot, and the tree height would be considered as the dominant height in the sample plot, which represents the site quality of the sample plot [17,20]. In order to improve the prediction accuracy of the mixed-effects model, it is necessary to appropriately select sample trees for investigation, and with the number of sample trees increasing, the investigation cost will sharply increase [20]. It is crucial to balance the prediction accuracy and sampling numbers. This study simulated 1–10 sampling number of trees for four sampling methods (random, medium, large, and small). The results showed that the more sample trees selected, the higher prediction accuracy of the mixed-effects model will be (Figure 2), which is consistent with the conclusions of many studies in the literature [20,30,31,32]. Therefore, in order to balance the investigation cost and prediction accuracy, it is recommended to select the two trees with the largest DBH from each sample plot to estimate the sample plot-level random effects. In fact, model (23) will be recommended for the prediction of the height increment of Mongolian oak secondary forest when some difficulties exist in obtaining sample tree information to predict the random effect due to objective reasons.

5. Conclusions

The generalized nonlinear two-level mixed-effects model constructed in this study can describe the height increment of an individual tree in the Mongolian oak natural secondary forest. When two trees are randomly selected from the trees with the largest DBH or all trees, its prediction ability is the strongest. The variables significantly related to the height increment of an individual tree in the Mongolian oak natural secondary forest were DBH, H, and CR reflecting the size of the tree itself, and the site productivity index SPI reflecting the site quality. The distance-dependent and distance-independent competition index had no significant impact on the height increment of trees.

Author Contributions

Conceptualization, X.H. and H.Z.; methodology, X.H. and X.Z.; software, X.H., Y.J. and X.Z.; validation, X.Z., H.Z. and Y.J.; formal analysis, X.H.; investigation, X.H., X.Z. and H.Z.; resources, H.Z.; data curation, H.Z.; writing—original draft preparation, X.H.; writing—review and editing, Y.J. and X.H.; funding acquisition, Y.J. and H.Z. All authors have read and agreed to the published version of the manuscript.

Funding

This research was funded by Research on Key Techniques for Quercus Planting (YZZD202306) and Study on Natural Regeneration Characteristics and Influencing Factors of oak forests in Beijing (YZQN202302).

Data Availability Statement

Data sharing is not applicable to this article.

Acknowledgments

We thank all related staff contributing to sample plot survey for this study. We thank Duan Guangshuang, Zhou Zeyu and three anonymous reviewers for their constructive comments and insightful suggestions to improve our article.

Conflicts of Interest

The authors declare no conflict of interest.

References

  1. Li, X.M.; Jiang, M.; Ren, J.; Liu, Z.; Zhang, W.; Li, G.; Wang, J.; Yang, M. Transcriptomic Determination of the Core Genes Regulating the Growth and Physiological Traits of Quercus mongolica Fisch. ex Ledeb. Forests 2023, 14, 1313. [Google Scholar] [CrossRef]
  2. Hu, Y.C.; Zhang, X.L.; Han, X.Y.; Wan, X.L.; Liang, T.M.; Lu, X.J. Responses of stand growth, regeneration, and understory species diversity in Quercus mongolica secondary forest to stand density. Chin. J. Appl. Ecol. 2022, 33, 727–732. [Google Scholar]
  3. Manso, R.; Davidson, R.; McLean, J.P. Diameter, height and volume increment single tree models for improved Sitka spruce in Great Britain. Forestry 2022, 95, 391–404. [Google Scholar] [CrossRef]
  4. Uzoh, F.C.C.; Oliver, W.W. Individual tree height increment model for managed even-aged stands of ponderosa pine throughout the western United States using linear mixed effects models. For. Ecol. Manag. 2006, 221, 147–154. [Google Scholar] [CrossRef]
  5. Sharma, R.P.; Brunner, A. Modeling individual tree height growth of Norway spruce and Scots pine from national forest inventory data in Norway. Scand. J. For. Res. 2017, 32, 501–514. [Google Scholar] [CrossRef]
  6. Huang, S.; Titus, S.J. An individual tree height increment model for mixed white spruce–aspen stands in Alberta, Canada. For. Ecol. Manag. 1999, 123, 41–53. [Google Scholar] [CrossRef]
  7. Nunifu, T.K. Compatible diameter and height increment models for lodgepole pine, trembling aspen, and white spruce. Can. J. For. Res. 2009, 39, 180–192. [Google Scholar] [CrossRef]
  8. Vanclay, J.K. Modelling Forest Growth and Yield: Applications to Mixed Tropical Forests; CAB International: Wallingford, UK, 1994. [Google Scholar]
  9. Golser, M.; Hasenauer, H. Predicting juvenile tree height growth in uneven-aged mixed species stands in Austria. For. Ecol. Manag. 1997, 97, 133–146. [Google Scholar] [CrossRef]
  10. Huang, S.; Titus, S.J. An index of site productivity for uneven-aged or mixed-species stands. Can. J. For. Res. 1993, 23, 558–562. [Google Scholar] [CrossRef]
  11. Box, G.E.; Lucas, H. Design of experiments in non-linear situations. Biometrika 1959, 46, 77–90. [Google Scholar] [CrossRef]
  12. Seber, G.; Wild, C. Nonlinear Regression; Wiley: New York, NY, USA, 1989; 768p. [Google Scholar]
  13. Giddings, D.R.; Ratkowsky, D.A. Handbook of Nonlinear Regression Models. J. R. Stat. Soc. 1991, 40, 186–187. [Google Scholar] [CrossRef]
  14. Wykoff, W.R. A basal area increment model for individual conifers in the northern Rocky Mountains. For. Sci. 1990, 36, 1077–1104. [Google Scholar]
  15. Huang, S.; Titus, S.J. An individual tree diameter increment model for white spruce in Alberta. Can. J. For. Res. 1995, 25, 1455–1465. [Google Scholar] [CrossRef]
  16. Duan, G.; Lei, X.; Zhang, X.; Liu, X. Site Index Modeling of Larch Using a Mixed-Effects Model across Regional Site Types in Northern China. Forests 2022, 13, 815. [Google Scholar] [CrossRef]
  17. Fu, L.; Sun, H.; Sharma, R.P.; Lei, Y.; Zhang, H.; Tang, S. Nonlinear mixed-effects crown width models for individual trees of Chinese fir (Cunninghamia lanceolata) in south-central China. For. Ecol. Manag. 2013, 302, 210–220. [Google Scholar] [CrossRef]
  18. Pinheiro, J.; Bates, D.; DebRoy, S.; Sarkar, D.; R Core Team. Nlme: Linear and Nonlinear Mixed Effects Models, R Package Version 3.1-163; R Core Team: Vienna, Austria, 2023.
  19. Lindstrom, M.J.; Bates, D.M. Nonlinear Mixed Effects Models for Repeated Measures Data. Biometrics 1990, 46, 673–687. [Google Scholar] [CrossRef]
  20. Meng, S.X.; Huang, S. Improved Calibration of Nonlinear Mixed-Effects Models Demonstrated on a Height Growth Function. For. Sci. 2009, 55, 238–248. [Google Scholar]
  21. Chen, Q.; Duan, G.; Liu, Q.; Ye, Q.; Sharma, R.P.; Chen, Y.; Liu, H.; Fu, L. Estimating crown width in degraded forest: A two-level nonlinear mixed-effects crown width model for Dacrydium pierrei and Podocarpus imbricatus in tropical China. For. Ecol. Manag. 2021, 497, 119486. [Google Scholar] [CrossRef]
  22. Fu, L.; Zhang, H.; Sharma, R.P.; Pang, L.; Wang, G. A generalized nonlinear mixed-effects height to crown base model for Mongolian oak in northeast China. For. Ecol. Manag. 2017, 384, 34–43. [Google Scholar] [CrossRef]
  23. Fahlvik, N.; Nyström, K. Models for predicting individual tree height increment and tree diameter in young stands in southern Sweden. Scand. J. For. Res. 2006, 21, 16–28. [Google Scholar] [CrossRef]
  24. Hu, X.F.; Duan, G.S.; Zhang, H.R. Modelling Individual Tree Diameter Growth of Quercus mongolica Secondary Forest in the Northeast of China. Sustainability 2021, 13, 4533. [Google Scholar] [CrossRef]
  25. Qiu, H.; Liu, S.; Zhang, Y.; Li, J. Variation in height-diameter allometry of ponderosa pine along competition, climate, and species diversity gradients in the western United States. For. Ecol. Manag. 2021, 497, 119477. [Google Scholar] [CrossRef]
  26. Ritchie, M.W.; Hann, D.W. Development of a tree height growth model for Douglas-fir. For. Ecol. Manag. 1986, 15, 135–145. [Google Scholar] [CrossRef]
  27. Meng, S.X.; Lieffers, V.J.; Reid, D.E.B.; Rudnicki, M.; Silins, U.; Jin, M. Reducing stem bending increases height growth of tall pines. J. Exp. Bot. 2006, 57, 3175–3182. [Google Scholar] [CrossRef]
  28. Hann, D.W.; Ritchie, M.W. Height growth rate of Douglas-fir: A comparison of model forms. For. Sci. 1988, 34, 165–175. [Google Scholar]
  29. Ma, W.; Lei, X.; Xu, G.; Yang, Y.; Wang, Q. Growth models for natural Quercus mongolica forests-I Diameter growth model. J. Northwest AF Univ. (Nat. Sci. Ed.) 2015, 43, 99–105. [Google Scholar]
  30. Fu, L.; Duan, G.; Ye, Q.; Meng, X.; Luo, P.; Sharma, R.P.; Sun, H.; Wang, G.; Liu, Q. Prediction of Individual Tree Diameter Using a Nonlinear Mixed-Effects Modeling Approach and Airborne LiDAR Data. Remote Sens. 2020, 12, 1066. [Google Scholar] [CrossRef]
  31. Temesgen, H.; Monleon, V.J.; Hann, D.W. Analysis and comparison of nonlinear tree height prediction strategies for Douglas-fir forests. Can. J. For. Res. 2008, 38, 553–565. [Google Scholar] [CrossRef]
  32. Dorado, F.C.; Diéguez-Aranda, U.; Anta, M.B.; Rodríguez, M.S.; von Gadow, K. A generalized height-diameter model including random components for radiate pine plantations in northwestern Spain. For. Ecol. Manag. 2006, 229, 202–213. [Google Scholar] [CrossRef]
Figure 1. Effects of tree height H, crown length ratio CR, and site productivity SPI on the height increment for nature secondary oak forest. Note: The curves were produced using parameter estimates of model (23) in Table 3. The values of the independent variables rely on the data range and to be produced with the same distance. And other independent variables take the average of all data.
Forests 14 02162 g001
Figure 2. Variation relationship of RMSE with sampling number of model (24) and TRE with sampling number for model (23) under four sampling methods, M response, and OLS response while estimating the random effects (random: the randomly selected trees; largest: the largest trees; medium: the medium-size trees; smallest: the smallest trees).
Forests 14 02162 g002
Figure 3. Scatter plots of tree height increment VS DBH at different values of independent variables and tree height increment curves using the mixed-effects model (24) at the random-effects level of sample plot nested in the tree species. (a) The average values of all independent variables are taken in different tree species and plots; (b) the variable tree height (H) takes 5 values at intervals of 5 m from the minimum to the maximum values of H, and other variables are the same as (a); (c) the variable crown length ratio (CR) takes 5 values at an interval of 0.1 from the minimum to the maximum values of CR, and other variables are the same as (a); (d) the variable site productivity index (SPI) takes 5 values at intervals of 1 m from the minimum to the maximum values of SPI, and other variables are the same as (a).
Forests 14 02162 g003
Table 1. General description of sample plot.
Plot CodeSpecies CompositionCanopy DensityStand Density/Tree·ha−1Diameter at Breast Height (DBH)/cmHeight (H)/m
Min.Max.AverageMin.Max.Average
016 meng 1 yang 1 bai 1 hong 1 se0.668255.066.014.6229.611.0
024 meng 2 yang 1 duan 1 bai 1 se 1 hong0.719575.059.113.70.524.111.1
034 meng 2 bai 1 se 1 duan 1 yang 1 hong0.7211155.055.712.91.328.510.2
044 meng 2 bai 1 duan 1 hong 1 se 1 yang0.8310585.050.213.61.525.810.9
055 meng 1 hong 1 duan 1 se 1 bai 1 yang0.7410895.053.815.11.421.810.0
064 meng 3 bai 2 za 1 luo0.466175.050.715.01.827.113.3
075 meng 2 za 1 bai 1 hong 1 hei0.8510715.050.913.11.521.88.9
085 meng 2 bai 1 hong 1 za 1 hei0.8811625.058.512.83.231.110.9
096 meng 2 za 1 yang 1 shui0.908575.052.214.31.418.99.8
106 meng 2 bai 1 za 1 hei0.7710115.070.114.33.129.411.7
114 meng 2 bai 1 za 1 se 1 hong 1 duan0.8710545.058.214.12.226.510.9
125 meng 2 luo 1 za 1 bai 1 shui0.677545.065.315.91.423.411.0
Note: meng stands for Quercus mongolica, yang stands for Populus ussuriensis, bai stands for Betula platyphylla, hong stands for Pinus koraiensis, se stands for Acer pictum, duan stands for Tilia amurensis, luo stands for Larix olgensis, hei stands for Betula dahurica, shui stands for Fraxinus mandschurica, and za stands for other tree species.
Table 2. Fitting results of 8 basic models to simulate the individual tree height increment for Mongolian oak secondary forest.
ModelEstimation Index
Root-Mean-Square Deviation (RMSE)/mCoefficient of Determination (R2)Total Relative Error (TRE)AIC
(1)0.40820.018650.5184849.9294
(2)0.39260.092044.5845787.1273
(3)0.40700.024249.8240847.3558
(4)0.39170.096044.5252785.5969
(5)0.40550.031449.2768841.3889
(6)0.39180.095644.5508785.9174
(7)0.35960.238235.0670647.3379
(8)0.35790.245534.6094639.4663
Table 3. Parameters estimation and evaluation indexes of models (8), (23), and (24).
TypeParametersModel (8)Model (23)Model (24)
Fixed-effects parametersa1−2.52−1.43−1.60
a20.9090.8540.935
a3−0.00373−0.00331−0.00457
a4 −0.268−0.309
a5 −0.0740−0.0674
Model evaluationRMSE/m0.3550.3440.303
R20.2540.3010.457
TRE34.231.422.8
AIC623574532
Note: a1, a2, a3, a4, and a5 represent the parameters to be estimated.
Table 4. Evaluation indexes of mixed-effects model of different combinations of random effects of species and plot.
Species-Level Random EffectsPlot-Level Random Effects Structure   of   Ψ RMSE/mR2TREAIC
a1a1UN0.316 0.412 25.2 543
a1, a2a1, a2Diag0.316 0.412 25.2 547
a1, a2, a3a1, a2, a3UN0.316 0.412 25.2 551
a1, a2, a3, a4a1, a2, a3, a4Diag0.310 0.433 24.0 542
a1, a2, a3, a4, a5a1, a2, a3, a4, a5UN0.311 0.429 24.2 551
a1, a4a1, a4Diag0.312 0.423 24.5 540
a2, a4a2, a4UN0.311 0.429 24.2 540
a2, a3, a4a2, a4Diag0.310 0.433 24.0 536
a2, a3, a4a4UN0.314 0.416 24.9 537
a2, a3, a4a2, a4Diag0.303 0.457 22.8 532
Note: Ψ   represents the variance–covariance matrix of the random effect, with UN as unstructured matrix, and Diag as diagonal matrix. a1, a2, a3, a4, and a5 represent the parameters to be estimated.
Table 5. The evaluation indexes for generalized model (23) and mixed-effects model (24) based on cross validation.
Model e ̄ T R E R M S E /m R 2
Model (23)−0.0035332.00.3490.279
Model (24)
Mean response0.0055233.00.3530.264
Species level−0.0066027.50.3290.360
Plot level−0.010023.20.3050.451
Disclaimer/Publisher’s Note: The statements, opinions and data contained in all publications are solely those of the individual author(s) and contributor(s) and not of MDPI and/or the editor(s). MDPI and/or the editor(s) disclaim responsibility for any injury to people or property resulting from any ideas, methods, instructions or products referred to in the content.

