Abstract
Currently, the ecological problems caused by the greenhouse effect are growing more serious, and implementing carbon sequestration methods is an effective way to address them. Arid and semi-arid desert areas have tremendous potential as carbon sinks, and artificial forests in these areas play an important role in absorbing and sequestering carbon dioxide. This study selected three main species of artificial protective trees along the Tarim Desert Highway—Haloxylon ammodendron (C.A.Mey.) Bunge, Calligonum mongolicum Turcz. and Tamarix chinensis Lour.—and evaluated them for their carbon sequestration, oxygen release capacity, and economic benefits using Pn (net photosynthetic rate) and biomass methods. The results showed that the average daily Pn value and carbon sequestration and oxygen release per unit leaf area of T. chinensis were significantly higher than those of H. ammodendron and C. mongolicum (p < 0.05). The total carbon storage of the three shelterbelts was 15.41 × 10⁴ t, and the carbon storage of H. ammodendron was significantly higher than that of C. mongolicum and T. chinensis (p < 0.05). According to the net photosynthetic rate method, the annual carbon sequestration and oxygen release of the shelter forest is 6.13 × 10⁴ t a−1, and the transaction price is CNY 13.73 million a−1. The total amount of carbon sequestration and oxygen release of the shelter forest obtained via the biomass method is 97.61 × 10⁴ t, and the transaction price is CNY 218.77 million. This study conducted research on the carbon sequestration capacity of protective forests along the Tarim Desert Highway located in an extremely arid region. It highlights the significant contribution of these protective forests in terms of carbon storage, playing a crucial role in promoting ecological restoration and sustainable development in arid areas. Additionally, this study provides a scientific basis for estimating carbon storage and promoting the sustainable management of artificial forests in arid desert regions.
1. Introduction
According to the assessment report by The Intergovernmental Panel on Climate Change (IPCC), excessive emissions of greenhouse gases have had a significant impact on human survival and societal development [1,2,3,4]. The mitigation of climate change has become an urgent global challenge, and the concentration of carbon dioxide (CO2) in the atmosphere has a significant impact on the climate [5]. As a major carbon emitter, China will strive to achieve a “carbon peak” by 2030 and strive to achieve “carbon neutrality” (referred to as the “double carbon target”) by 2060 [6]. Enhancing forestry carbon sink capacity is an important path to achieve the “dual carbon” goal, and the utilization of forestry carbon sinks has gradually risen to the national strategic level [7]. Plantation ecosystems have gradually become an important component of forestry carbon sequestration [8]. In the past three decades, natural forests have only sequestrated nearly the same amount of carbon as plantation forests despite the fact that the area of natural forests in China is four times that of plantation forests [9]. Fang et al. [10] showed that the increase in plantation area was the main reason for the increase in forest carbon sequestration in China. China has the largest planted forest area in the world, and planted forests will play an irreplaceable role in mitigating the impact of climate change [11]. In the arid regions of northwest China, the main approach to improving the ecological environment was through the establishment of artificial forests [12]. Artificial forests provide multiple benefits, including preventing desertification, improving land conditions, and enriching species diversity in arid areas, thus playing a crucial role in forest ecosystems [13]. With the increasing demand for mitigating climate change, the area of artificial forests is expected to further expand [14]. Therefore, strengthening research on carbon sequestration in artificial forests is of great significance for enhancing the carbon storage capacity of forests in arid regions.
As a carbon pool, forests play an important role in increasing sink area, mainly reflected in the function of carbon sequestration and oxygen release [15,16]. At present, the research methods used to examine forest vegetation carbon sequestration mainly include the biomass method and the Pn (net photosynthetic rate) method. The biomass method is used to estimate carbon sequestration by measuring the dry matter mass accumulated by the community per unit of time and per unit area, which are important indicators of ecosystem function and productivity [17]. The advantage of this method is that the technology is relatively mature, but the disadvantage is that it has a certain destructive effect on vegetation. The Pn method is used to obtain the instantaneous photosynthesis and respiration rate per unit leaf area of plants and then obtain the carbon sequestration per unit area. The advantage of this method is that it can conduct multi-factor quantitative research on photosynthesis and respiration rate, but the disadvantage is that it is more complicated to perform.
In recent decades, vegetation restoration projects have been widely adopted in many countries and regions with the aim of achieving economic, ecological, and climate change mitigation goals [18,19]. Moreover, the international academic community has paid extensive attention to the ecological benefits of desert vegetation construction [20,21]. In arid areas of China, artificial desert vegetation, especially scrub, plays a very important role in carbon sequestration [22]. In addition, the area of shrublands in the “Three northern regions” has increased significantly, and shrublands are characterized by H. ammodendron (C.A.Mey.) Bunge plays an important role in forestry carbon sinks [23]. However, concerning the potential carbon sequestration and role of sand-fixation vegetation plantation in arid areas, there is still a lack of detailed and measured data verification [24].
The Tarim Desert Highway is located in the Tarim Basin, which starts from Luntai in the north and reaches Minfeng in the south. The total length of the desert highway is 562 km, including 443 km through the desert, which is the longest continuous highway through a desert in the world. In June 2003, the state approved the construction of the Tarim Desert Highway Protection Forest Ecological Project. In 2005, the Tarim Desert Highway shelterbelt project was completed, with a total length of 436 km, an overall width of 72~78 m, and a total area of 3128 ha [25]. Since 2 June 2022, newly built photovoltaic power stations have been scattered across the ecological protection forest belt, achieving zero carbon emissions across the road, and the Tarim Desert Highway has become the first zero-carbon desert highway in China. At present, most studies on carbon sequestration using vegetation focus on highly productive ecosystems such as forests (mainly trees) [26,27], grasslands, wetlands and farmland, while relatively few studies have centered on carbon sequestration in desert shrublands [28,29]. In particular, there is less research on the capacity and value of carbon sequestration and oxygen release of artificial shelterbelts in desert areas. In addition, what is the existing carbon storage of artificial shelterbelts on desert roads? How significant is the carbon benefit of vegetation? These are pressing scientific questions. Therefore, based on previous research, this study selected H. ammodendron (C.A.Mey.) Bunge, C. mongolicum Turcz. and T. chinensis Lour. from the artificial protective forest alongside the Taklamakan Desert Highway as research subjects. By combining the Pn (net photosynthetic rate) method and biomass method, a comprehensive study was conducted on the Pn and biomass of these three shrubs in the protective forest. Subsequently, the carbon sequestration and oxygen release capacity, carbon storage, and economic value were estimated, providing insights into the methodology of studying artificial shrub carbon sinks in arid regions.
2. Materials and Methods
2.1. Overview of the Study Area
The Tarim Desert Highway is located between 37°–42° N and 82°–85° E, running north–south through the Taklimakan Desert. The landscape of the Taklimakan Desert is dominated by composite sand ridges with high mobility, and the terrain along the highway is high in the south and low in the north, with a relative elevation difference of less than 80 m. The main soil type along the highway is aeolian sand soil, with a coarse texture and little accumulation of organic matter. Precipitation along the desert highway is unevenly distributed throughout the year, with annual precipitation ranging from 11 mm to 50 mm, and potential evapotranspiration as high as 3638.6 mm [30]. The average annual temperature is 12.7 °C, the maximum extreme temperature is 45.6 °C, and the minimum extreme temperature is −22.2 °C. The cumulative annual sunshine duration is 2854.2 h, the annual average wind speed is 2.5 m s−1, the maximum instantaneous wind speed is 24 m s−1, the annual sand wind duration is 550~800 h, and floating dust and sand are very frequent [31]. The desert highway protective forest lacks surface runoff along its route, but it has a large amount of underground water storage, with water quality ranging from 2.6 to 30 g L−1 in terms of mineralization [32]. The tree species selected for the desert highway shelterbelt mainly included H. ammodendron (C.A.Mey.) Bunge, C. mongolicum Turcz. and T. chinensis Lour. These species have strong adaptability, wind erosion resistance, drought resistance, and sand burial tolerance. The entire Tarim Desert Highway protective forest was irrigated using drip irrigation. The irrigation cycle was set to 15 days with a water volume of 30 L m−2 per irrigation. During the winter season (November to February of the following year), irrigation was not conducted. Groundwater was utilized through on-site extraction.
2.2. Quadrat Setup
The experiment utilized the shelterbelt of the desert highway, which spans a total length of 436 km, as a natural sample belt. Ten sample plots were designated along the length of the road section, labeled S1–S10 from north to south, each measuring 2500 m2 (50 m × 50 m), with an interval of 45 km between the adjacent plots. Measurements were taken for the plant height, base diameter and crown of three plant species within the sample plots. Additionally, the quantity of vegetation was recorded. The area of unplanted vegetation within the sample plots was also measured. A 10 m × 10 m quadrat was established in each plot and three individuals of similar size and with healthy growth were randomly selected from the species H. ammodendron, C. mongolicum and T. chinensis in each quadrat as the photosynthetic sample plants, for a total of 90 plants.
2.3. Carbon Sequestration and Oxygen Release by Net Photosynthetic Rate Method
The test was conducted in June 2023. The Pn value of the photosynthetic sample plants in the 10 quadrats was measured using a portable photosynthetic measurement system LI-6400XT(LI-COR, Lincoln, NE, USA), and a standard leaf chamber of 2 cm × 3 cm was selected. The measurement time was 8:00–18:00 (Beijing time) daily at 2 h intervals. Each plant measurement was repeated three times, and five instantaneous values were recorded in each measurement. Finally, the average values of three different plants in each quadrat were calculated, respectively.
According to the diurnal variation curve of the Pn value of each plant, the net assimilation of the tested plants on the day of determination was calculated using the simple integration method [33]. The calculation formula is as follows:
where P is the total net assimilation per unit leaf area measured daily (mmol m−2 d−1). Pi is the instantaneous photosynthesis rate at the initial measurement point. Pi+1 is the instantaneous photosynthesis rate (μmol m−2 s−1) at the measuring point i + 1. ti is the instantaneous time of the initial measurement point. ti+1 is the time of t + 1 measuring point (h). j is the number of tests. In this study, 3600 signifies 3600 s/h and 1000 signifies that 1 mmol is equal to 1000 μmol.
Generally, the nocturnal dark respiration of plants is calculated based on 20% of the assimilation rate during the day. Therefore, the daily net carbon sequestration and oxygen release per unit leaf area are calculated according to Formulas (2) and (3):
where Wco2 is the daily net fixed CO2 mass per unit leaf area (g m−2 d−1). Here, 44 is the molar mass of CO2 (g mol−1).
where Wo2 is the daily net O2 mass released per unit leaf area (g m−2 d−1). Here, 32 is the molar mass of O2 (g mol−1).
The calculation of carbon sequestration and oxygen release by photosynthetic rate method adopts Formulas (4) and (5) [34]:
where Cco2 is annual carbon sequestration (t). Here, S is vegetation area (ha). Here, N is the total number of days in the growing season (from May to September, 150 days).
where Co2 is annual oxygen release (t). Here, S is vegetation area (ha). Here, N is the total number of days in the growing season (from May to September, 150 days).
2.4. Carbon Sequestration and Oxygen Release by Biomass Method
Among the 10 quadrats, we randomly selected 12 shrubs of H. ammodendron, C. mongolicum and T. chinensis (7 for biomass model construction and 5 for the verification of the biomass model), totaling 36 shrubs as samples. We recorded the plant height, diameter at breast height, and crown width of plants within the quadrats. For the aboveground portions of the plants, we used the total harvest method to collect them and subsequently separate them into different organs (roots, stems, branches, and leaves). For the underground portions of plants, we employed the complete excavation method for manual digging [35]. However, shrub roots were typically deep and intricately complex, making the complete excavation of the root system highly challenging. Therefore, in practical operations, we chose a threshold of 2 mm in root diameter as the criterion for excavation and determined the average area for collecting roots based on this standard. The decision to adopt this threshold was based on the fact that fine roots had small diameters and were difficult to access while also contributing little to the overall biomass and representing a very low proportion of the total root system [36]. Samples were brought back to the laboratory and dried at a temperature of 72 °C for 48 h [37]. Then, the dry weight of each part of the plant was calculated and added together to obtain the total biomass of the whole plant (Table S1).
Through the relationship between carbon storage and biomass (biomass multiplied by carbon content), the vegetation carbon storage of the artificial shrub community is estimated. The average carbon content of shrub forests recommended by the IPCC was 0.50 [38].
where Q is carbon storage (t). W is the whole-plant biomass (t). Here, 0.5 was the carbon content.
In this paper, the carbon storage density was calculated according to Formula (7):
where N is the carbon storage density (t ha−1). A is the green area (ha).
The calculation of carbon sequestration and oxygen release by biomass method adopts Formulas (8) and (9) [39]:
where GC is the amount of carbon sequestration (t). Here, 44 is the molar mass of CO2 (g mol−1). Here, 12 is the molar mass of C (g mol−1).
where GO is the released oxygen (t). Here, 32 is the molar mass of O2 (g mol−1). Here, 12 is the molar mass of C (g mol−1).
2.5. Establishment and Testing of Three Shrub Biomass Models
The measured growth factors (diameter at breast height D, plant height H, crown average diameter and their combination factors (crown area C = π × L1 × L2/4, L1 and L2 are, respectively, east–west and north–south crown diameters, plant volume V = CH = π × L1 × L2 × H/4, and plant cross-sectional area LH, L = (L1 + L2)/2)) were used as the independent variables when fitting the biomass model. Through screening the best-fitting variable, the model was selected for fitting according to previous studies on the whole-plant biomass of three shrubs [40,41] (Table 1). In the biomass model, the judgment coefficient (R2), standard error (SEE) and the significance level of the regression test were used to evaluate the advantages and disadvantages of the equation. Statistically, the equation with the largest judgment coefficient R2, the smallest SEE and the significant regression (p < 0.001) is considered the best, indicating that the fitting accuracy of the equation is the highest.

Table 1.
Function types and expressions.
To verify the accuracy of the optimal model, the average relative error (RMA) and total relative error (RS) of the predicted value and the measured value were used to test the accuracy. At the same time, partially predicted and measured values of three shrub species were selected for regression analysis. Among them:
where Xi represents the measured value. represents the predicted value. N represents the number of samples.
2.6. Estimation of Carbon Sequestration and Oxygen Release Value
For the valuation of carbon sequestration and oxygen release, we used the market price method—that is, the amount of carbon sequestration was multiplied by the price of carbon sequestration, and the amount of oxygen released was multiplied by the price of oxygen production—and then the cost of carbon sequestration and oxygen production in the study area was calculated. The carbon sequestration price was CNY 53.30 t−1, and the average transaction price of the carbon emission quota (CEA) in the national carbon market from July 2021 to August 2023 was issued by the Shanghai Environmental Energy Exchange (https://www.cneeex.com/, accessed on 15 September 2023). Oxygen price was determined according to the relevant information released by Zhuochuang Information (https://www.sci99.com/, accessed on 10 September 2023), and the average transaction price of oxygen in the first half of 2023 was CNY 459 t−1.
According to the relevant provisions of the latest national standard, “Standard for Evaluation of Forest Ecosystem Service Functions (GB/T38582-2020)” [42], the value of carbon sequestration and oxygen release functions was calculated using Formulas (12) and (13):
where UC is the annual carbon sequestration price of the stand (CNY a−1). GC is the annual carbon sequestration mass of the stand (t a−1). CC is the price of carbon dioxide (CNY t−1).
where UO is the annual oxygen release price of the stand (CNY a−1). GO is the annual oxygen release mass of the stand (t a−1). CO is the oxygen price (CNY t−1).
2.7. Data Processing
Data were collated and tabulated using Microsoft Office 2016 (Microsoft, Washington, DC, USA). The least significant difference (LSD) method of using the one-way ANOVA (95% confidence interval) was used for analysis and comparison, and p > 0.05 was considered as indicating no significant difference. Using the systematic clustering method and square Euclidean distance as basic options, the carbon sequestration and oxygen release capacity of plant per unit leaf area and daily average Pn value were measured using various squares for cluster analysis. Linear and nonlinear regression methods were used to simulate the equations of vegetation characteristic factors and total plant biomass, and T-tests were used to screen the equations. SPSS 24.0 (IBM, Armonk, NY, USA) was used for data processing, and Origin 2022 (OriginLab, Northampton, MA, USA) was used for drawing pictures and fitting regression models.
3. Results
3.1. Quadrat Vegetation Characteristics
Based on the survey of desert highway quadrats, The green area of vegetation accounted for 81.55% of the total forested area (2550.88 ha). The average coverage of the three species was 70%, and the vegetation area was 1785.62 ha. The proportion of three shrubs in the vegetation area was as follows: H. ammodendron was 72.32% (1291.36 ha), C. mongolicum was 18.38% (328.20 ha) and T. chinensis was 9.30% (166.06 ha). The sample plots vegetation frequency was: H. ammodendron (1008 trees), C. mongolicum (330 trees), and T. chinensis (118 trees). The vegetation relative frequency (Table S1) was: H. ammodendron (69.23%), C. mongolicum (22.69%), and T. chinensis (8.08%). The vegetation density was: H. ammodendron stood at 0.403 trees m−2 (12.6 million trees), C. mongolicum stood at 0.1319 trees m−2 (4.13 million trees), and T. chinensis stood at 0.047 trees m−2 (1.47 million trees).
3.2. Carbon Sequestration and Oxygen Release Capacity under Photosynthesis
3.2.1. Comparative Analysis of Carbon Sequestration and Oxygen Release in the Quadrat
The change trend of the daily net assimilation of the 10 quadrats showed an “M” pattern. Among them, the maximum values of the three types of data appear in quadrat 9, the minimum values of daily net assimilation and net carbon sequestration and oxygen release appear in quadrat 1, and the minimum values of daily average Pn value appear in quadrat 6. The difference between the maximum and minimum values is as follows: the daily net assimilation is 110.56 mmol m−2 d−1, the annual carbon sequestration is 0.59 kg m−2 a−1, the annual oxygen release is 0.43 kg m−2 a−1, and the daily average Pn value is 2.9 μmol m−2 s−1 (Table S3, Figure 1).
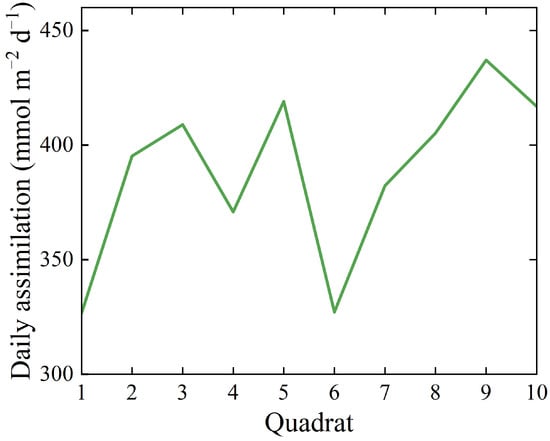
Figure 1.
Daily assimilation of photosynthesis in various quadrats.
According to the annual net carbon sequestration and oxygen release of the 10 quadrats, they can be divided into three categories (Table S3, Figure 2), and there are significant differences among the three categories quadrats (p < 0.05). According to the annual net carbon sequestration and oxygen release, the inter-class order is as follows: the first category (higher carbon sequestration and oxygen release per unit leaf area) is seen in quadrat 2, quadrat 3, quadrat 5, quadrat 8, quadrat 9 and quadrat 10. The second category (moderate carbon sequestration and oxygen release per unit leaf area) is seen in quadrat 4 and quadrat 7. The third category (low carbon sequestration and oxygen release per unit leaf area) is seen in quadrat 1 and quadrat 6.
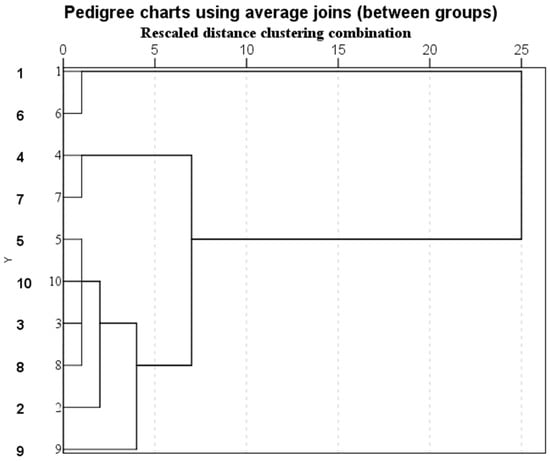
Figure 2.
Cluster analysis results of carbon sequestration and oxygen release capacity of 10 quadrats.
In addition, the carbon sequestration/oxygen release per unit leaf area and the daily average Pn value of vegetation also showed this trend; that is, the first category > the second category > the third category, and the differences among the three categories were obvious (p < 0.05) (Figure 3A,B).
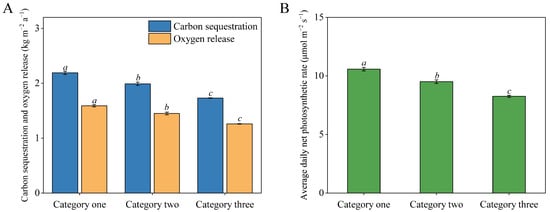
Figure 3.
Carbon sequestration and oxygen release capacity of three kinds of quadrats (A). Average daily net photosynthetic rate value of three kinds of quadrats (B). Different lowercase letters indicate significant differences (p < 0.05).
3.2.2. Comparative Analysis of Carbon Sequestration and Oxygen Release Capacity of Different Plants in Shelterbelt by Net Photosynthetic Rate Method
The Pn value of the three shelterbelt plants showed an obvious “single peak” curve, and the peaks appeared at around 12:00, among which the peak net photosynthetic rate (Pnmax) of T. chinensis was the highest (Figure 4A). At the same time, the daily average Pn value and carbon sequestration and oxygen release per unit leaf area of T. chinensis were significantly higher than those of H. ammodendron and C. mongolicum (p < 0.05), but the difference between H. ammodendron and C. mongolicum was not significant (p > 0.05) (Figure 4B,C).
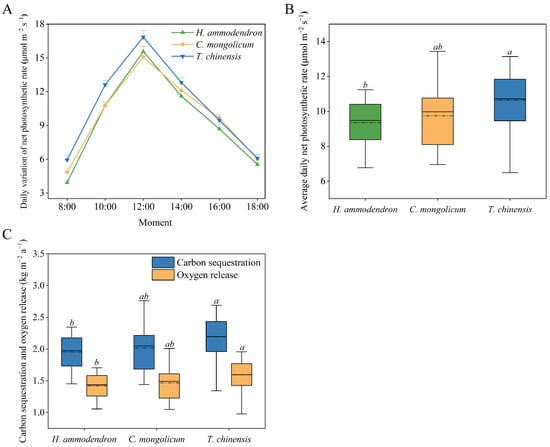
Figure 4.
Daily variation of net photosynthetic rate value of three plants (A). Average daily net photosynthetic rate value of three plants (B). Carbon sequestration and oxygen release capacity of three plants (C). Different lowercase letters indicate significant differences (p < 0.05).
3.2.3. Annual Carbon Sequestration and Oxygen Release via the Net Photosynthetic Rate Method
Although T. chinensis had the highest annual carbon sequestrations and oxygen releases per unit leaf surface, the annual carbon sequestrations and oxygen releases per unit plant of H. ammodendron were higher than those of C. mongolicum and T. chinensis (Table 2).
Table 2.
Annual carbon sequestration and oxygen release of three kinds of shelterbelts on the Tarim Desert Highway.
3.3. Carbon Sequestration and Oxygen Release Capacity under Biomass Method
3.3.1. Biomass Model Construction
According to the measured data concerning the shrubs (Table 3), the model was established, and the results showed that the optimal biomass models of the three shrubs all adopted the power function form (Table 4, Figure 5). In the biomass equations of H. ammodendron and T. chinensis, plant volume (V) is the best predictive variable. In the biomass equation of C. mongolicum, the longitudinal sectional area (LH) is the best predictive variable. The fitting degree of these biomass models is very high; the R2 value ranges from 0.9414 to 0.9641, and the SEE ranges from 0.578 to 0.908, which shows that the fitting effect of the models is good. By testing the optimal models, it is found that the p values of all biomass estimation models are less than 0.001, which meets the requirements of an extremely significant level test. This means that the predictive variables of each model have a good explanation for the dependent variables.
Table 3.
Shrub characteristics for building biomass regression models.
Table 4.
Three shrub biomass regression models.
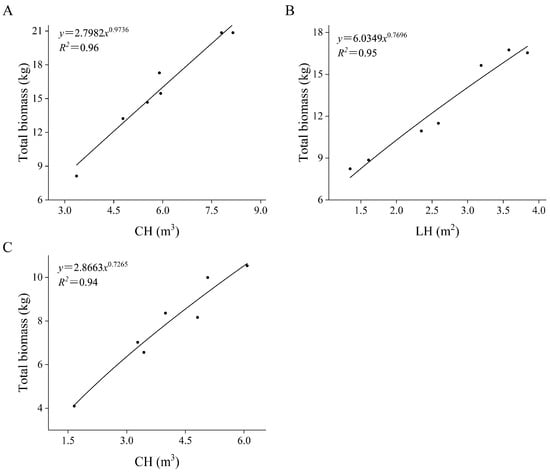
Figure 5.
Scatter diagram of H. ammodendron biomass regression model (A). Scatter diagram of C. mongolicum biomass regression model (B). Scatter diagram of T. chinensis biomass regression model (C).
3.3.2. Verification of Biomass Model
Regression analysis between the measured data and the predicted values of shrubs show that the total relative error (RS) of the fitting model is between −2.49% and 1.47%, and the average relative error (RMA) is between 5.40% and 7.20%, which shows that the fitting accuracy of the whole-plant biomass of the three shrubs is high (Table 5). At the same time, there is a good correlation between the predicted values and the measured values, and both values meet the requirements of a 95% confidence interval (Figure 6). The fitting rate is between 0.90 and 0.95, which shows that the model is effective. These results show that regression analysis can accurately predict the whole-plant biomass of three shrubs, and the model effect is ideal.
Table 5.
Accuracy test of three kinds of shrub biomass regression models.
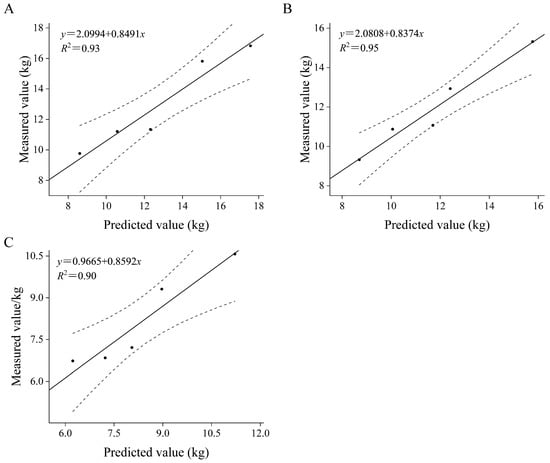
Figure 6.
Comparison of measured and predicted biomass of H. ammodendron (A), C. mongolicum (B), T. chinensis (C). The dashed lines in the figure represent the upper and lower 95% confidence intervals.
3.3.3. Total Carbon Sequestration and Oxygen Release Using the Biomass Method
The average biomass of the three shrubs on the desert highway ranged from 8.72 to 19.62 kg/plant (Table 6). The order of the three shelterbelt plants in terms of total number of plants, total biomass, carbon storage, total carbon sequestration and oxygen release is H. ammodendron > C. mongolicum > T. chinensis. The carbon storage densities of H. ammodendron, C. mongolicum and T. chinensis are 67.00 t ha−1, 51.40 t ha−1 and 26.98 t ha−1, respectively. In addition, the total carbon sequestration and oxygen release of H. ammodendron is 5.13 times that of C. mongolicum and 19.29 times that of T. chinensis (Table 7).
Table 6.
Characteristics of shrubs within the quadrat.
Table 7.
Total carbon sequestration and oxygen release of three shelterbelt plants on the Tarim Desert Highway.
3.4. Carbon Sequestration and Oxygen Release Benefits
The total annual value of carbon sequestration and oxygen release in the whole shelter forest is CNY 13.73 million, of which the total annual value of carbon sequestration is CNY 1.88 million, and the total annual value of oxygen release is CNY 11.85 million. At the same time, the total value of carbon sequestration and oxygen release of the whole shelter forest is CNY 218.77 million, of which the total value of carbon sequestration is CNY 30.12 million, and the total value of oxygen release is CNY 188.65 million. In addition, in terms of three kinds of shelter forest plants, the performance order of carbon sequestration and oxygen release value is H. ammodendron > C. mongolicum > T. chinensis (Table 8).
Table 8.
Estimation of carbon sequestration and oxygen release value of three kinds of shelterbelts on the Tarim Desert Highway.
4. Discussion
The results of the quadrat survey showed that the three dominant shrub species, with H. ammodendron (C.A.Mey.) Bunge as the main species, had an average coverage of 70%. The total number of individuals among the three shrub species exceeded 12.8 million trees, indicating that progress had been made in the greening work along the desert road. The continued presence of protective forests helped reduce soil erosion and sandstorms, thereby maintaining ecological stability in the area [43]. Additionally, in terms of vegetation frequency, density, and canopy width, H. ammodendron far surpassed C. mongolicum Turcz. and T. chinensis Lour. The vegetation density of H. ammodendron was three times that of C. mongolicum and eight times that of T. chinensis, reflecting its superior status as a dominant species in the protective forest. Plants increased their ability to acquire resources by optimizing the utilization of ecological space [44]. H. ammodendron had stronger salt and alkali resistance, deeper root depth, and lower transpiration water consumption compared to the other two plant species [45,46]. As a result, H. ammodendron demonstrated a higher capacity for survival under arid conditions. These findings provided important data for understanding the distribution of vegetation and the ecological environment along the desert road and contributed to the development of corresponding protective and management measures.
After conducting actual observations in the study area, we found that the number of deaths among the three types of shrubs was extremely limited, and their proportion within the overall plant population was quite low. This may have been due to the fact that these drought-resistant plants could grow well under conditions where there was underground water irrigation. Additionally, the overall age of the protective forest was relatively young, and it had not yet entered into senescence [47]. Therefore, taking into account the actual circumstances, the biomass of the deceased plant parts was not evaluated in this study. Additionally, plant residues such as fallen leaves and branches were easily dispersed by strong winds, and the soil conditions of the desert road limited the decomposition rate of plant residues and microbial activity [48]. In this study, the carbon release caused by the deterioration of biomass was negligible. Furthermore, due to various constraints such as the growth environment and water supply, the total amount of existing plant residues in the desert road protection forest belt was very low [49]. Meanwhile, due to restricted organic matter inputs, high temperatures caused the rapid evaporation of soil moisture, and strong winds would damage the soil environment. All these factors resulted in significantly lower soil organic carbon content in the protective forests along the desert road compared to the shrub forests in the national and surrounding areas [50]. The quantity of organic carbon in the soil, when compared to the carbon content of the plants themselves, could be disregarded. Therefore, in our research, we only calculated the carbon content contained within the plants themselves along the desert road, while neglecting the carbon stored in litter and soil.
This study used two methods to investigate the carbon sequestration and oxygen release capacity of plants. Among them, the photosynthesis rate method is considered a potential approach as it infers the carbon storage of plants by measuring their photosynthesis rate. This method focuses more on the metabolic activity and biochemical processes of plants to infer the carbon storage within plants [34]. In contrast, the biomass method is regarded as an observational approach that directly measures the plant’s biomass to estimate its carbon storage [51]. This method is based on the relationship between biomass and carbon content and places more emphasis on the observation and measurement of the plant’s external manifestations. This study found that the carbon sequestration calculated based on the biomass method (56.51 × 10⁴ t) was slightly lower than that calculated based on the photosynthetic rate method (63.9 × 10⁴ t). Possibly because this study did not consider the biomass of dead plants and litter, it led to slightly lower carbon storage estimates under the biomass method compared to the photosynthesis rate method. The photosynthetic rate method focuses on the process and rate of photosynthesis, while the biomass method emphasizes the carbon sequestration capacity and cumulative effects of organisms. They can complement and verify each other in studying the process of carbon sequestration, helping us to comprehensively understand the mechanisms and effects of carbon sequestration.
The Pn value of three shelterbelt plants showed a “single peak” curve in one day; that is, it reached the highest peak at noon (12:00 p.m.). In terms of carbon sequestration capacity per unit leaf area, T. chinensis has the highest carbon sequestration capacity. However, from the point of view of carbon sequestration capacity per plant, H. ammodendron showed the strongest capacity, followed by T. chinensis. Jia et al. [52] analyzed the carbon sequestration capacity of T. chinensis, H. ammodendron and C. mongolicum in the desert area on the southern edge of the Zhungeer Basin. They measured the carbon sequestration capacity by comparing the size of the Pnmax value and concluded that T. chinensis was the first-choice tree species. If the carbon sequestration level is considered from the perspective of the Pnmax value, this is consistent with the conclusion of this study. However, only using this value to measure the carbon sequestration capacity of vegetation may overestimate the overall carbon sequestration capacity of vegetation. This is because the Pn value and the fixed amount of CO2 per unit leaf area reflect the photosynthetic carbon sequestration capacity of shrub leaves, while the carbon sequestration capacity per plant comprehensively considers the carbon sequestration capacity of individual shrubs [53]. Therefore, it is suggested to keep H. ammodendron as the dominant species and appropriately increase the planting area of T. chinensis in order to improve the carbon sequestration and oxygen release capacity of the whole shelterbelt. This study found that there were differences in the total leaf area per plant of the three shelterbelts, which resulted in different rules of fixed CO2 per unit leaf area and carbon sequestration per plant. This is similar to the conclusion made by Dang et al. [54] and Li et al. [55] to compare the carbon sequestration capacity of different plants by combining the fixed amount of CO2 per unit leaf area and the leaf area index. Therefore, the fixed amount of CO2 per unit leaf area and the leaf area index should be considered comprehensively when evaluating the carbon sequestration capacity of plants.
The large-scale construction of artificial forests in arid regions not only provides windbreaks, sand stabilizers, and landscape enhancers but also contributes to the increase in carbon storage in arid and semi-arid ecosystems [13,19]. This study found that the average carbon storage density in the shelter forest vegetation of the Tarim Desert Highway was 60.41 t ha−1, which exceeded the value reported in other arid areas. Compared with H. ammodendron in arid desert areas [56,57], the carbon storage density of H. ammodendron on desert roads is about 13 times higher. Compared with T. chinensis plants in arid desert areas [58], the carbon storage density of T. chinensis plants on desert roads is 18.8 times higher. Compared with T. chinensis plants in coastal areas [59], the carbon storage density of T. chinensis plants on desert roads is also 5.3 times higher. Therefore, compared with plants in similar arid areas, desert highway artificial shelterbelts have higher carbon sequestration potential. This shows that plantation has great potential in carbon sequestration. Therefore, we should not only pay attention to the shelter forest along the desert highway but also realize that the carbon sequestration potential of other plantations mainly composed of these species cannot be ignored. This discovery is of great significance for us to evaluate and protect the carbon sequestration value of the plantation.
Estimating biomass carbon is crucial for understanding changes in carbon density and facilitating assessments of carbon management [60,61]. The power function model is selected as the best-fitting model for the three vegetation biomass-estimation models, but the corresponding dependent variables are different. Zhao [62] constructed an equation for estimating the biomass of H. ammodendron and T. chinensis in desert areas by using the plant height H and diameter at breast height D, but the selection of its dependent variables was not completely consistent with this paper. This is because the growth of desert plants is closely influenced by climate, soil, and precipitation conditions, so even the biomass model of the same species in different environments will be different [63]. In addition, Zhao et al. [64] and Yang et al. [65] think that the power function model is the most suitable model for estimating shrub biomass, which is consistent with our research conclusions. However, the optimal biomass model chosen by Tang et al. [66] in their research on C. mongolicum and T. chinensis in the northern margin of the Kubuqi Desert and by Wei et al. [67] in their research on H. ammodendron and C. mongolicum in the desert oasis transitional zone of Minqin is not a power function model, which is different from our research results to some extent. This difference is probably due to the extreme climatic conditions in desert highway areas, which leads to differences in plant morphological characteristics [68]. Therefore, when biomass estimation is carried out in arid areas, each biomass-estimation model has problems and limitations in applicable areas. In practical application, we should choose a suitable model according to the specific situation. Furthermore, in order to address the difficulties in excavating deeply rooted shrub roots caused by extreme weather conditions and minimize damage to the local ecological environment, a small number of shrubs were used for complete excavation in this study [69]. Seven samples were used for model fitting, and five samples were used for model validation. During the model construction phase, it typically required a larger amount of sample data to capture the variability between plants. In contrast, model accuracy validation only required an independent validation dataset to assess the predictive ability of the model [70]. Moreover, through strict sampling methods and randomization, a certain number of standard shrubs were selected to ensure that the chosen plant samples were representative and could infer the overall population.
As the first zero-carbon highway in China, the Tarim Desert Highway has greater value in terms of its carbon sequestration and oxygen release function due to shelter forest vegetation. According to the estimation using the Pn method, the value of carbon sequestration and oxygen release of the three types of shelter forests is CNY 247.14 million (18 years old). Compared with this, the total value of carbon sequestration and oxygen release calculated using the biomass method is CNY 218.77 million. It can be seen that the value obtained when using the Pn method is higher than that when using the biomass method. The Pn method is mainly used to study plant carbon sinks at the micro-scale, and it is studied at various intermediate points, producing more detailed results [71]. The biomass law is applied to the macro-scale study of plant carbon sinks, mainly considering the first and last time points, and is suitable for the study of larger-scale areas [72]. At present, there is no mainstream method to calculate the carbon sequestration and oxygen release capacity of vegetation with both accuracy and convenience, so future development needs to be prioritized according to actual needs, and a more reasonable and simple testing method should be established. From the perspective of economic evaluation, due to the differences in theory and evaluation methods, the evaluation results may be different when studying shrubs, especially those growing in arid areas. At present, there is no systematic methodology, which leads to some errors in the calculation results. However, with the continuous improvement of the low-carbon economy theory and the maturity of the carbon-trading mechanism, the results of the economic benefit evaluation of ecological forests will be enriched.
5. Conclusions
Vegetation alongside desert highways exhibits overall fluctuations in carbon sequestration processes, showing a characteristic “M”-shaped variation pattern in the north-south direction. The diurnal variations in the Pn value of the three plant species all exhibit a “unimodal” curve. Among them, the Pn value of T. chinensis Lour. was the strongest, while the individual carbon sequestration capacity of H. ammodendron (C.A.Mey.) Bunge was more remarkable. It is suggested that, while maintaining H. ammodendron (C.A.Mey.) Bunge as the dominant species, introducing T. chinensis Lour. for planting in moderation would provide greater carbon sink benefits to the protective forest belt alongside desert highways. In addition, according to the 18-year growth cycle of desert highway vegetation, based on the Pn method, the accumulated carbon sequestration and oxygen release value is CNY 247.14 million. Based on the biomass method, the accumulated carbon sequestration and oxygen release value is CNY 218.77 million.
Studying the carbon storage and dynamic changes of artificial sand-fixation vegetation ecosystems is beneficial for establishing a deeper understanding and conducting a quantitative evaluation of the carbon sequestration potential of artificial sand-fixation vegetation. This holds significant practical and strategic importance in accurately estimating land carbon stocks at regional, and even national, scales.
Supplementary Materials
The following supporting information can be downloaded at: https://www.mdpi.com/article/10.3390/f14112137/s1, Table S1: The measured total biomass of the whole plant; Table S2: Quadrat vegetation characteristics; Table S3: Daily assimilation amount per unit leaf area, annual carbon sequestration, annual oxygen release and average daily net photosynthetic rate.
Author Contributions
Investigation, L.L.; conceptualization, L.L. and X.H.; methodology, L.L.; software, L.L.; writing—original draft, L.L.; writing—review and editing, L.L.; writing—review and editing, A.Z.; supervision, X.H.; funding acquisition, X.H. All authors have read and agreed to the published version of the manuscript.
Funding
This work was funded by the determination of carbon sink in the sand-fixing forest belt in Luntai–Minfeng section of the desert highway. Funder: Xuemin He. Funding number: 202205140011.
Institutional Review Board Statement
Not applicable.
Informed Consent Statement
Not applicable.
Data Availability Statement
Not applicable.
Conflicts of Interest
The authors declare no conflict of interest.
References
- Forzieri, G.; Alkama, R.; Miralles, D.G.; Cescatti, A. Satellites reveal contrasting responses of regional climate to the widespread greening of earth. Science 2017, 356, 1180–1184. [Google Scholar] [CrossRef] [PubMed]
- Sohngen, B.; Tian, X. Global climate change impacts on forests and markets. For. Policy Econ. 2016, 72, 18–26. [Google Scholar] [CrossRef]
- Zhang, S.; Bai, X.; Zhao, C.; Tan, Q.; Xi, H. Global CO2 Consumption by silicate rock chemical weathering: Its past and future. Earth’s Future 2021, 9, e1938E–e2020E. [Google Scholar] [CrossRef]
- Smith, P.; Porter, J.R. Bioenergy in the IPCC assessments. GCB Bioenergy 2018, 10, 428–431. [Google Scholar] [CrossRef]
- Yao, L.; Tan, S.; Xu, Z. Towards carbon neutrality: What has been done and what needs to be done for carbon emission reduction? Environ. Sci. Pollut. Res. Int. 2023, 30, 20570–20589. [Google Scholar] [CrossRef]
- Li, H.; Qin, Q. Challenges for China’s carbon emissions peaking in 2030: A decomposition and decoupling analysis. J. Clean. Prod. 2019, 207, 857–865. [Google Scholar] [CrossRef]
- Lin, B.; Ge, J. Carbon sinks and output of China’s forestry sector: An ecological economic development perspective. Sci. Total Environ. 2019, 655, 1169–1180. [Google Scholar] [CrossRef]
- Hoque, M.Z.; Cui, S.; Islam, I.; Xu, L.; Ding, S. Dynamics of plantation forest development and ecosystem carbon storage change in coastal Bangladesh. Ecol. Indic. 2021, 130, 107954. [Google Scholar] [CrossRef]
- Guo, Z.D.; Hu, H.F.; Li, P.; Li, N.Y.; Fang, J.Y. Spatio-Temporal changes in biomass carbon sinks in China’s forests from 1977 to 2008. Sci. China Life Sci. 2013, 56, 661–671. [Google Scholar] [CrossRef]
- Nghiem, N. Optimal rotation age for carbon sequestration and biodiversity conservation in Vietnam. Forest Policy Econ. 2014, 2014, 56–64. [Google Scholar] [CrossRef]
- Fang, J.Y.; Chen, A.P.; Peng, C.H.; Zhao, S.Q.; Ci, L. Changes in forest biomass carbon storage in China between 1949 and 1998. Science 2001, 292, 2320–2322. [Google Scholar] [CrossRef] [PubMed]
- He, Y.J.; Han, X.R.; Wang, X.P.; Wang, L.Q.; Liang, T. Long-term ecological effects of two artificial forests on soil properties and quality in The Eastern Qinghai-Tibet Plateau. Sci. Total Environ. 2021, 796, 148986. [Google Scholar] [CrossRef] [PubMed]
- Qiu, D.D.; Zhu, G.F.; Lin, X.R.; Jiao, Y.Y.; Lu, S.Y.; Liu, J.T.; Liu, J.W.; Zhang, W.H.; Ye, L.L.; Li, R.; et al. Dissipation and movement of soil water in artificial forest in arid oasis areas: Cognition based on stable isotopes. CATENA 2023, 228, 107178. [Google Scholar] [CrossRef]
- Jörgensen, K.; Granath, G.; Lindahl, B.D.; Strengbom, J. Forest management to increase carbon sequestration in boreal pinus sylvestris forests. Plant Soil 2021, 466, 165–178. [Google Scholar] [CrossRef]
- Cook-Patton, S.C.; Leavitt, S.M.; Gibbs, D.; Harris, N.L.; Lister, K.; Anderson-Teixeira, K.J.; Briggs, R.D.; Chazdon, R.L.; Crowther, T.W.; Ellis, P.W.; et al. Mapping carbon accumulation potential from global natural forest regrowth. Nature 2020, 585, 545–550. [Google Scholar] [CrossRef] [PubMed]
- Kumar, A.; Kumar, M.; Pandey, R.; Yu, Z.G.; Cabral-Pinto, M. Forest soil nutrient stocks along altitudinal range of Uttarakhand Himalayas: An aid to nature based climate solutions. CATENA 2021, 207, 105667. [Google Scholar] [CrossRef]
- Ye, T.; Zhang, Y.M. Biomass allocation patterns and allometric relationships of six ephemeroid species in Junggar Basin, China. Acta Prataculturae Sin. 2014, 23, 38–48. [Google Scholar]
- Walker, W.S.; Gorelik, S.R.; Cook-Patton, S.C.; Baccini, A.; Farina, M.K.; Solvik, K.K.; Ellis, P.W.; Sanderman, J.; Houghton, R.A.; Leavitt, S.M.; et al. The global potential for increased storage of carbon on land. Pnas 2022, 119, e2111312119. [Google Scholar] [CrossRef]
- Yang, Y.; Liu, L.; Zhang, P.P.; Wu, F.; Wang, Y.Q.; Xu, C.; Zhang, L.K.; An, S.S.; Kuzyakov, Y.K. Large-scale ecosystem carbon stocks and their driving factors across Loess Plateau. Carb Neutrality 2023, 2, 5. [Google Scholar] [CrossRef]
- Niu, J.P.; Yang, K.; Tang, Z.; Wang, Y. Relationships between soil crust development and soil properties in the Desert Region of North China. Sustainability 2017, 9, 725. [Google Scholar] [CrossRef]
- Liu, X.P.; Zhang, W.J.; Cao, J.S.; Yang, B.; Cai, Y.J. Carbon sequestration of plantation in Beijing-Tianjin sand source areas. J. Mt. Sci. 2018, 15, 2148–2158. [Google Scholar] [CrossRef]
- Xu, M.; Cao, C.; Tong, Q.; Li, Z.; Zhang, H.; He, Q.; Gao, M.; Zhao, J.; Zheng, S.; Chen, W.; et al. Remote sensing based shrub above-ground biomass and carbon storage mapping in Mu Us desert, China. Sci. China Technol. Sci 2010, 53, 176–183. [Google Scholar] [CrossRef]
- Chen, G.L. Photosynthetic Characteristics and Carbon Sequestration and Oxygen Release Capacity of Typical Plants in Helan Mountain. Master’s Thesis, Ningxia University, Yinchuan, China, 2021. [Google Scholar]
- Shang, W.; Li, Y.Q.; Zhao, X.Y.; Zhang, T.H.; Ma, Q.L.; Tang, J.N.; Feng, J.; Su, N. Effects of Caragana microphylla plantations on organic carbon sequestration in total and labile soil organic carbon fractions in the Horqin Sandy Land, northern China. Arid. Land 2017, 9, 688–700. [Google Scholar] [CrossRef][Green Version]
- Liu, J. The Dynamic of Soil Water Shelterbelt Plants Photosynthetic and Stem Flow under Saline drip irrigation in Taklamakan Desert. Ph.D. Thesis, Northwest Agriculture and Forestry University, Xianyang, China, 2020. [Google Scholar]
- Moradi, A.; Shabanian, N. Sacred groves: A model of Zagros forests for carbon sequestration and climate change mitigation. Environ. Conserv. 2023, 50, 163–168. [Google Scholar] [CrossRef]
- Devi, N.B.; Lepcha, N.T. Carbon sink and source function of Eastern Himalayan forests: Implications of change in climate and biotic variables. Environ. Monit. Assess. 2023, 195, 843. [Google Scholar] [CrossRef]
- Barkhordarian, A.; Bowman, K.W.; Cressie, N.; Jewell, J.; Liu, J. Emergent constraints on tropical atmospheric aridity—Carbon feedbacks and the future of carbon sequestration. Environ. Res. Lett. 2021, 16, 114008. [Google Scholar] [CrossRef]
- Gao, Y.; Liu, L.; Ma, S.; Zhou, Y.; Jia, R.; Li, X.; Yang, H.; Wang, B. Vegetation restoration in dryland with shrub serves as a carbon sink: Evidence from a 13-year observation at the Tengger Desert of Northern China. Land Degrad. Develop. 2023, 1–12. [Google Scholar] [CrossRef]
- An, Z.; Zhang, K.; Tan, L.; Niu, Q.; Wang, T. Mechanisms responsible for sand hazards along Desert Highways and their control: A case study of the Wuhai–Maqin Highway in the Tengger Desert, Northwest China. Front. Environ. Sci. 2022, 10, 878778. [Google Scholar] [CrossRef]
- Ding, X.Y.; Zhou, Z.B.; Xu, X.W.; Lei, J.Q.; Lu, J.J.; Ma, X.X. Three-dimension temporal and spatial dynamics of soil water for the artificial vegetation in the center of Taklimakan Desert under saline water drip-irrigation. Chin. J. Appl. Ecol. 2015, 26, 2600–2608. [Google Scholar]
- Zhang, X.M.; Wang, Y.D.; Xu, X.W.; Jiaqiang, L. Biomass, composition and dynamics of litterfall in Taklimakan Desert highway shelterbelt. J. Desert Res. 2017, 37, 6. [Google Scholar]
- Wang, S.C.; Luo, Y.Y.; Wang, S.S.; Zhang, H.W. Study on carbon reserve and carbon sequestration and oxygen release function of four artificial shrub communities in the south foot of Langshan Mountain. Shandong Agric. Sci. 2022, 54, 116–122. [Google Scholar]
- Fu, D.F.; Bu, B.; Wu, J.G.; Singh, R.P. Investigation on the carbon sequestration capacity of vegetation along a heavy traffic load expressway. J. Environ. Manag. 2019, 241, 549–557. [Google Scholar] [CrossRef] [PubMed]
- Xu, Y.; Deng, L. Effects of replanted on stand growth and species diversity. J. Est Environ. 2023, 43, 329–336. [Google Scholar]
- Gou, J.H.; Li, C.J.; Zeng, F.J.; Zhang, B.; Liu, B.; Gou, Z.C. Relationship between root bio-mass distribution and soil moisture, nutrient for two desert plant species. Arid. Zone Res. 2016, 33, 1. [Google Scholar]
- Ahmad, A.; Liu, Q.J.; Nizami, S.M.; Mannan, A.; Saeed, S. Carbon emission from deforestation, forest degradation and wood harvest in the temperate region of Hindukush Himalaya, Pakistan between 1994 and 2016. Land Use Policy 2018, 78, 781–790. [Google Scholar] [CrossRef]
- Ma, X.W.; Xiong, K.N.; Zhang, Y.; Lai, J.L.; Zhang, S.H.; Ji, C.Z. Research progresses and prospects of carbon storage in forest ecosystems. J. Northwest For. Univ. 2019, 34, 62–72. [Google Scholar]
- Li, M. Carbon stock and sink economic values of forest ecosystem in the forest industry region of Heilongjiang Province, China. J. For. Res. 2022, 33, 875–882. [Google Scholar] [CrossRef]
- Chen, W.; Zhao, J.; Cao, C.; Tian, H. Shrub biomass estimation in semi-arid sandland ecosystem based on remote sensing technology. Glob. Ecol. Conserv. 2018, 16, e00479. [Google Scholar] [CrossRef]
- Chen, J.L.; Jiang, X.; Zhou, X.L.; Pang, X.A. Studies on aboveground biomass model of Tamarix Ramosissima at the upper reaches of the Tarim River. Xinjiang Agric. Sci. 2014, 51, 1893–1899. [Google Scholar]
- GB/T 38582-2020; State Forestry and Grassland Administration. Specification for Functional Assessment of Forest Ecosystem Services. State Administration for Market Regulation. National Standardization Administration Commission: Beijing, China, 2020.
- Luo, Y.; Gong, Y. α Diversity of desert shrub communities and Its relationship with Climatic factors in Xinjiang. Forests 2023, 14, 178. [Google Scholar] [CrossRef]
- Shan, L.S.; Li, Y.; Zhang, X.M.; Wang, H. Effects of different irrigation regimes on characteristics of transpiring water-consumption of three desert species. Acta Ecol. Sin. 2012, 32, 5692–5702. [Google Scholar] [CrossRef]
- Wei, Y.J. Study on Ecological Benefits and Optimal Configuration of Jilantai Salt Lake Protection System. Ph.D. Thesis, Inner Mongolia Agricultural University, Hohhot, China, 2022. [Google Scholar]
- Li, W.; Wang, W.Q.; Sun, R.M.; Li, M.K.; Liu, H.W.; Shi, Y.F.; Zhu, D.D.; Li, J.Y.; Ma, L.; Fu, S.L. Influence of nitrogen addition on the functional diversity and biomass of fine roots in warm-temperate and subtropical forests. For. Ecol. Manag. 2023, 545, 121309. [Google Scholar] [CrossRef]
- Wang, X.Y.; Ma, Q.L.; Wang, Y.L. Carbon benefits evaluation of the artificial shelter forest in the Shiyanghe River Basin. J. Desert Res. 2020, 40, 197–205. [Google Scholar]
- Meng, T.G.; Wu, L.Y.; Zhang, S.L.; Xu, Y.Y.; Li, X.; Zhang, J.G. Vertical distribution of soil dissolved carbon and its influencing factors in the artificial shelterbelt irrigated with saline water in an Extreme Drought Desert. Huan Jing Ke Xue Huanjing Kexue 2020, 41, 1950–1959. [Google Scholar] [PubMed]
- Zou, Y.Y.; Jin, Z.Z.; Zhang, D.D.; Li, S.Y.; Xu, X.W. Study on litter standing biomass and soil properties under different forest in shelterbelt along the Tarim Desert Highway. Chin. J. Soil Sci. 2015, 46, 656–663. [Google Scholar]
- Zhang, Q.; Zhang, J.G.; Wang, L.M.; Ding, X.X.; Ma, A.S.; Zhang, H.; Li, L.M. Vertical distribution of soil organic and inorganic carbon in the Taklimakan Desert Highway shelterbelt drip-irrigated with different mineralization water. J. Northwest For. Univ. 2019, 34, 1–7. [Google Scholar]
- Liang, Y.; Gustafson, E.J.; He, H.S.; Serra-Diaz, J.M.; Duveneck, M.J.; Thompson, J.R. What is the role of disturbance in catalyzing spatial shifts in forest composition and tree species biomass under climate change? Glob. Change Biol. 2023, 29, 1160–1177. [Google Scholar] [CrossRef]
- Saini, D. Screening and evaluation of candidate trees for terrestrial carbon storage in regions with high air pollution and water stress. Carbon Manag. 2017, 8, 445–456. [Google Scholar] [CrossRef]
- Yu, D.; Han, S. Ecosystem service status and changes of degraded natural reserves–A study from the Changbai Mountain Natural Reserve, China. Ecosyst. Serv. 2016, 20, 56–65. [Google Scholar] [CrossRef]
- Tang, X.H.; Meng, Z.J.; Gao, Y.; Wang, J.; Zhang, P.; Liu, B. Photosynthetic carbon sequestration capacity of five natural desert shrubs in west Ordos region. J. Arid. Land Resour. Environ. 2017, 31, 128–135. [Google Scholar]
- Li, Z.G.; Zhu, Q.; Li, J. A comparison of photosynthetic carbon sequestration of four shrubs in Ningxia. Pratacultural. Sci. 2012, 29, 352–357. [Google Scholar]
- Zhang, D.M. Study Carbon Budget of Desert Shrubs in Alashan Desert Region. Master’s Thesis, Inner Mongolia Agricultural University, Hohhot, China, 2012. [Google Scholar]
- Niu, P.X. Study on Biomass and Carbon Storage of Haloxylon ammodendron Community in Gurbantunggut Desert. Master’s Thesis, Shihezi University, Shihezi, China, 2015. [Google Scholar]
- Zheng, Z.H.; Ma, C.X.; Ma, J.L.; Li, J.Y.; Lei, S.X.; Liu, C.; Li, H. Analysis of carbon sequestration and energy producing efficiency of four shrub species. Hubei Agric. Sci. 2011, 50, 4633–4635+4643. [Google Scholar]
- Fen, X.H.; Zhang, X.M.; Liu, X.J.; Cheng, R.M.; Sun, H.R. Growth dynamics of Tamarix chinensis plantations in heavy-saline coastal lands and related ecological effects. Chin. J. Eco. Agric. 2013, 21, 1233–1240. [Google Scholar]
- Ali, F.; Khan, N.; Abd_Allah, E.F.; Ahmad, A. Species Diversity, Growing Stock Variables and Carbon Mitigation Potential in the Phytocoenosis of Monotheca buxifolia Forests along Altitudinal Gradient across Pakistan. Appl. Sci. 2022, 12, 1292. [Google Scholar] [CrossRef]
- Li, J.Q.; Chen, Q.B.; Li, Z.; Peng, B.X.; Zhang, J.L.; Xing, X.X.; Zhao, B.Y.; Song, D.H. Distribution and altitudinal patterns of carbon and nitrogen storage in various forest ecosystems in the central Yunnan Plateau, China. Sci. Rep. 2021, 11, 6269. [Google Scholar] [CrossRef] [PubMed]
- Zhao, C.Y.; Song, Y.D.; Wang, Y.C.; Jaing, P.A. Estimation of aboveground biomass of desert plants. Chin. J. Appl. Ecol. 2004, 15, 49–52. [Google Scholar]
- Yasseen, B.T.; Al-Thani, R.F. Endophytes and halophytes to remediate industrial wastewater and saline soils: Perspectives from Qatar. Plants 2022, 11, 1497. [Google Scholar] [CrossRef]
- Zhao, M.Y.; Sun, W.; Luo, Y.K.; Liang, C.Z.; Li, Z.Y.; Shen, H.T.; Niu, X.X.; Zheng, C.Y.; Hu, H.F.; Ma, W.H. Models for estimating the biomass of 26 temperate shrub species in Inner Mongolia, China. Arid. Zone Res. 2019, 36, 1219–1228. [Google Scholar]
- Yang, H.T.; Li, X.R.; Wang, X.R.; Jia, R.L.; Liu, L.C.; Gao, Y.H.; Li, G. Biomass prediction model of four shrub species at southeast edge of the Tengger Desert. J. Desert Res. 2013, 33, 1699–1704. [Google Scholar]
- Tang, X.H.; Gao, H.; Yu, Y.; Meng, Z.J.; Liu, Y.; Wang, S.; Wu, H.; Ding, Y.L. The biomass estimation models for eight desert shrub species in northern edge of the Hobq Desert. J. Arid. Land Resour. Environ. 2016, 30, 168–174. [Google Scholar]
- Wei, X.P.; Zhao, C.M.; Wang, G.X.; Chen, B.M.; Chen, D.L. Estimation of above-and below-ground biomass of dominant desert plant species in an oasis-desert ecotone of Minqin, China. Chin. J. Plant Ecol. 2005, 29, 12–17. [Google Scholar]
- Liu, D.J.; Zhang, C.; Ogaya, R.; Estiarte, M.; Peñuelas, J.; Valencia, E. Effects of decadal experimental drought and climate extremes on vegetation growth in Mediterranean forests and shrublands. J. Veg. Sci. 2020, 31, 768–779. [Google Scholar] [CrossRef]
- Yang, Q. Stability of Typical Desert Plant Populations, Communities and Ecosystems Across Water-Salt Gradient. Master’s Thesis, Xinjiang University, Urumqi, China, 2019. [Google Scholar]
- Yang, H.T.; Wang, Z.R.; Tan, H.J.; Gao, Y.H. Allometric models for estimating shrub biomass in desert grassland in northern China. Arid. Land Res. Manag. 2017, 31, 283–300. [Google Scholar] [CrossRef]
- Friedlingstein, P.; O’Sullivan, M.; Jones, M.W.; Andrew, R.M.; Gregor, L.; Hauck, J.; Le Quéré, C.; Luijkx, I.T.; Olsen, A.; Peters, G.P.; et al. Global carbon budget 2022. Earth Syst. Sci. Data 2022, 14, 4811–4900. [Google Scholar] [CrossRef]
- Lahn, B. A history of the global carbon budget. WIREs Clim. Change 2020, 11, e636. [Google Scholar] [CrossRef]


Disclaimer/Publisher’s Note: The statements, opinions and data contained in all publications are solely those of the individual author(s) and contributor(s) and not of MDPI and/or the editor(s). MDPI and/or the editor(s) disclaim responsibility for any injury to people or property resulting from any ideas, methods, instructions or products referred to in the content. |
© 2023 by the authors. Licensee MDPI, Basel, Switzerland. This article is an open access article distributed under the terms and conditions of the Creative Commons Attribution (CC BY) license (https://creativecommons.org/licenses/by/4.0/).