Article

A Hydraulic Online Monitoring System for Forestry Harvesters Based on LabVIEW

1
School of Technology, Beijing Forestry University, No. 35 Tsinghua East Road, Haidian District, Beijing 100083, China
2
Key Lab of State Forestry Administration on Forestry Equipment and Automation, Beijing Forestry University, Beijing 100083, China
3
School of Artificial Intelligence, Beijing Technology and Business University, No. 11 Fucheng Road, Haidian District, Beijing 100048, China
*
Author to whom correspondence should be addressed.
Forests 2023, 14(10), 2100; https://doi.org/10.3390/f14102100
Submission received: 12 September 2023 / Revised: 14 October 2023 / Accepted: 17 October 2023 / Published: 20 October 2023
(This article belongs to the Section Forest Operations and Engineering)

Abstract

:
The hydraulic system is a key component of intelligent forestry harvesters. In the testing of a forestry harvester, researchers need to analyze the operating efficiency and energy consumption of the forestry harvester based on the pressure and flow rate data in the hydraulic system of the forestry harvester and formulate energy-efficient control strategies. In order to enable researchers to monitor and extract the parameters of the hydraulic system of an intelligent forestry harvester in real time, this paper designs a hydraulic online monitoring system for forestry harvesters based on the LabVIEW 2019 software platform. This system realizes the following functions by reading the CAN (controller area network, a serial communication protocol for multi-host localized networks) bus of the harvester: (1) it collects and stores hydraulic system pressure, flow, and other data and displays the value curve in the system interface in real time, and (2) it monitors the control signals received by the hydraulic system and displays the control signal status and value received by the system interface in real time. This paper used this system to carry out on-site testing of an actual machine, and compared and analyzed the online monitoring data of the hydraulic system and the theoretical pressure data of the main hydraulic valve manifold. The average value of the relative error between the two was 1.65%, and the maximum value of the relative error was 2.75%. The results show that the designed system has good accuracy and stability, and can effectively realize online monitoring of the working status of the hydraulic system of forestry harvesters during their operation.

1. Introduction

Precision forestry is rapidly evolving as a result of the continuous advancement of modern measurement and control technology [1]. In precision forestry, the monitoring of harvesting operations using smart technologies is referred to as precision forestry harvesting [2]. Harvesters are key machines for forest harvesting operations, and their operational efficiency, environmental impact, and operational safety affect the economic sustainability, environmental sustainability, and social sustainability of forest harvesting operations [1,2,3,4]. Therefore, it is necessary to utilize advanced electronic systems and measurement and control instruments to monitor harvester operations and obtain reliable data on harvester operations.
In past studies, different smart technologies have been used to monitor harvester operations and to assess the harvester’s operational efficiency, environmental impact, and operational safety. For example, Bacescu et al. [5] utilized a fleet management system to extract engine data and harvesting operation data from the CAN bus and StanForD, respectively, to evaluate the energy consumption and productivity of a forestry harvester. Eriksson et al. [6] extracted a large amount of harvester operation data from the CAN bus and StanForD to develop a prediction model for harvester productivity. Ala-Ilomäki et al. [7] evaluated the passability of harvester operation paths by analyzing harvester CAN bus data. Spencer et al. [8] designed a remote-communication-enabled CAN bus communication interface. Wempe et al. [9] utilized GNSS for harvesting operators to share their positions with each other for the safety of the operators. Kaartinen [10] used IMU technology in combination with GNSS to improve the accuracy of the harvester’s localization in a forest area. The monitored harvesting machines in the above studies were all operated by drivers, and long hours of operation and complex operating environments can cause drivers to enter a state of fatigue, which affects the efficiency of the harvesting operation and leads to an increase in the cost of the operation and a decrease in the safety of the operation [11]. The use of machines instead of people can significantly reduce operating costs and safety risks, both in terms of economic efficiency and safety [12]. Taking into account the latest advances in Industry 4.0, researchers have reached a consensus on the future direction of forestry harvesters: to realize remote and unmanned operation [13]. This agreement further increases the importance of monitoring forestry harvester operations and also places new demands on monitoring forestry harvester operations: monitoring every step of the harvester’s movements during operation in real time. A number of intelligent monitoring tools have been applied to different devices. Amer et al. [14] designed a jasmine flower picker, which uses a depth camera to locate the position of the target flower and detects the position of the gripping arm. Xiaoli Zhang et al. [15] used vibration sensors and a Bluetooth module to monitor vibration signals from machine tool spindles in real time. John Deere’s development of the intelligent boom control realizes computer autonomous control of robotic arm movement to deliver the harvesting head to the harvesting target [16].
In China, mechanized harvesting operations started late, with harvesting machines being used to perform harvesting operations only in 2006. Most forest operators use a hydraulic excavator chassis equipped with second-hand harvesting heads imported from abroad with a low degree of informatization to conduct harvesting operations, and intelligent forestry harvesting machines with independent intellectual property rights are still in the testing stage [17]. The above reasons have led to low economic efficiency, high safety risks, and high maintenance costs of mechanized harvesting operations in China, as well as increasing the difficulty of monitoring harvesting operations.
LabVIEW is graphical programming software that not only simplifies software programming and improves software development efficiency but also has a more vivid and graphic user interface. This software has more complete functional attributes and industry-leading analysis capabilities and can be used to design instruments’ communication methods and sampling modules, and to realize synchronous connection with other applications that are widely used in R&D and testing, such as external devices and sensors, according to the needs.
The main objective of this work is to design a hydraulic online monitoring system applicable to intelligent forestry harvesters independently developed by China, and to monitor the operation status of the harvester in real time through this system, so as to promote the independent development of mechanized harvesting operations and harvesters in China.

2. Materials and Methods

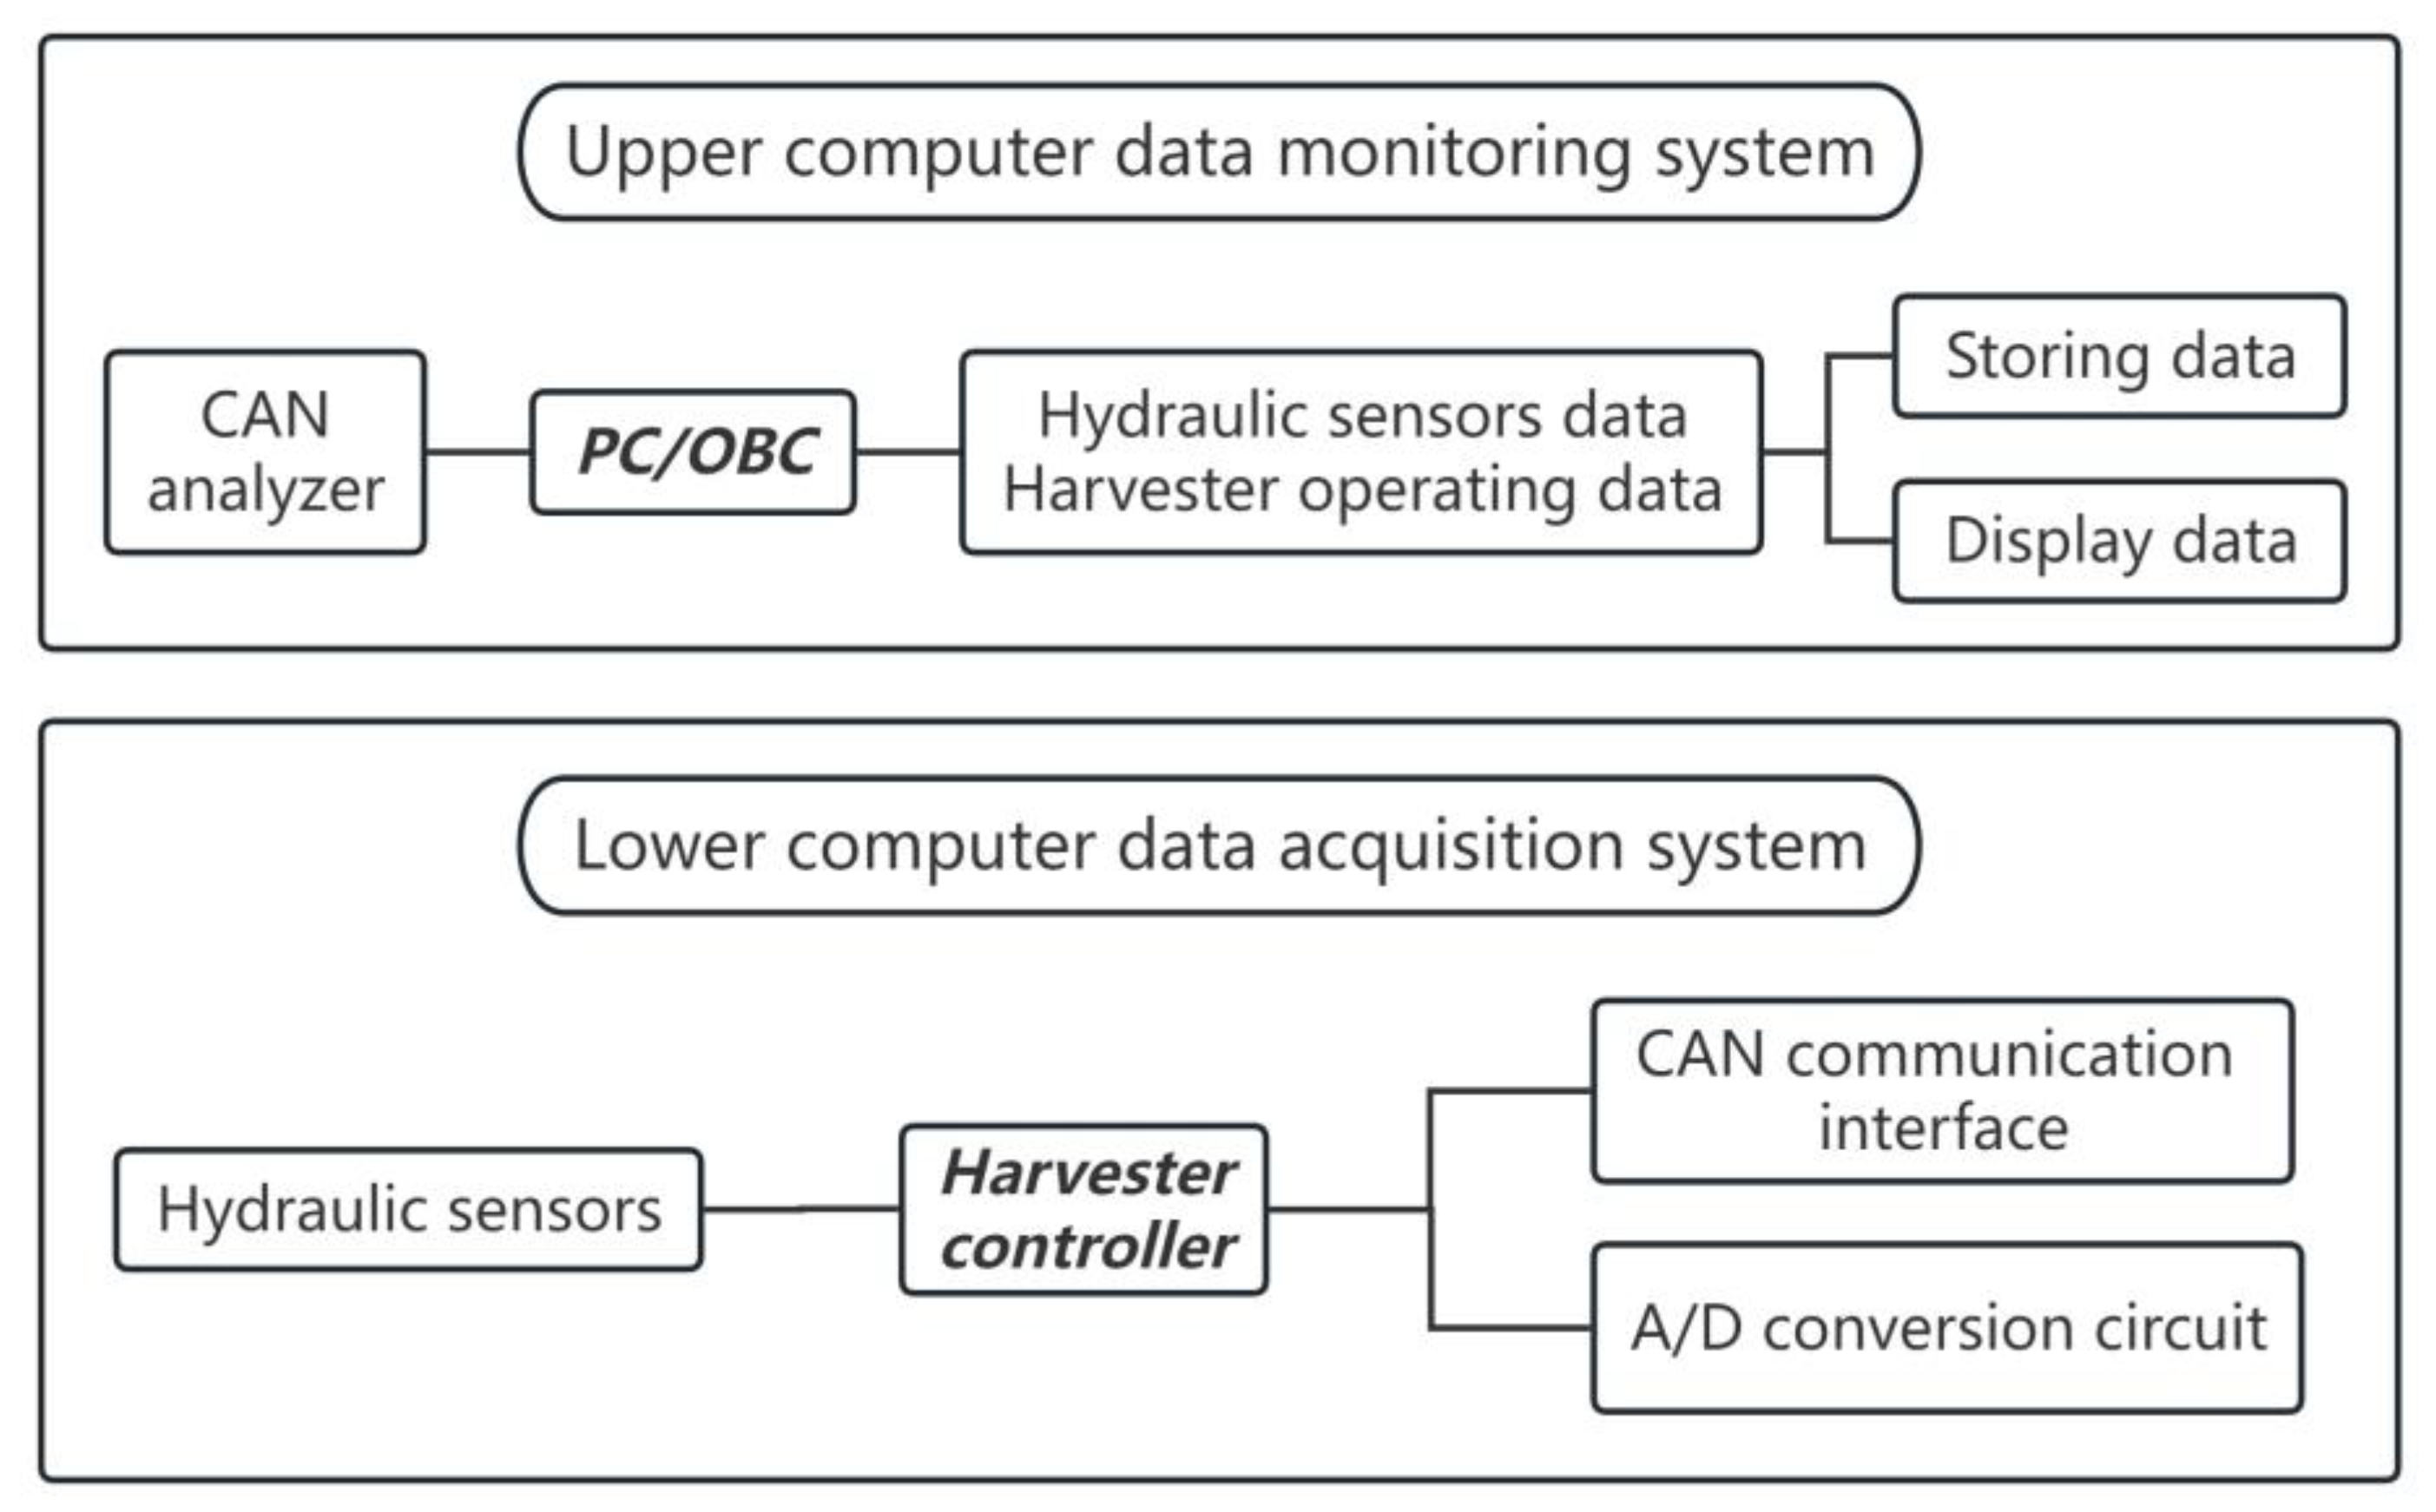
2.1. Subsection System Structure and Principle

The system designed in this article consists of an upper computer data monitoring system and a lower computer data acquisition system. The system structure principle is shown in Figure 1. The lower computer is responsible for collecting hydraulic sensor data of the harvesting machine and uploading the data to the CAN bus of the harvesting machine. The upper computer is connected to the CAN bus through a CAN analyzer. The upper computer program reads and stores the hydraulic sensor data and harvesting machine operation data in real time from the CAN bus and displays the changes in these data in the program interface in real time.

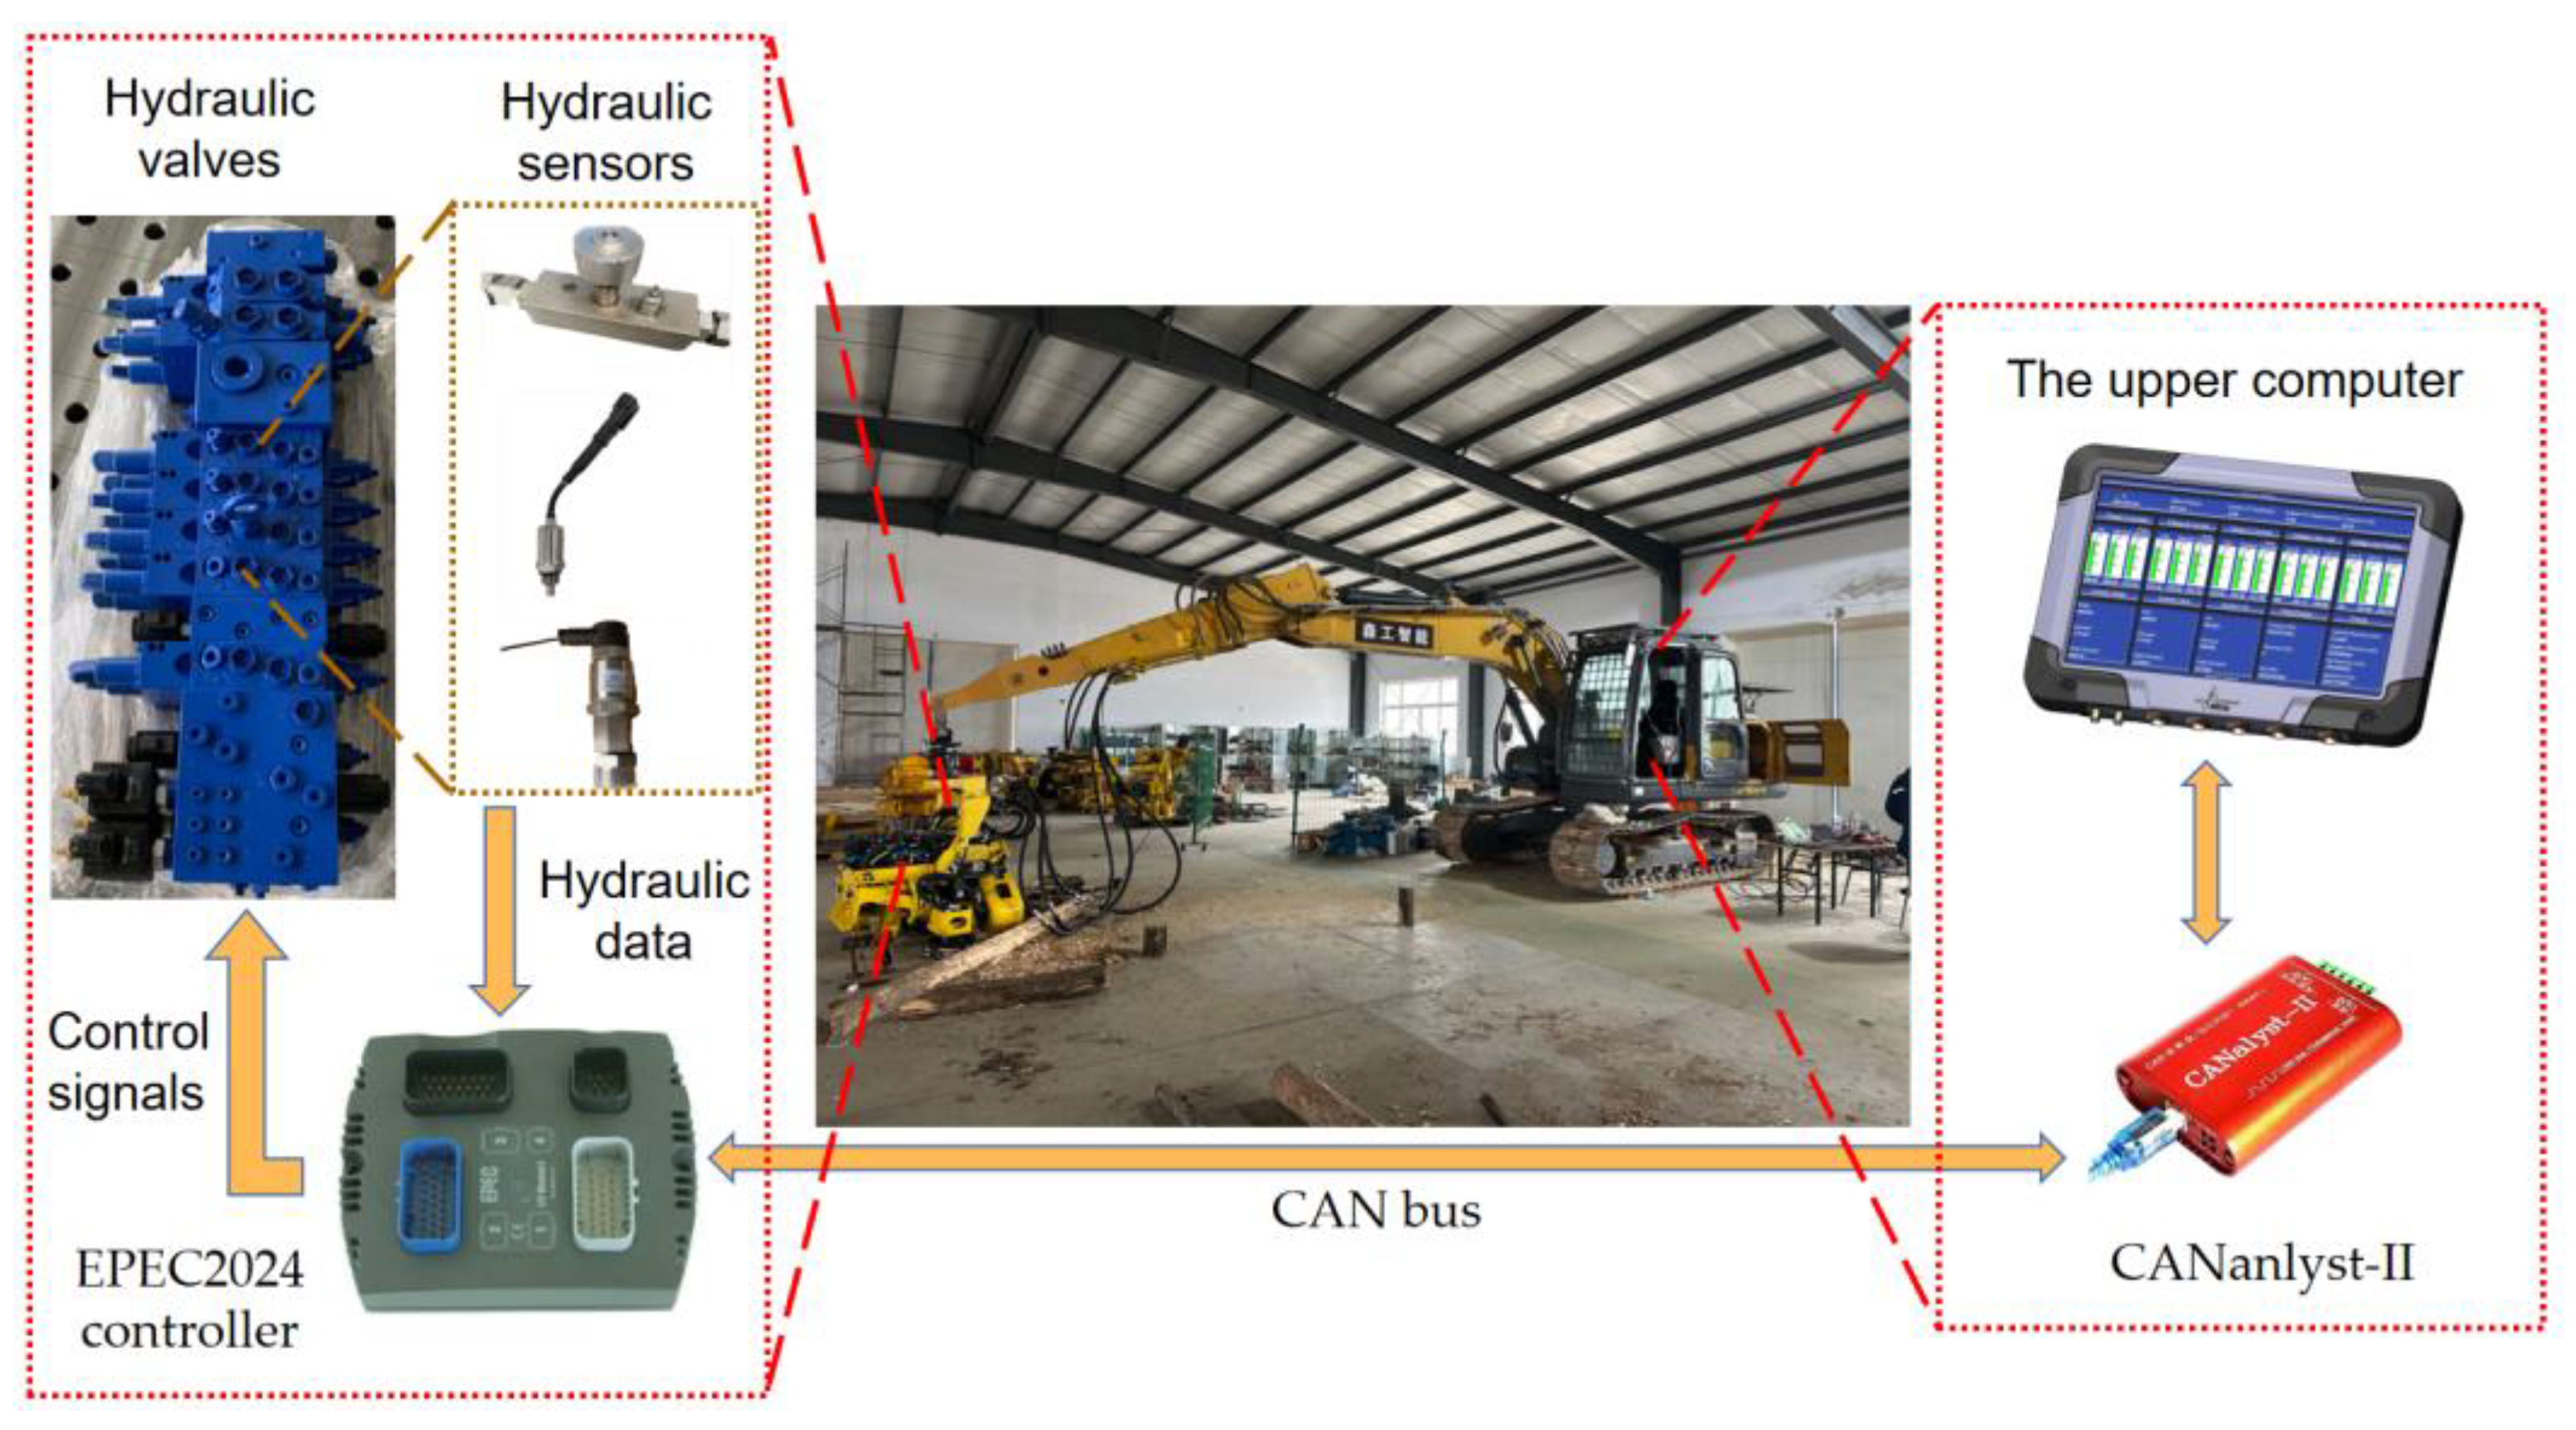
2.2. System Hardware Selection

Considering different testing scenarios and requirements, this article selected two types of upper computers equipped with the Windows 10 operating system: portable computers and a vehicle-mounted computer. The vehicle-mounted computer mentioned in this article refers to the vehicle-mounted touch panel computer model AOC-30F used in China’s self-developed forestry harvesters, which has a built-in CAN bus communication module and a reserved CAN communication interface, so that the vehicle-mounted computer can be connected to the CAN bus simply by wiring it according to the manual. Portable computers need an additional CAN communication module. This paper chose Chuangxin Technology’s CANanlyst-II analyzer. This device has a two-way CAN channel, and each CAN channel is integrated with independent electrical isolation protection and anti-interference ability, with stable, reliable portable computer access to the CAN bus, to achieve the connection of the CAN protocol communication.
The lower computer is the EPEC2024 controller used in harvesters. EPEC2024 is the third-generation CAN control module developed by EPEC Finland, which can work for a long time in harsh environments such as high vibration, large temperature changes, and humidity.
The controller module is embedded with the CAN bus communication module, which comes with CANopen and CAN2.0 bus interfaces. When connecting the CAN bus, it is only necessary to connect the CAN bus to the corresponding pins of the controller and set its node number, so as to realize the mutual communication of the controllers on the CAN bus. The controller has an internal A/D conversion circuit that supports the acquisition of analog signals no higher than 5 V or 22.5 mA. In addition, the controller can provide 5 v and 12 v DC power to the sensor.
Figure 2 shows where the hardware used by the system is mounted on the harvester and how the hardware components interrelate with each other.

2.3. System Software Design

This section describes, in detail, the design ideas and functions of the upper computer program and the lower computer program.

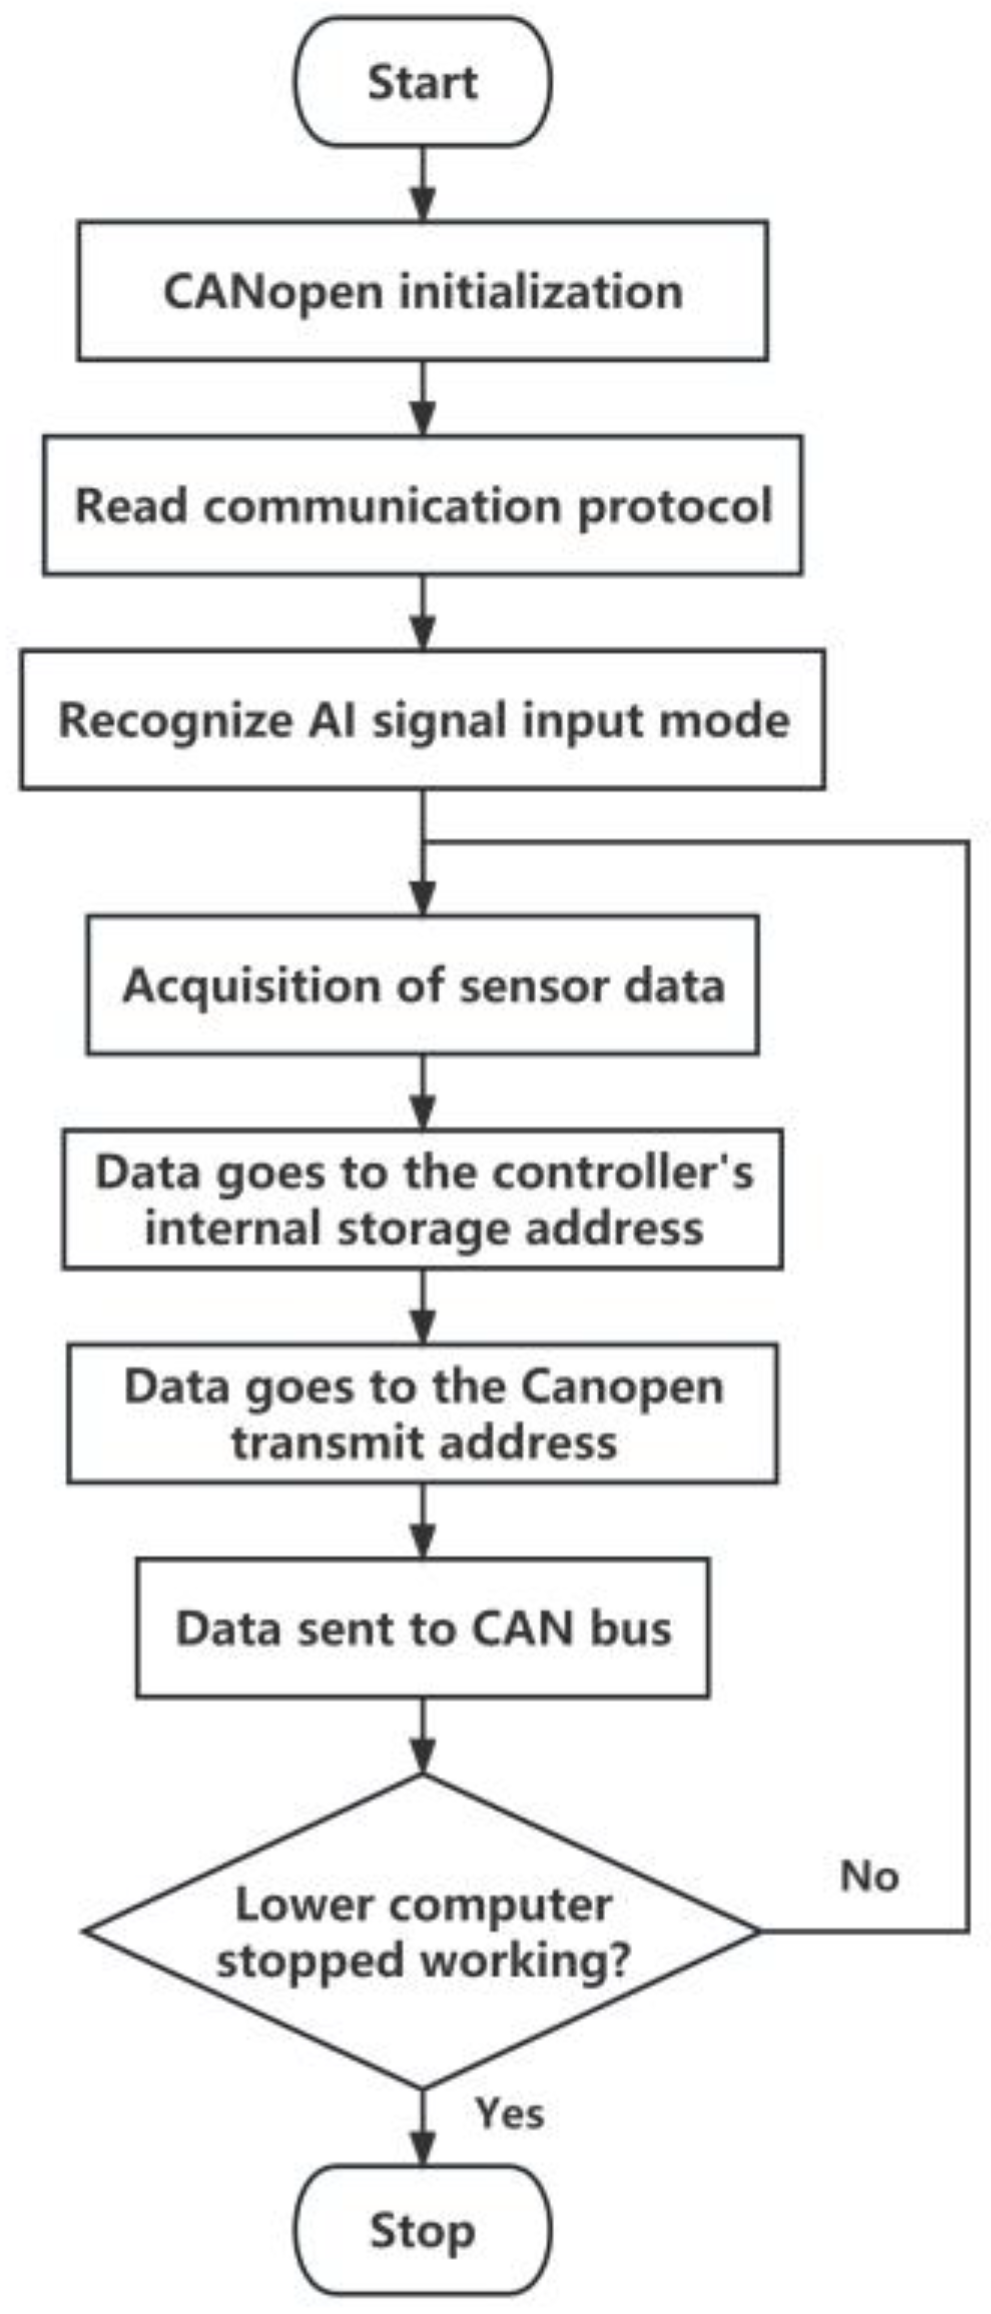
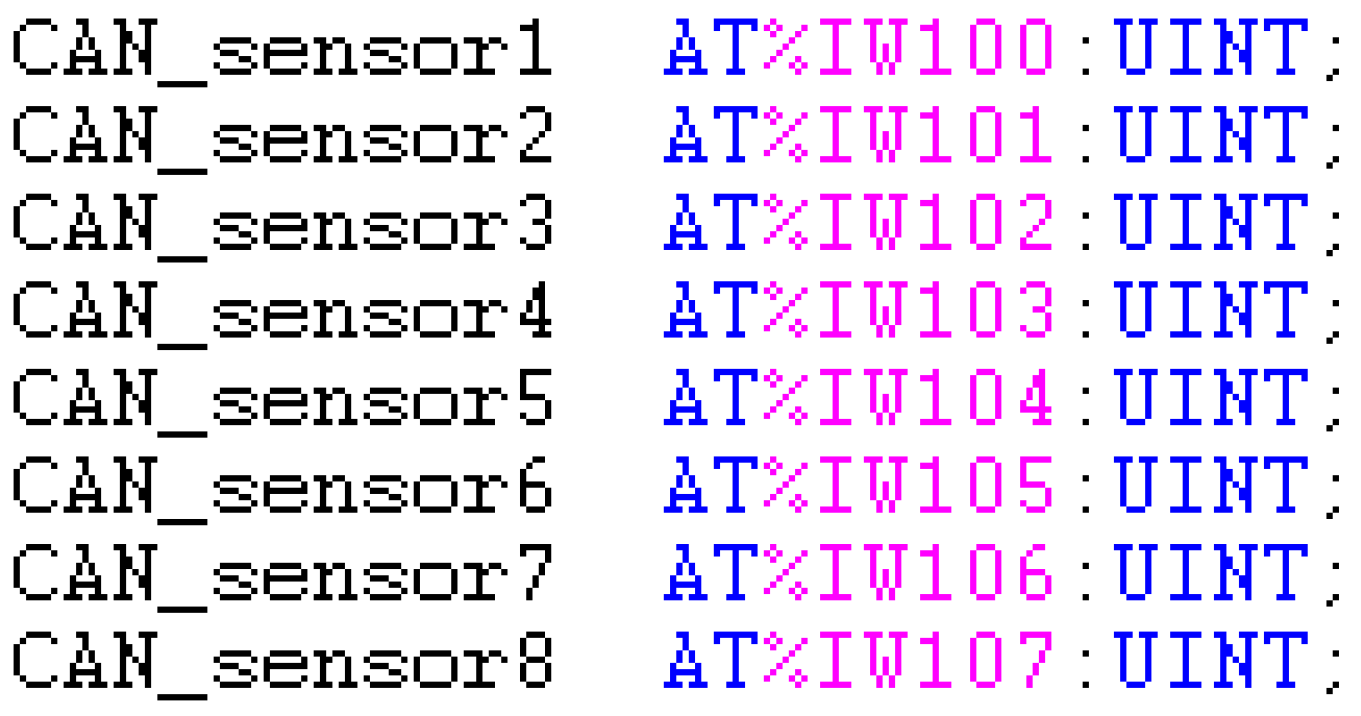
2.3.1. Lower Computer Programming

The main task of the lower unit EPEC2024 controller is to collect and forward sensor data. The A/D converter circuit inside the controller can convert the analog signal returned by the sensor into UINT-type data and send these data to the CAN bus. In this paper, the lower computer program is designed based on codesys2.1 software, and the program flowchart is shown in Figure 3.
The lower computer needs to execute the CANopen initialization code each time it is powered on and confirm the ID of the CAN message sent by the lower computer and the data bit of the data in the CAN message according to the communication protocol in the initialization code. The program is shown in Figure 4 and Figure 5.
The AI signal acquisition channel of the lower computer has two input modes, namely, high-impedance voltage input and low-impedance current input, and each channel has a separate data storage address inside the register. The lower computer determines the input mode of the AI pin by executing the mode recognition function. The program is shown in Figure 6 and Figure 7.
The lower computer sends the collected sensor data to the upper computer via the CAN bus in real time by executing the above program.

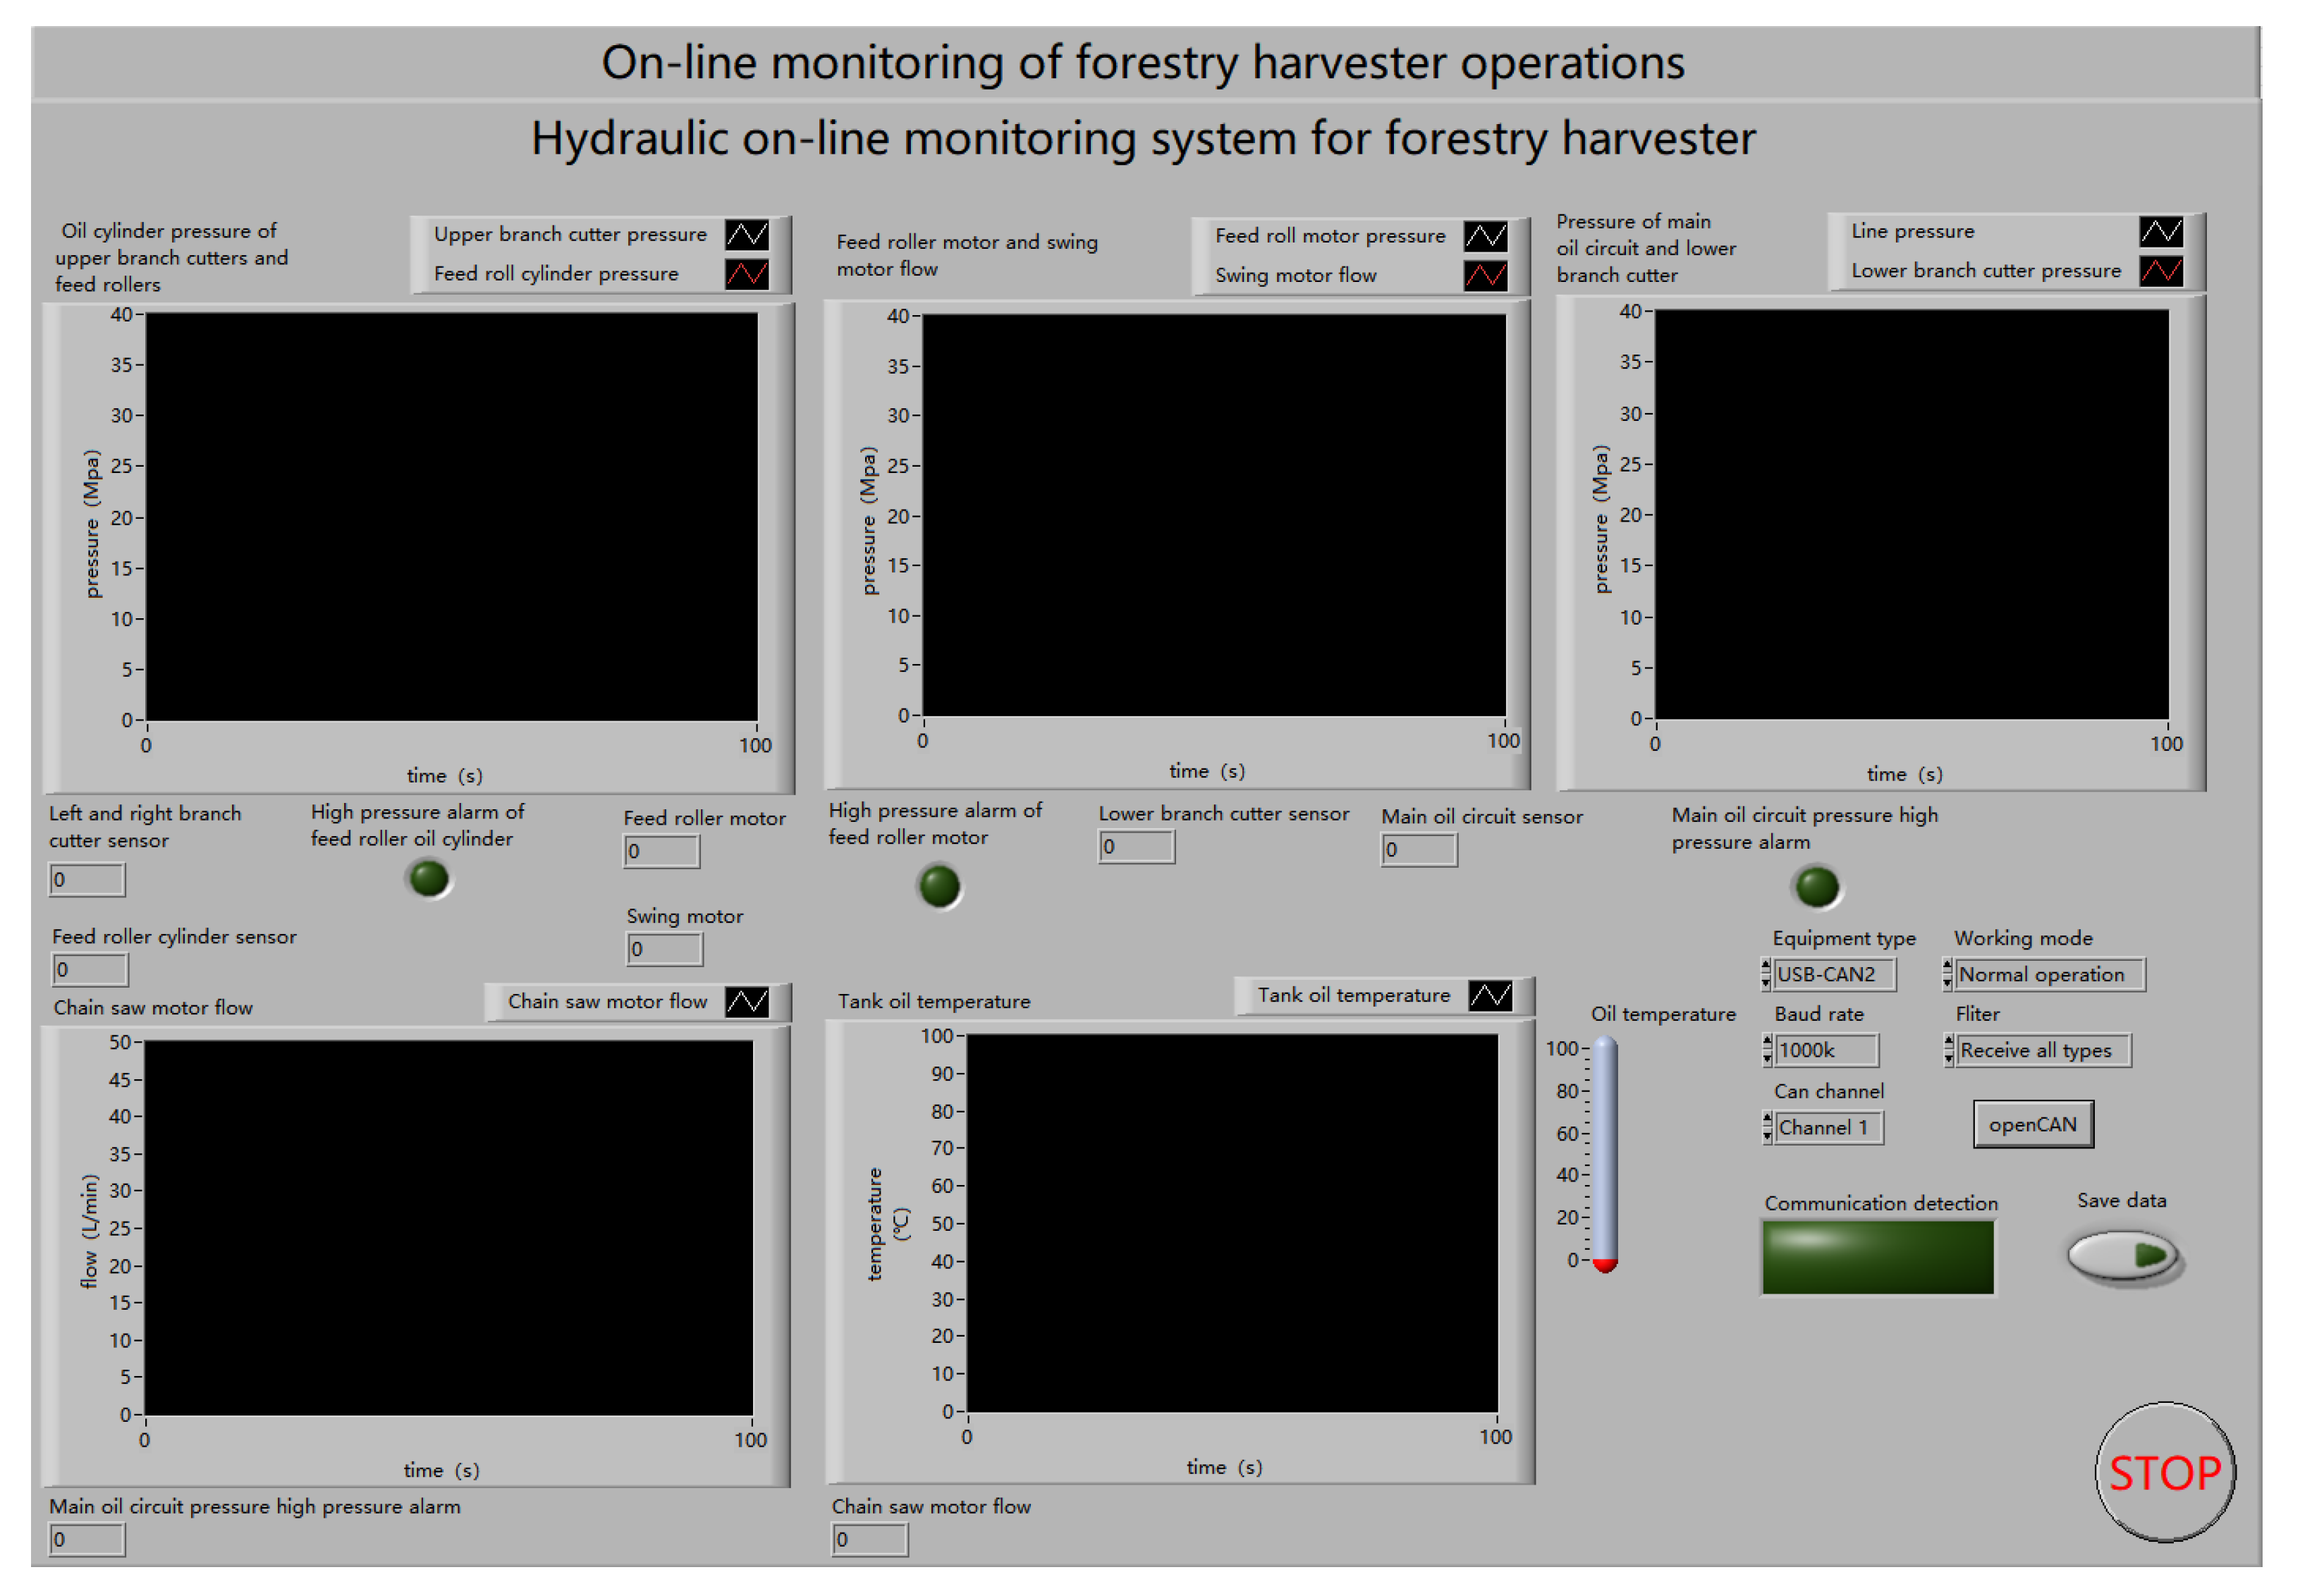
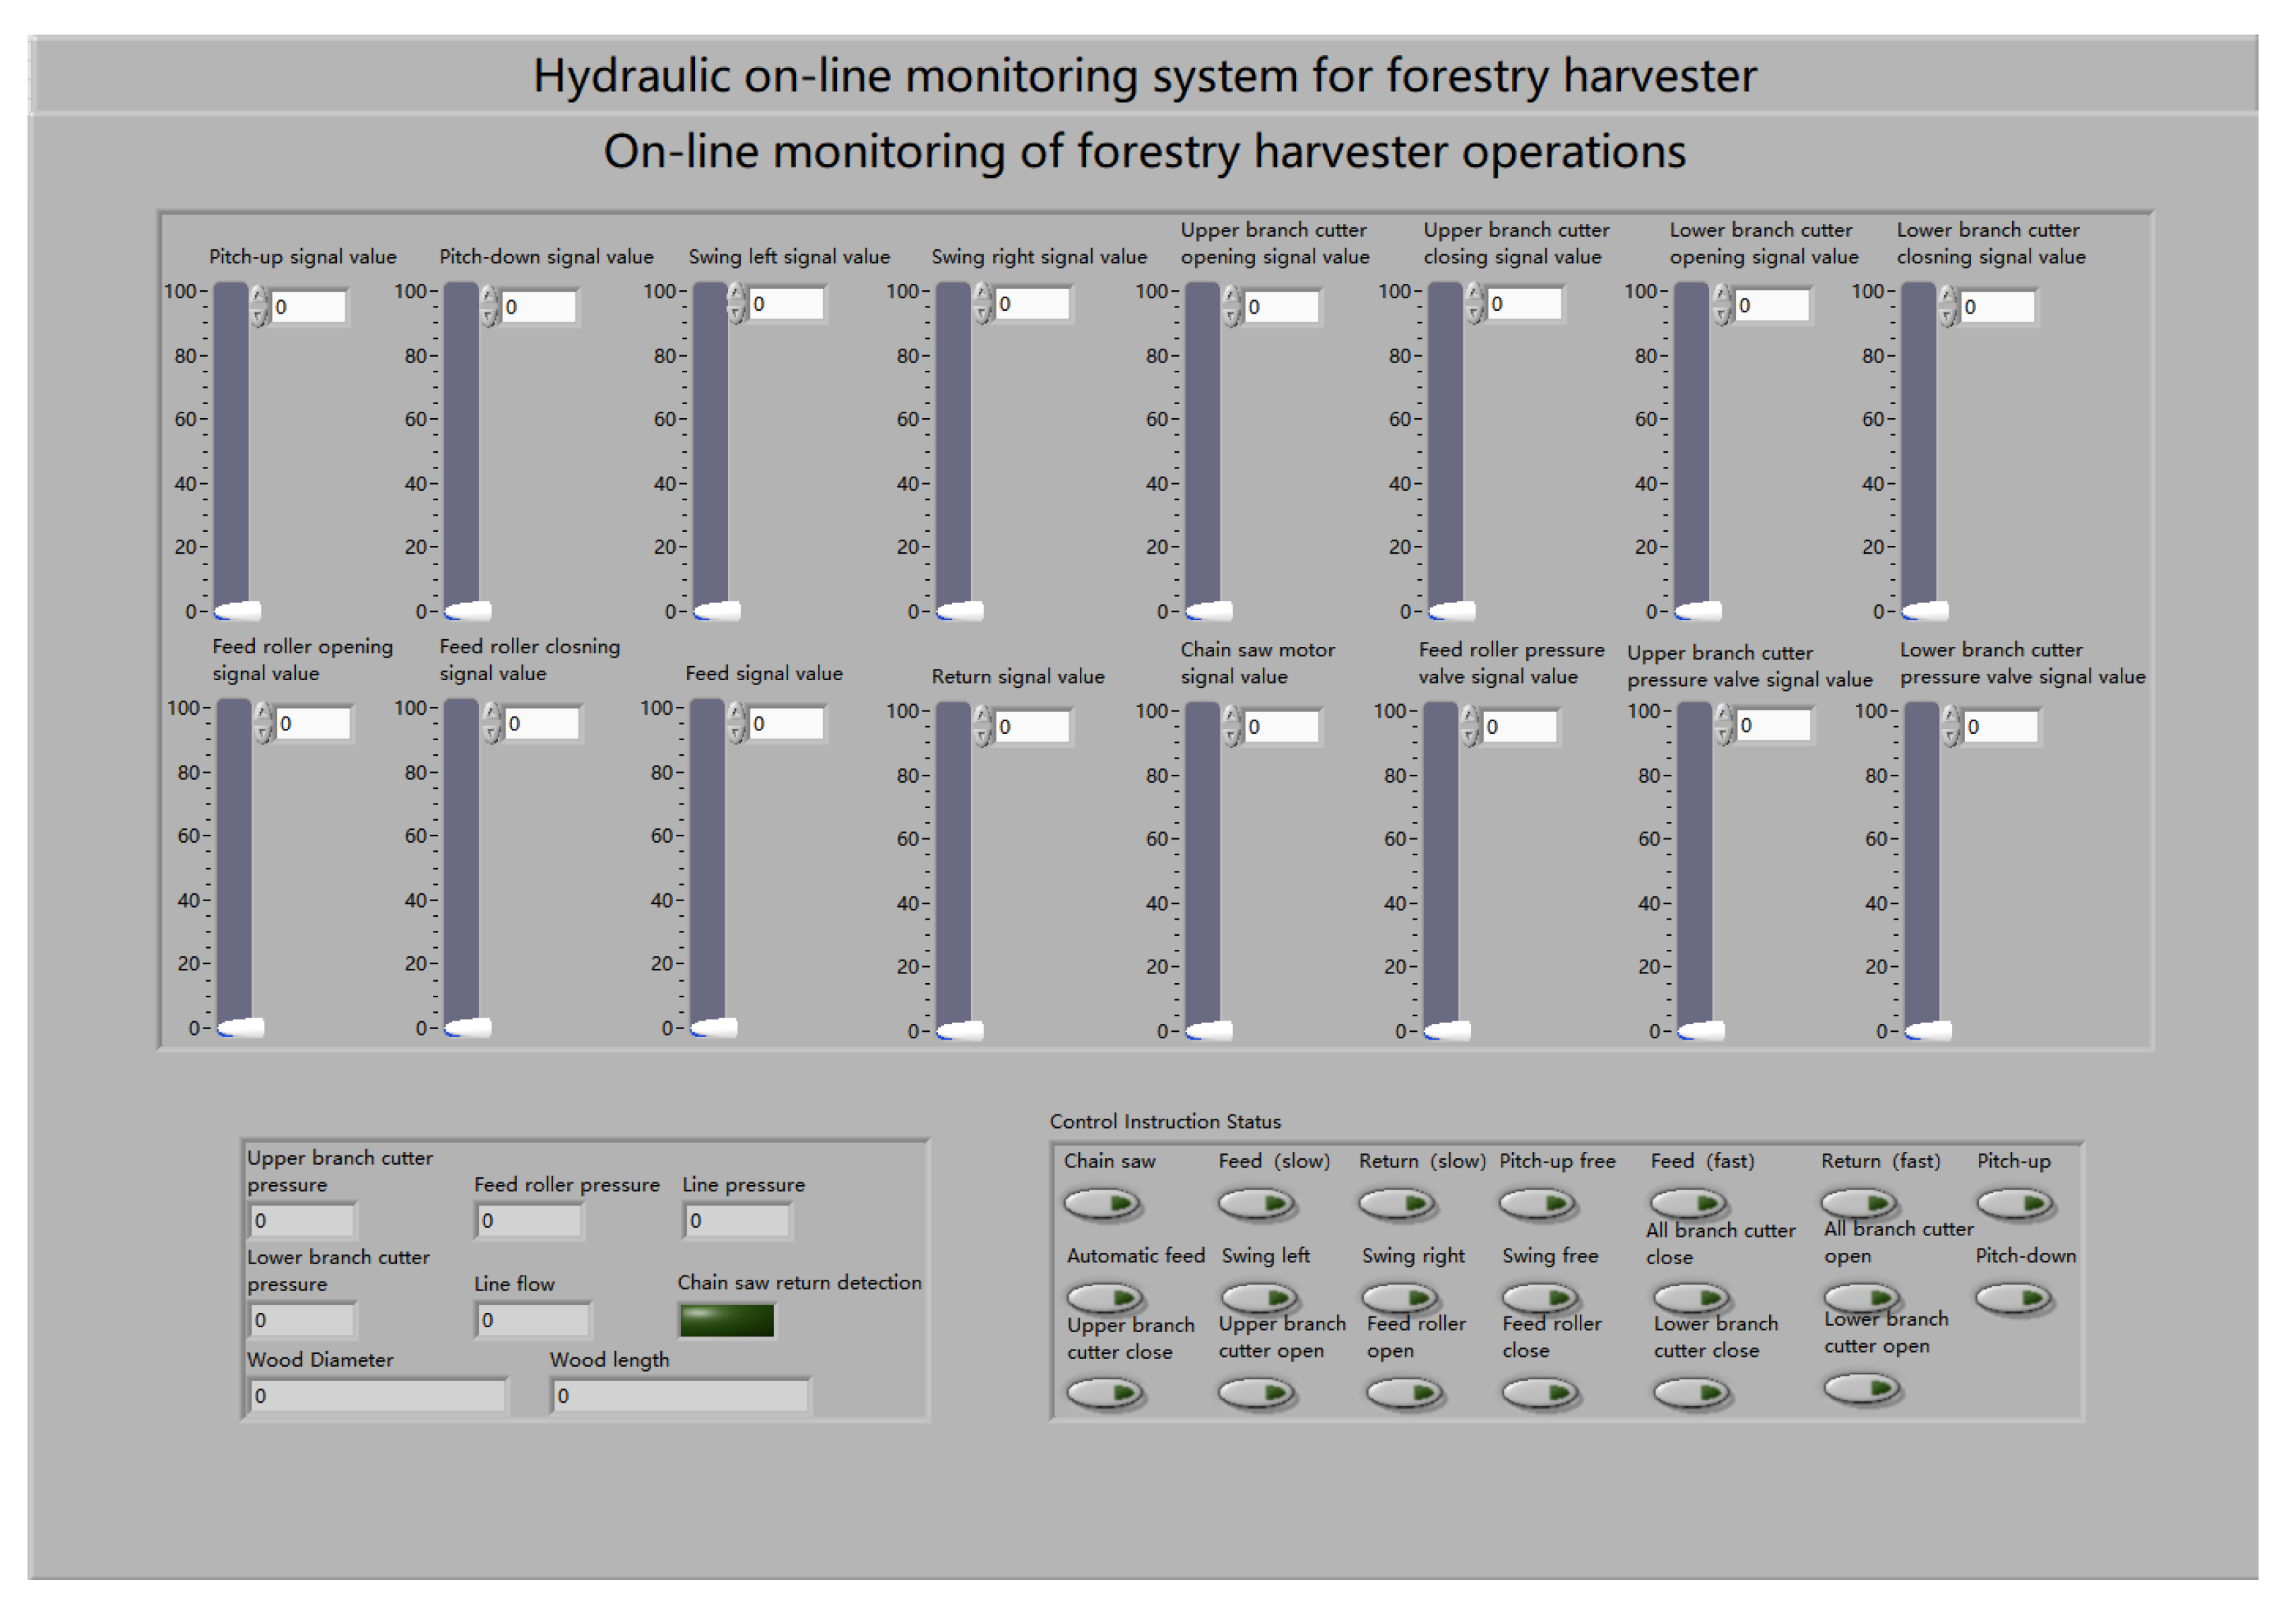
2.3.2. Upper Computer Programming

The upper computer program is developed based on the LabVIEW platform, which is responsible for displaying the hydraulic sensor data and the operation of the forestry harvester during operation in real time and storing these data in the computer. The program flowchart is shown in Figure 8.
  • Human–computer interface.
LabVIEW software provides controls similar to those of traditional instruments, such as dashboards, waveform graphs, thermometers, pointer sliders, and switches with status alerts. This paper utilized these controls to design an upper computer human–computer interface through which the researcher can directly observe the real-time changes in the pressure data during the operation of the forestry harvester, as well as the operations being performed by the harvester.
The interface consists of two parts: the first part is used to display the real-time changes in the hydraulic pressure, temperature, and flow of the harvester, and it integrates the functions of CAN communication parameter setting, data storage, and closing the software, as shown in Figure 9; the second part describes the operation being executed by the harvester by displaying the control commands and control signal values received by the harvester, as shown in Figure 10.
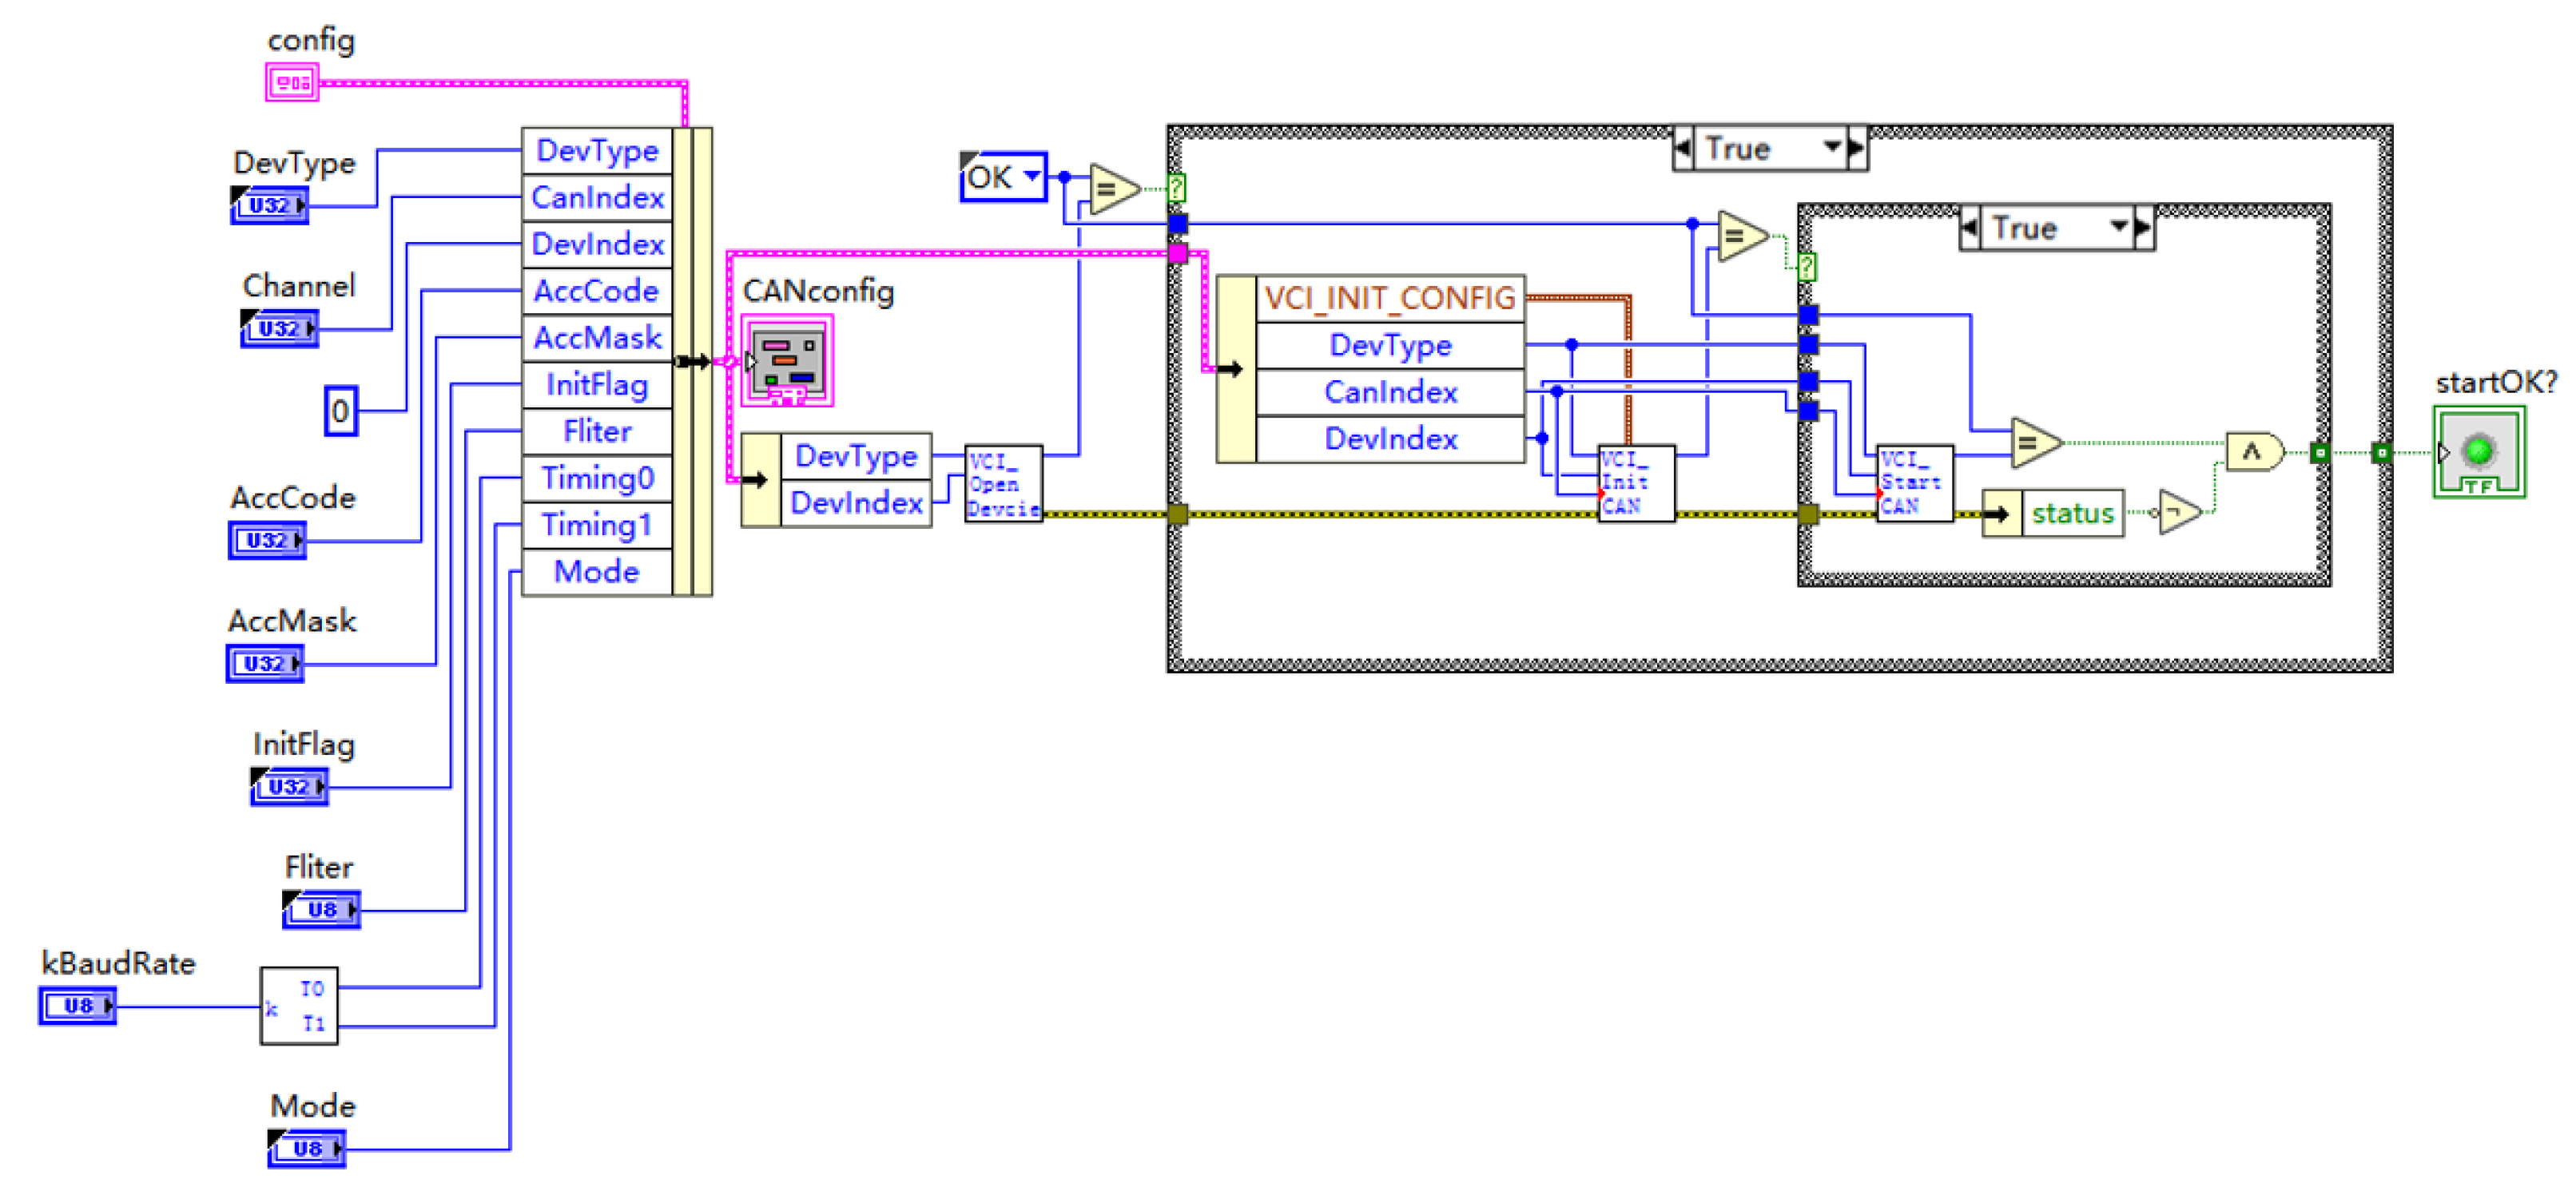
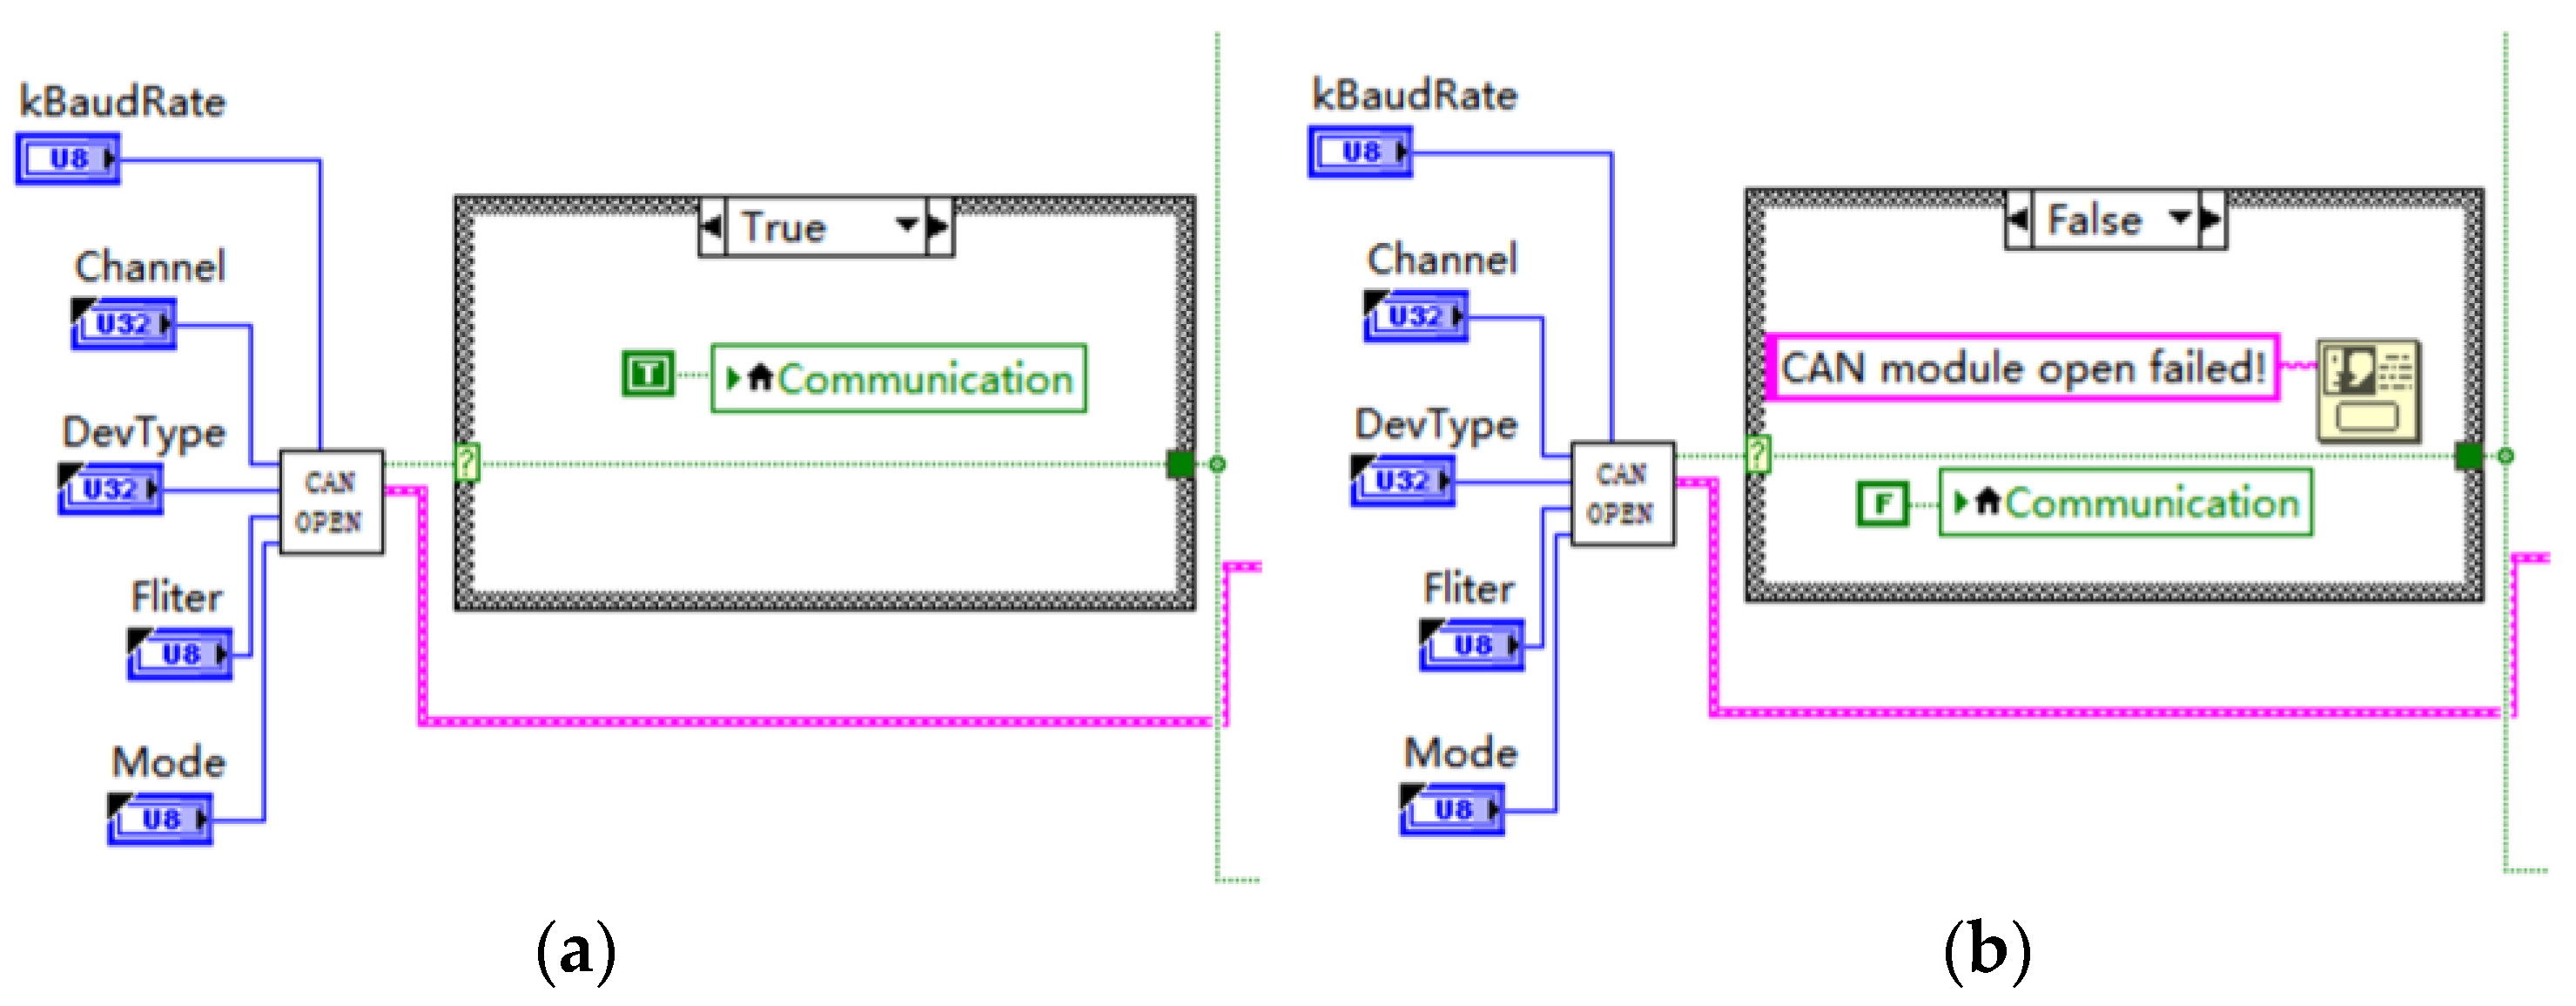
  • Initialization of CAN analyzer.
In this paper, CANOPEN VI is used in the program to perform the initialization task. CANOPEN VI receives the working parameters configured by the system user for the CAN analyzer, such as the baud rate, acquisition channel, device model, and working mode, and makes them available for its internal functions to call. This VI calls a total of three functions internally, which are derived from the function library provided by the CAN analyzer manufacturer. The VCI_OpenDevice function is used to open the CAN analyzer, the VCI_InitCan function is used to initialize the specified CAN channel, and the VCI_StartCAN function is used to start the specified CAN channel. The three functions will generate three return values when called, namely, 1, 0, and −1: 1 means a successful operation, 0 means a failed operation, and −1 means the CAN analyzer does not exist or has been dropped. In the implementation of the initialization task, the program will call the above three functions in turn. For the first call of the VCI_OpenDevice function, if the return value of this function is 1, the program can continue to call the VCI_InitCan function. The same can be seen in the call conditions of the VCI_StartCAN function. The program is shown in Figure 11.
When the return value of all three functions is 1, it means that the CAN analyzer is initialized successfully; at this time, CANOPEN VI will send out a Boolean signal with the value of “TRUE”, which is sent to the next conditional structure and the communication status prompt control in the human–machine interface, informing the system user that the system can work normally. This signal is sent to the next condition structure and the communication status alert control in the HMI, informing the system user that the system can work normally. If the initialization fails, the value of the Boolean signal issued by the VI is “FALSE”; at this time, the HMI will show a dialog box with “CAN module open failed!”. At the same time, the program will call the VCI_CloseDevice function to close the CAN analyzer. The CAN analyzer initialization program is shown in Figure 12.
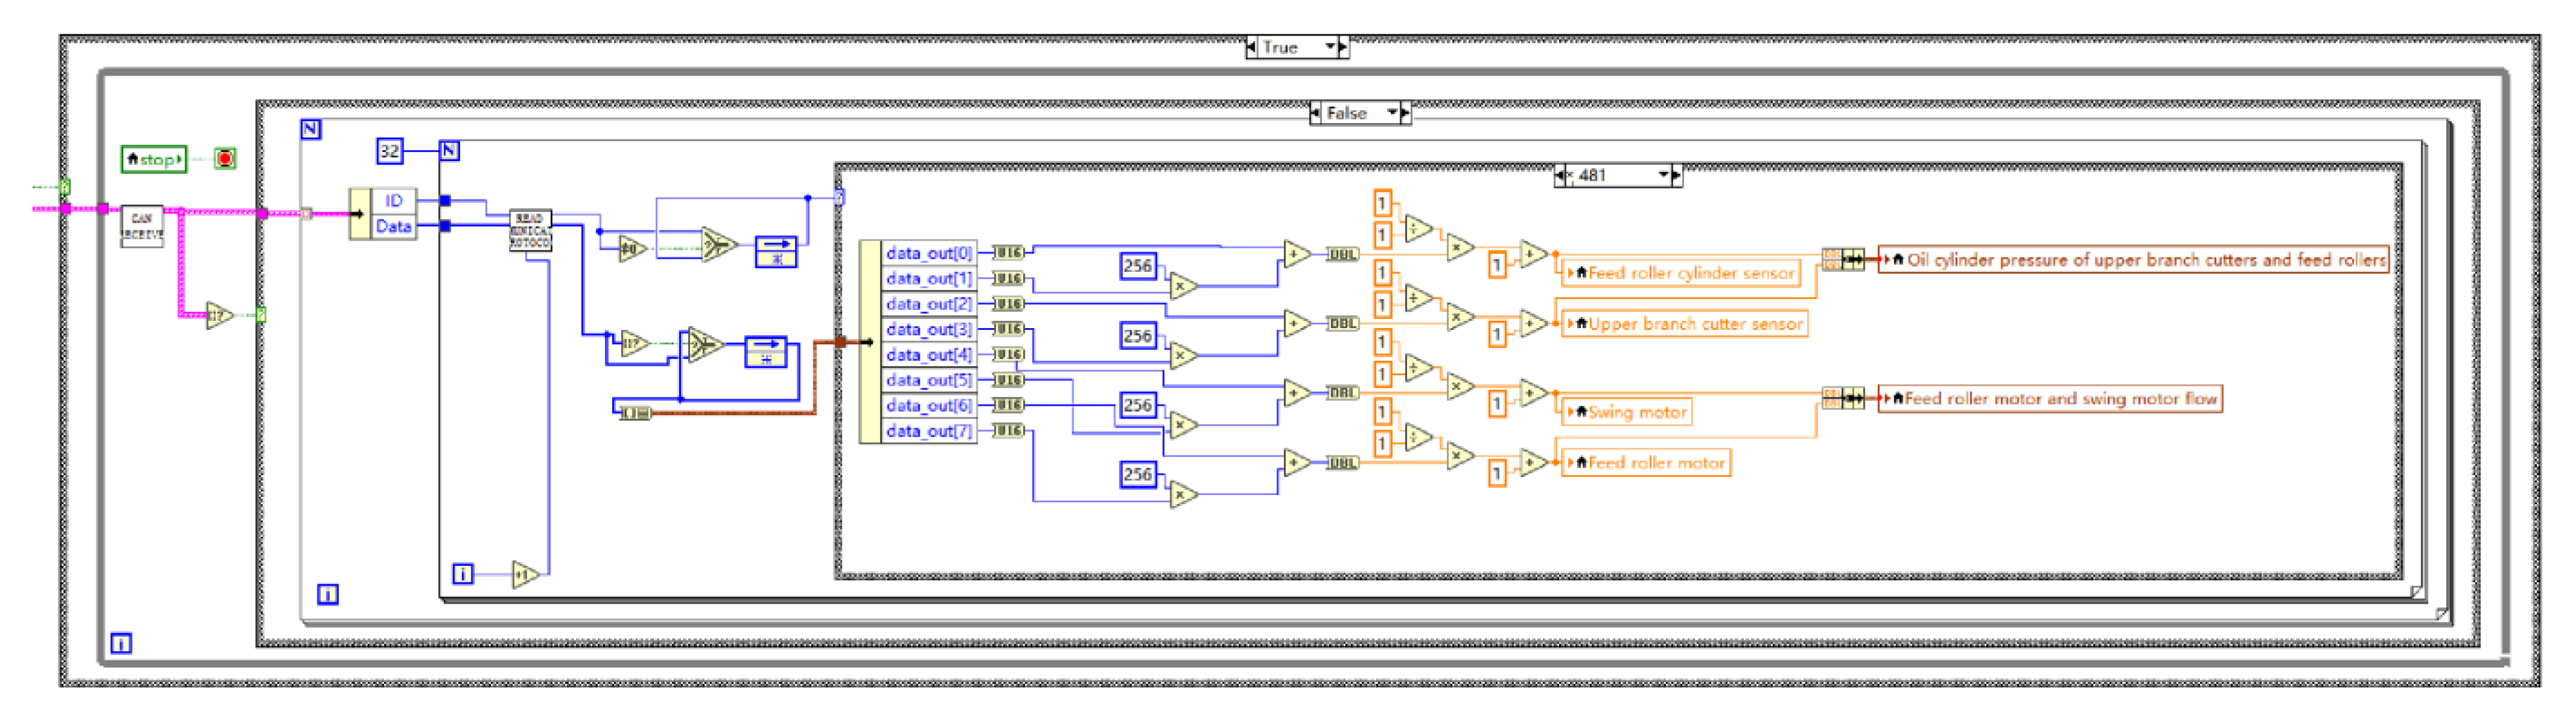
  • Receiving and processing data.
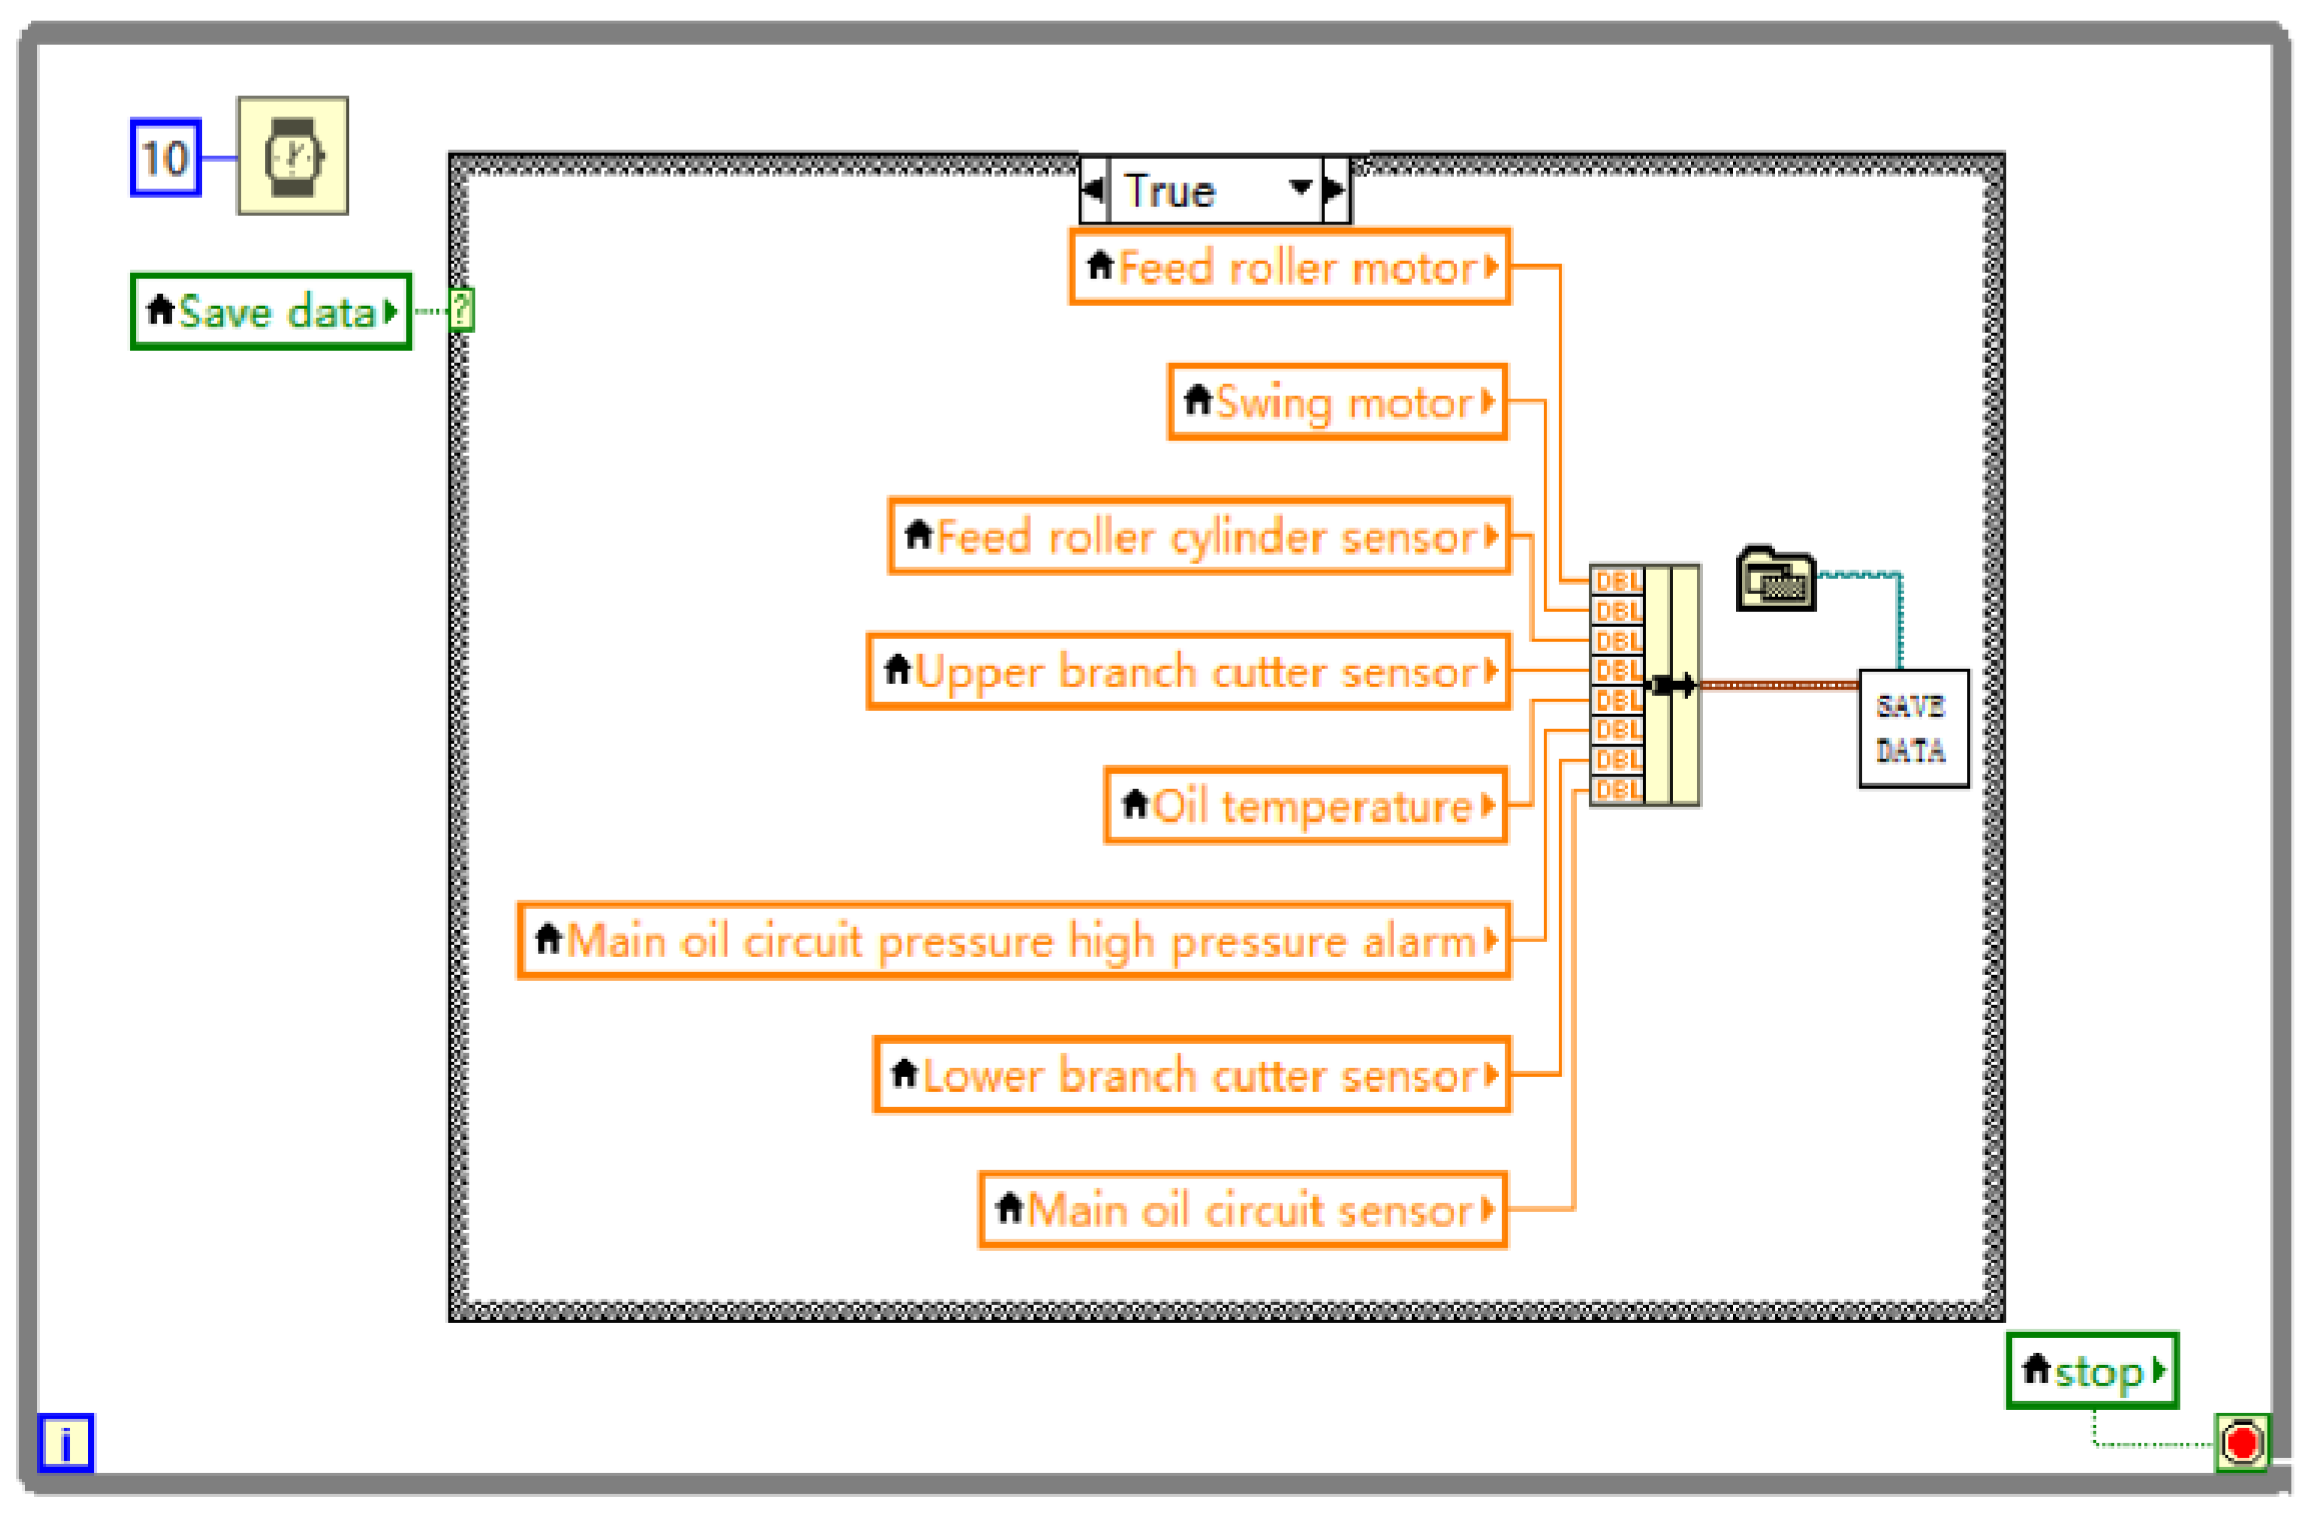
CANOPEN VI will send the Boolean signal to determine the initialization status of the CAN analyzer and the device operating parameters to the data reception processing program, which is shown in Figure 13.
This part of the program first determines whether the CAN analyzer is initialized successfully. If the device is initialized successfully, the working parameters of the device will be fed to CANRECEIVE VI. CANRECEIVE VI reads the data from the receive buffer of the CAN channel specified by the system user by calling the VCI_Receive function and outputs the received CAN information in the form of a one-dimensional array of frames. If the received information frame is not null, the program will use a for loop to process the information frame. First, the program extracts the ID and data array of the information frame and feeds it to the communication protocol parsing VI (READ COMMUNICATION PROTOCOL VI in Figure 13). Then, the COMMUNICATION PROTOCOL VI reads the communication protocol file internally and filters and extracts the ID and the data corresponding to this ID that the program needs according to the communication protocol. Finally, the program converts the data array and assigns the processed values to the controls in the HMI.
  • Data storage.
SAVE DATA VI is used to save processed data in real time and generate an Excel file in the program path. The data save program uses a while loop and a conditional structure that is used to determine whether to execute the data save task or not. The program architecture is shown in Figure 14.

3. Tests and Analyses

3.1. System Reliability Test

This test is used to verify the reliability of the hydraulic online testing system designed in this paper in terms of the measurement data. First, the tester connected the hydraulic valve manifold to the hydraulic station and installed pressure sensors and flow sensors on the valve manifold. Then, the system test platform was built, and the system hardware was connected within the CAN bus with signal cables. Finally, the main pump of the hydraulic station was started, and the test began. In this paper, six different flow output values, namely, 80, 100, 120, 150, 180, and 200 L/min, and six different pressure output values, namely, 5, 8, 10, 12, 15, and 20 Mpa, were selected. Each output value was repeated 10 times, and the measurement results were recorded. The test site is shown in Figure 15, and the test data are shown in Table 1 and Table 2.
According to Table 1 and Table 2, it can be seen that the deviation of the data measured by the system from the output value of the hydraulic station is within ±0.3 MPa and ±1.7 L/min, the deviation of the average value of the measured data from the output value of the hydraulic station is within ±0.1 MPa and ±0.55 L/min, and the relative standard deviation of the measured values of the pressure and flow rate is within 2.1% and 0.6%, respectively. The results show that the hydraulic online inspection system designed in this paper is reliable in data measurement.

3.2. Real Machine Tests

The tests in this section were conducted to verify the stability of the hydraulic online monitoring system, which was installed on a forestry harvester developed in China. The forestry harvester, when unloaded, performs the opening and closing of the upper sprigging knife, the opening and closing of the feed roller cylinder, and the elevation of the machine according to the signal values specified by the tester. When the forestry harvester performs the above actions, the system will collect and store the pressure and flow data of its hydraulic system. The machine used for the test is shown in Figure 16. The signal values specified by the tester during the test are shown in Table 3 and Table 4.
In this test, the continuous operation time of the online monitoring system designed in this paper was more than 4 h, and there were no hardware device drops, CAN communication reporting errors, etc.
During the test, the researchers measured the main oil circuit pressure of the hydraulic system of the forestry harvester 10 times using a pressure gauge, combined it with the theoretical value of the main oil circuit pressure provided by the factory report of the valve group, and compared it with the pressure data collected by the system at the same moment. The results are shown in Table 5.
From the data in the table, it can be seen that the main oil circuit pressure value collected by the system is closer to the theoretical pressure value in the factory report of the valve group, and the measurement results are more stable. The reason for the higher artificial measurement value may be that the hydraulic gauge used in the test process has a zero-point error, resulting in large artificial reading results. The test results show that the hydraulic online monitoring system designed in this paper has good stability.

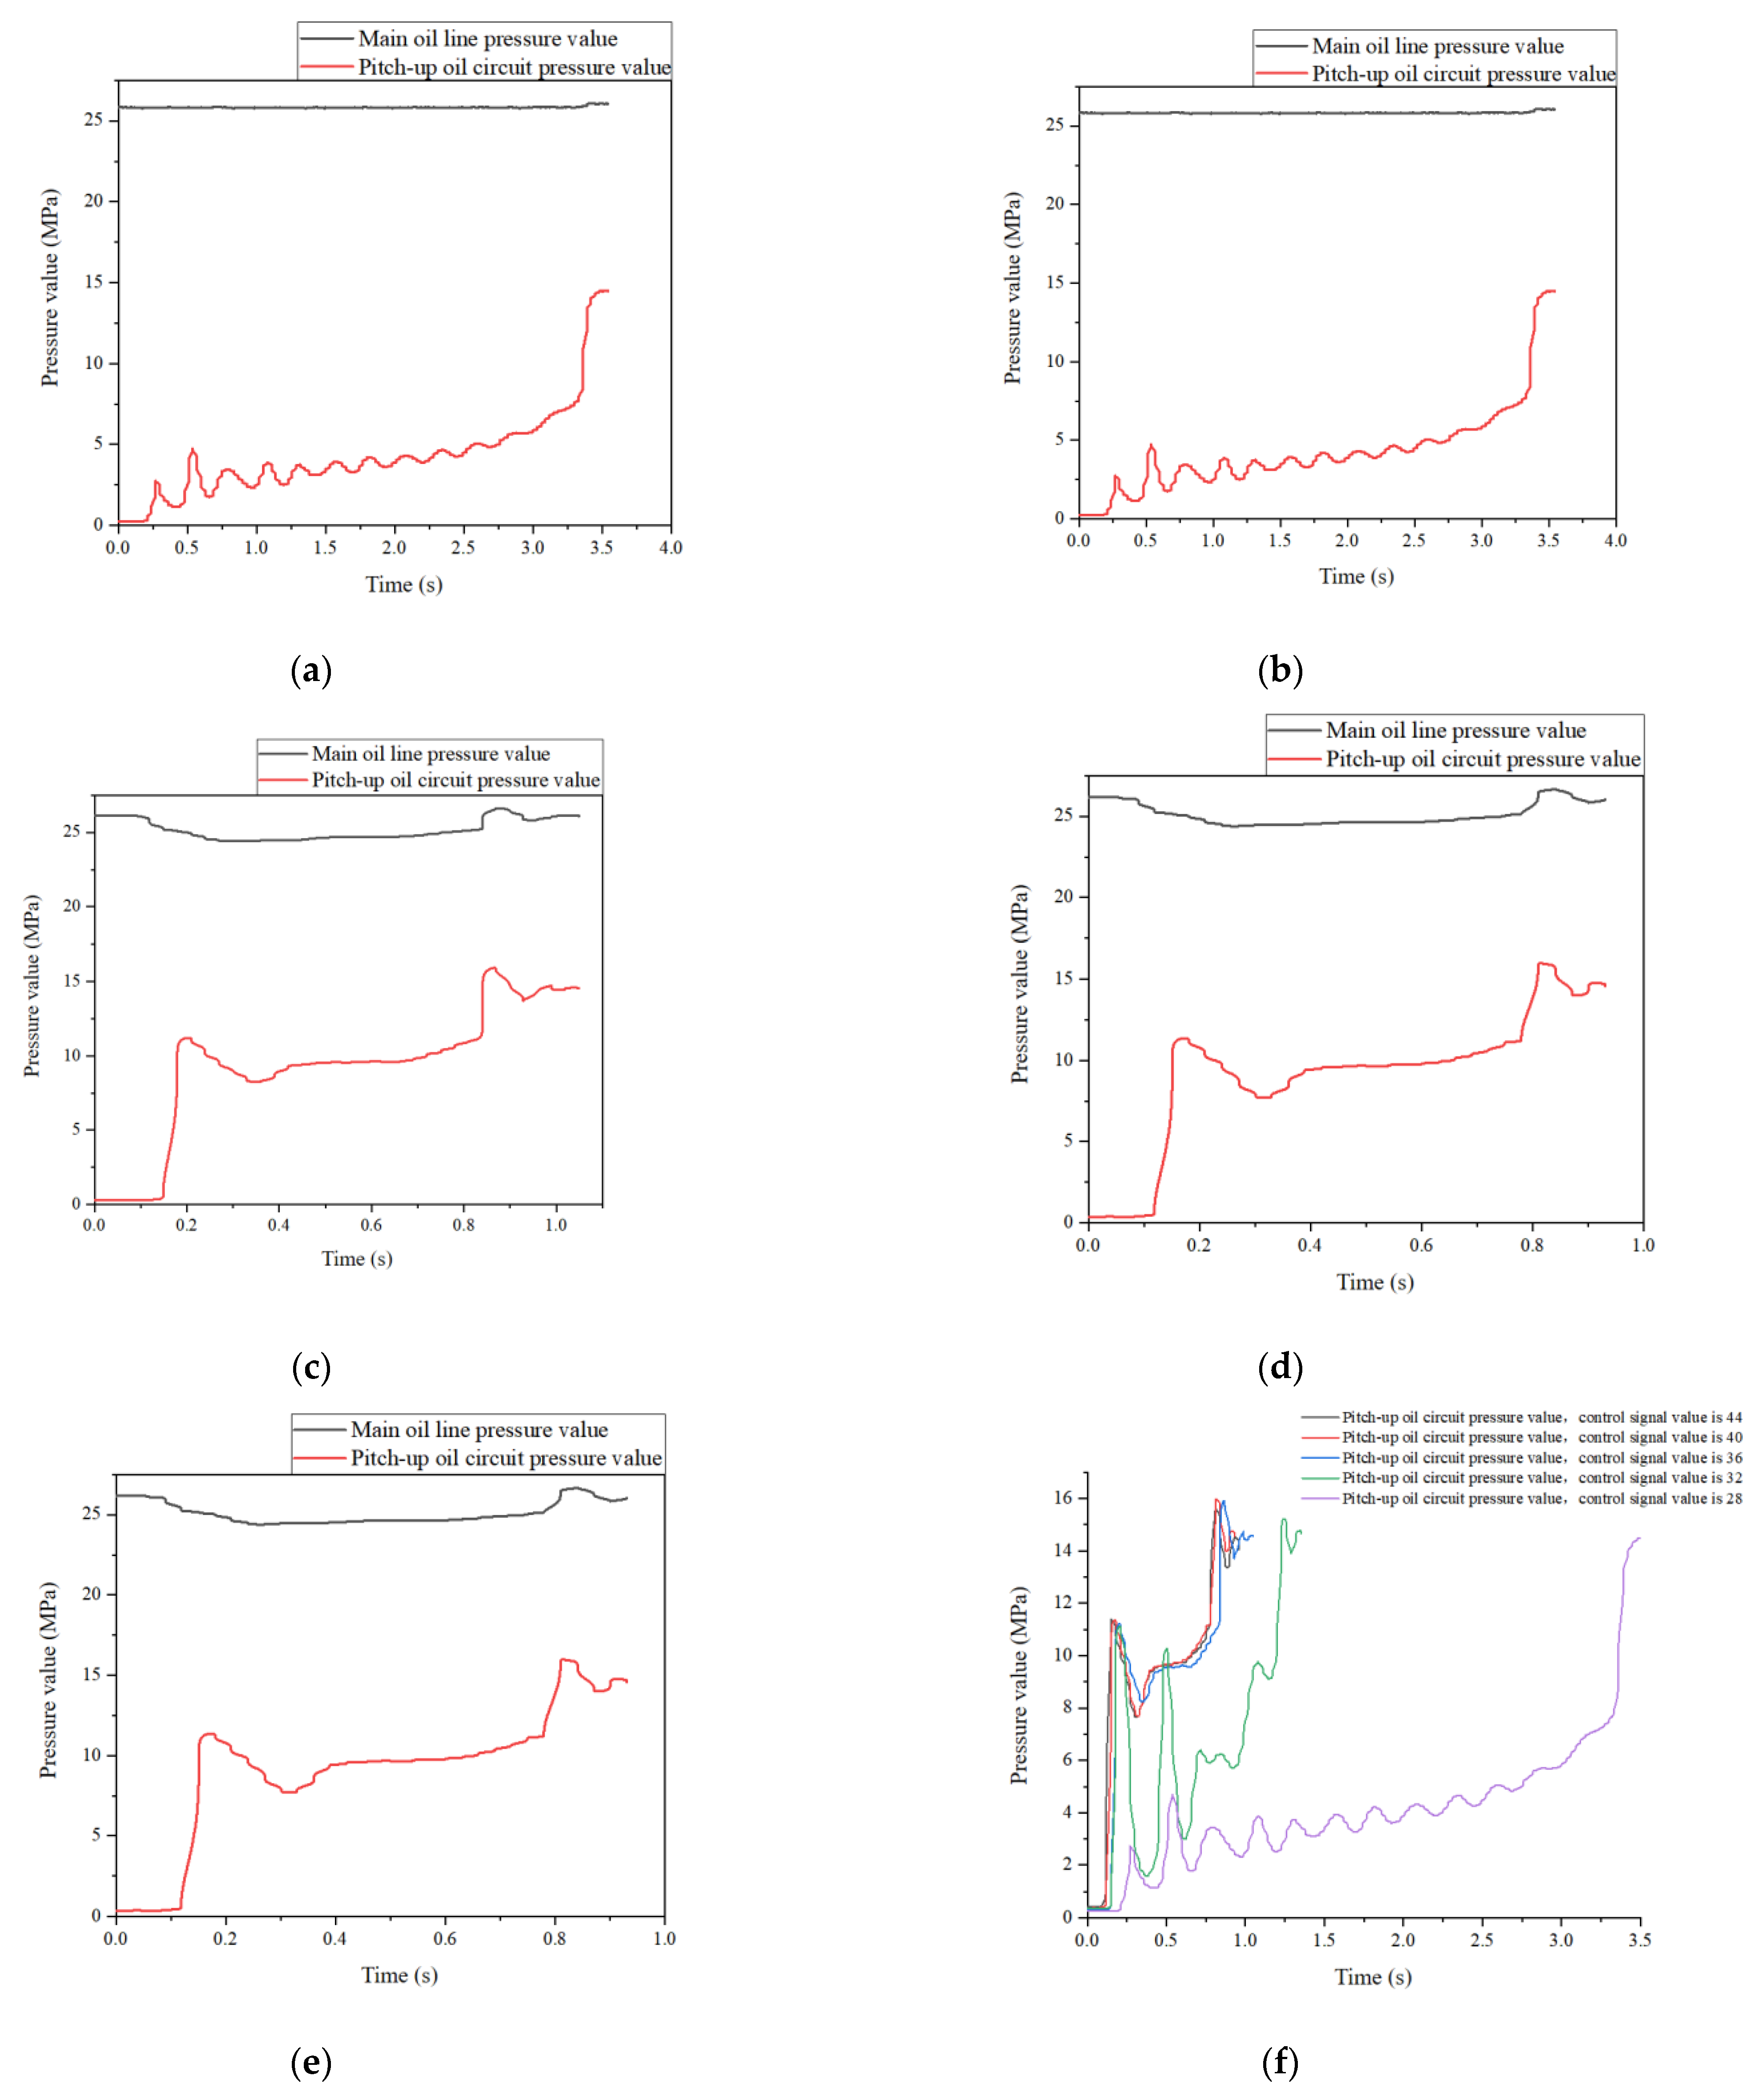
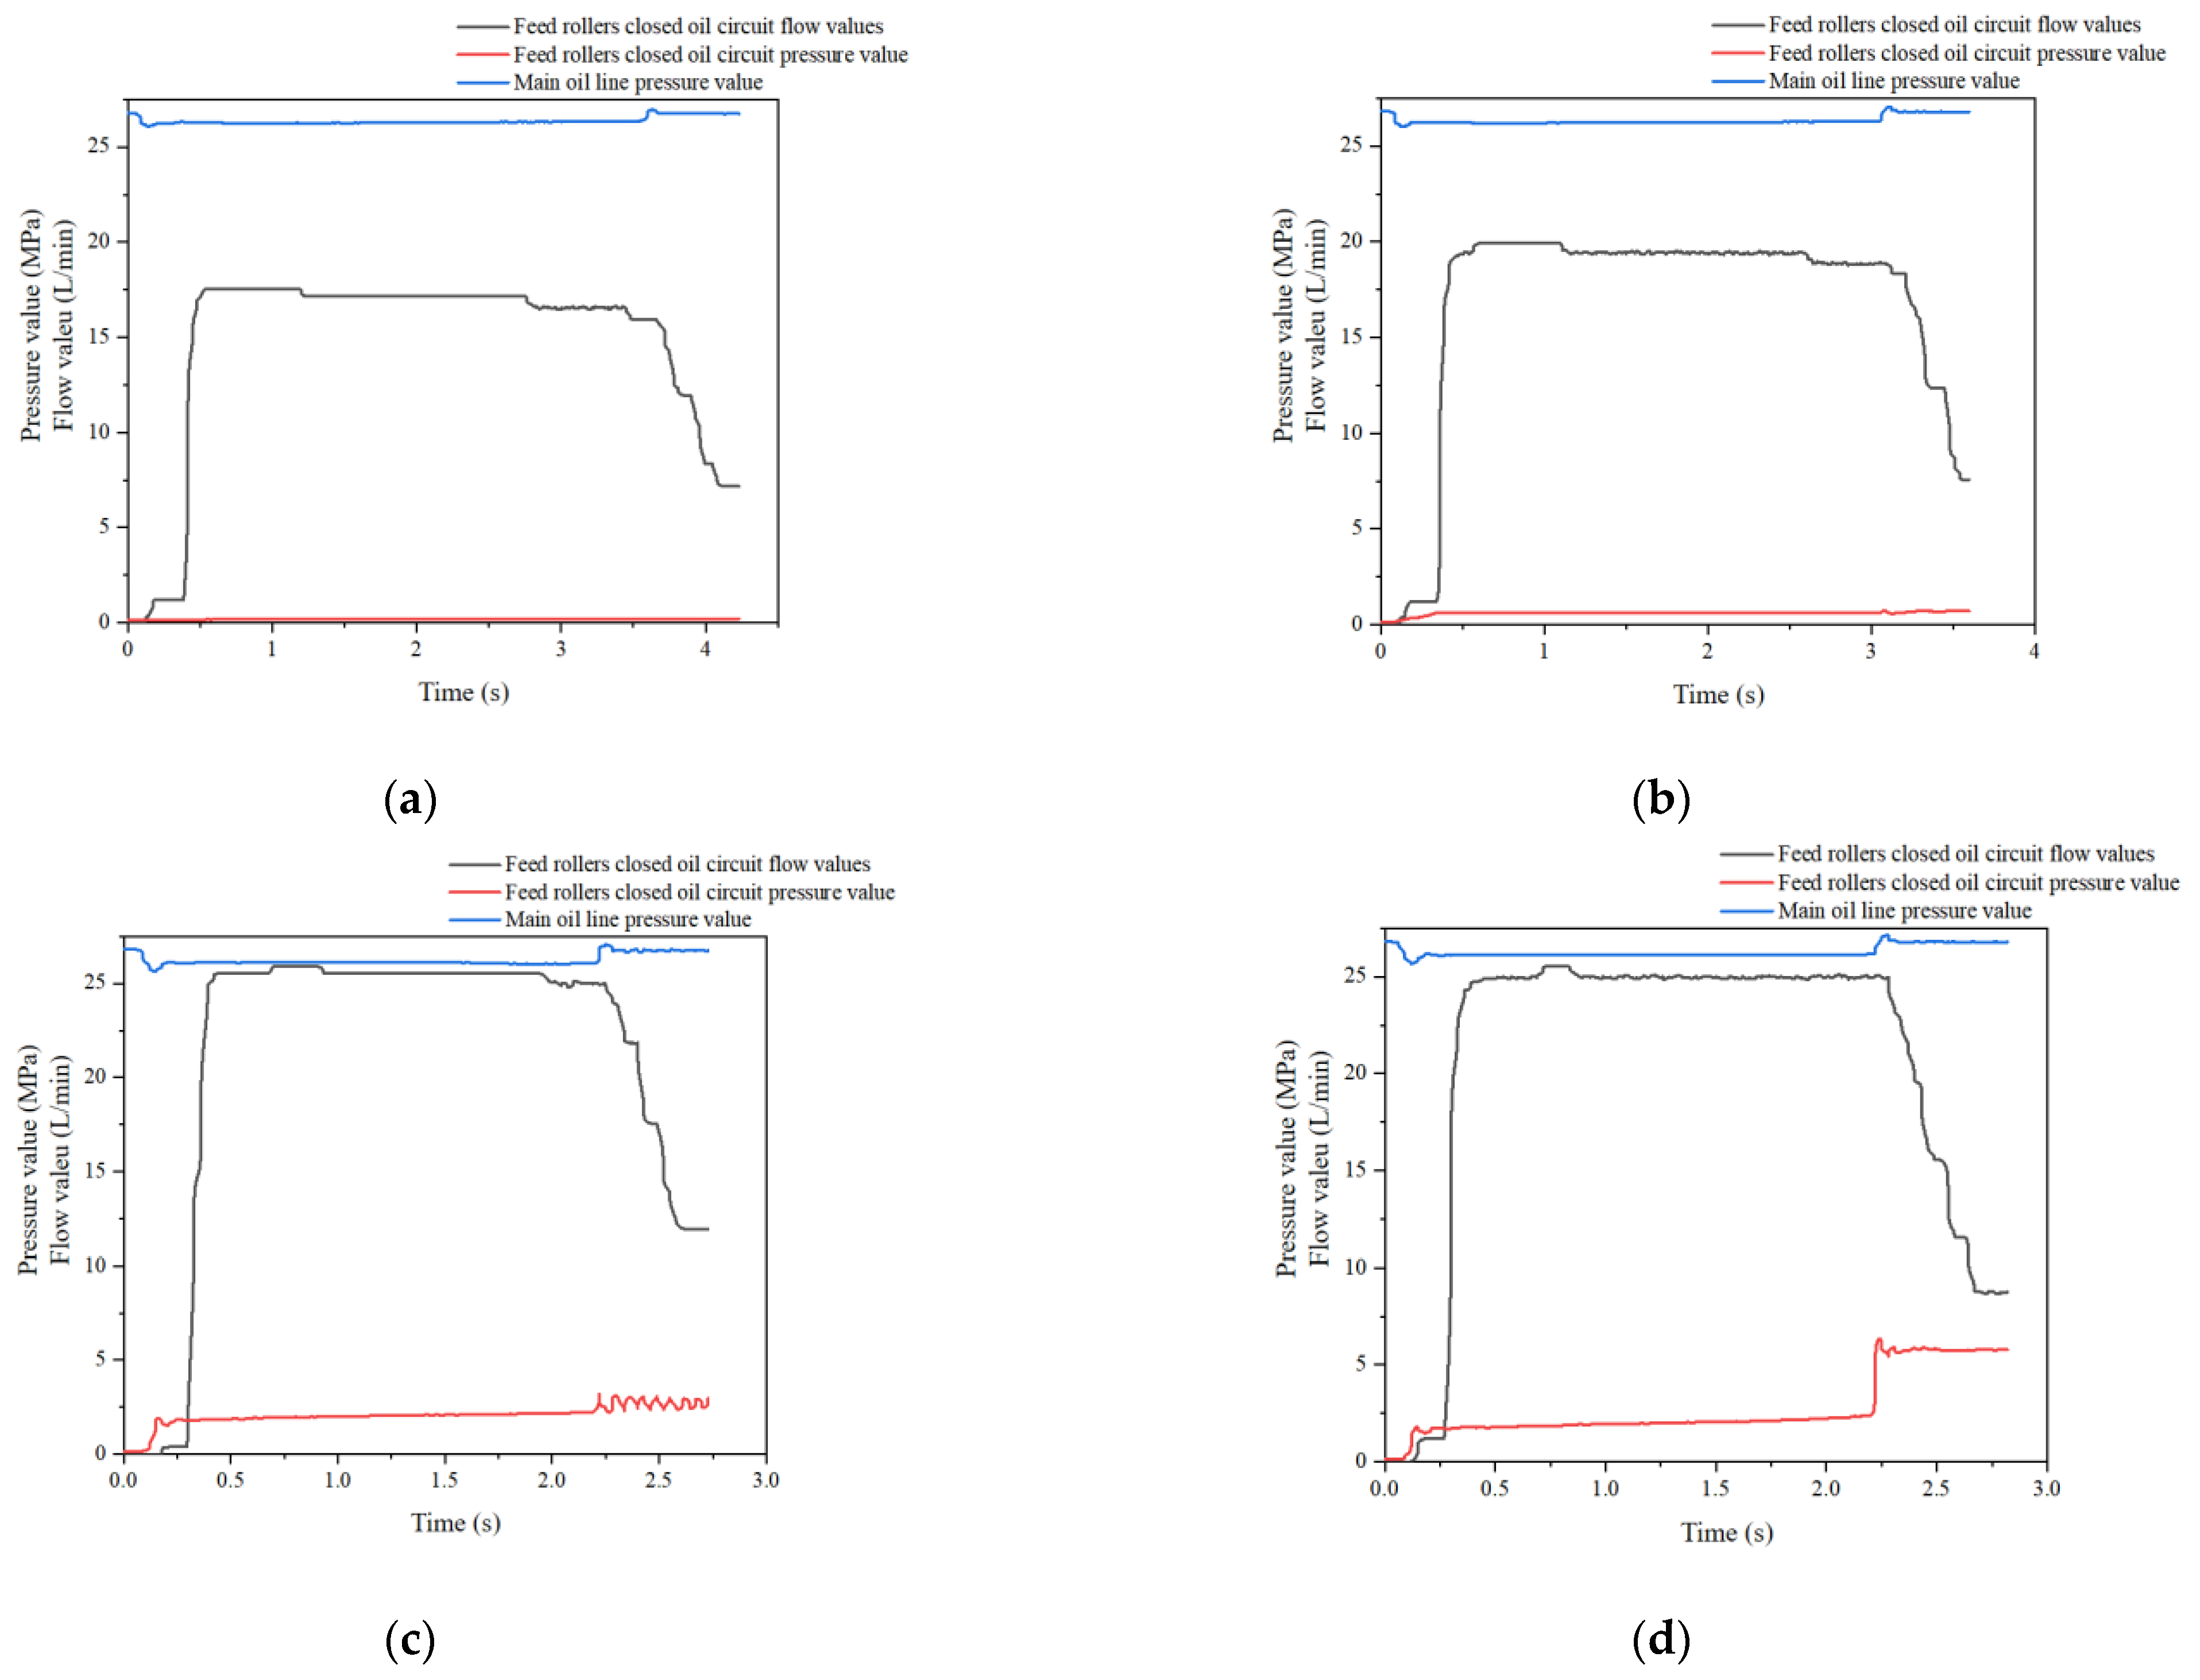
3.3. Data Acquisition Results

This section is used to show graphs derived from some of the data collected by the system during the test and to explain the information contained in the graphs.
Figure 17 shows the variation in the main oil circuit pressure and the elevation oil circuit pressure when the harvester executes the elevation action under different signal values. The vertical co-ordinate in the figure is the pressure in megapascals; the horizontal co-ordinate is the time in seconds, and in this paper, the moment when the elevation signal is sent to the CAN bus is taken as the 0 point of the horizontal co-ordinate. The sign that the valve plate of the elevation oil circuit has received the control signal is that the pressure of the main oil circuit begins to drop slowly; at this time, the head of the harvester is in the pitching down state, as shown in Figure 16 in Section 3.2. The elevation oil circuit uses a proportional solenoid valve; the smaller the value of the signal received by the valve plate, the smaller the degree of opening of the oil holes inside the valve plate, which is the reason why the elevation oil circuit pressure in Figure 17a is slow to rise. The pressure value fluctuation in Figure 17b is large, indicating that the execution of the elevation action is not smooth, and there is an obvious stutter. At the end of the data curve presented in Figure 17b–e, there is a small fluctuation in the elevation oil pressure, and the pressure value is around 15 MPa after the fluctuation ends, which is the sign of the completion of the elevation action. The larger the signal value, the faster the completion of the elevation movement; when the signal value is large to different extents, the completion times of the movement are very different, as shown in Figure 17f.
Figure 18 shows the harvester performing the feed roller cylinder closing action, where the hydraulic system main oil circuit pressure and feed roller cylinder closed oil circuit pressure flow change. The second set of data from Table 4 in Section 3.2 was chosen for the signal values. The feed roller cylinder closed oil circuit is equipped with an electronically controlled pressure adjustment valve, which is a proportional valve. The greater the value of the signal received by the pressure adjustment valve, the greater the pressure in the cylinder closed oil circuit. The purpose of this method for the harvester is to protect the timber from the teeth of the feed rollers. If the rollers use a high pressure to nip the trees during the harvesting operation, the roller teeth will go through the bark and leave teeth marks on the wood, resulting in a less economical harvesting operation. In Figure 18, the 0 point is shown in the horizontal co-ordinates, which also applies to Figure 17, and the vertical coordinates are the pressure and flow rate, for which the units are MPa and L/min. When the feed roller cylinder is ready to start the action, the pressure of the main oil circuit drops slightly, and the flow rate of the cylinder closed oil circuit rises slowly and then sharply. When the signal value of the pressure in the electronically controlled pressure adjustment valve is too low, it cannot intuitively feel the change; when the signal value is large enough, the pressure of the cylinder closed oil circuit follows the slow increase in the flow rate, as shown in Figure 18a–c. When the feed roller completes the closing action, the pressure inside the oil circuit rises suddenly, as shown in Figure 18d–f. While the feed roller remains closed, the electronically controlled pressure adjustment valve adjusts the pressure inside the oil circuit according to the size of the received signal value. If the current pressure value is appropriate, the pressure adjustment valve opens the oil hole to unload the hydraulic oil in the oil circuit, as shown in Figure 18a–f. If the current pressure value is not up to standard, the pressure adjustment valve keeps the oil hole closed until the pressure value reaches the pressure requirement, as shown in Figure 18g–i.

4. Conclusions

1. In this paper, the reliability and stability of the hydraulic online monitoring system is verified in the field test, from two aspects of data acquisition and system operation. In the hydraulic station test, the relative standard deviation between the pressure and flow output values and the measured values was within 2.1% and 0.6%, respectively. In the field test, the relative error between the theoretical and measured values of the main oil circuit pressure was 1.65% on average, and the maximum relative error was 2.75%. During the on-site test, the system was used for 4 h, and there were no phenomena such as equipment dropping, communication errors, and software lagging.
2. In the field test, the pressure and flow data in the hydraulic circuit of elevation were collected when the harvester executed the elevation action under different control signal values. The pressure and flow data in the hydraulic circuit of feed roller cylinder closing were collected when the harvester performed the feed roller cylinder closing action under different values of the pressure control signal. The reasons for the changes in the pressure and flow values were analyzed and explained, and the times for the completion of the action execution were compared. The results show that hydraulic data can be used to monitor the operation state of harvesters and reflect the execution of the action in real time. Furthermore, hydraulic data can provide data support for researchers to study more efficient and energy-saving control strategies and optimize and improve the mechanical structure of harvesters after integrating the control signals and other data.

Author Contributions

Conceptualization, H.Q., J.X., J.W. and J.L.; data curation, H.Q., J.X. and Y.M.; investigation, H.Q., J.X., J.W. and Y.M.; project administration, J.L., J.W. and Q.H.; resources H.Q., J.L., J.W. and Q.H.; software, H.Q., J.X. and J.W.; writing—original draft, H.Q.; writing—review and editing, H.Q., J.L., J.W. and Q.H. All authors have read and agreed to the published version of the manuscript.

Funding

The National Natural Science Foundation of China (NSFC) Top-level Project: “Research on Path Planning and Trajectory Tracking Control Methods for Unmanned Skidding Vehicles” (number 31670719).

Data Availability Statement

These data are available with some restrictions. Some of the data in this paper are being used in other studies, and the source code of the program is being modified and upgraded and is commercially confidential, but we will publish some of the data and what research has been conducted with them in subsequent work.

Conflicts of Interest

The authors declare no conflict of interest.

References

  1. Corona, P.; Chianucci, F.; Quatrini, V.; Civitarese, V.; Clementel, F.; Costa, C.; Floris, A.; Menesatti, P.; Puletti, N.; Sperandio, G.; et al. Precision forestry: Riferimenti concettuali, strumenti e prospettive di diffusione in Italia. Forest 2017, 14, 1–21. [Google Scholar] [CrossRef]
  2. Venanzi, R.; Latterini, F.; Civitarese, V.; Picchio, R. Recent Applications of Smart Technologies for Monitoring the Sustainability of Forest Operations. Forests 2023, 14, 1503. [Google Scholar] [CrossRef]
  3. Picchio, R.; Proto, A.R.; Civitarese, V.; Di Marzio, N.; Latterini, F. Recent Contributions of Some Fields of the Electronics in Development of Forest Operations Technologies. Electronics 2019, 8, 1465. [Google Scholar] [CrossRef]
  4. Wang, X.; Zheng, Y.; Lyu, L. Research on braking performance test bench for forestry vehicle based on LabVIEW. J. For. Eng. 2016, 1, 103–108. [Google Scholar]
  5. Bacescu, N.M.; Cadei, A.; Moskalik, T.; Wiśniewski, M.; Talbot, B.; Grigolato, S. Efficiency Assessment of Fully Mechanized Harvesting System through the Use of Fleet Management System. Sustainability 2022, 14, 16751. [Google Scholar] [CrossRef]
  6. Eriksson, M.; Lindroos, O. Productivity of harvesters and forwarders in CTL operations in northern Sweden based on large follow-up datasets. Int. J. For. Eng. 2014, 25, 179–200. [Google Scholar] [CrossRef]
  7. Ala-Ilomäki, J.; Salmivaara, A.; Launiainen, S.; Lindeman, H.; Kulju, S.; Finér, L.; Heikkonen, J.; Uusitalo, J. Assessing extraction trail trafficability using harvester CAN-bus data. Int. J. For. Eng. 2020, 31, 138–145. [Google Scholar] [CrossRef]
  8. Spencer, G.; Mateus, F.; Torres, P.; Dionísio, R.; Martins, R. Design of CAN Bus Communication Interfaces for Forestry Machines. Computers 2021, 10, 144. [Google Scholar] [CrossRef]
  9. Wempe, A.M.; Keefe, R.F.; Newman, S.M.; Paveglio, T.B. Intent to Adopt Location Sharing for Logging Safety Applications. Safety 2019, 5, 7. [Google Scholar] [CrossRef]
  10. Kaartinen, H.; Hyyppä, J.; Vastaranta, M.; Kukko, A.; Jaakkola, A.; Yu, X.; Pyörälä, J.; Liang, X.; Liu, J.; Wang, Y.; et al. Accuracy of Kinematic Positioning Using Global Satellite Navigation Systems under Forest Canopies. Forests 2015, 6, 3218–3236. [Google Scholar] [CrossRef]
  11. Spinelli, R.; Magagnotti, N.; Labelle, E.R. The Effect of New Silvicultural Trends on Mental Workload of Harvester Operators. Croat. J. For. Eng. 2021, 41, 177–190. [Google Scholar] [CrossRef]
  12. Visser, R.; Obi, O.F. Automation and Robotics in Forest Harvesting Operations. Croat. J. For. Eng. 2021, 42, 13–24. [Google Scholar] [CrossRef]
  13. Lindroos, O.; La Hera, P.; Häggström, G. Drivers of advances in mechanized timber harvesting—A selective review of technological innovation. Croat. J. For. Eng. 2017, 38, 243–258. [Google Scholar]
  14. Amer, M.A.; Rajan, P.; Mehanny, S.; Artyszak, A.; Ahmed, M.A.A. Innovative Design of an Experimental Jasmine Flower Automated Picker System Using Vertical Gripper and YOLOv5. Agriculture 2023, 13, 1595. [Google Scholar] [CrossRef]
  15. Zhang, X.; Zhou, Y.; Liu, L.; Zhang, B.; Shi, Z.; Guo, Y. Machine tool spindle vibration monitoring system based on Bluetooth wireless network and LabVIEW. Ferroelectrics 2023, 609, 137–147. [Google Scholar] [CrossRef]
  16. Deere, J. Smooth Boom Control/Intelligent Boom Control. Available online: https://www.deere.com/en/technology-products/forestry-and-logging-technology/operator-assistance-technology/index (accessed on 9 October 2023).
  17. Yuewei, M.; Jinhao, L. Forest harvester operation information collection system based on cloud platform. J. For. Eng. 2023, 8, 151–158. [Google Scholar]
Figure 1. System structure schematic diagram. The bold text in the figure indicates the core hardware devices of the system.
Forests 14 02100 g001
Figure 2. Hardware installation diagram of the system.
Forests 14 02100 g002
Figure 3. Flowchart of the lower computer program.
Forests 14 02100 g003
Figure 4. CANopen initialization program for the lower computer.
Forests 14 02100 g004
Figure 5. CANopen initialization program for the lower computer.
Forests 14 02100 g005
Figure 6. Defining the operating mode of the AI signal acquisition channel: 0 for high-impedance voltage input, and 1 for low-impedance current input.
Forests 14 02100 g006
Figure 7. Storing data in a register address and defining the data type.
Forests 14 02100 g007
Figure 8. Flowchart of the upper computer program.
Forests 14 02100 g008
Figure 9. Program front panel hydraulic data display interface.
Forests 14 02100 g009
Figure 10. Program front panel harvester operation data display interface.
Forests 14 02100 g010
Figure 11. CANOPEN VI internal function calling program.
Forests 14 02100 g011
Figure 12. CAN analyzer initialization program: (a) initialization succeeded; (b) initialization failed.
Forests 14 02100 g012
Figure 13. Program for receiving and processing CAN data.
Forests 14 02100 g013
Figure 14. Architecture of the data retention program.
Forests 14 02100 g014
Figure 15. Experimental site.
Forests 14 02100 g015
Figure 16. Harvester used in practical tests.
Forests 14 02100 g016
Figure 17. Changes in tilt-up operation pressure and changes in main circuit pressure: change in main oil circuit pressure and pitch-up oil circuit pressure during elevation movement with a (a) control signal value of 28; (b) control signal value of 32; (c) control signal value of 36; (d) control signal value of 40; and (e) control signal value of 44. (f) Time to complete the elevation motion for different opening values.
Forests 14 02100 g017
Figure 18. When the harvester performs the feed roller closing action, the main oil circuit pressure and the feed roller closing oil circuit pressure and flow change: (a) pressure-regulating valve signal value of 0; (b) pressure-regulating valve signal value of 10; (c) pressure-regulating valve signal value of 20; (d) pressure-regulating valve signal value of 30; (e) pressure-regulating valve signal value of 40; (f) pressure-regulating valve signal value of 50; (g) pressure-regulating valve signal value of 60; (h) pressure-regulating valve signal value of 70; (i) pressure-regulating valve signal value of 80.
Forests 14 02100 g018aForests 14 02100 g018b
Table 1. Pressure test data.
Data Name/Data GroupGroup IGroup IIGroup IIIGroup IVGroup VGroup VI
Output value of hydraulic station (MPa)5810121520
System measured values (MPa)4.98.210.112.114.820.2
5.189.911.914.920.3
5.0 8.19.811.815.119.8
5.17.910.112.114.720.1
5.0 810.212.0 15.0 19.9
4.87.99.9 12.315.120.1
4.98.110.111.914.919.8
5.0 89.912.115.220.3
4.98.210.0 11.814.919.9
5.18.19.712.215.120.2
Average value (MPa)4.988.059.9712.0214.9720.06
Standard deviation (MPa)0.10330.10800.15670.16870.15670.1955
Relative standard deviation (%)2.071.341.571.401.050.97
Table 2. Flow test data.
Data Name/Data GroupGroup IGroup IIGroup IIIGroup IVGroup VGroup VI
Output value of hydraulic station (L/min)80100120150180200
System measured values (L/min)80.2101.2119.7148.7181.4201.2
80.5100.8120.6149.5180.7200.5
80.1101.1120.3149.4181.1201.7
80.399.8121.2150.2181.9200.3
79.9100.4120.9150.6180.3199.7
79.7100.1120.1150.1179.6198.9
80.199.6120.5149.9179.8200.6
79.8100.9119.8150.8180.6200.9
80.3100.6119.8151.2180.2199.6
79.6100.3121.1151.5179.8201.2
Average value (L/min)80.05100.48120.4150.19180.54200.46
Standard deviation (L/min)0.29150.53910.55170.86210.75160.8579
Relative standard deviation (%)0.36%0.54%0.46%0.57%0.42%0.43%
Table 3. Signal values used for the action.
Data Name/Harvesting OperationHarvester Pitch UpOpen Up the LoppersFeed Roller Opening
Control signal value * (%)283232
323535
363838
404040
444545
* In the harvester control program, the control signal value range is 0–32,767. The reason why this paper uses 0–100 instead of 0–32,767 is to more intuitively react to the size of the signal value, and to make it easy for readers to understand. Take 28 as an example; the control signal value corresponding to 28 is 32,767 × 0.28.
Table 4. Signal values used for the closing action of the pruning knife and the closing action of the feed roll cylinder.
Data Name/Data GroupGroup IGroup IIGroup IIIGroup IVGroup V
Control signal value (%)3235384045
Pressure control valve signal value (%)00000
1010101010
2020202020
3030303030
4040404040
5050505050
6060606060
7070707070
8080808080
Table 5. Manually measured and systematically collected values.
Manually Measured Pressure Value (MPa)System Acquisition Pressure Value (MPa)Theoretical Value of Main Oil Circuit Pressure (MPa)Relative Error between Manually Measured Value and Theoretical ValueRelative Error between System Acquisition Value and Theoretical Value
27.426.225.57.45%2.75%
29.125.814.12%1.18%
27.126.16.27%2.35%
28.525.811.76%1.18%
26.825.65.10%0.39%
27.125.96.27%1.57%
29.426.015.29%1.96%
26.725.74.71%0.78%
28.126.210.20%2.75%
26.825.95.10%1.57%
Disclaimer/Publisher’s Note: The statements, opinions and data contained in all publications are solely those of the individual author(s) and contributor(s) and not of MDPI and/or the editor(s). MDPI and/or the editor(s) disclaim responsibility for any injury to people or property resulting from any ideas, methods, instructions or products referred to in the content.

