
Patterns of Water Consumption in Longleaf Pine Restoration Areas and the Relationship with Cone Production


Abstract
:1. Introduction
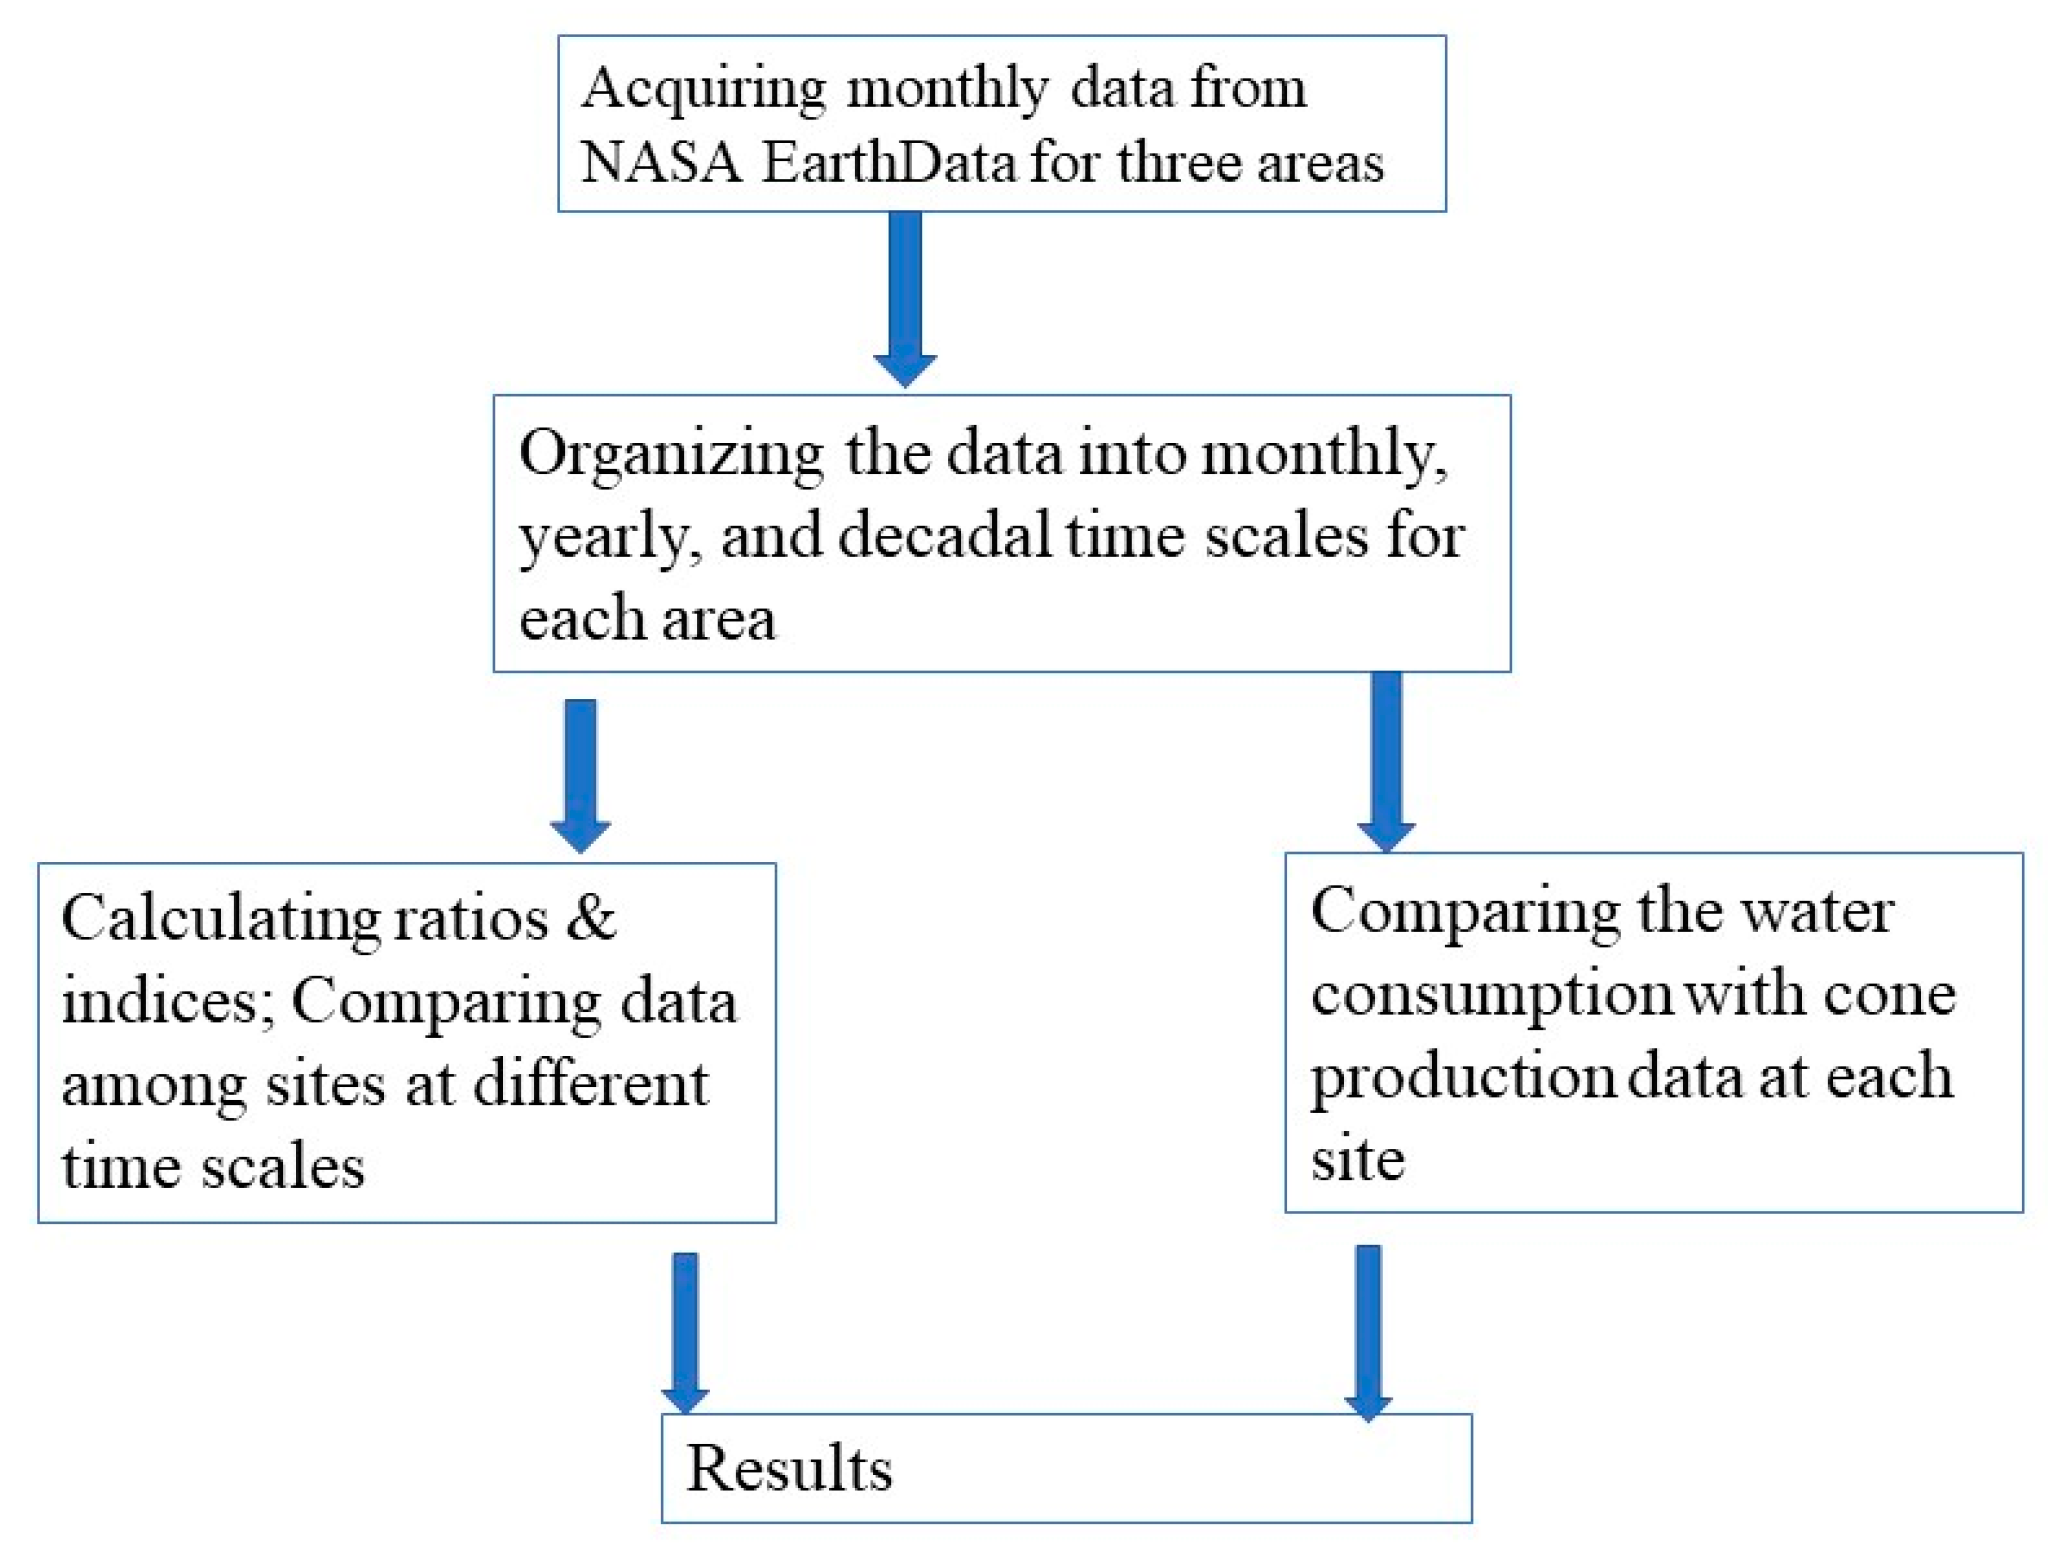
2. Materials and Methods
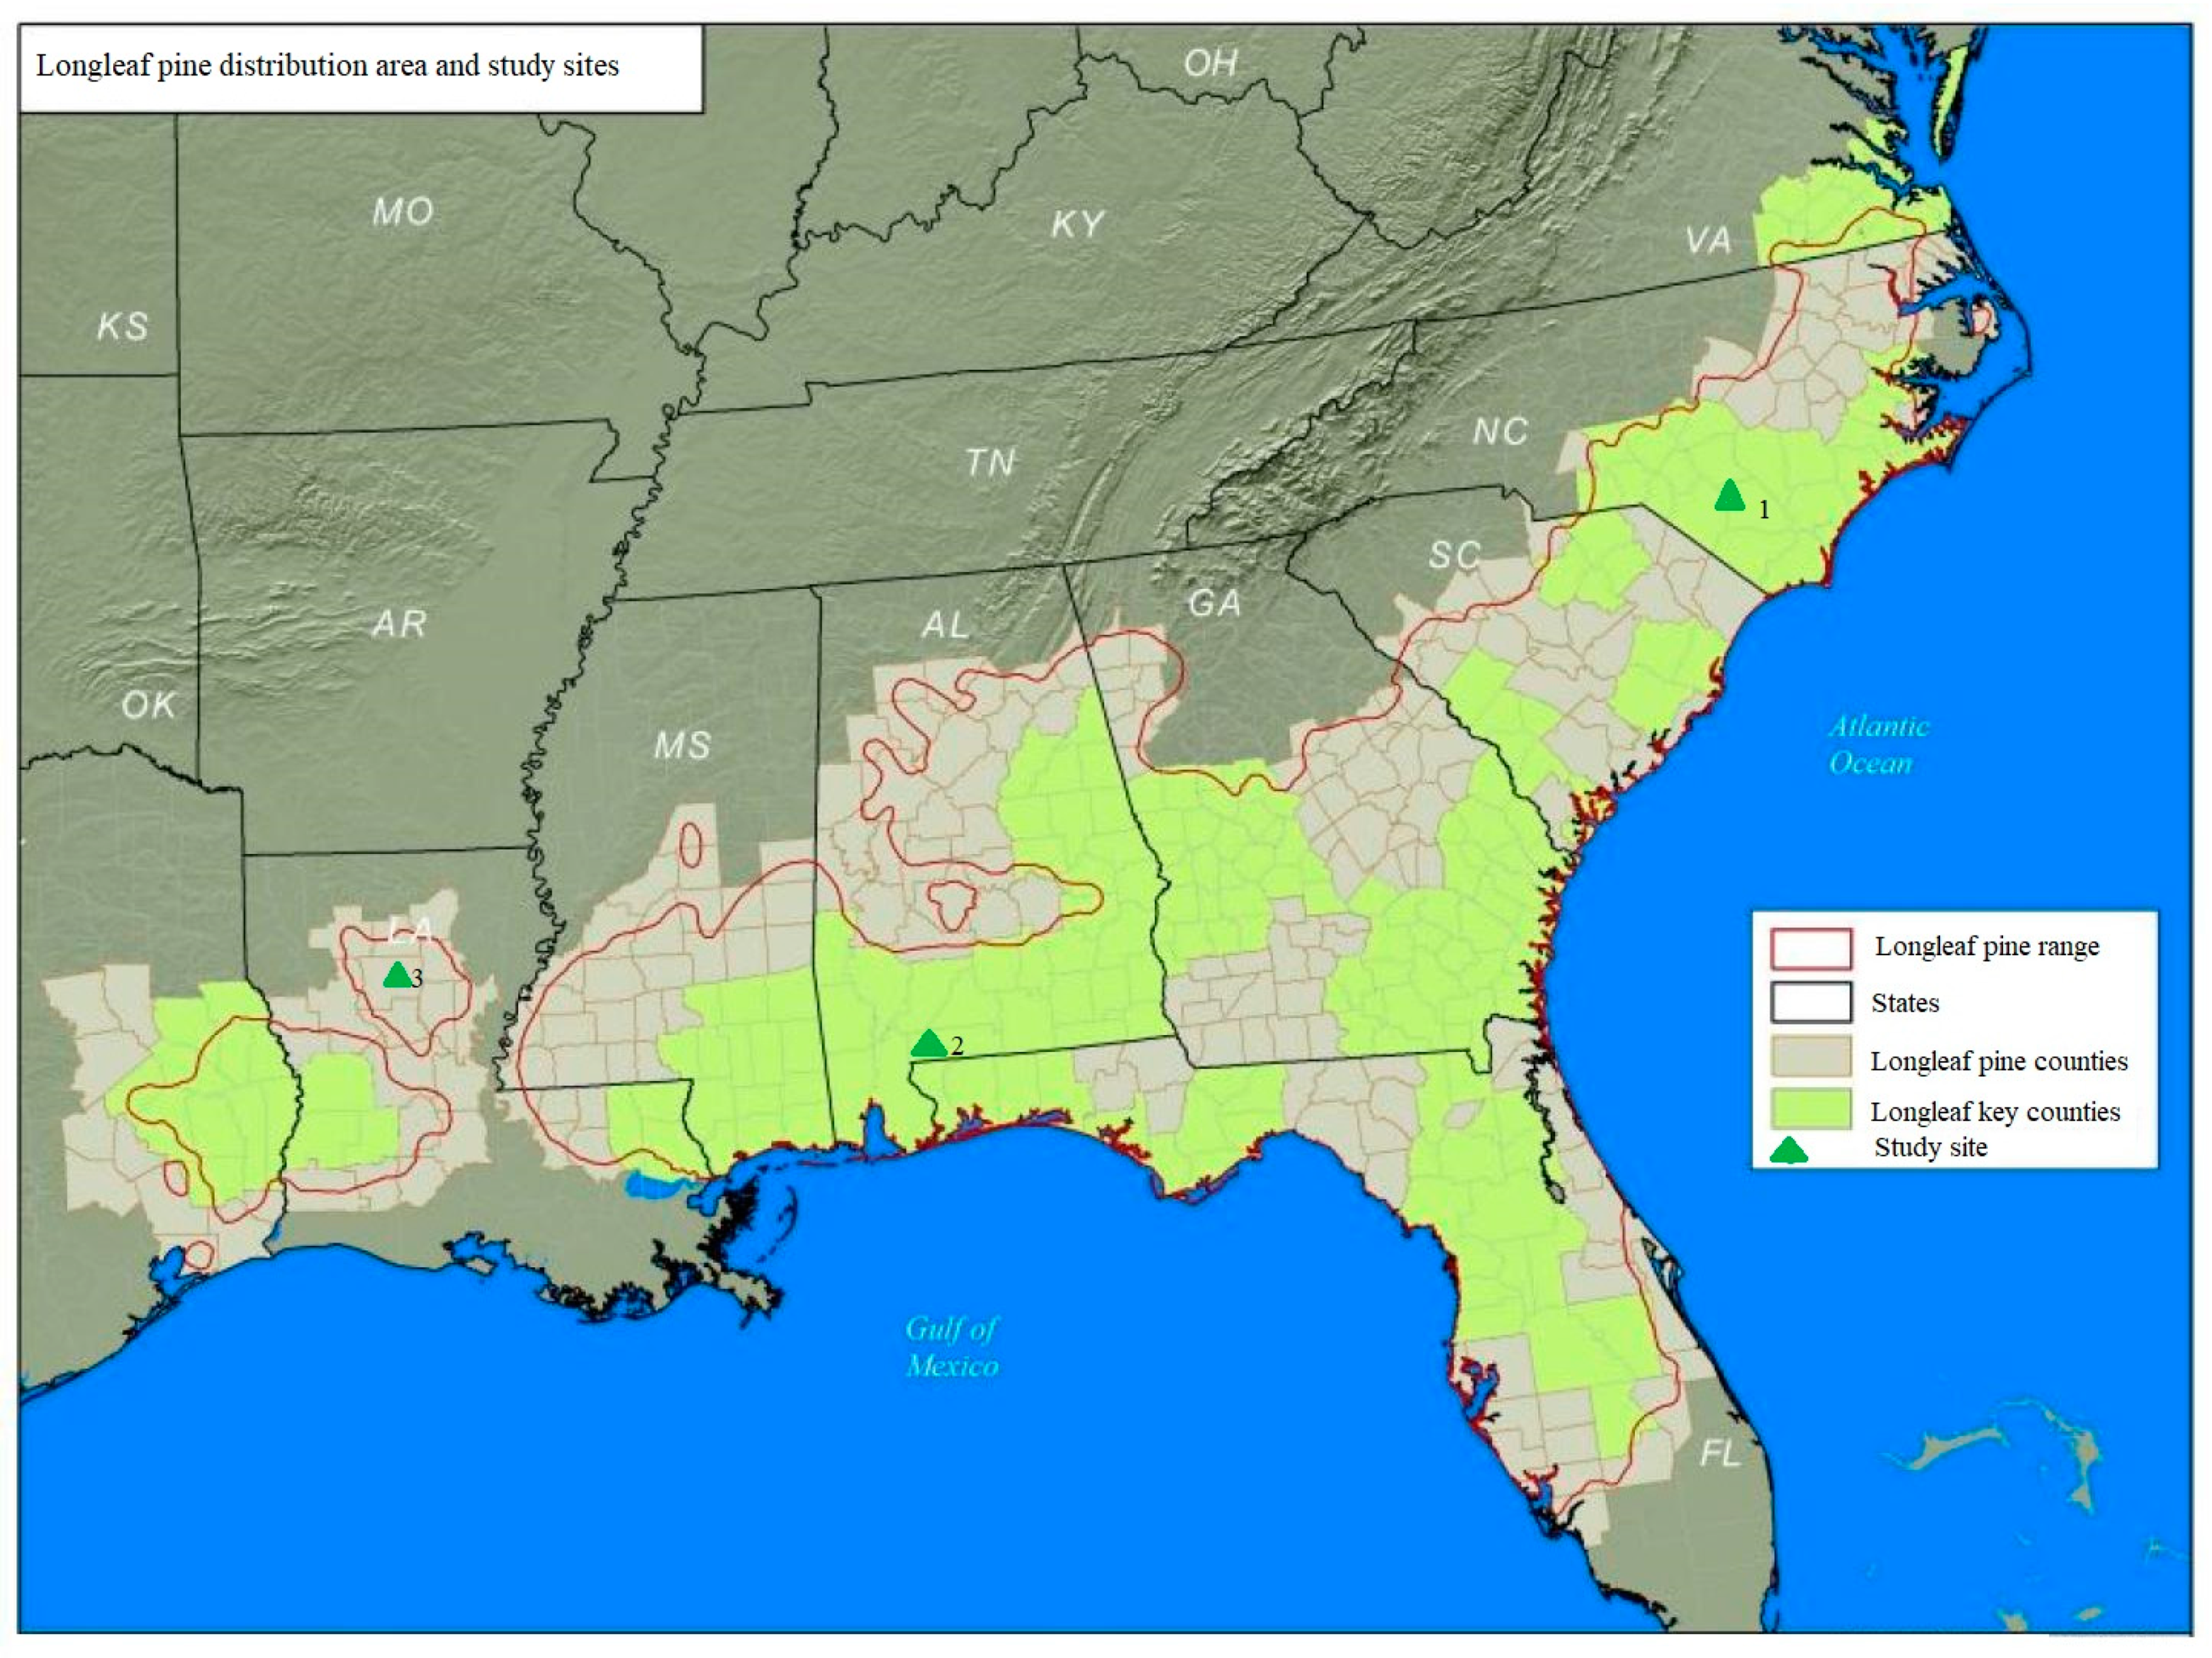
2.1. Study Areas
2.2. Water Consumption and Related Data
2.3. Regimes of Water Consumption
2.4. Statistical Analysis
3. Results
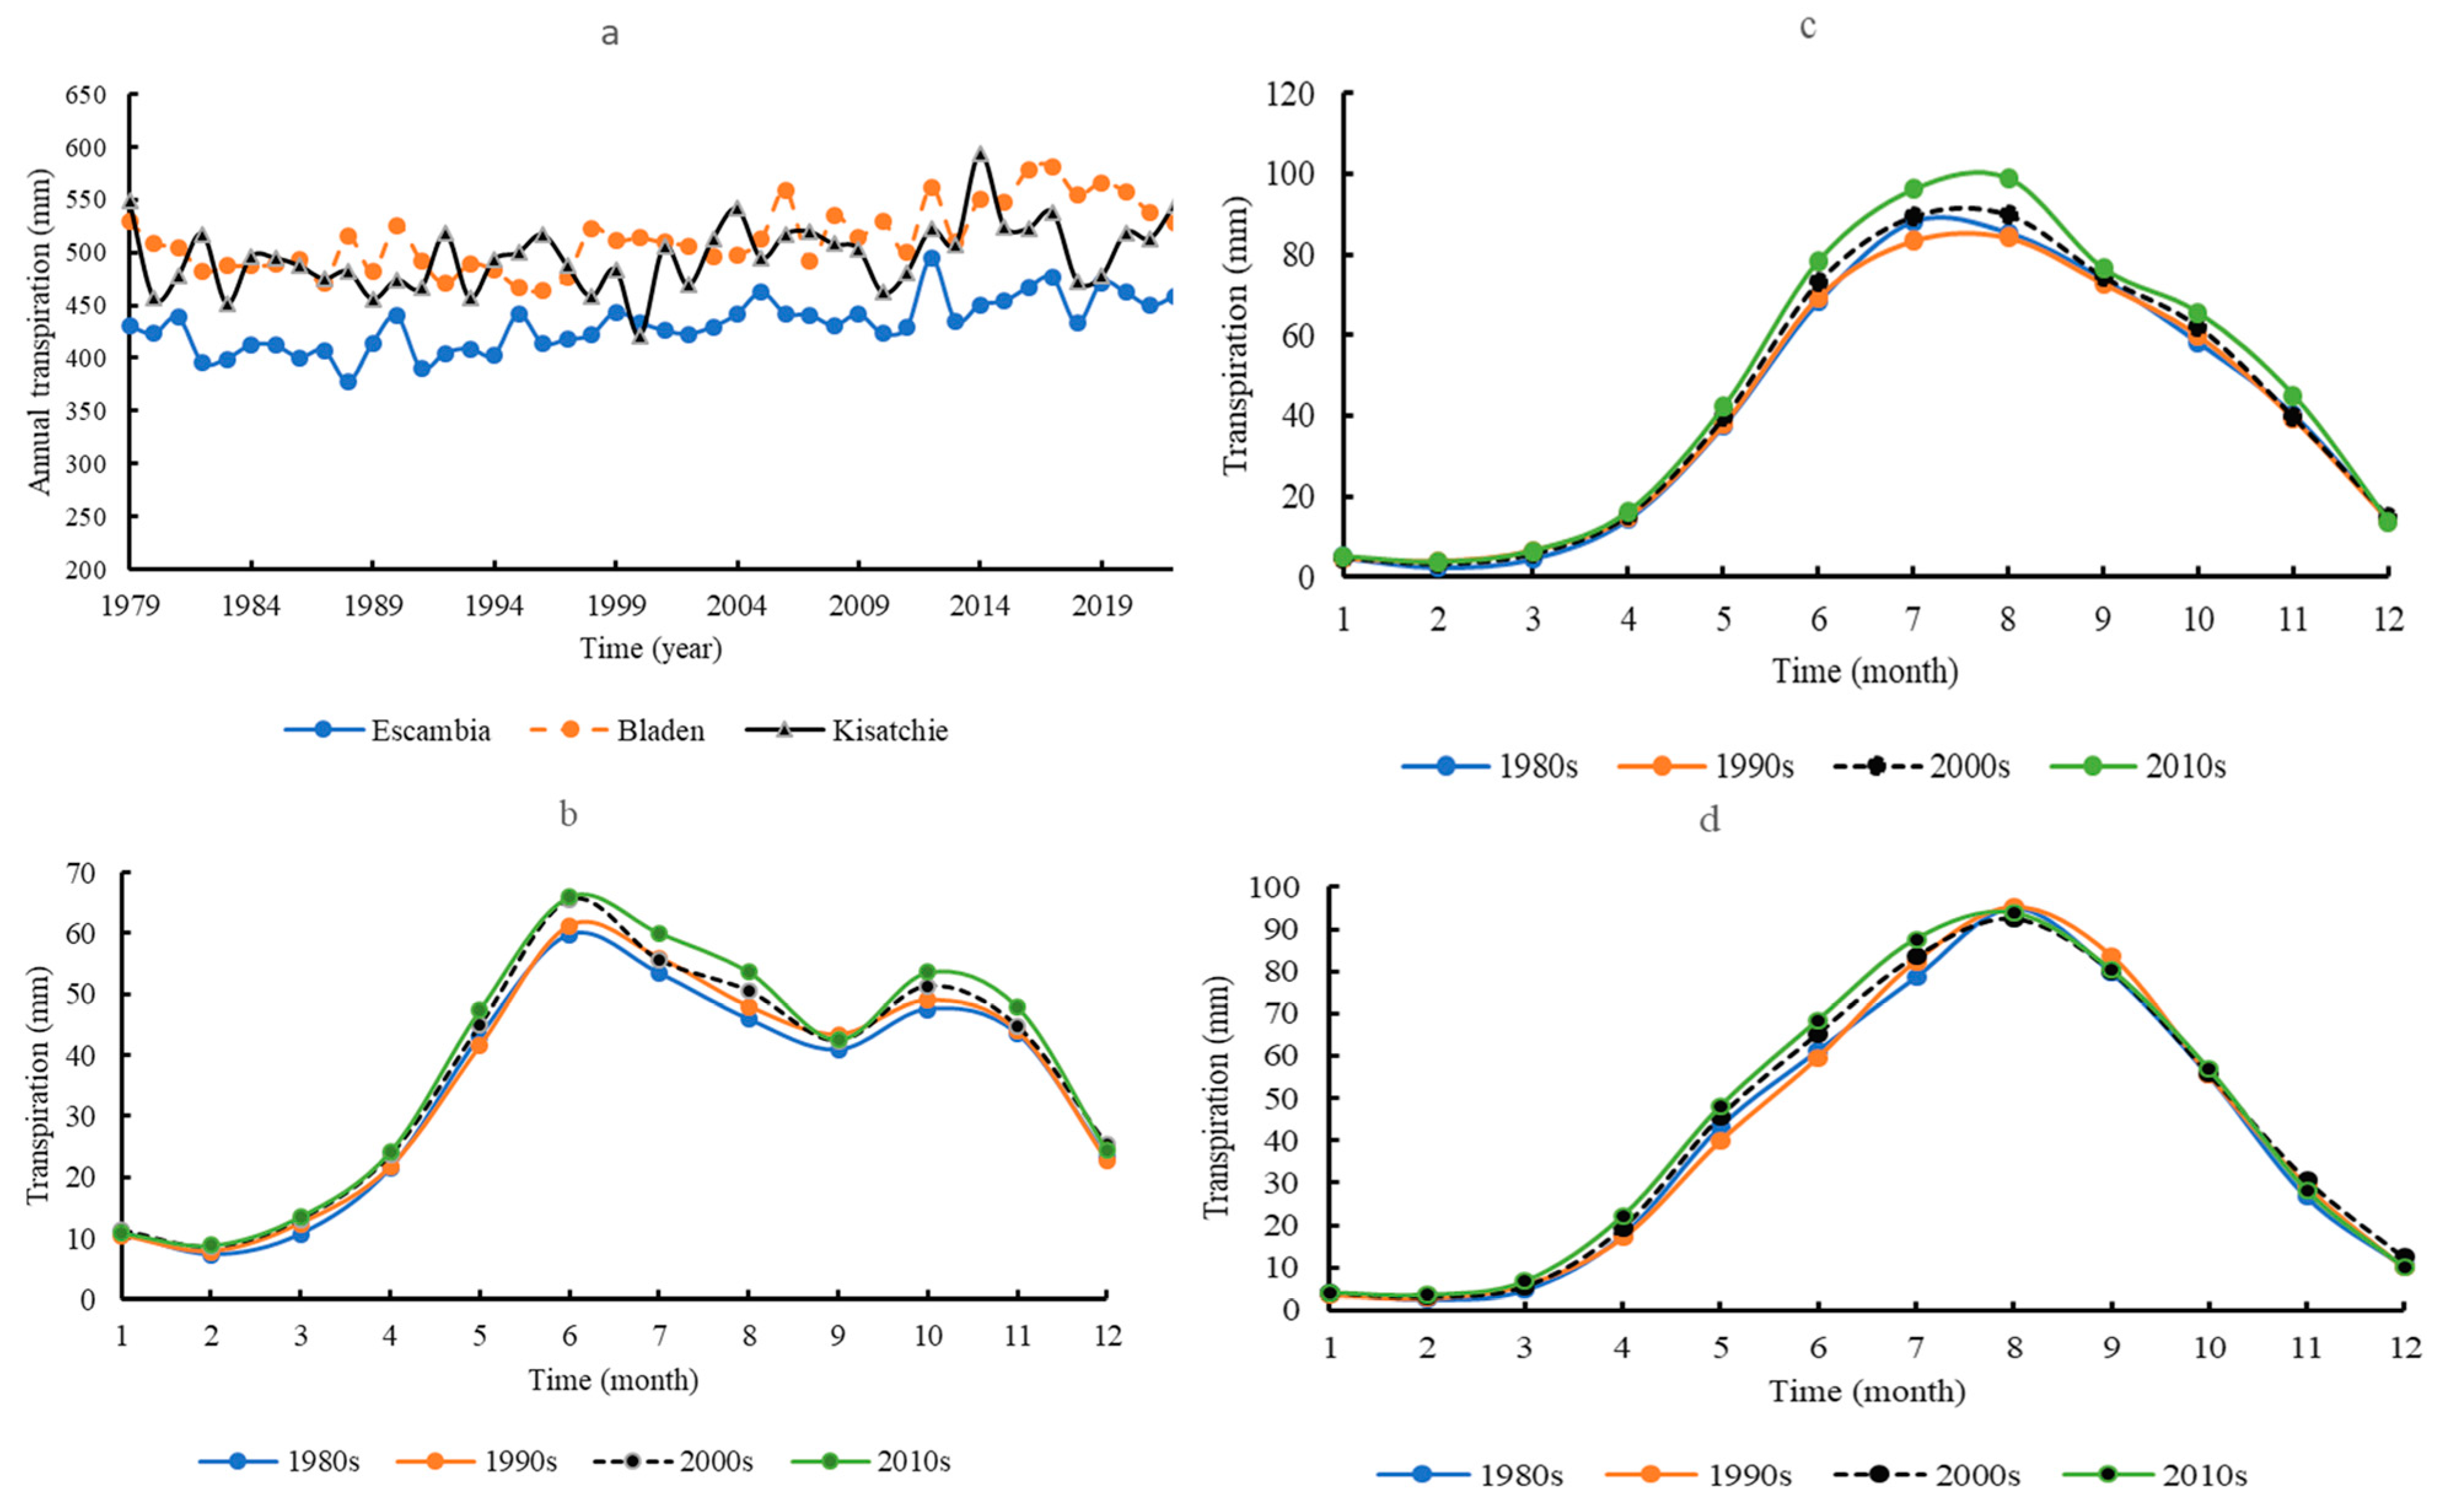
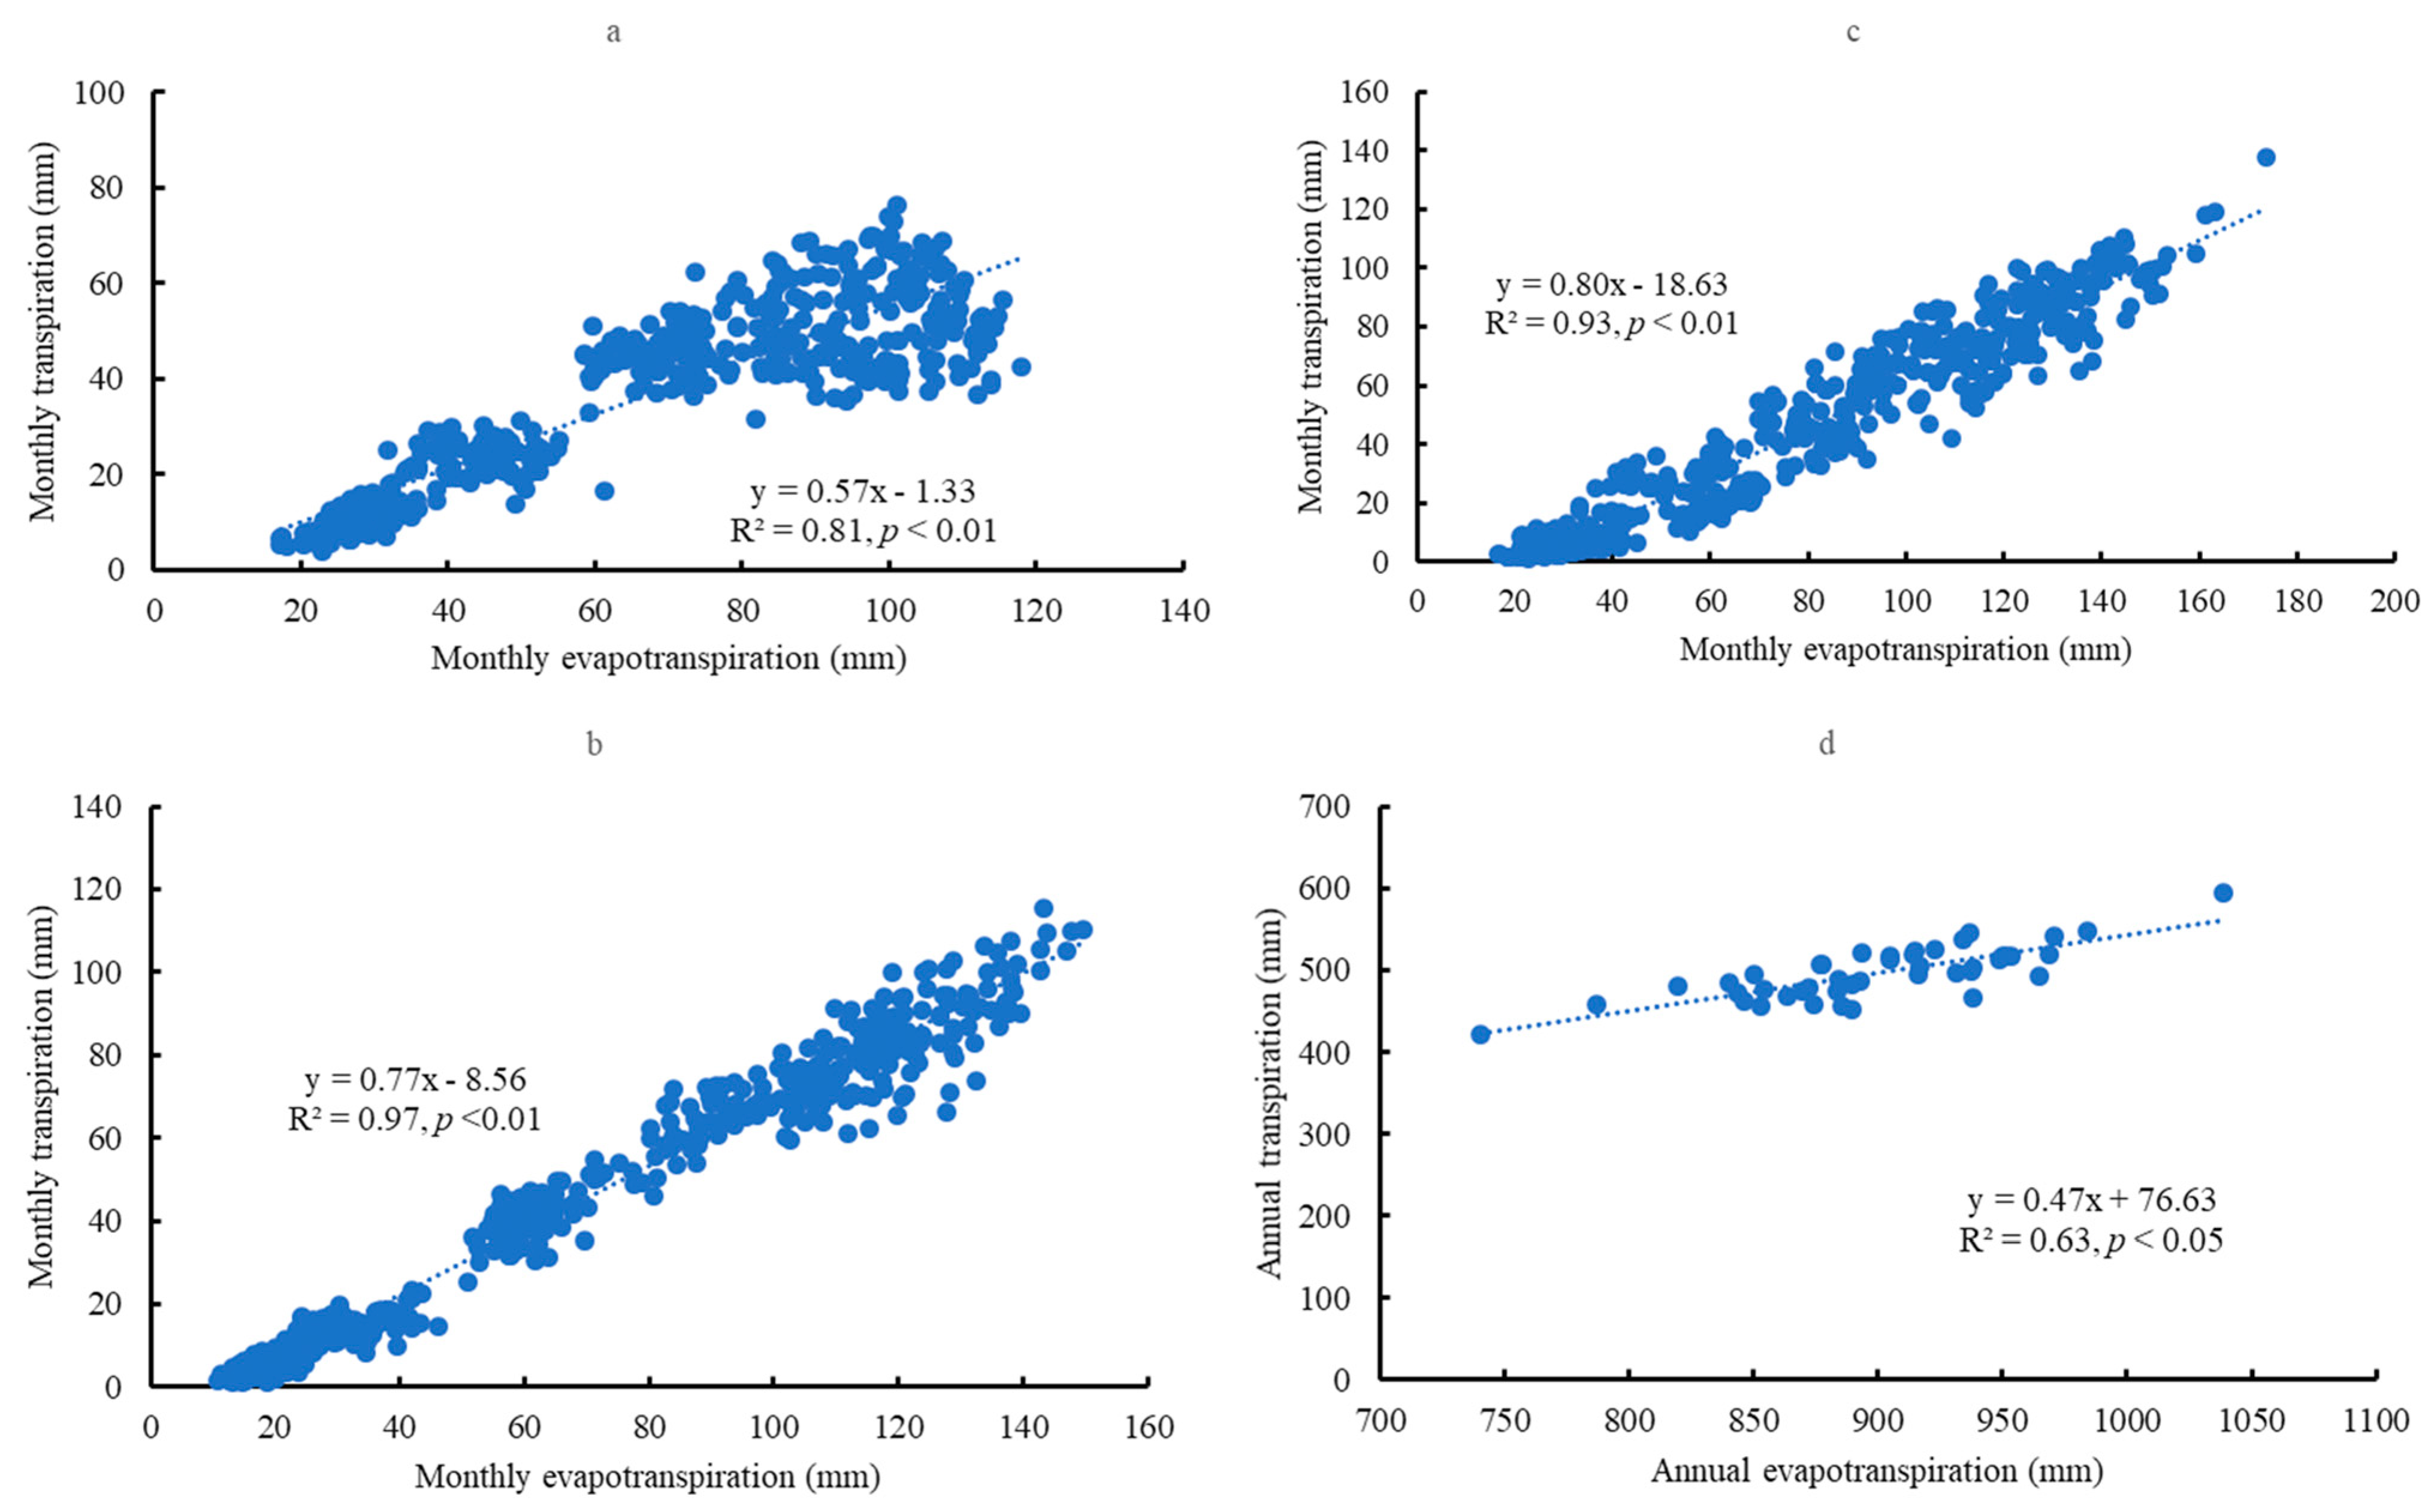
3.1. Transpiration
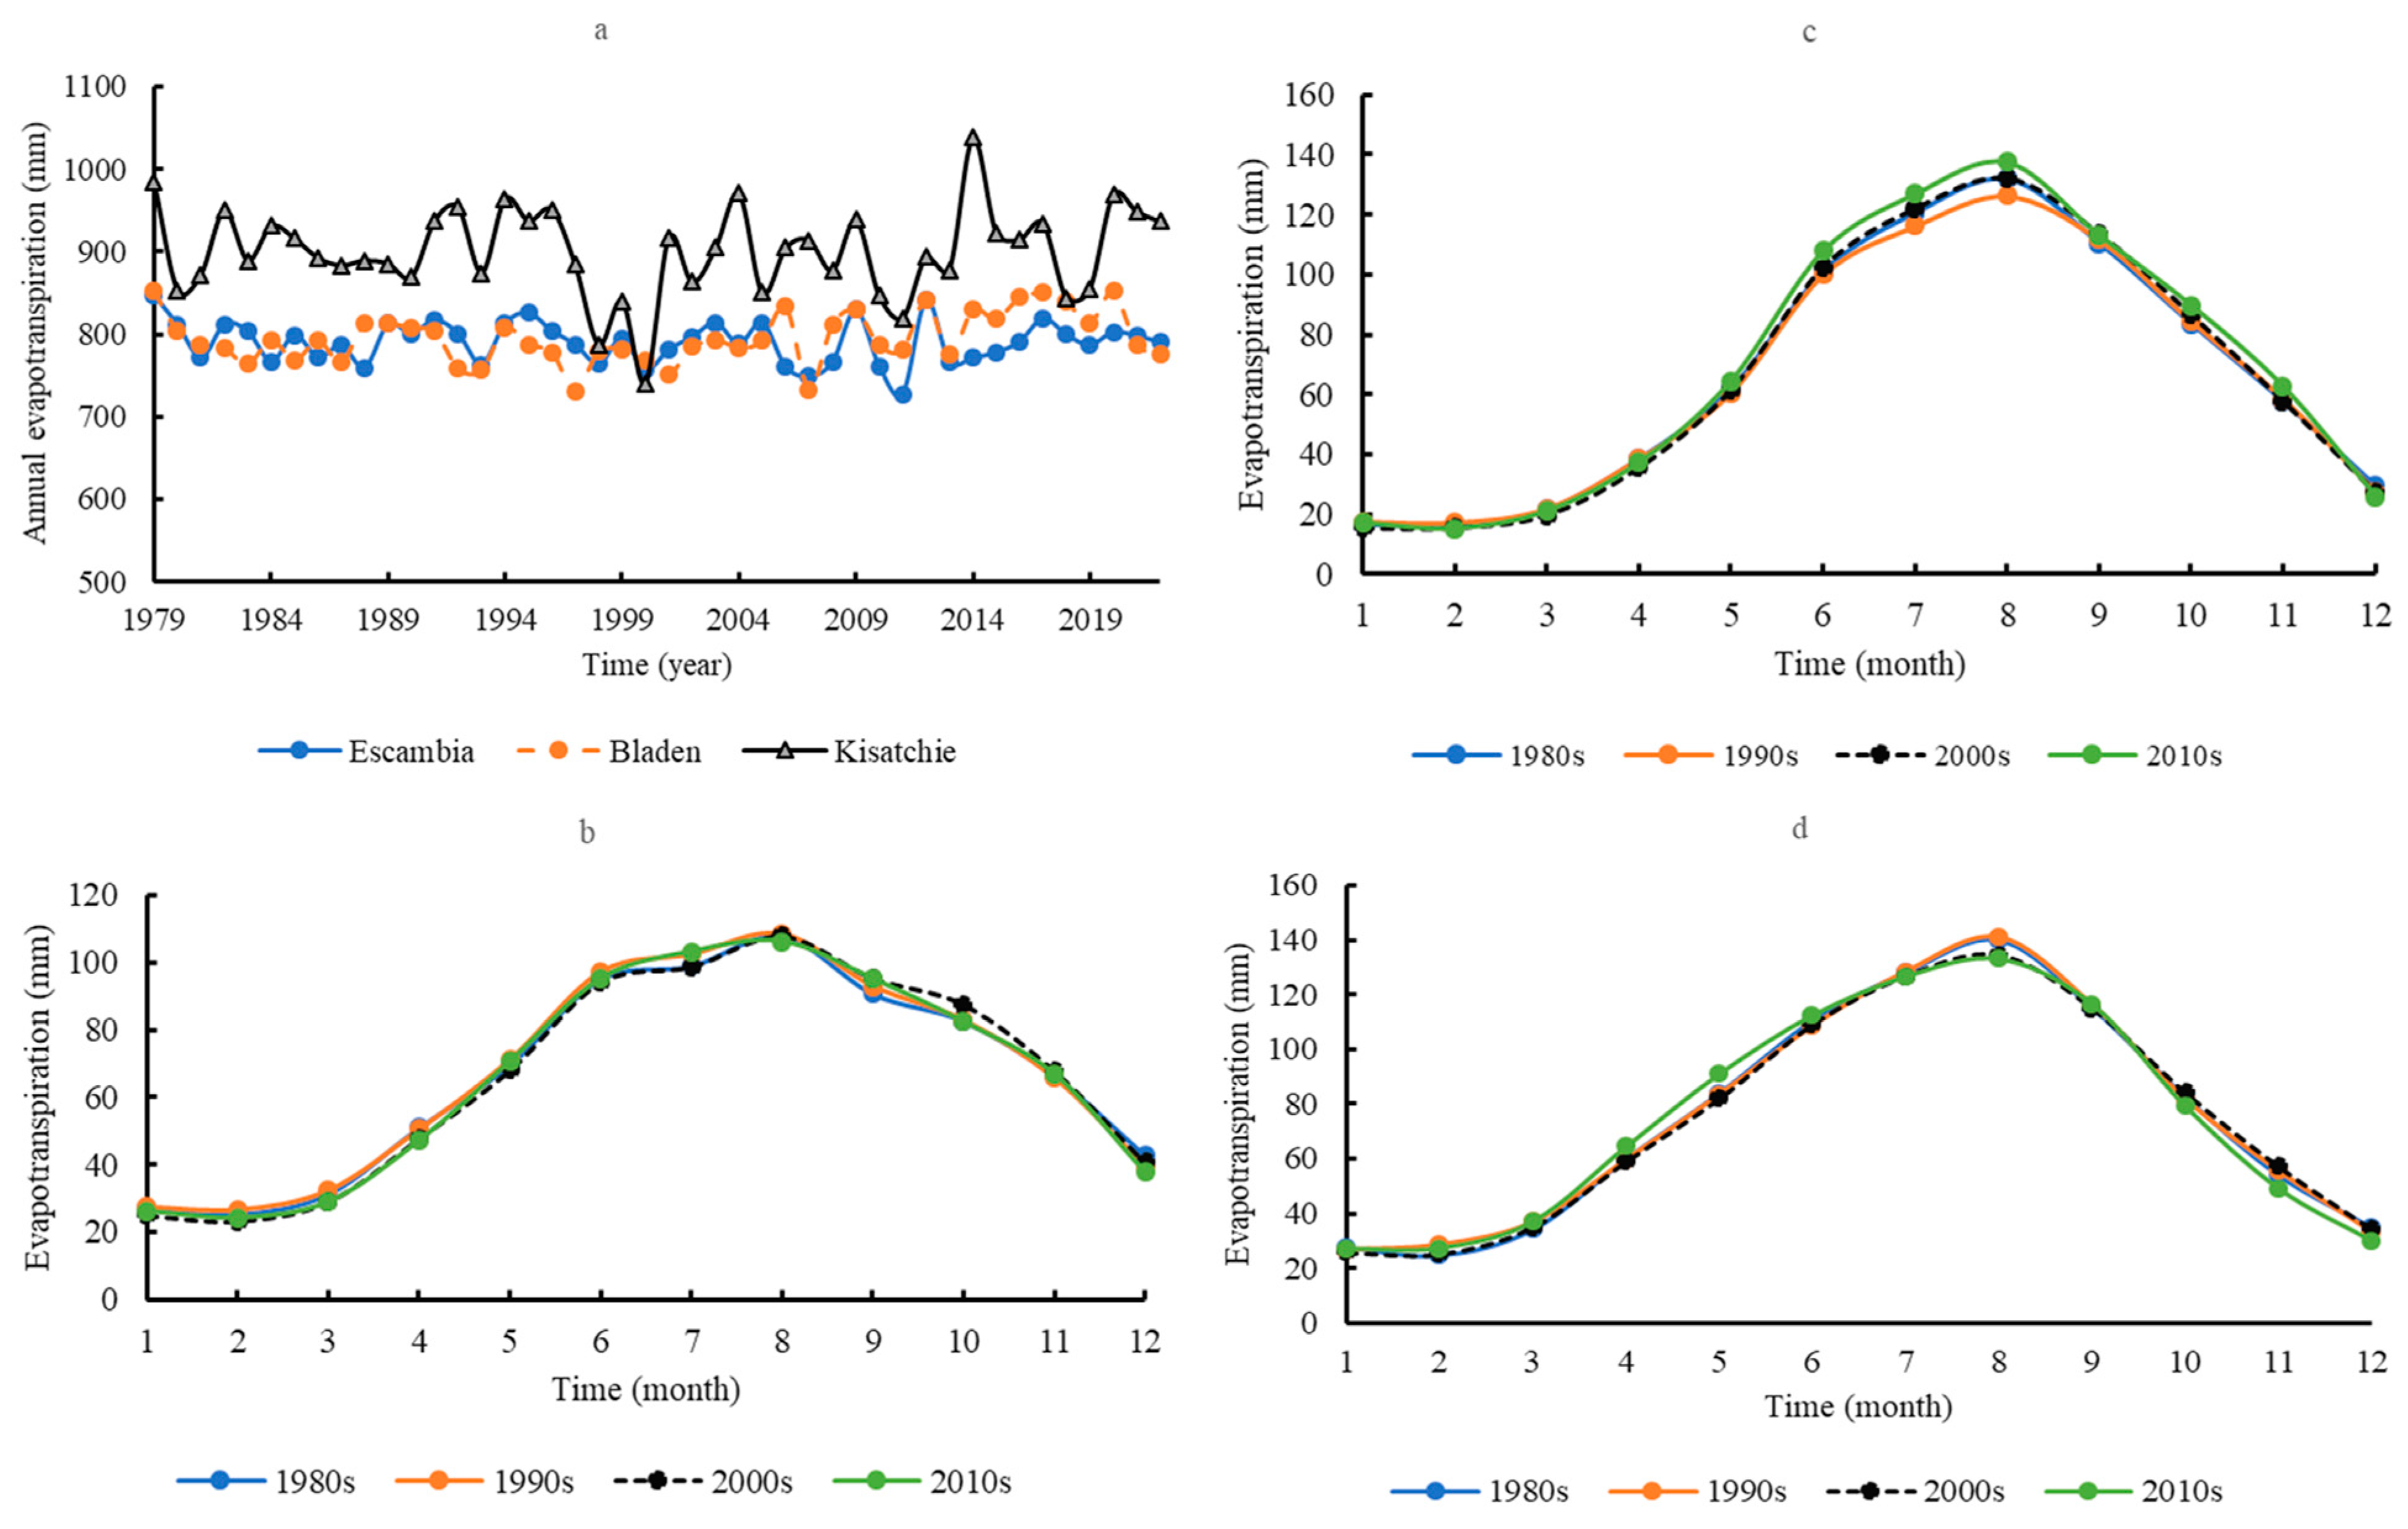
3.2. Evapotranspiration
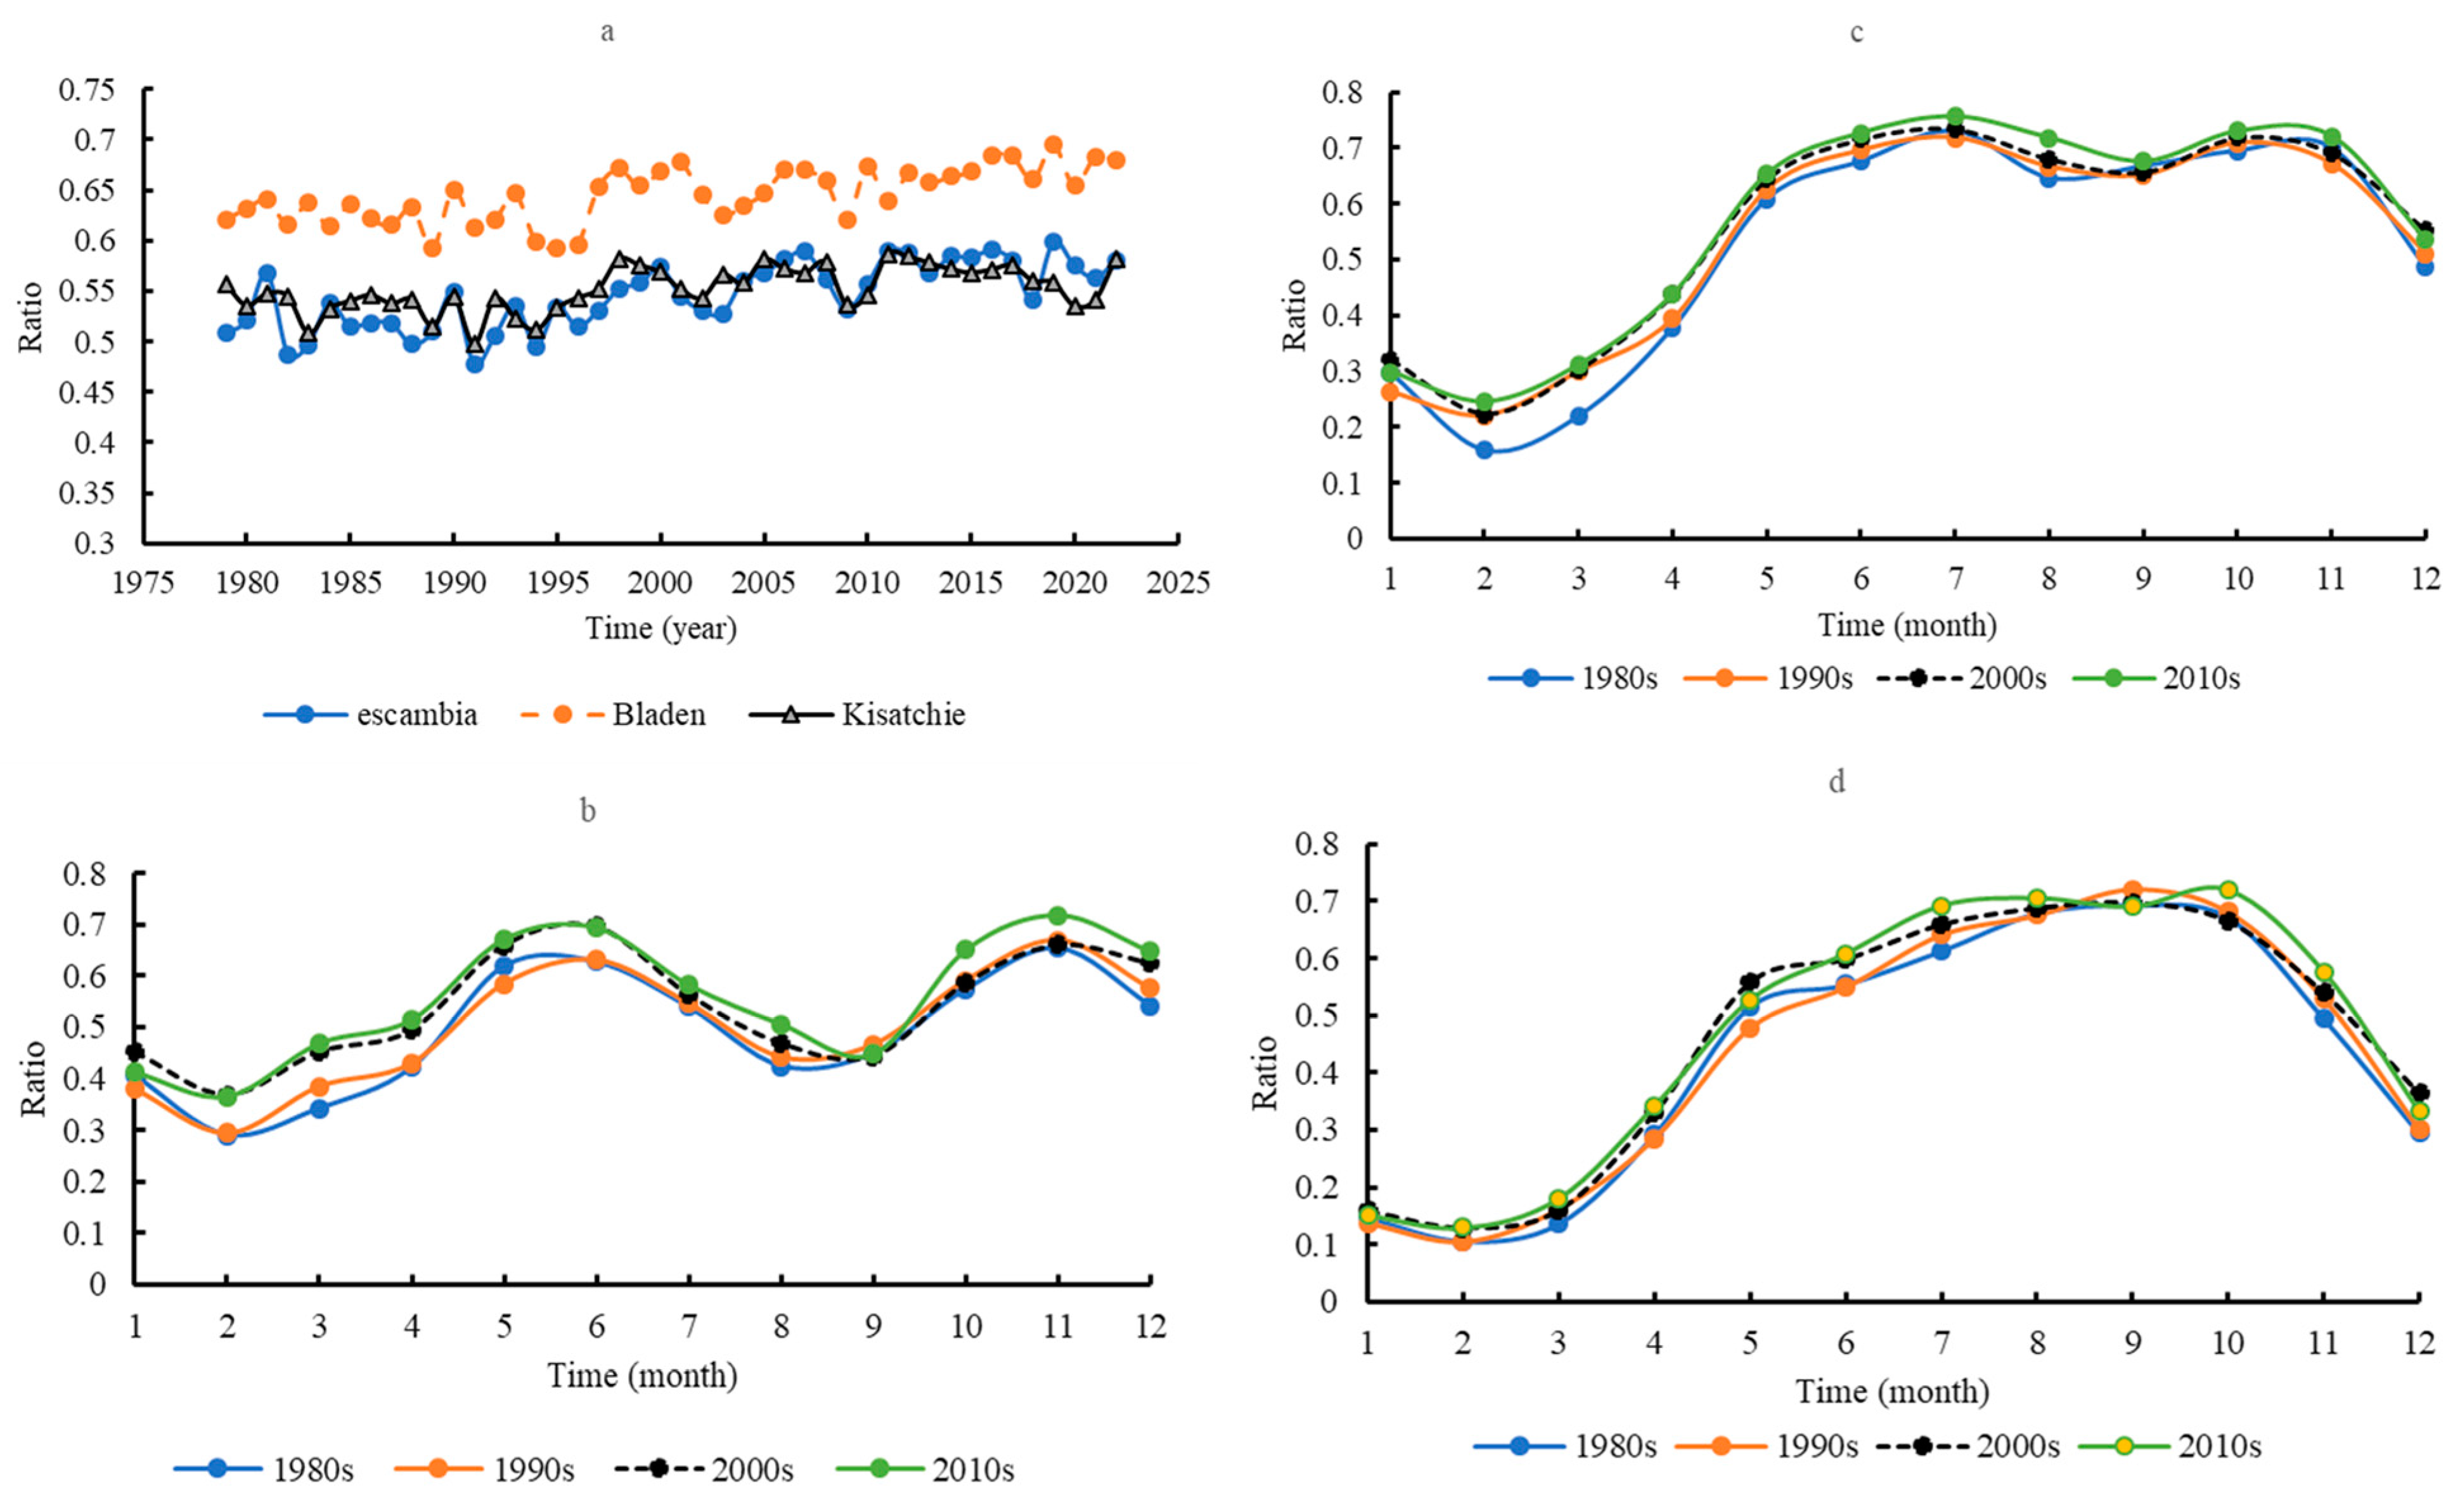
3.3. Transpiration/Evapotranspiration (T/E)
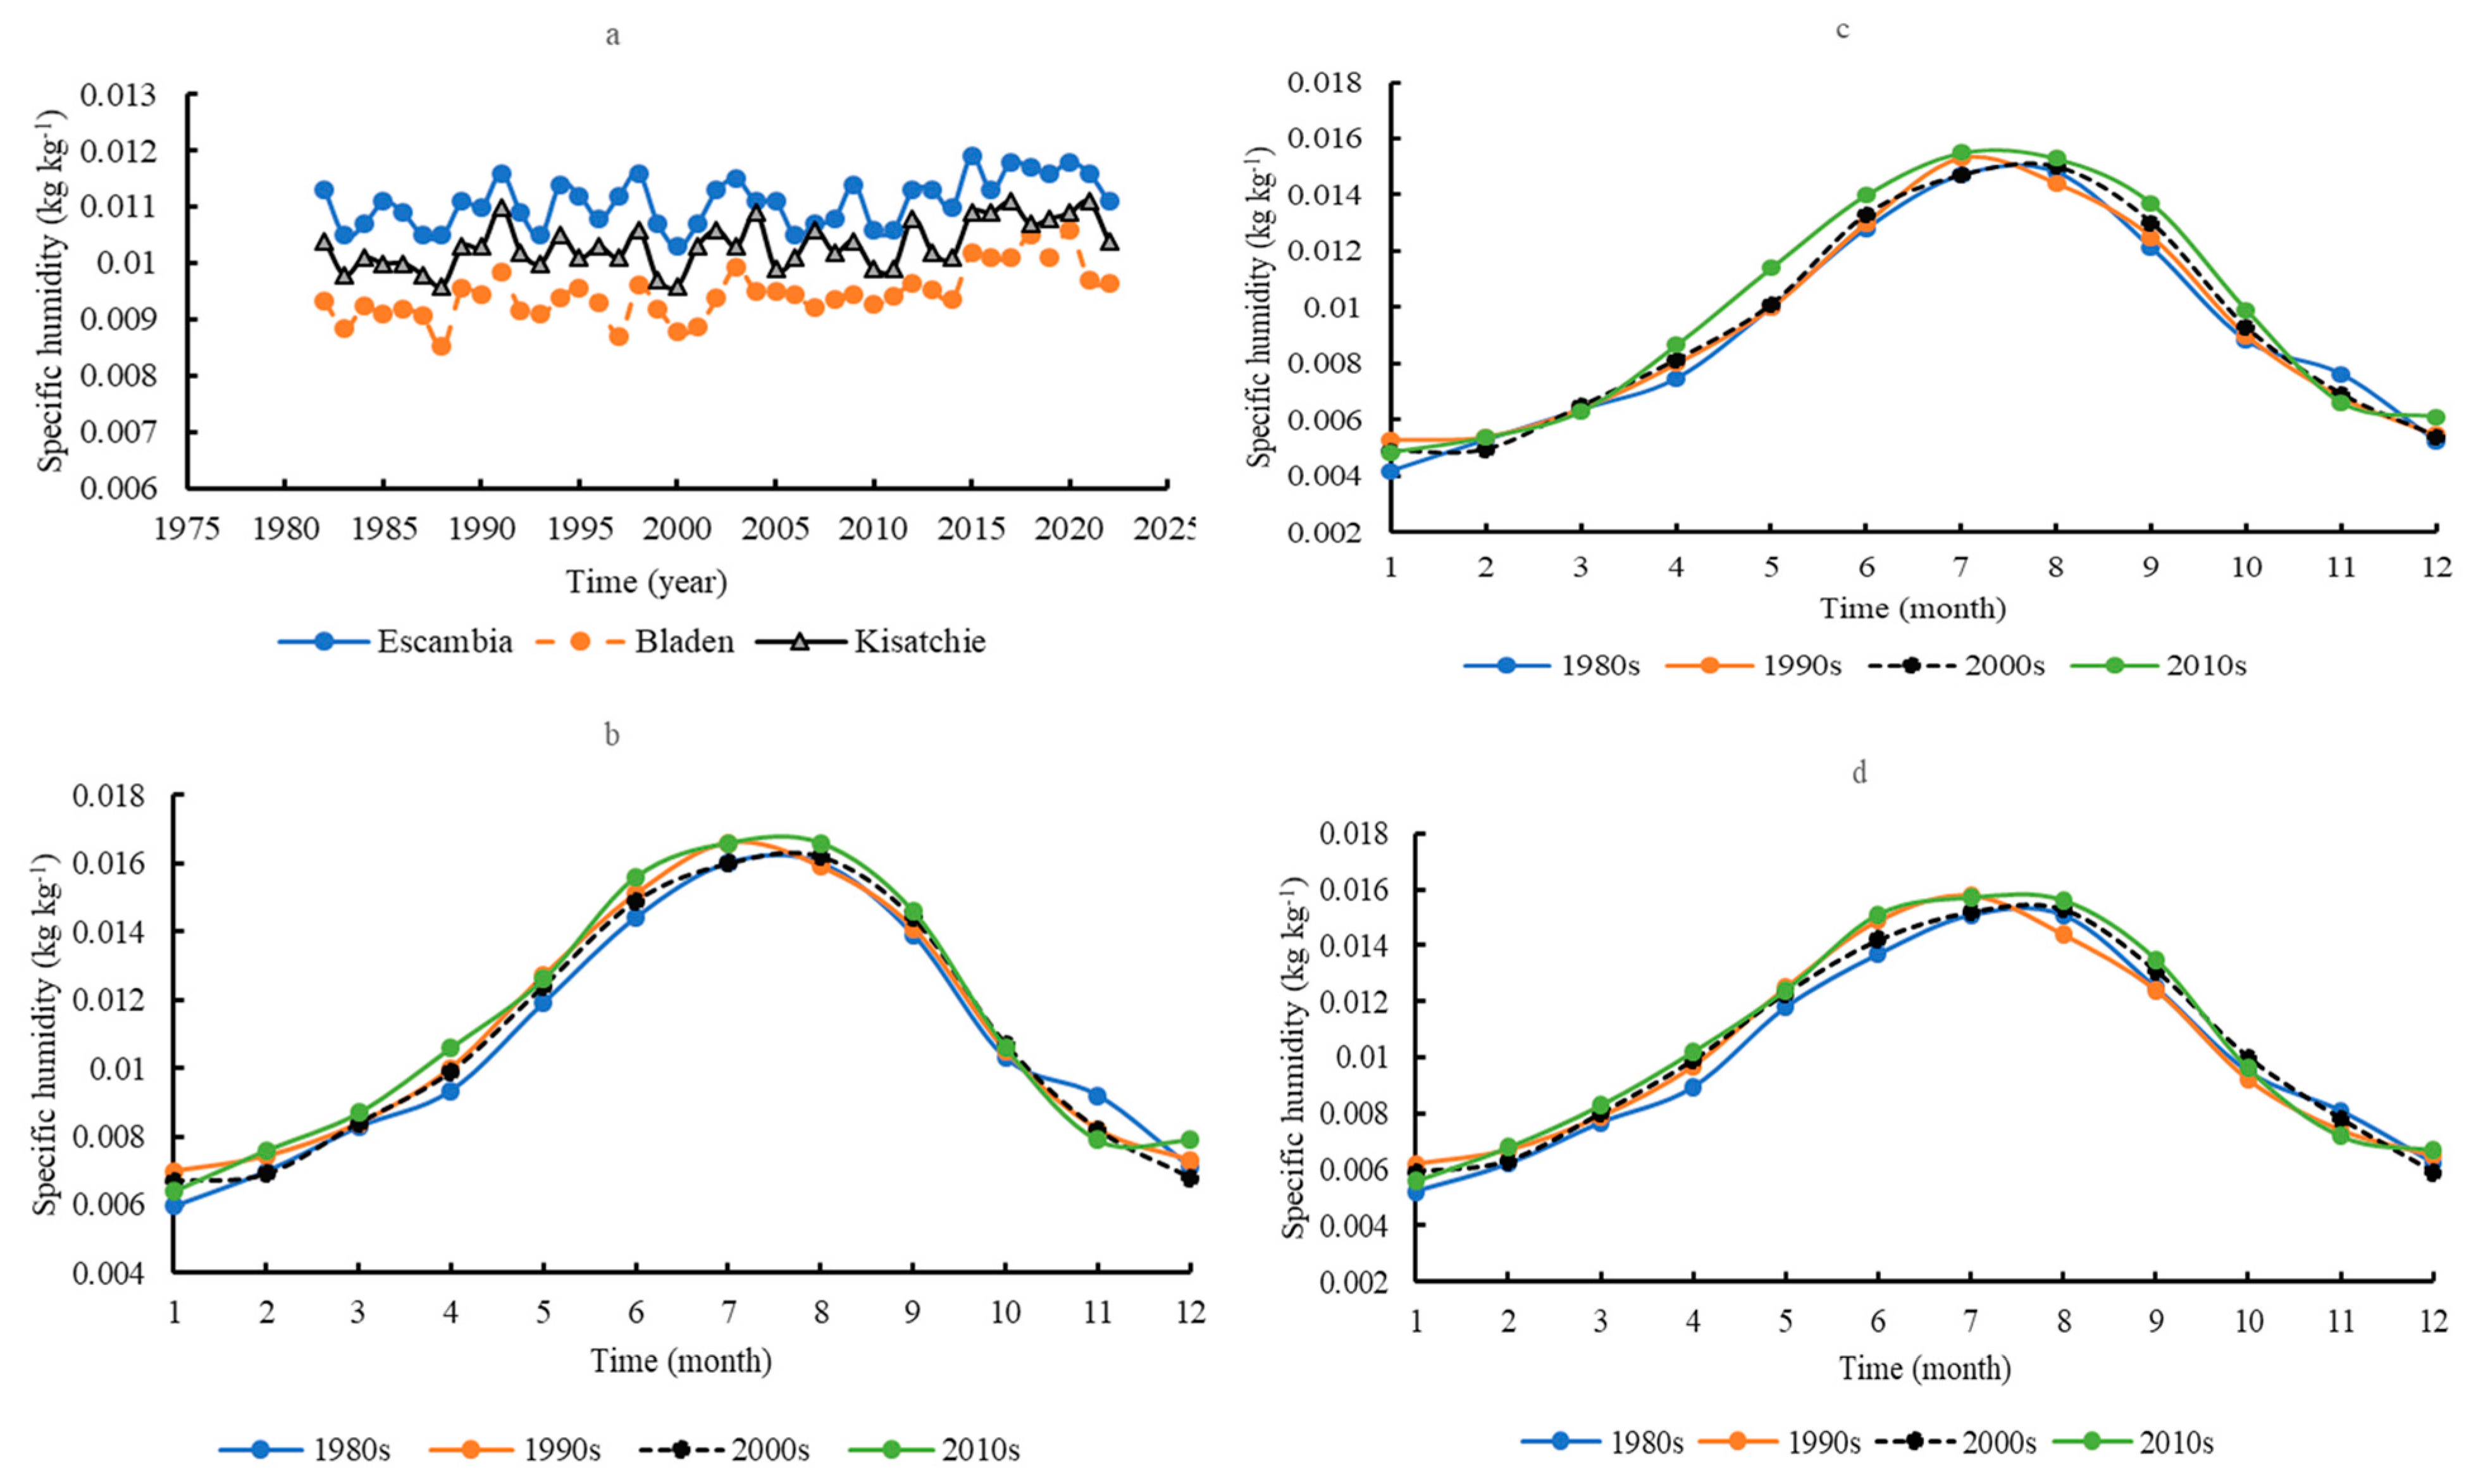
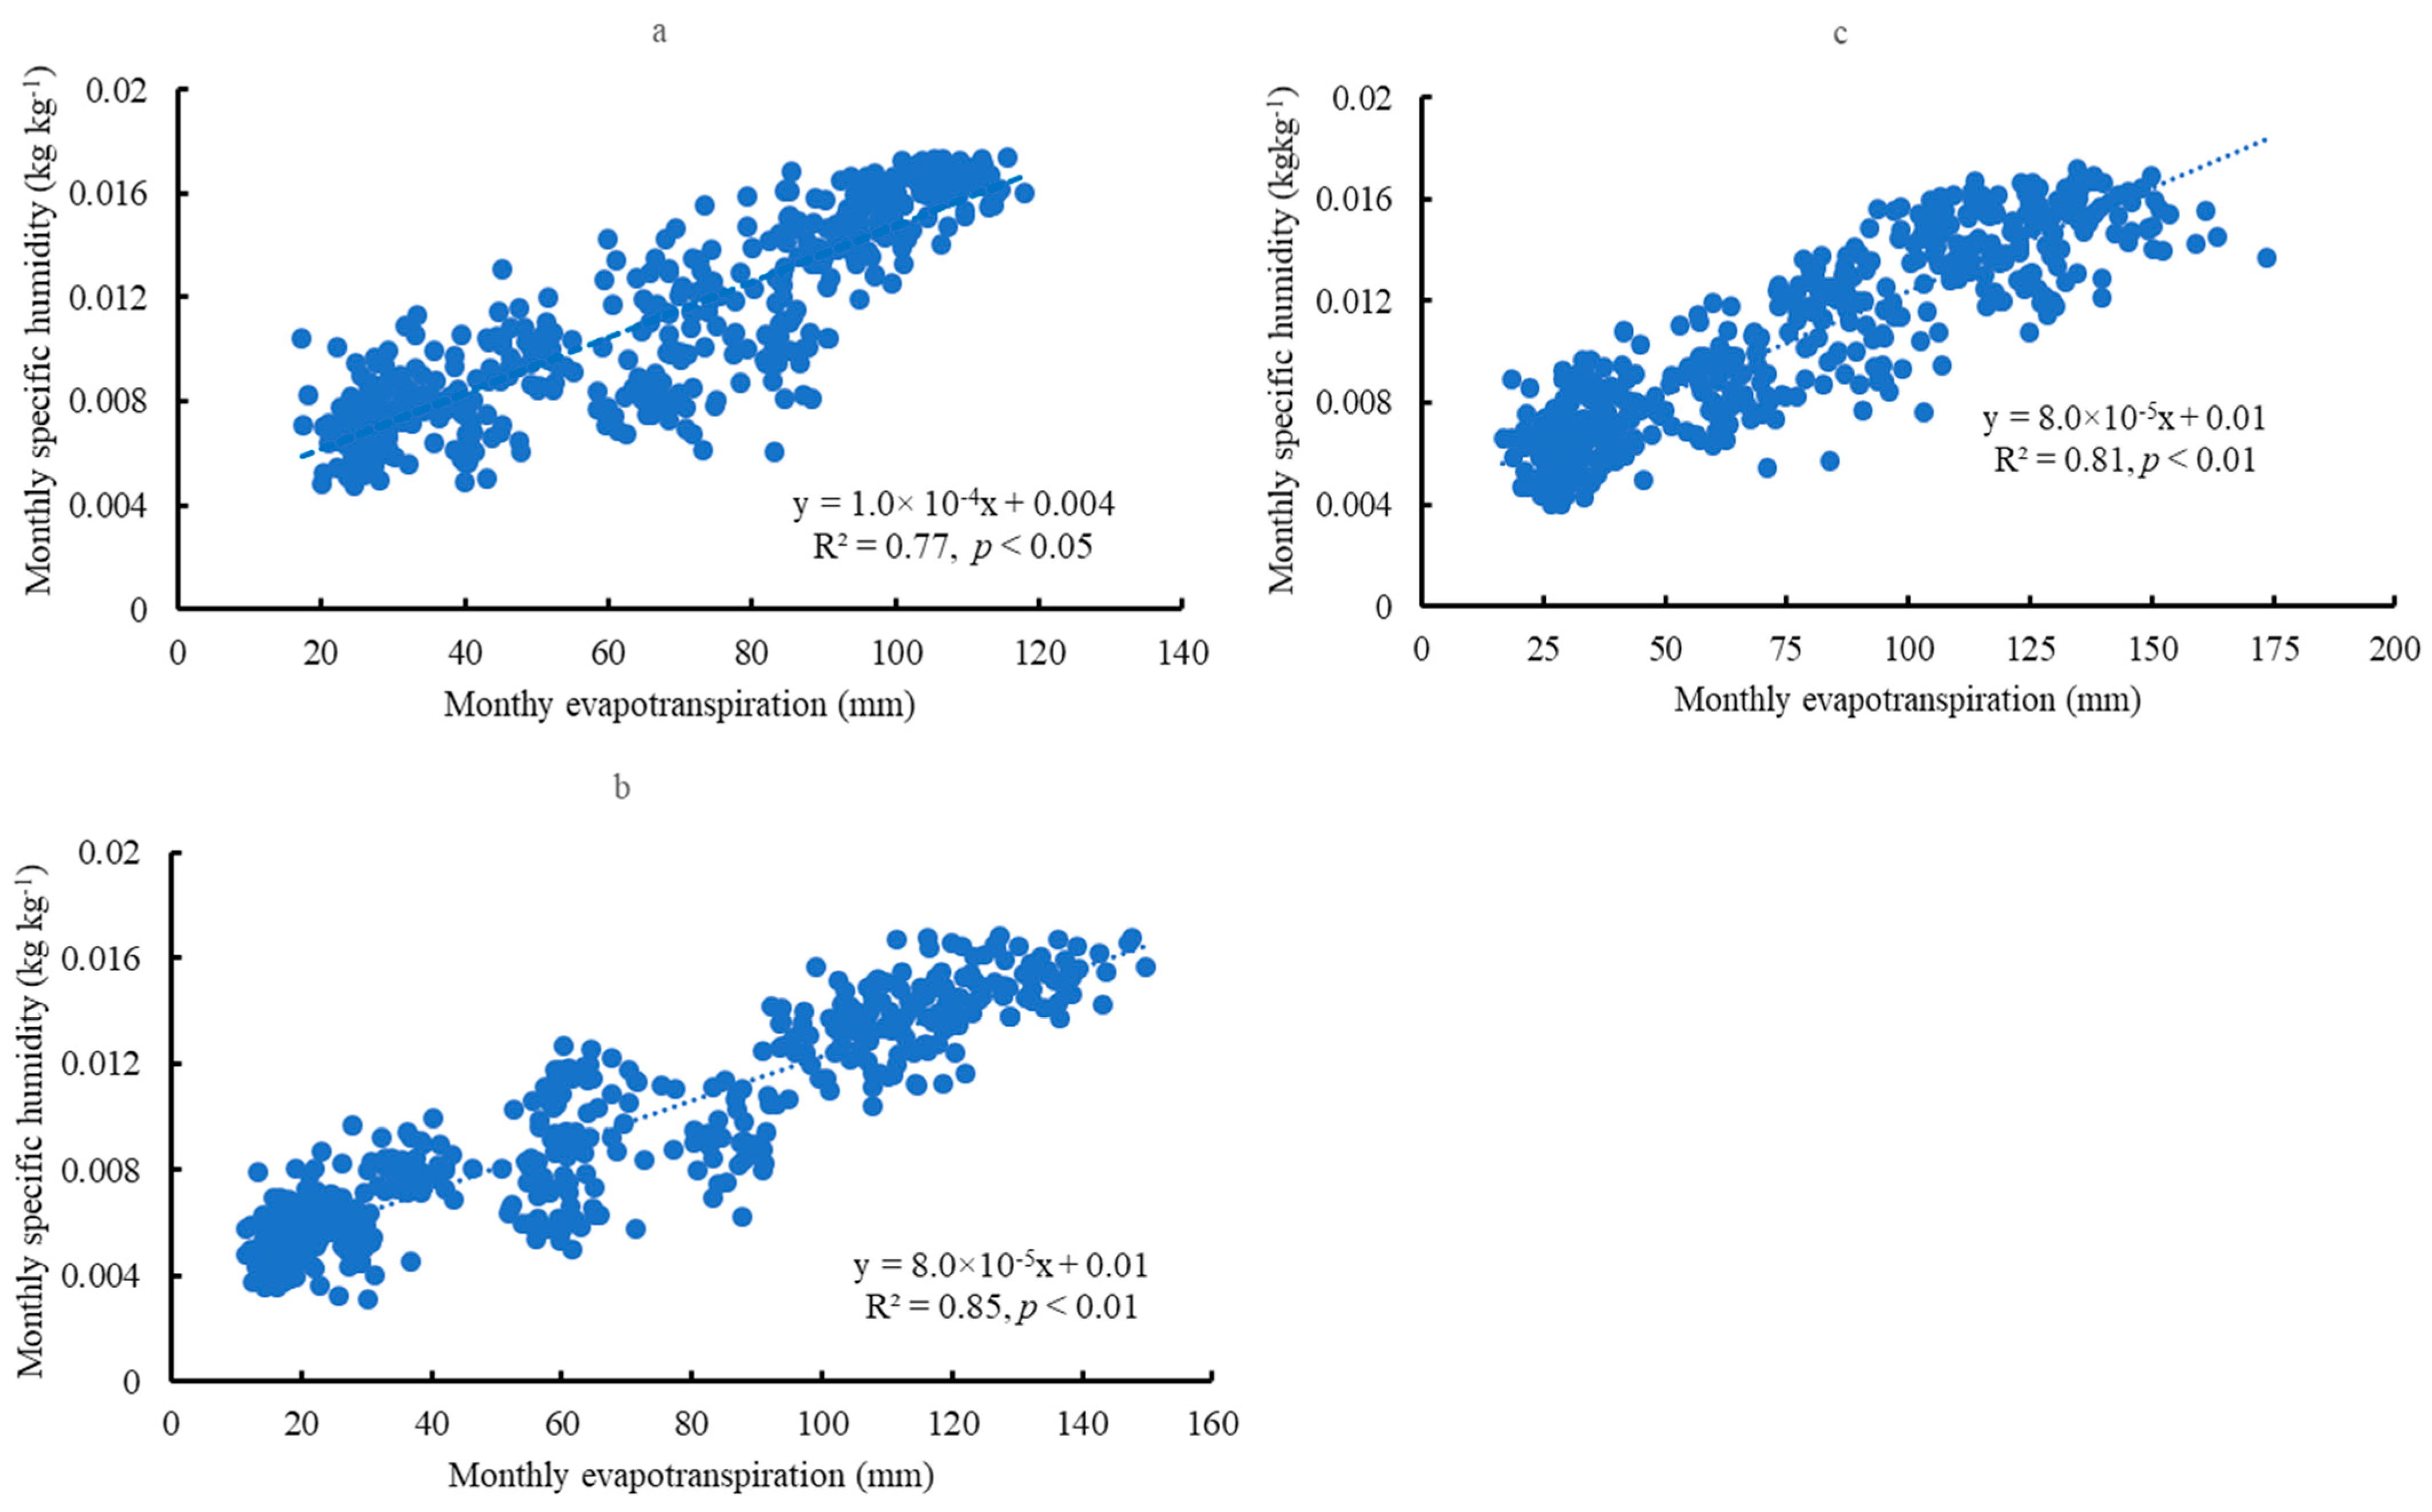
3.4. Atmospheric Humidity
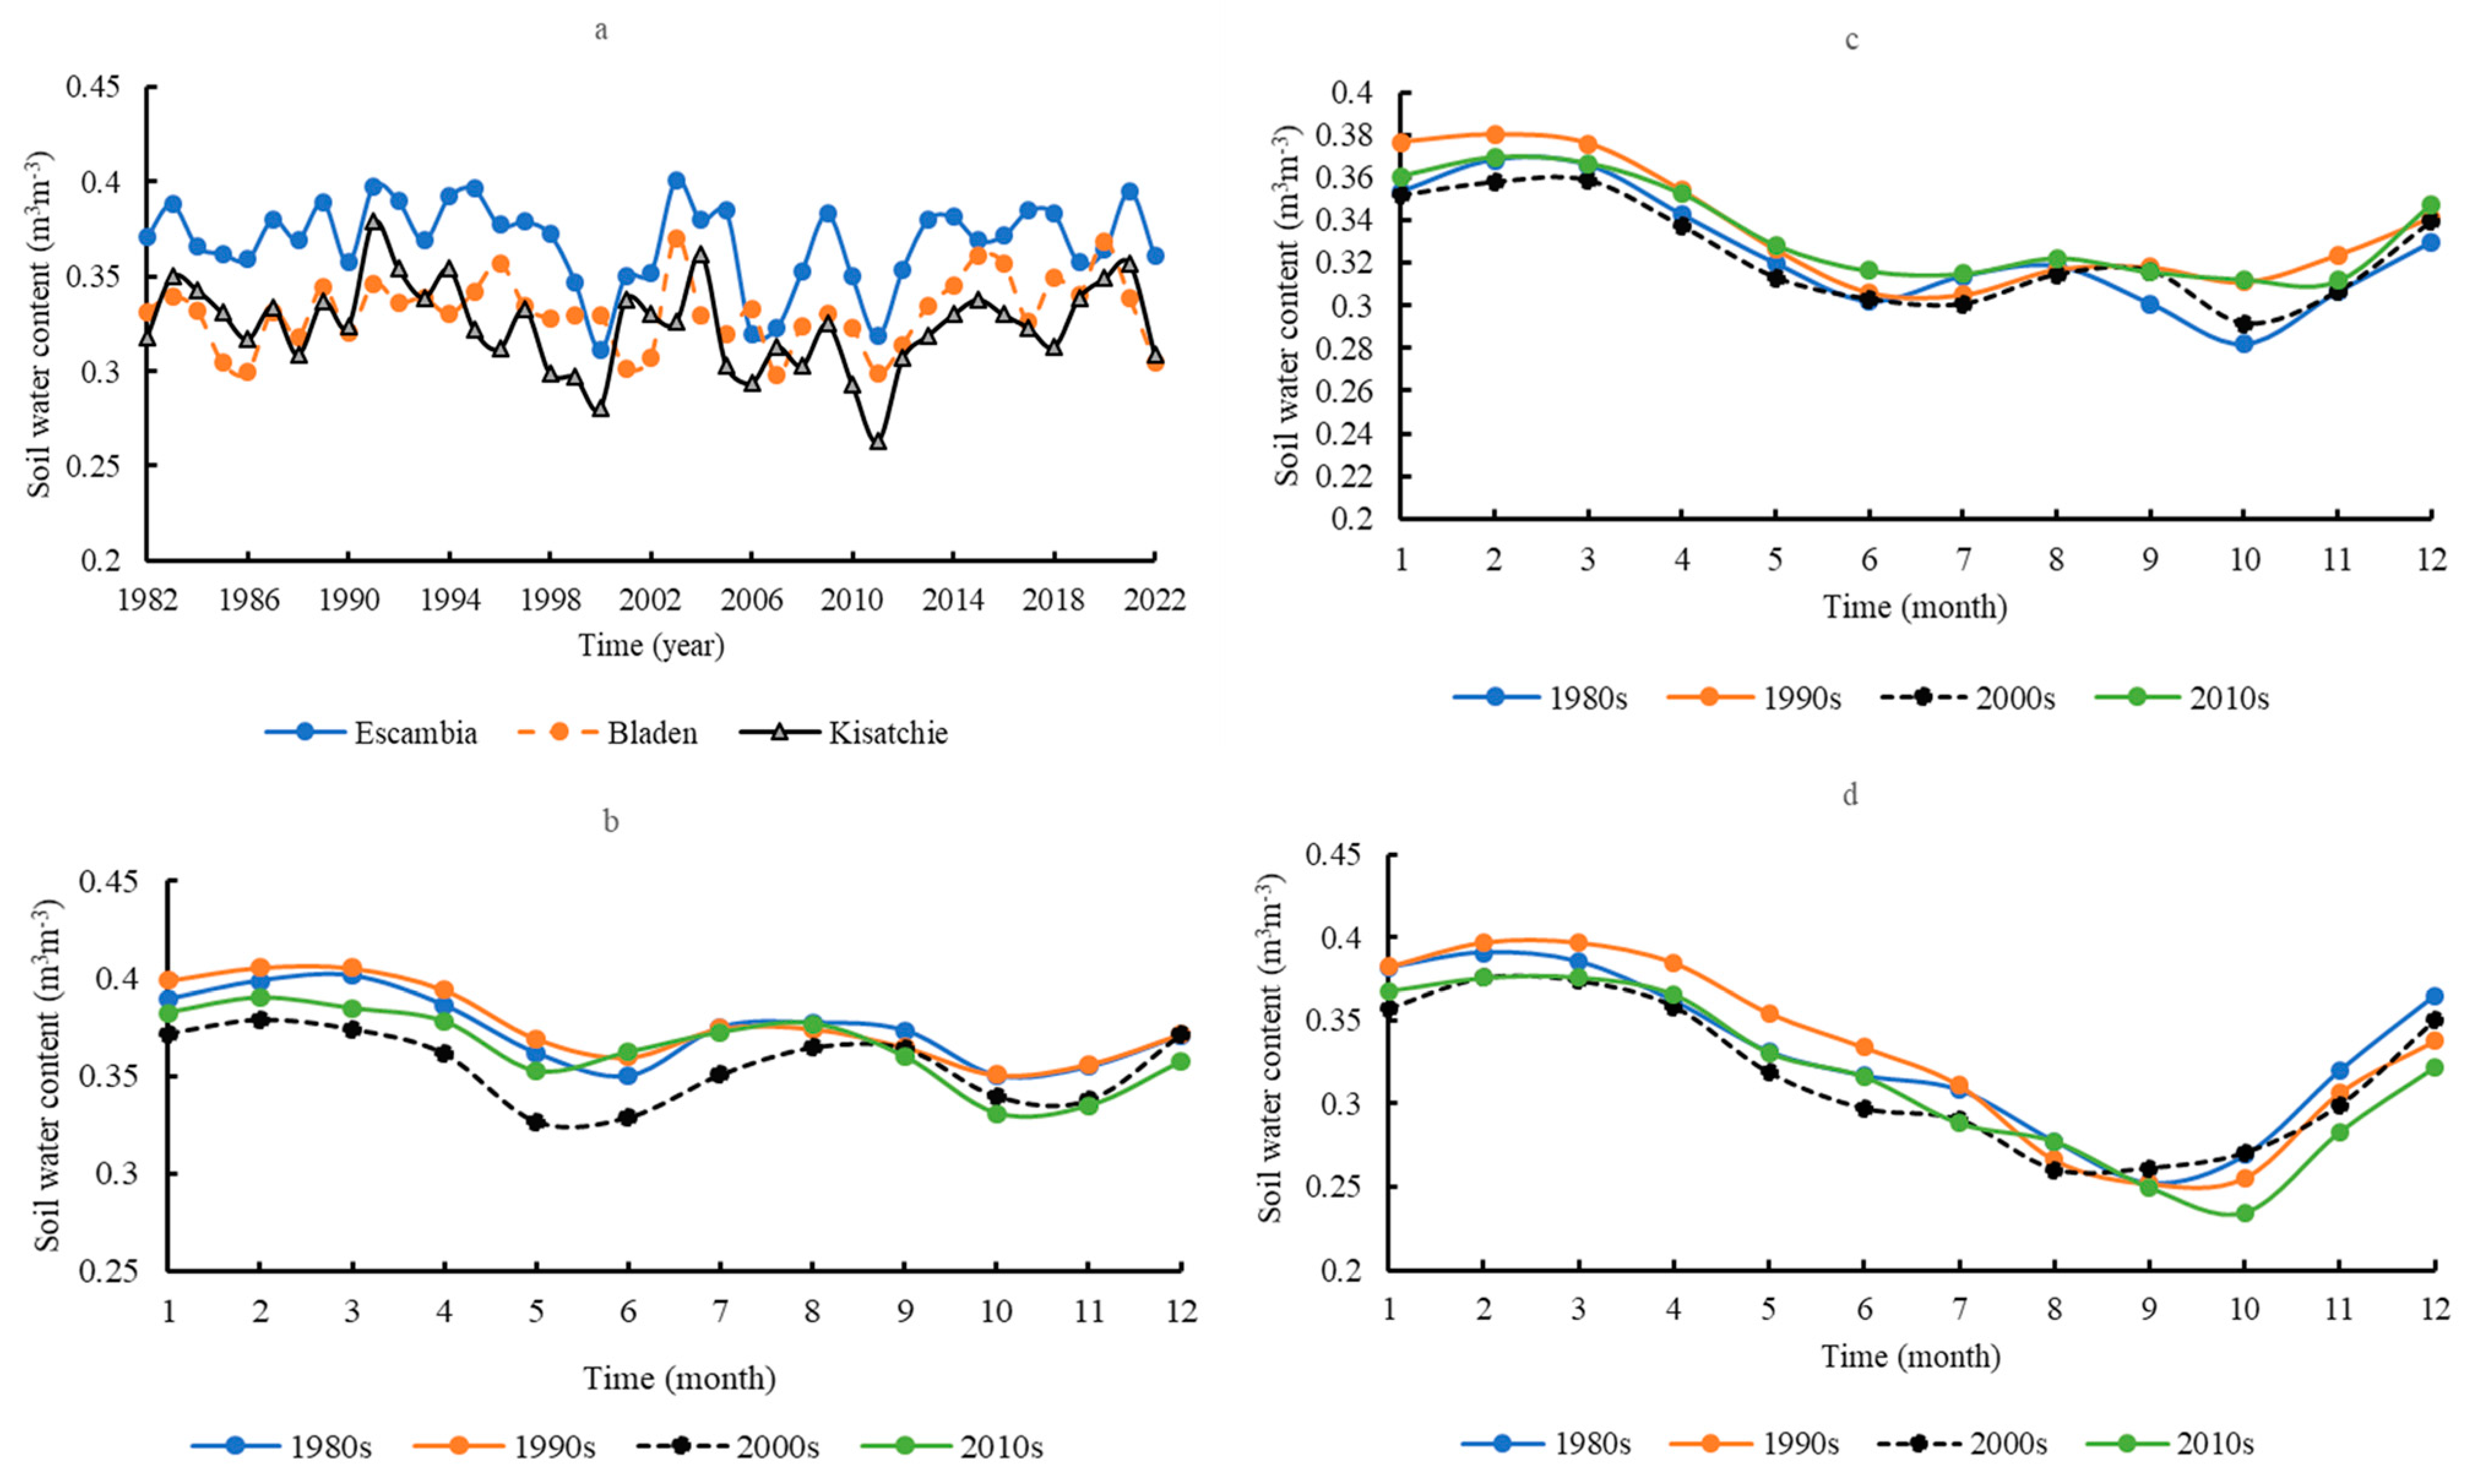
3.5. Soil Water Content (0–10 cm)
3.6. Relationships between Soil Water Content and Transpiration, Evapotranspiration, and Specific Humidity
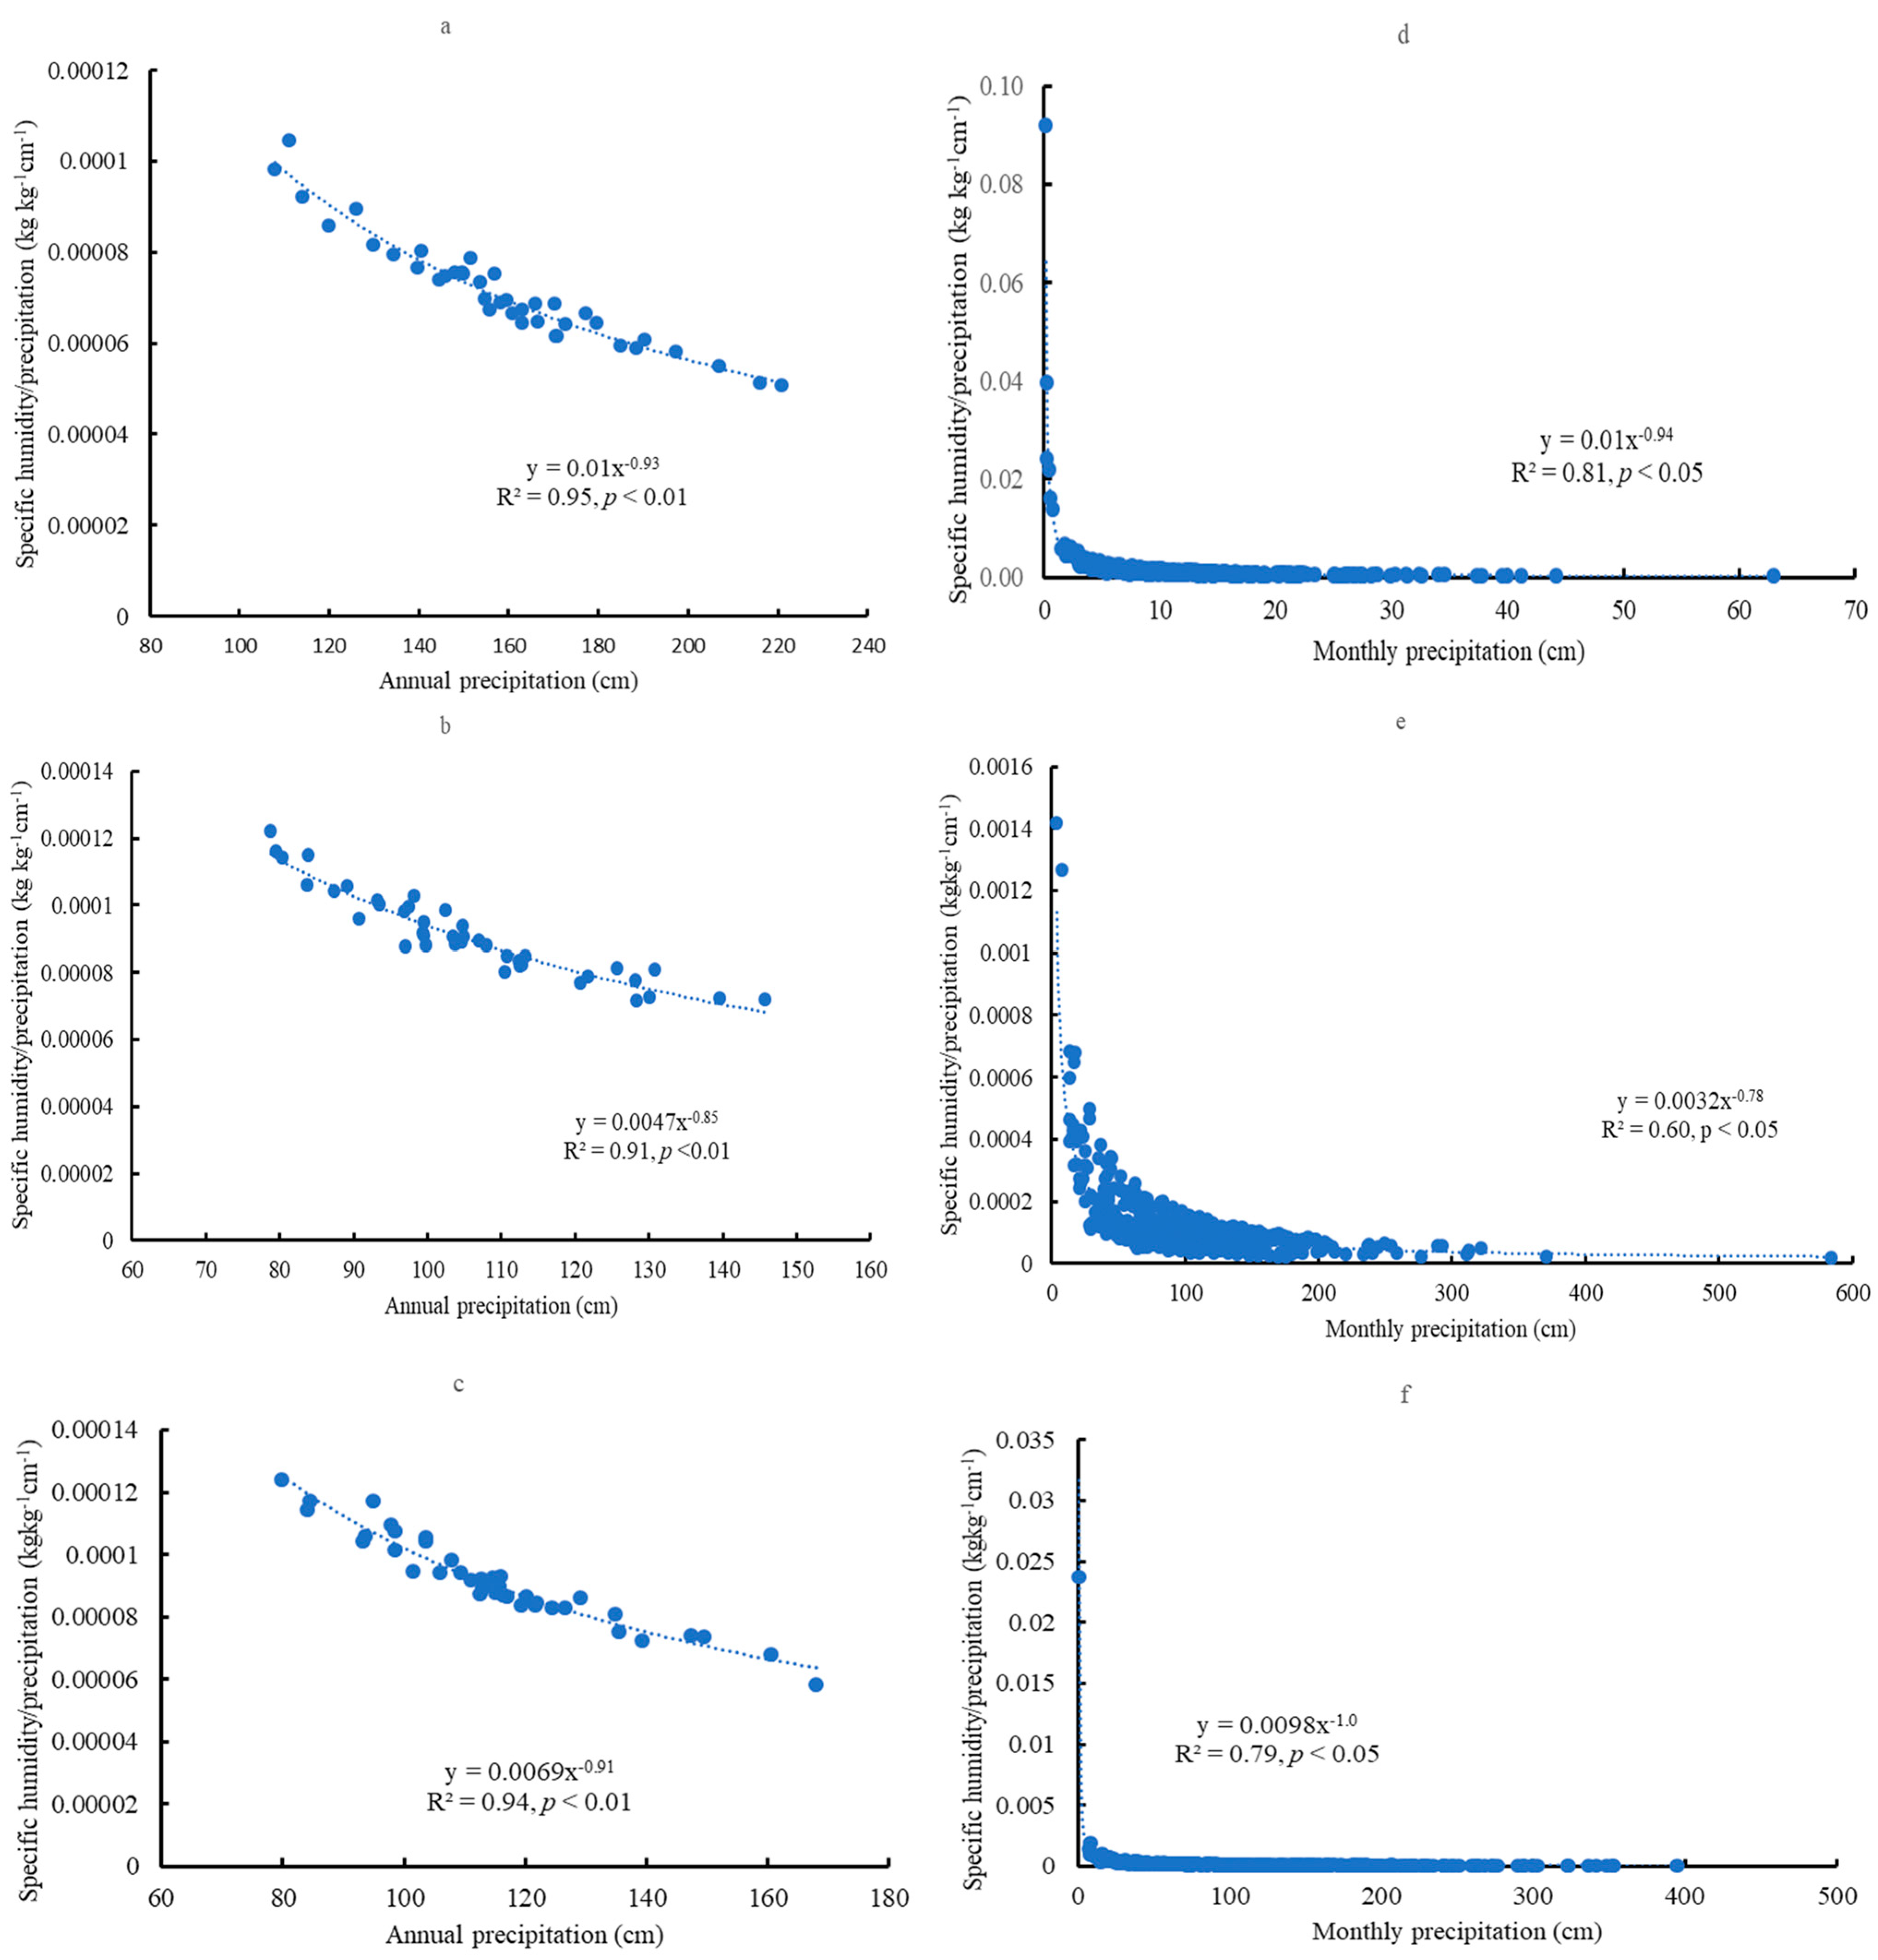
3.7. The Correlations with Precipitation
3.8. Regimes of Water Consumption
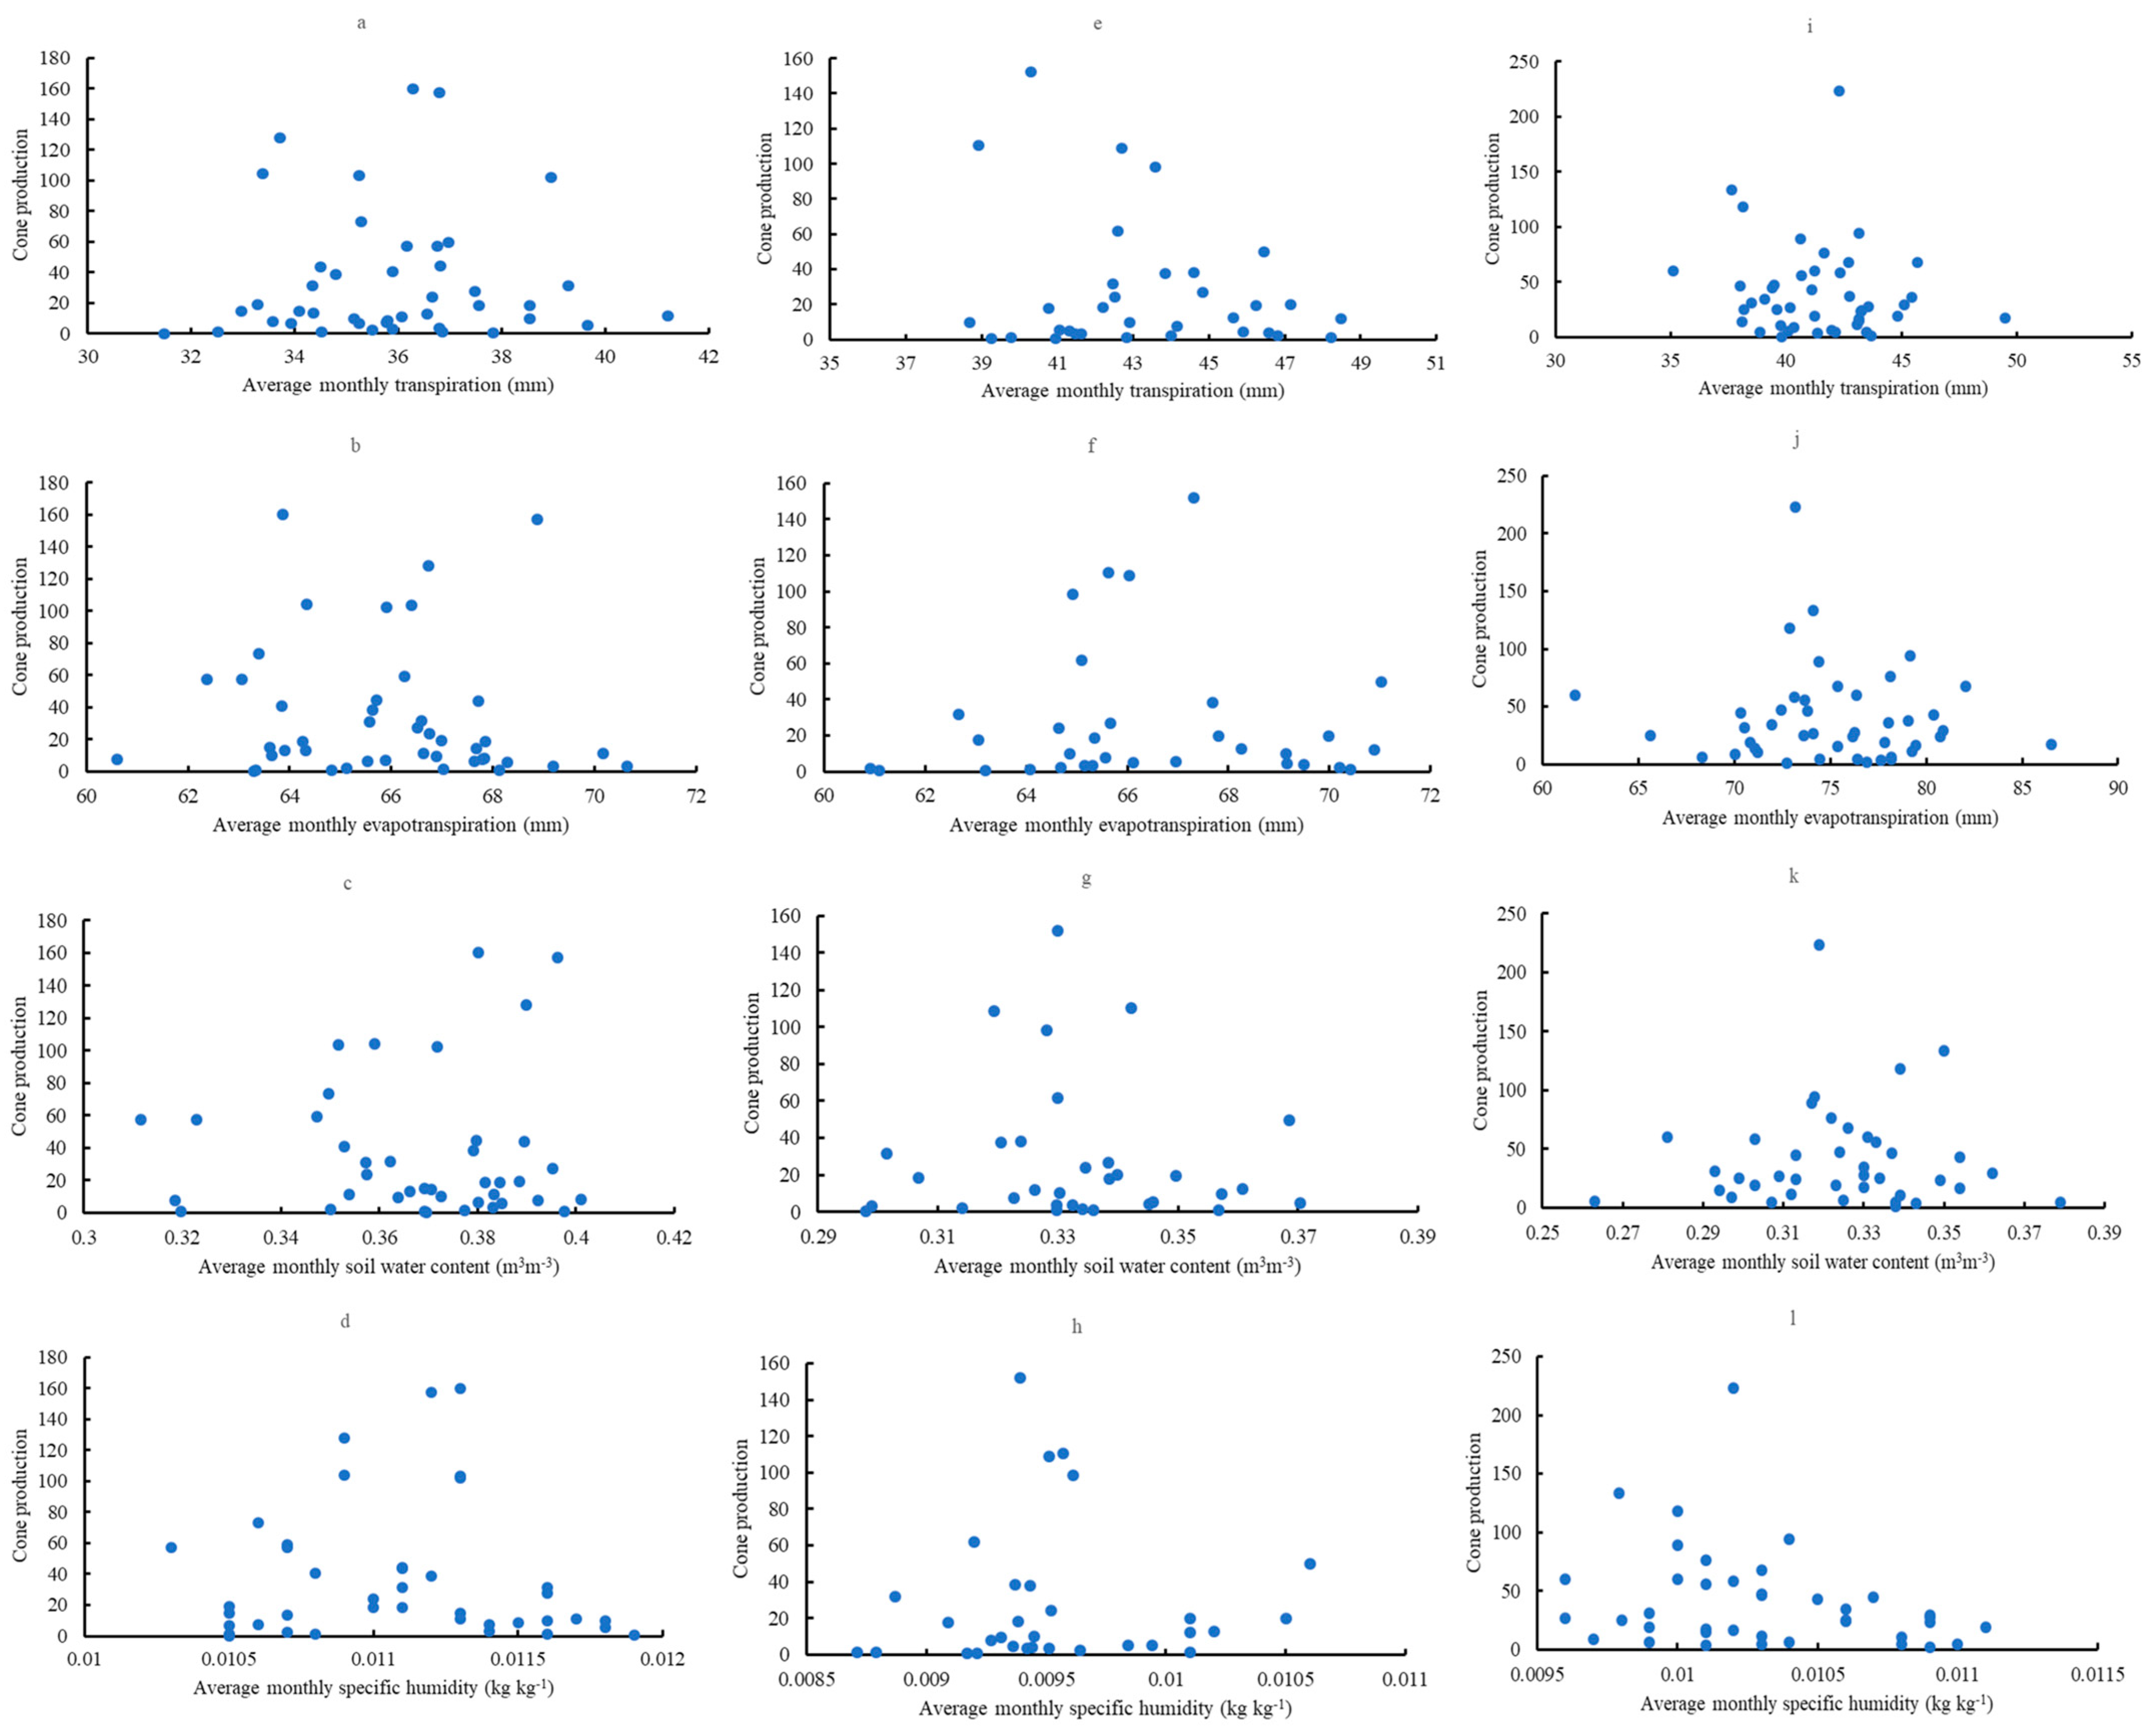
3.9. Relationships with Cone Production
4. Discussion
4.1. Uncertainties
4.2. Transpiration and Evapotranspiration
4.3. Specific Humidity, Soil Water Content, and Precipitation
4.4. Regime of Water Consumption
4.5. Relationships with Cone Production
5. Conclusions
Author Contributions
Funding
Data Availability Statement
Acknowledgments
Conflicts of Interest
References
- Hodges, A.W. The naval stores industry. In The Longleaf Pine Ecosystem: Ecology, Silviculture, and Restoration; Jose, S., Jokela, E.J., Miller, D.L., Eds.; Springer: New York, NY, USA, 2006; pp. 43–48. [Google Scholar]
- Jose, S.; Jokela, E.J.; Miller, D.L. The Longleaf Pine Ecosystem: An overview. In The Longleaf Pine Ecosystem: Ecology, Silviculture, and Restoration; Jose, S., Jokela, E.J., Miller, D.L., Eds.; Springer: New York, NY, USA, 2006; pp. 3–8. [Google Scholar]
- Frost, C.C. History and future of the longleaf pine ecosystem. In The Longleaf Pine Ecosystem: Ecology, Silviculture, and Restoration; Jose, S., Jokela, E.J., Miller, D.L., Eds.; Springer: New York, NY, USA, 2006; pp. 9–42. [Google Scholar]
- Outcalt, K.W.; Sheffield, R.M. The Longleaf Pine Forest: Trends and Current Conditions; Resource Bulletin SRS-9; USDA Forest Service, Southern Research Station: Asheville, NC, USA, 1996.
- Oswalt, C.; Guldin, J.M. Status of Longleaf Pine in the South: An FIA Update; US Department of Agriculture, Forest Service, Southern Research Station: Asheville, NC, USA, 2021.
- Natural Resource Conservation Service (NRCS). Longleaf Pine Ecosystem Restoration; FY20-24 Implementation Strategy; USDA: Washington, DC, USA, 2020.
- Platt, W.J.; Evans, G.W.; Rathbun, S.L. The population dynamics of a long-lived conifer (Pinus palustris). Am. Nat. 1988, 131, 491–525. [Google Scholar] [CrossRef]
- Boyer, W.D. Pinus palustris Mill. Longleaf pine. In Silvics of North America; Conifers. Agriculture Handbook; Burns, R.M., Honkala, B.H., Eds.; USDA, Forest Service: Washington, DC, USA, 1990; Volume 1, pp. 405–412. [Google Scholar]
- Samuelson, L.J.; Stokes, T.A.; Butnor, J.R.; Johnsen, K.H.; Gonzalez-Benecke, C.A.; Martin, T.A.; Cropper, W.P., Jr.; Anderson, P.H.; Ramirez, M.R.; Lewis, J.C. Ecosystem carbon density and allocation across a chronosequence of longleaf pine forests. Ecol. Appl. 2017, 27, 244–259. [Google Scholar] [CrossRef] [PubMed]
- Guldin, J.M. Restoration of native fire-adapted southern pine-dominated forest ecosystems: Diversifying the tools in the silvicultural toolbox. For. Sci. 2019, 65, 508–518. [Google Scholar] [CrossRef]
- Caldwell, P.; Muldoon, C.; Ford-Miniat, C.; Cohen, E.; Krieger, S.; Sun, G.; McNulty, S.; Bosltad, P. Quantifying the Role of National Forests System Lands in Providing Drinking Water Supply for the Southern United States; General Technical Report SRS-197; U.S. Department of Agriculture Forest Service: Asheville, NC, USA, 2014; 135p.
- Ingram, K.; Dow, K.; Carter, L.; Anderson, J. Climate of the Southeast United States: Variability, Change, Impact, and Vulnerability; Island Press: Washington, DC, USA, 2013. [Google Scholar]
- Willcock, S.; Cooper, G.S.; Addy, J.; Dearing, J.A. Earlier collapse of Anthropocene ecosystems driven by multiple faster and noisier drivers. Nat. Sust. 2023. [Google Scholar] [CrossRef]
- Chen, X.; Willis, J.L. Interactions of biosphere and atmosphere within longleaf pine restoration areas. Atmosphere 2022, 13, 1733. [Google Scholar] [CrossRef]
- Boggs, J.; Sun, G.; McNulty, S. Converting naturally regenerated mixed pine-hardwood to loblolly pine plantation forests reduces streamflow in the Piedmont of North Carolina. In Enhancing Landscapes for Sustainable Intensification and Watershed Resiliency, Proceedings of the 7th Interagency Conference on Research in the Watersheds, Virtual, 16–19 November 2020; Latimer, J.S., Bosch, D.D., Faustini, J., Lane, C.R., Trettin, C.C., Eds.; U.S. Department of Agriculture Forest Service, Southern Research Station: Ashville, NC, USA, 2022; 217p. [Google Scholar]
- Johnson, R.; Gjerstad, D. Restoring the overstory of longleaf pine ecosystems. In The Longleaf Pine Ecosystem: Ecology, Silviculture, and Restoration; Jose, S., Jokela, E.J., Miller, D.L., Eds.; Springer: New York, NY, USA, 2006; pp. 271–295. [Google Scholar]
- Makarieva, A.M.; Nefiodov, A.V.; Nobre, A.D.; Baudena, M.; Bardi, U.; Sheil, D.; Saleska, S.R.; Molina, R.D.; Rammig, A. The role of ecosystem transpiration in creating alternate moisture regimes by influencing atmospheric moisture convergence. Glob. Change Biol. 2023, 29, 2536–2556. [Google Scholar] [CrossRef]
- Younger, S.E.; Cannon, J.B.; Brantley, S.T. Impacts of longleaf pine (Pinus palustris Mill.) on long-term hydrology at the watershed scale. Sci. Total Environ. 2023, 902, 165999. [Google Scholar] [CrossRef]
- Qi, J.; Brantley, S.T.; Golladay, S.W. Simulated longleaf pine (Pinus palustris mill.) restoration increased streamflow—A case study in the lower Flint River basin. Ecohydrology 2022, 15, e2365. [Google Scholar] [CrossRef]
- Brown, J.J.; Pascual, M.; Wimberly, M.C.; Johnson, L.R.; Murdock, C.C. Humidity—The overlooked variable in the thermal biology of mosquito-borne Disease. Ecol. Lett. 2023, 26, 1029–1049. [Google Scholar] [CrossRef]
- Chen, X.; Guo, Q.; Bowman, K.A. Climate variation within the range of longleaf pine forests during the past century. Atmosphere 2022, 13, 465. [Google Scholar] [CrossRef]
- Tian, L.; Zhang, B.; Chen, S.; Wang, X.; Ma, X.; Pan, B. Large-scale afforestation enhances precipitation by intensifying the atmospheric water cycle over the Chinese Loess Plateau. JGR Atmos. 2022, 127, e2022JD036738. [Google Scholar] [CrossRef]
- Makarieva, A.M.; Gorshkov, V.G.; Li, B.-L. Revisiting forest impact on atmospheric water vapor transport and precipitation. Theor. Appl. Climatol. 2012, 111, 79–96. [Google Scholar] [CrossRef]
- Makarieva, A.M.; Gorshkov, V.G.; Sheil, D.; Nobre, A.D.; Bunyard, P.; Li, B.-L. Why does air passage over forest yield more rain? Examining the coupling between rainfall, pressure, and atmospheric moisture content. J. Hydrometeorol. 2014, 15, 411–426. [Google Scholar] [CrossRef]
- Chen, X.; Guo, Q.; Brockway, D.G. Analyzing the complexity of cone production in longleaf pine by multiscale entropy. J. Sust. For. 2016, 35, 172–182. [Google Scholar] [CrossRef]
- Chen, X.; Willis, J.L.; Bowman, K.A. Assessing the influence of climate on cone production of longleaf pine forests. Trees For. People 2022, 9, 100297. [Google Scholar] [CrossRef]
- Guo, Q.; Zarnoch, S.J.; Chen, X.; Brockway, D.G. Life cycle and masting of a recovering keystone indicator species under climate change. Ecosystem Health Sust. 2016, 2, e01226. [Google Scholar] [CrossRef]
- Whelan, A.; Starr, G.; Staudhammer, C.L.; Loescher, H.W.; Mitchell, R.J. Effects of drought and prescribed fire on energy exchange in longleaf pine ecosystems. Ecosphere 2015, 6, 128. [Google Scholar] [CrossRef]
- Willis, J.L.; Brockway, D.G. Longleaf Pine Cone Prospects for 2023; Southern Research Station, USDA Forest Service: Asheville, NC, USA, 2023.
- Luo, L.; Robock, A.; Mitchell, K.E.; Houser, P.R.; Wood, E.F.; Schaake, J.C.; Lohmann, D.; Cosgrove, B.; Wen, F.; Sheffield, J.; et al. Validation of the North American Land Data Assimilation System (NLDAS) retrospective forcing over the southern Great Plains. J. Geophys. Res. 2003, 108, 8843. [Google Scholar] [CrossRef]
- Mitchell, K.E.; Lohmann, D.; Houser, P.R.; Wood, E.F.; Schaake, J.C.; Robock, A.; Cosgrove, B.A.; Sheffield, J.; Duan, Q.; Luo, L.; et al. The multi-institution North American Land Data Assimilation System (NLDAS): Utilizing multiple GCIP products and partners in a continental distributed hydrological modeling system. J. Geophys. Res. 2004, 109, D07S90. [Google Scholar] [CrossRef]
- Chen, X. A case study of using remote sensing data to compare biophysical properties of a forest and an urban area in northern Alabama, USA. J. Sust. For. 2016, 35, 261–279. [Google Scholar] [CrossRef]
- Chen, X.; Chen, H. Comparing environmental impacts of Chinese Torreya plantations and regular forests using remote sensing. Envir. Develop. Sust. 2021, 23, 133–150. [Google Scholar] [CrossRef]
- Nelson, J.A.; Pérez-Priego, O.; Zhou, S.; Royatos, R.; Zhang, Y.; Blanken, P.D.; Gimeno, T.E.; Wohlfahrt, G.; Gioli, B.; Limousin, J.M. Ecosystem transpiration and evaporation: Insights from three water flux partitioning methods across FLUXNET sites. Glob. Change Biol. 2020, 26, 6916–6930. [Google Scholar] [CrossRef] [PubMed]
- Sun, G.; Amatya, D.M.; McNulty, S.G.; Skaggs, R.W.; Hughes, J.H. Climate change impacts on the hydrology and productivity of a pine plantation. J. Am. Water Res. Assoc. 2000, 36, 367–374. [Google Scholar] [CrossRef]
- Ciais, P.; Reichstein, M.; Viovy, N.; Granier, A.; Ogee, J.; Allard, V.; Aubinet, M.; Buchmann, N.; Bernhofer, C.; Carrara, A.; et al. Europe-wide reduction in primary productivity caused by the heat and drought in 2003. Nature 2005, 437, 529–533. [Google Scholar] [CrossRef]
- Ford, C.R.; Mitchell, R.J.; Teskey, R.O. Water table depth affects productivity, water use, and the response to nitrogen addition in a savanna system. Can. J. For. Res. 2008, 38, 2118–2127. [Google Scholar] [CrossRef]
- Fisher, J.B.; Melton, F.; Middleton, E.; Hain, C.; Anderson, M.; Allen, R.; McCabe, M.C.; Hook, S.; Baldocchi, D.; Townsend, P.A.; et al. The future of evapotranspiration: Global requirements for ecosystem functioning, carbon and climate feedbacks, agricultural management, and water resources: The future of evapotranspiration. Water Resour. Res. 2017, 53, 2618–2626. [Google Scholar] [CrossRef]
- Berkelhammer, M.; Noone, D.C.; Wong, T.E.; Burns, S.P.; Knowles, J.F.; Kaushik, A.; Blanken, P.D.; Williams, M.W. Convergent approaches to determine an ecosystem’s transpiration fraction: Transpiration fraction of two forests. Glob. Biogeochem. Cycles 2016, 30, 933–951. [Google Scholar] [CrossRef]
- Fatichi, S.; Pappas, C. Constrained variability of modeled T:ET ratio across biomes: Transpiration: Evapotranspiration Ratio. Geophys. Res. Lett. 2017, 44, 6795–6803. [Google Scholar] [CrossRef]
- Jiang, K.; Pan, Z.; Pan, F.; Teuling, A.J.; Han, G.; An, P.; Chen, X.; Wang, J.; Song, Y.; Cheng, L.; et al. Combined influence of soil moisture and atmospheric humidity on land surface temperature under different climatic background. iScience 2023, 26, 106937. [Google Scholar] [CrossRef]
- Eltahir, E.A.B. A soil moisture–rainfall feedback mechanism: 1. Theory and observations. Water Resour. Res. 1998, 34, 765–776. [Google Scholar] [CrossRef]
- Sehler, R.; Li, J.; Reager, J.T.; Ye, H. Investigating relationship between soil moisture and precipitation globally using remote sensing observations. J. Contemp. Water Res. Edu. 2019, 168, 106–118. [Google Scholar] [CrossRef]
- Tuttle, S.; Salvucci, G. Empirical evidence of contrasting soil moisture–precipitation feed-backs across the United States. Science 2016, 352, 825–828. [Google Scholar] [CrossRef] [PubMed]
- Ford, T.W.; Rapp, A.D.; Quiring, S.M.; Blake, J. Soil moisture–precipitation coupling: Observations from the Oklahoma Mesonet and underlying physical mechanisms. Hydrol. Earth Syst. Sci. 2015, 19, 3617–3631. [Google Scholar] [CrossRef]
- Rascón-Ramos, A.E.; Martínez-Salvador, M.; Sosa-Pérez, G.; Villarreal-Guerrero, F.; Pinedo-Alvarez, A.; Santellano-Estrada, E.; Corrales-Lerma, R. Soil moisture dynamics in response to precipitation and thinning in a semi-dry forest in northern Mexico. Water 2021, 13, 105. [Google Scholar] [CrossRef]
- Powell, T.L.; Gholz, H.L.; Clark, K.L.; Starr, G.; Cropper, W.P., Jr.; Martin, T.A. Carbon exchange of a mature, naturally regenerated pine forest in north Florida. Glob. Change Biol. 2008, 14, 2523–2538. [Google Scholar] [CrossRef]
- MacRoberts, M.H.; MacRoberts, B.R. Longleaf pine (Pinus palustris Mill.) growth in bogs. Phytologia 1996, 81, 28–34. [Google Scholar]
- Foster, T.E.; Brooks, J.R. Long-term trends in growth of Pinus palustris and Pinus elliottii along a hydrological gradient in central Florida. Can. J. For. Res. 2001, 31, 1661–1670. [Google Scholar] [CrossRef]
- Baudena, M.; Tuinenburg, O.A.; Ferdinand, P.A.; Staal, A. Effects of land-use change in the Amazon on precipitation are likely underestimated. Glob. Change Biol. 2021, 27, 5580–5587. [Google Scholar] [CrossRef]
- Sheil, D. Forests, atmospheric water and an uncertain future: The new biology of the global water cycle. For. Ecosys. 2018, 5, 19. [Google Scholar] [CrossRef]
- Hasting, A.; Annott, K.C.; Cuddington, K.; Francis, T.; Gellner, G.; Lai, Y.-C.; Morozov, A.; Petrovskii, S.; Scranton, K.; Zeeman, M.L. Transient phenomena in ecology. Science 2018, 361, eaat6412. [Google Scholar] [CrossRef]
- Chen, X. Historical radial growth of Chinese Torreya trees and adaptation to climate change. Atmosphere 2020, 11, 691. [Google Scholar] [CrossRef]
- Colwell, R.K.; Hurtt, G.C. Nonbiological gradients in species richness and a spurious Rapoport effect. Am. Nat. 1994, 144, 570–595. [Google Scholar] [CrossRef]
- Letten, A.D.; Lyons, S.K.; Moles, A.T. The mid-domain effect: It’s not just about space. J. Biogeogr. 2013, 40, 2017–2019. [Google Scholar] [CrossRef]
- Chen, X.; Willis, J.L. Individuals’ behaviors of cone production in longleaf pine trees. Forests 2023, 14, 494. [Google Scholar] [CrossRef]


Disclaimer/Publisher’s Note: The statements, opinions and data contained in all publications are solely those of the individual author(s) and contributor(s) and not of MDPI and/or the editor(s). MDPI and/or the editor(s) disclaim responsibility for any injury to people or property resulting from any ideas, methods, instructions or products referred to in the content. |
© 2023 by the authors. Licensee MDPI, Basel, Switzerland. This article is an open access article distributed under the terms and conditions of the Creative Commons Attribution (CC BY) license (https://creativecommons.org/licenses/by/4.0/).
Share and Cite
Chen, X.; Willis, J.L.; Guo, Q. Patterns of Water Consumption in Longleaf Pine Restoration Areas and the Relationship with Cone Production. Forests 2023, 14, 2081. https://doi.org/10.3390/f14102081
Chen X, Willis JL, Guo Q. Patterns of Water Consumption in Longleaf Pine Restoration Areas and the Relationship with Cone Production. Forests. 2023; 14(10):2081. https://doi.org/10.3390/f14102081
Chicago/Turabian StyleChen, Xiongwen, John L. Willis, and Qinfeng Guo. 2023. "Patterns of Water Consumption in Longleaf Pine Restoration Areas and the Relationship with Cone Production" Forests 14, no. 10: 2081. https://doi.org/10.3390/f14102081
APA StyleChen, X., Willis, J. L., & Guo, Q. (2023). Patterns of Water Consumption in Longleaf Pine Restoration Areas and the Relationship with Cone Production. Forests, 14(10), 2081. https://doi.org/10.3390/f14102081