
Future Reductions in Suitable Habitat for Key Tree Species Result in Declining Boreal Forest Aboveground Biomass Carbon in China

 ,
,  ,
,
Abstract
:1. Introduction
2. Materials and Methods
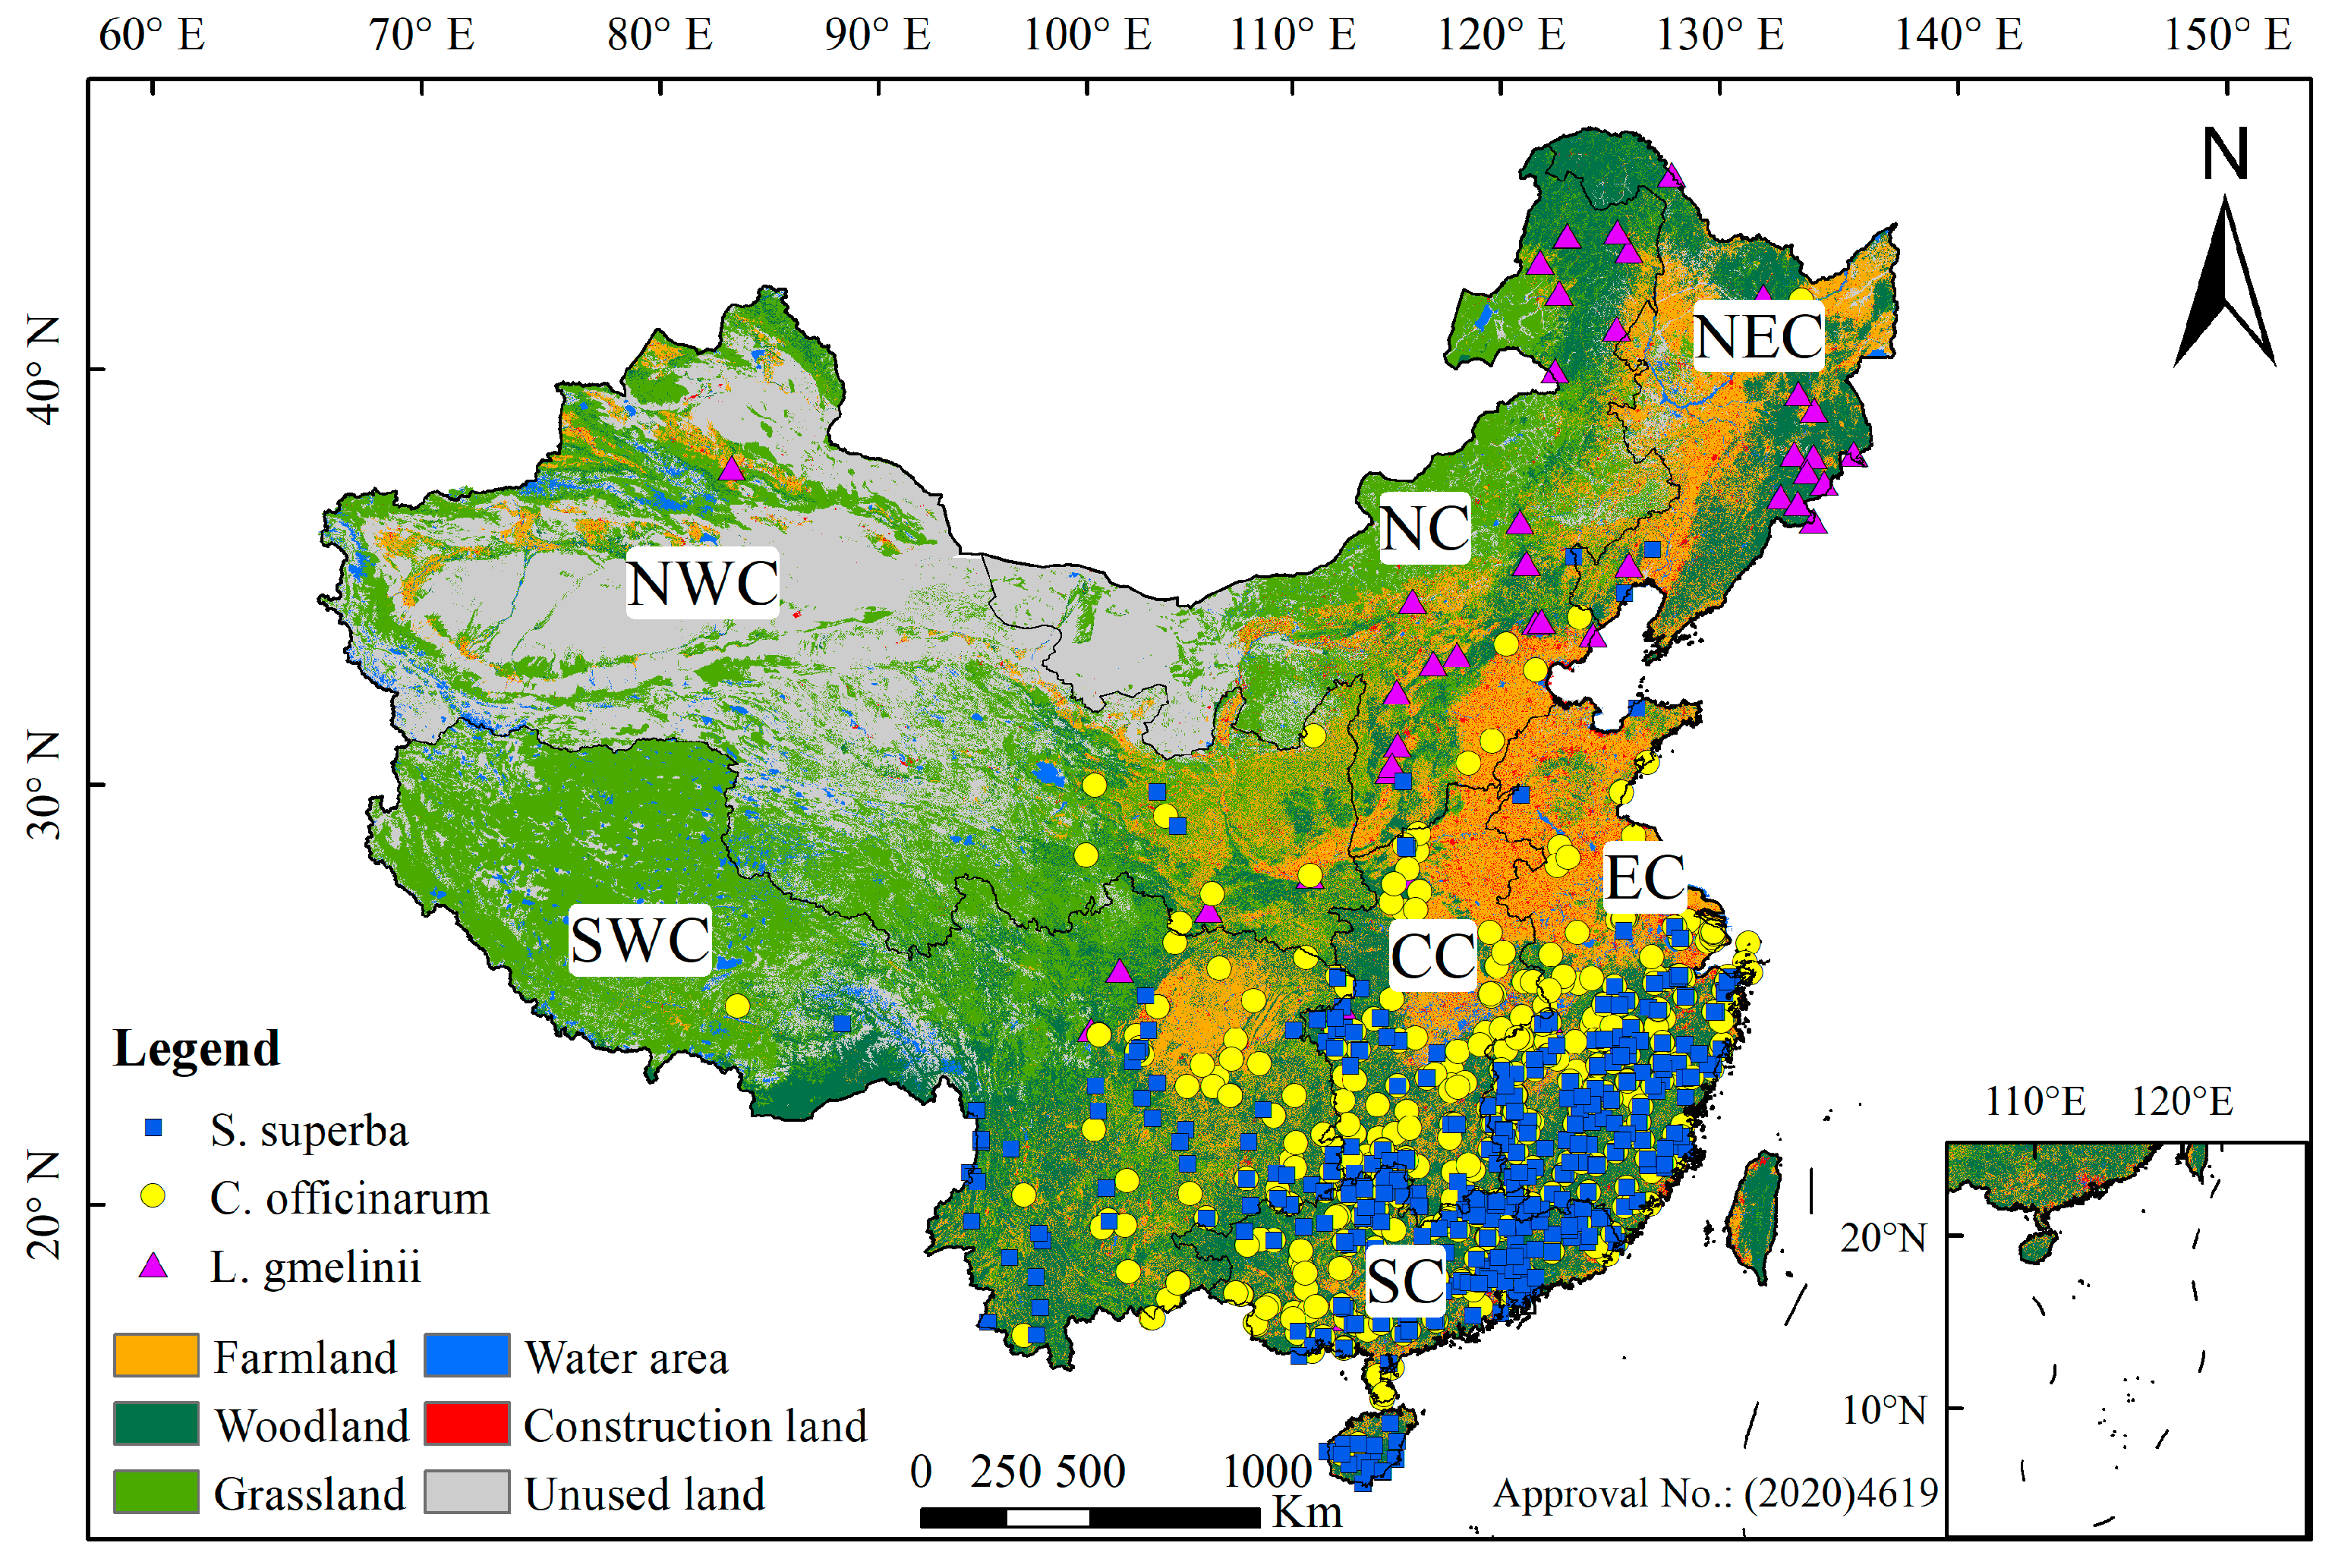
2.1. Study Area and Data Sources
2.2. Methods
2.2.1. LPJ-DGVM
2.2.2. MaxEnt Model
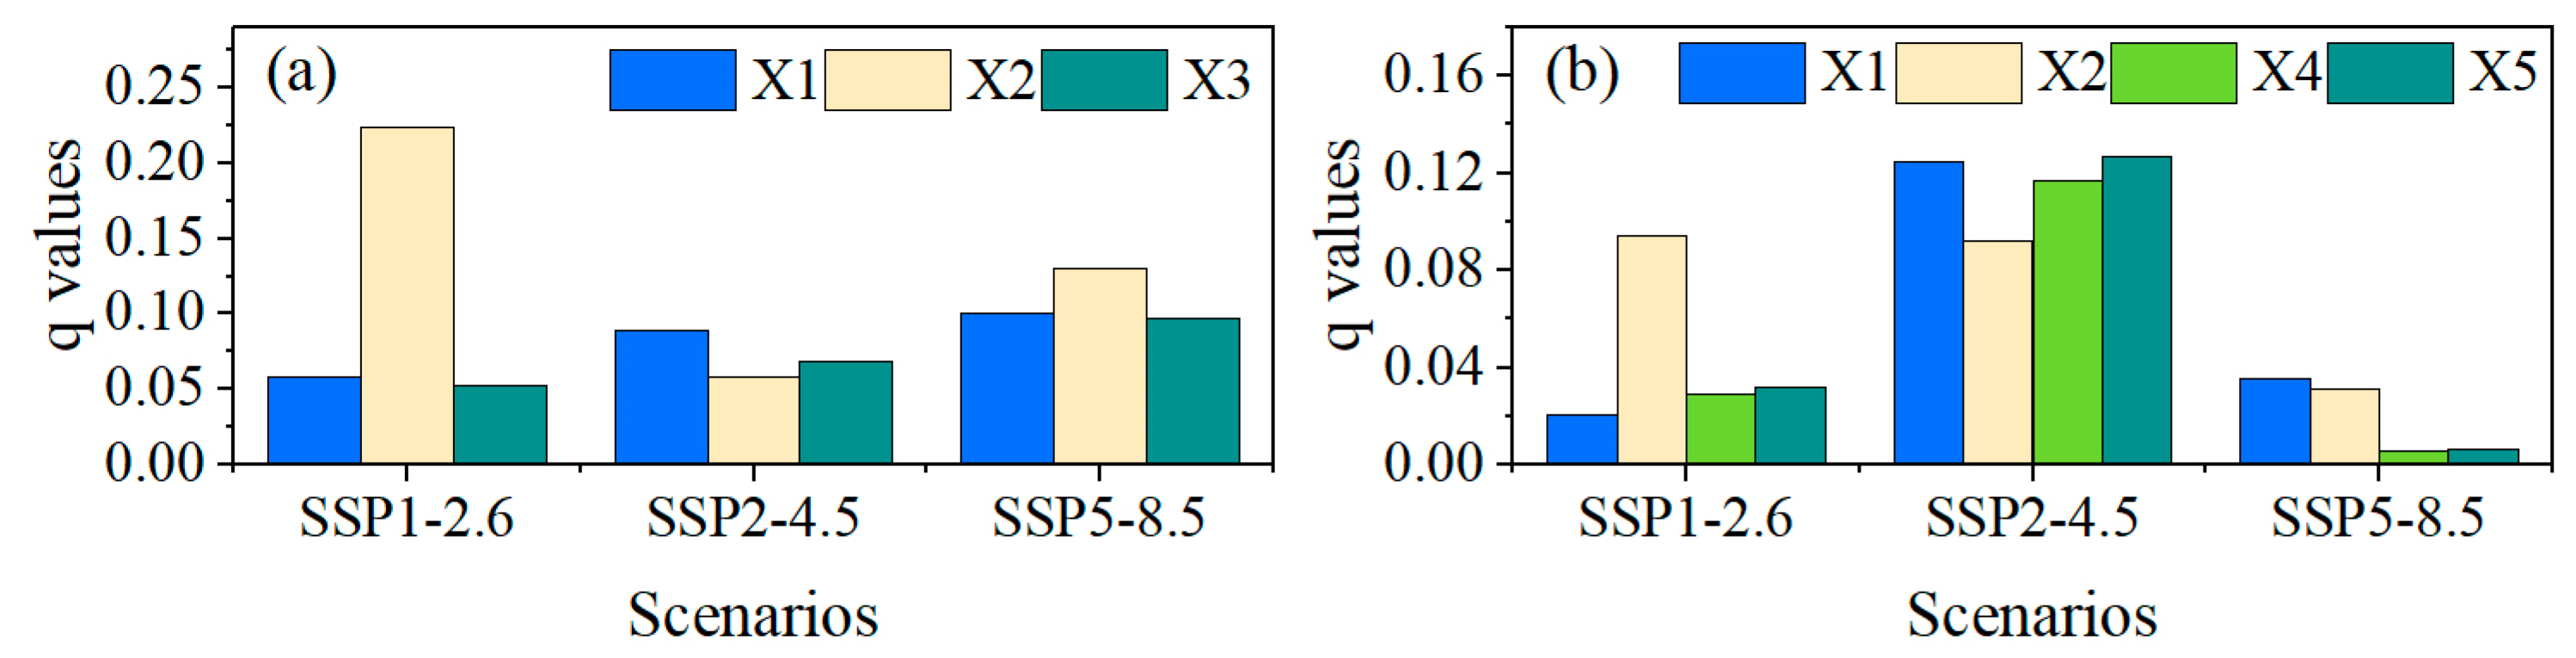
2.2.3. Statistical Methods
3. Results
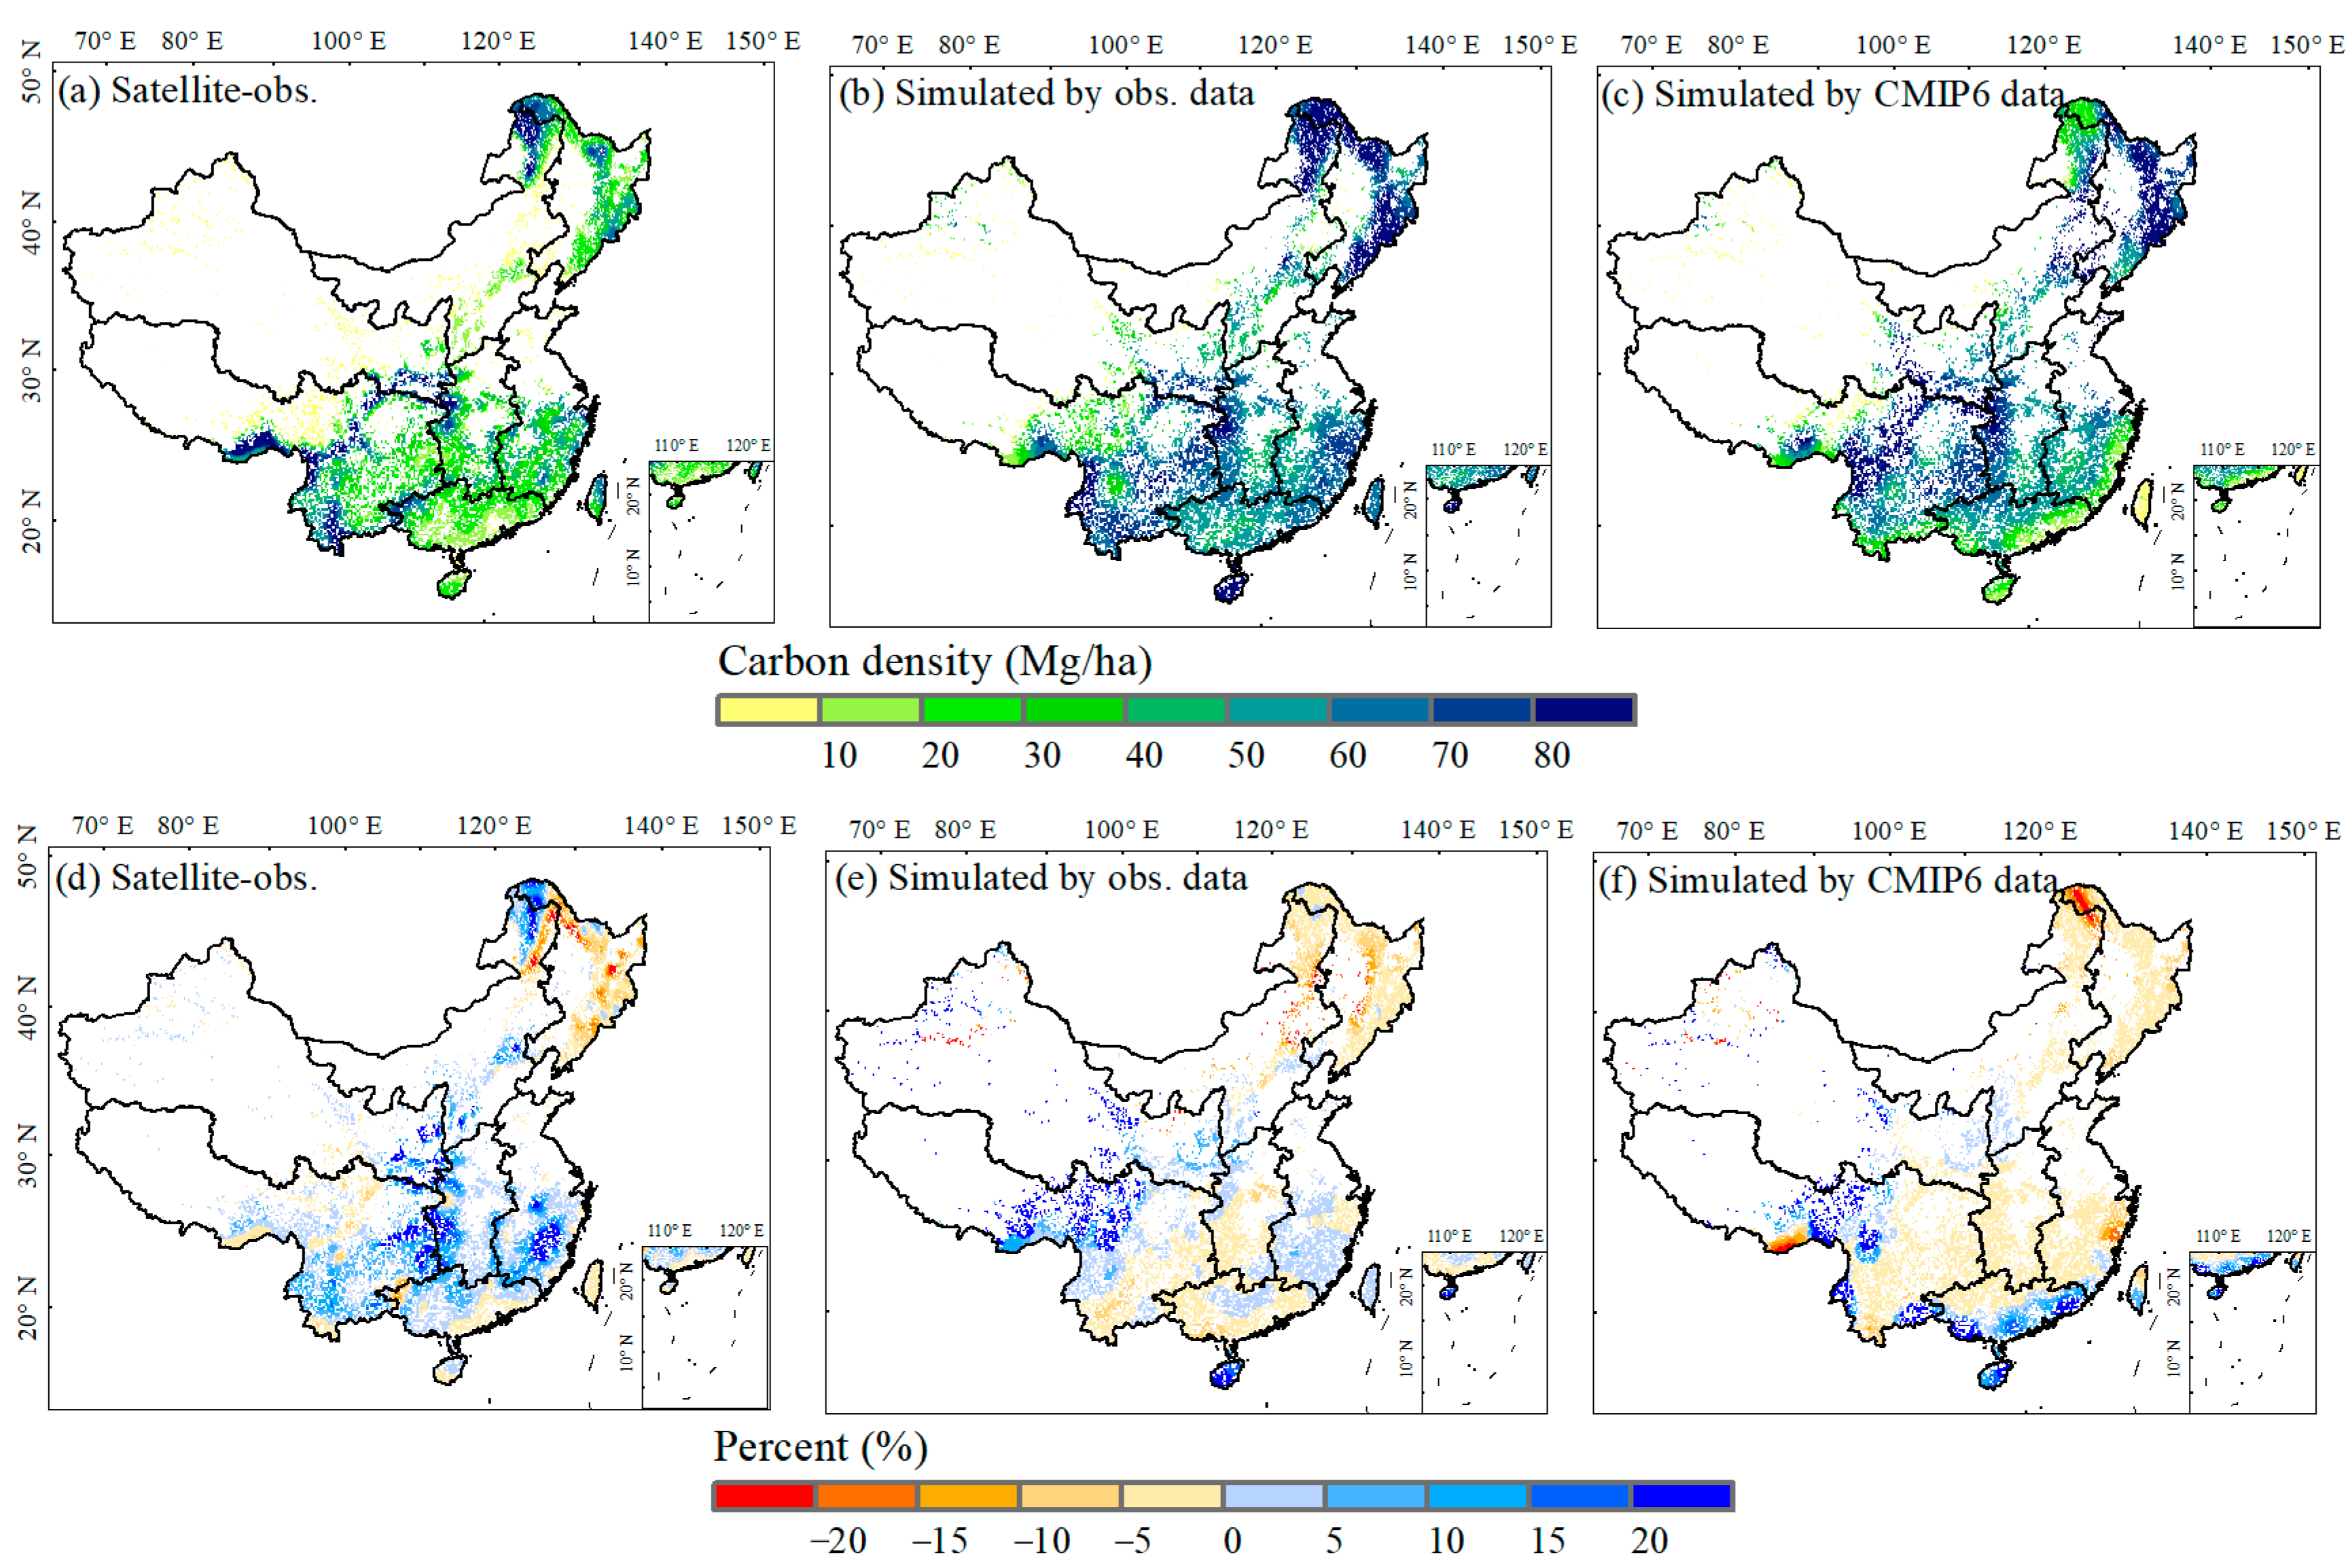
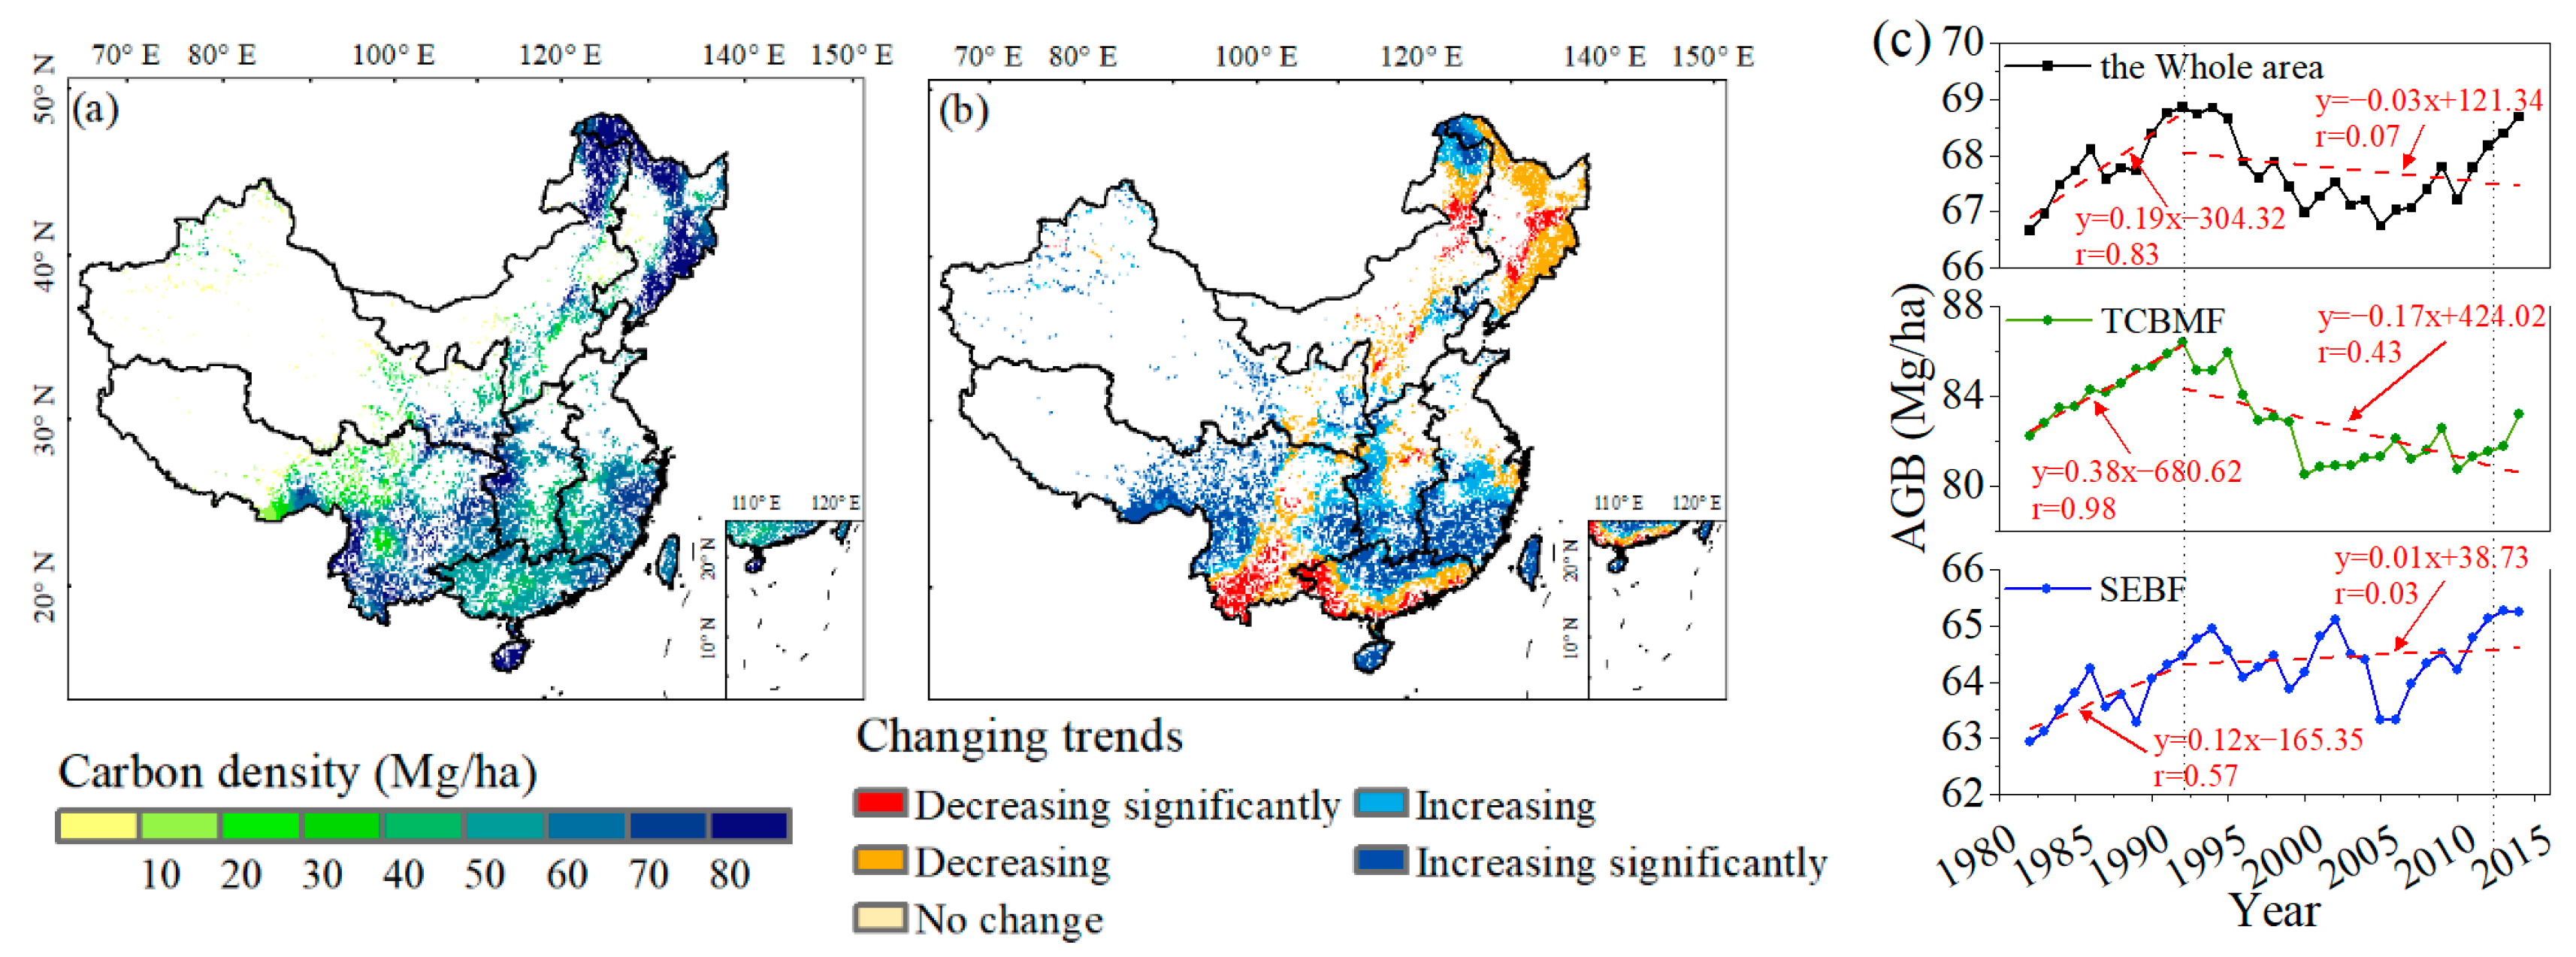
3.1. Satellite-Observed and Simulated Forest ABC in China
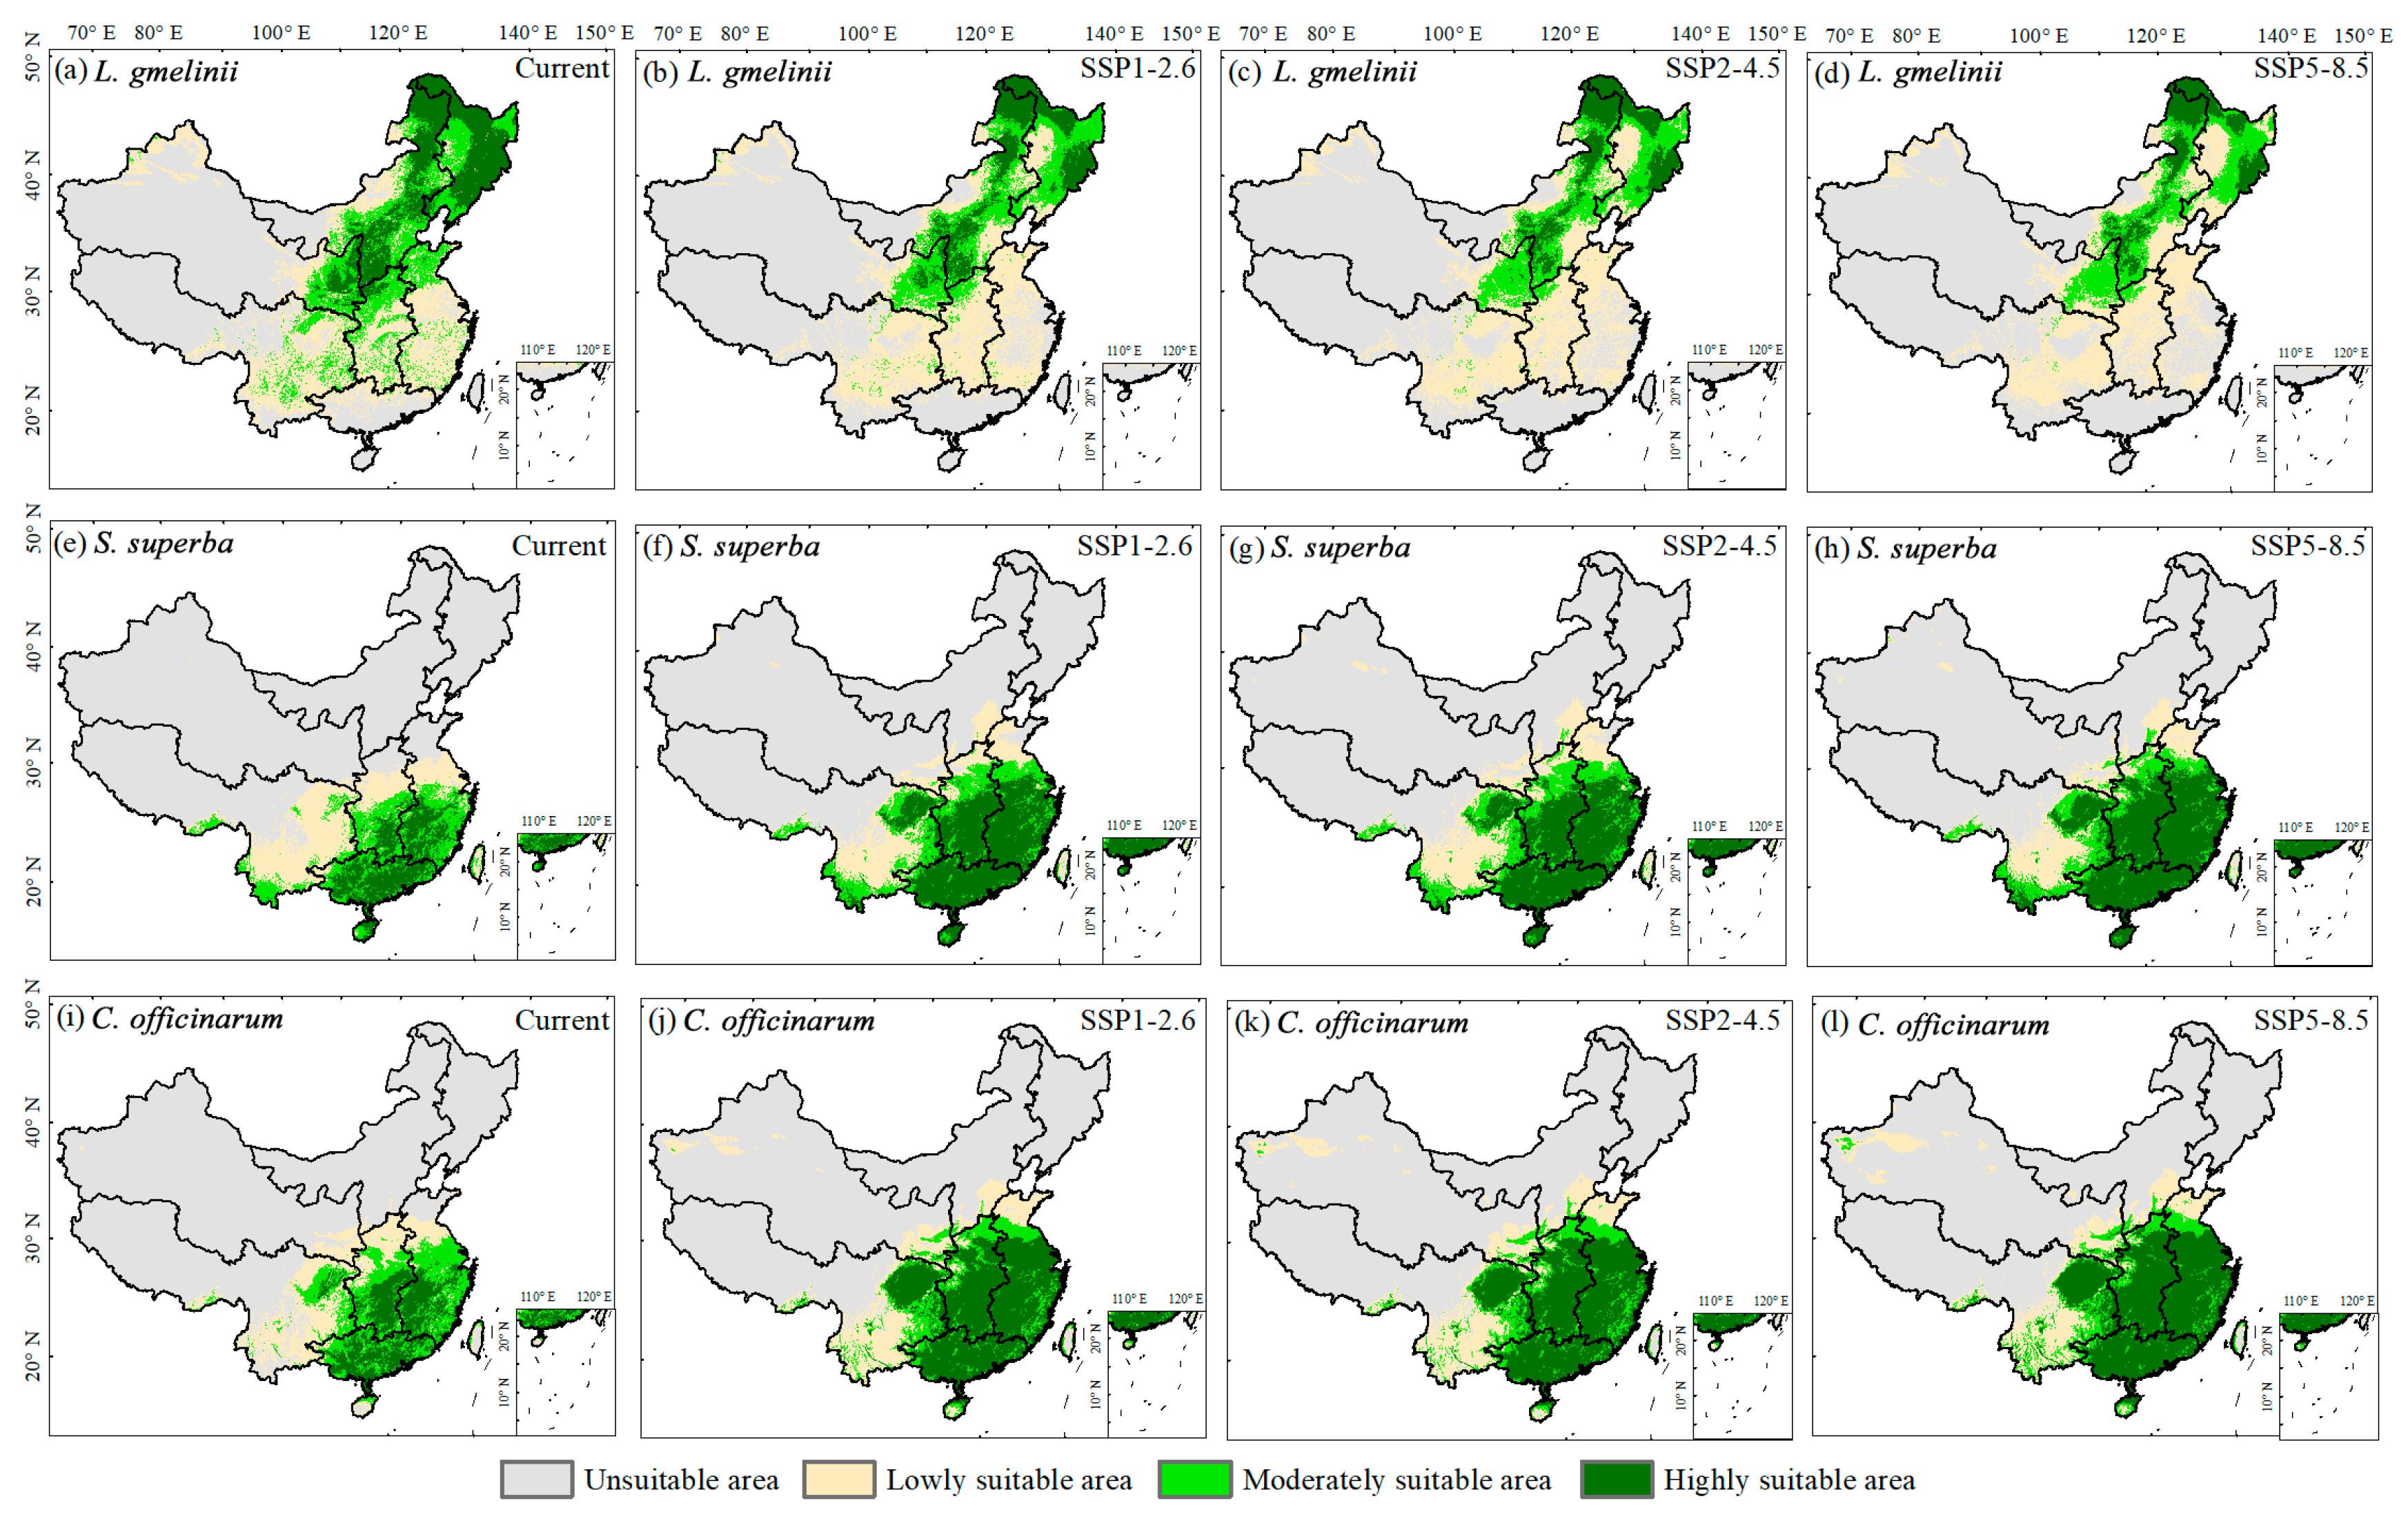
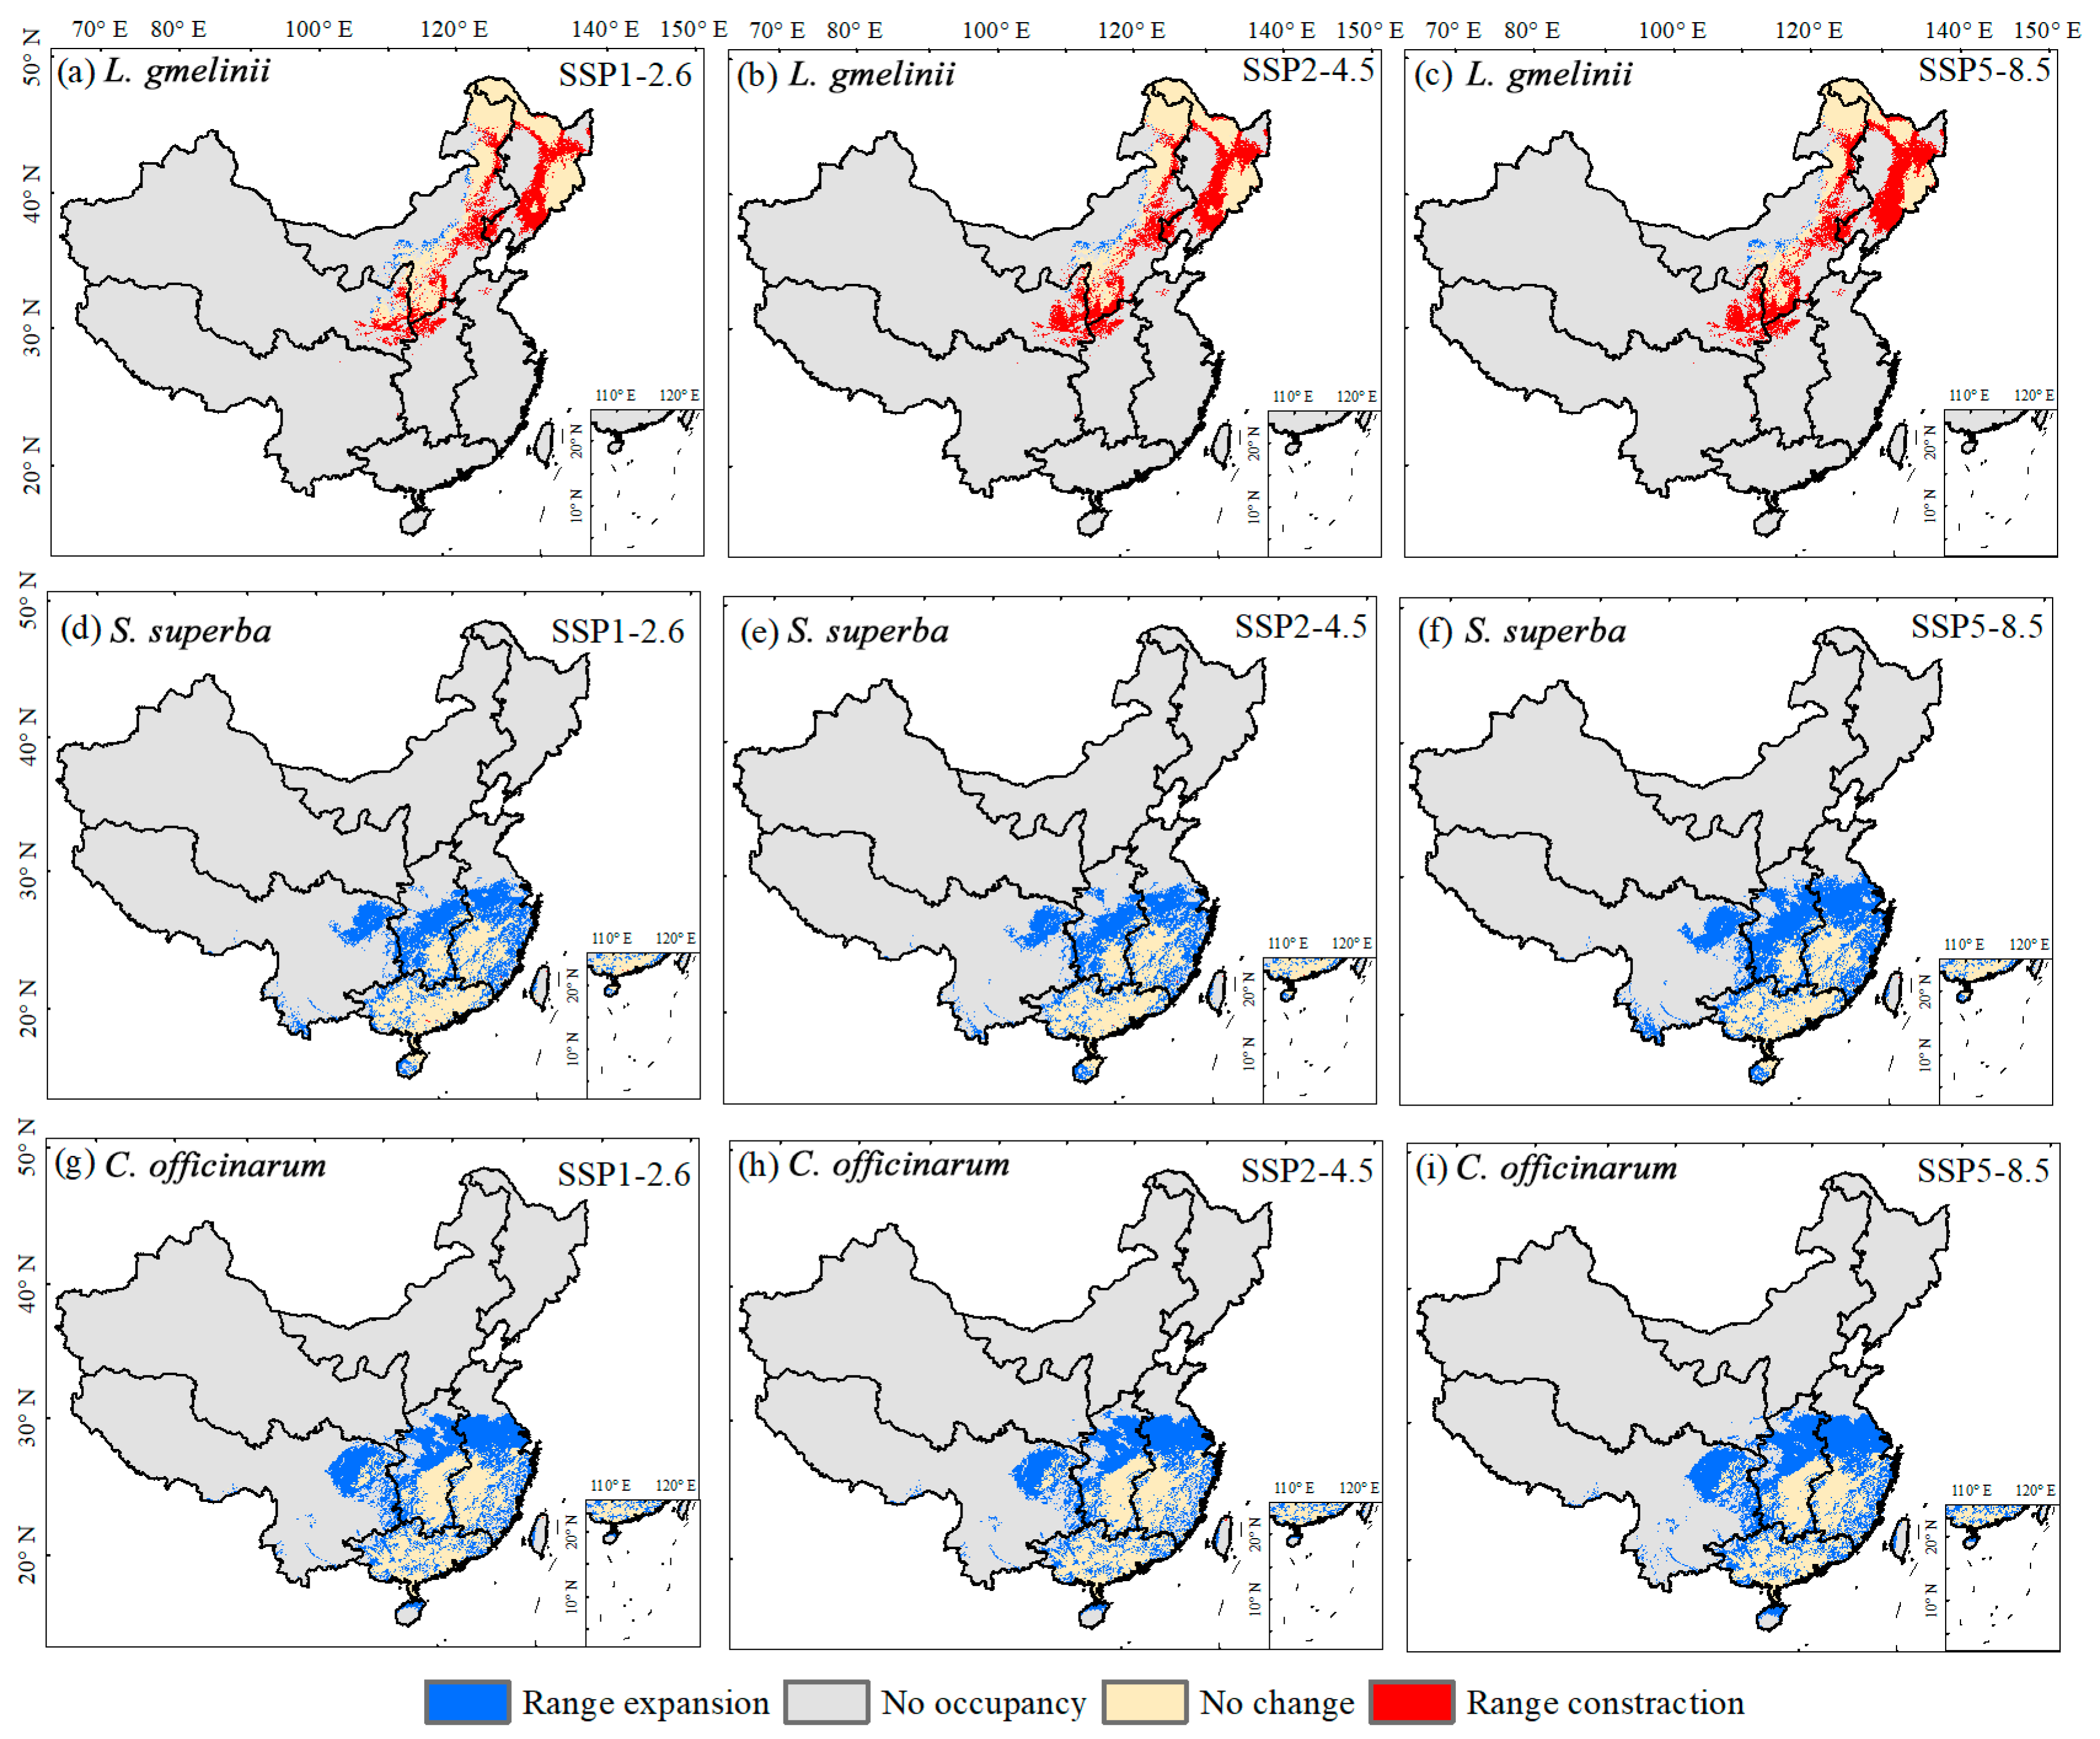
3.2. Potential Suitable Area Shifts of Typical Tree Species in Response to Climate Change
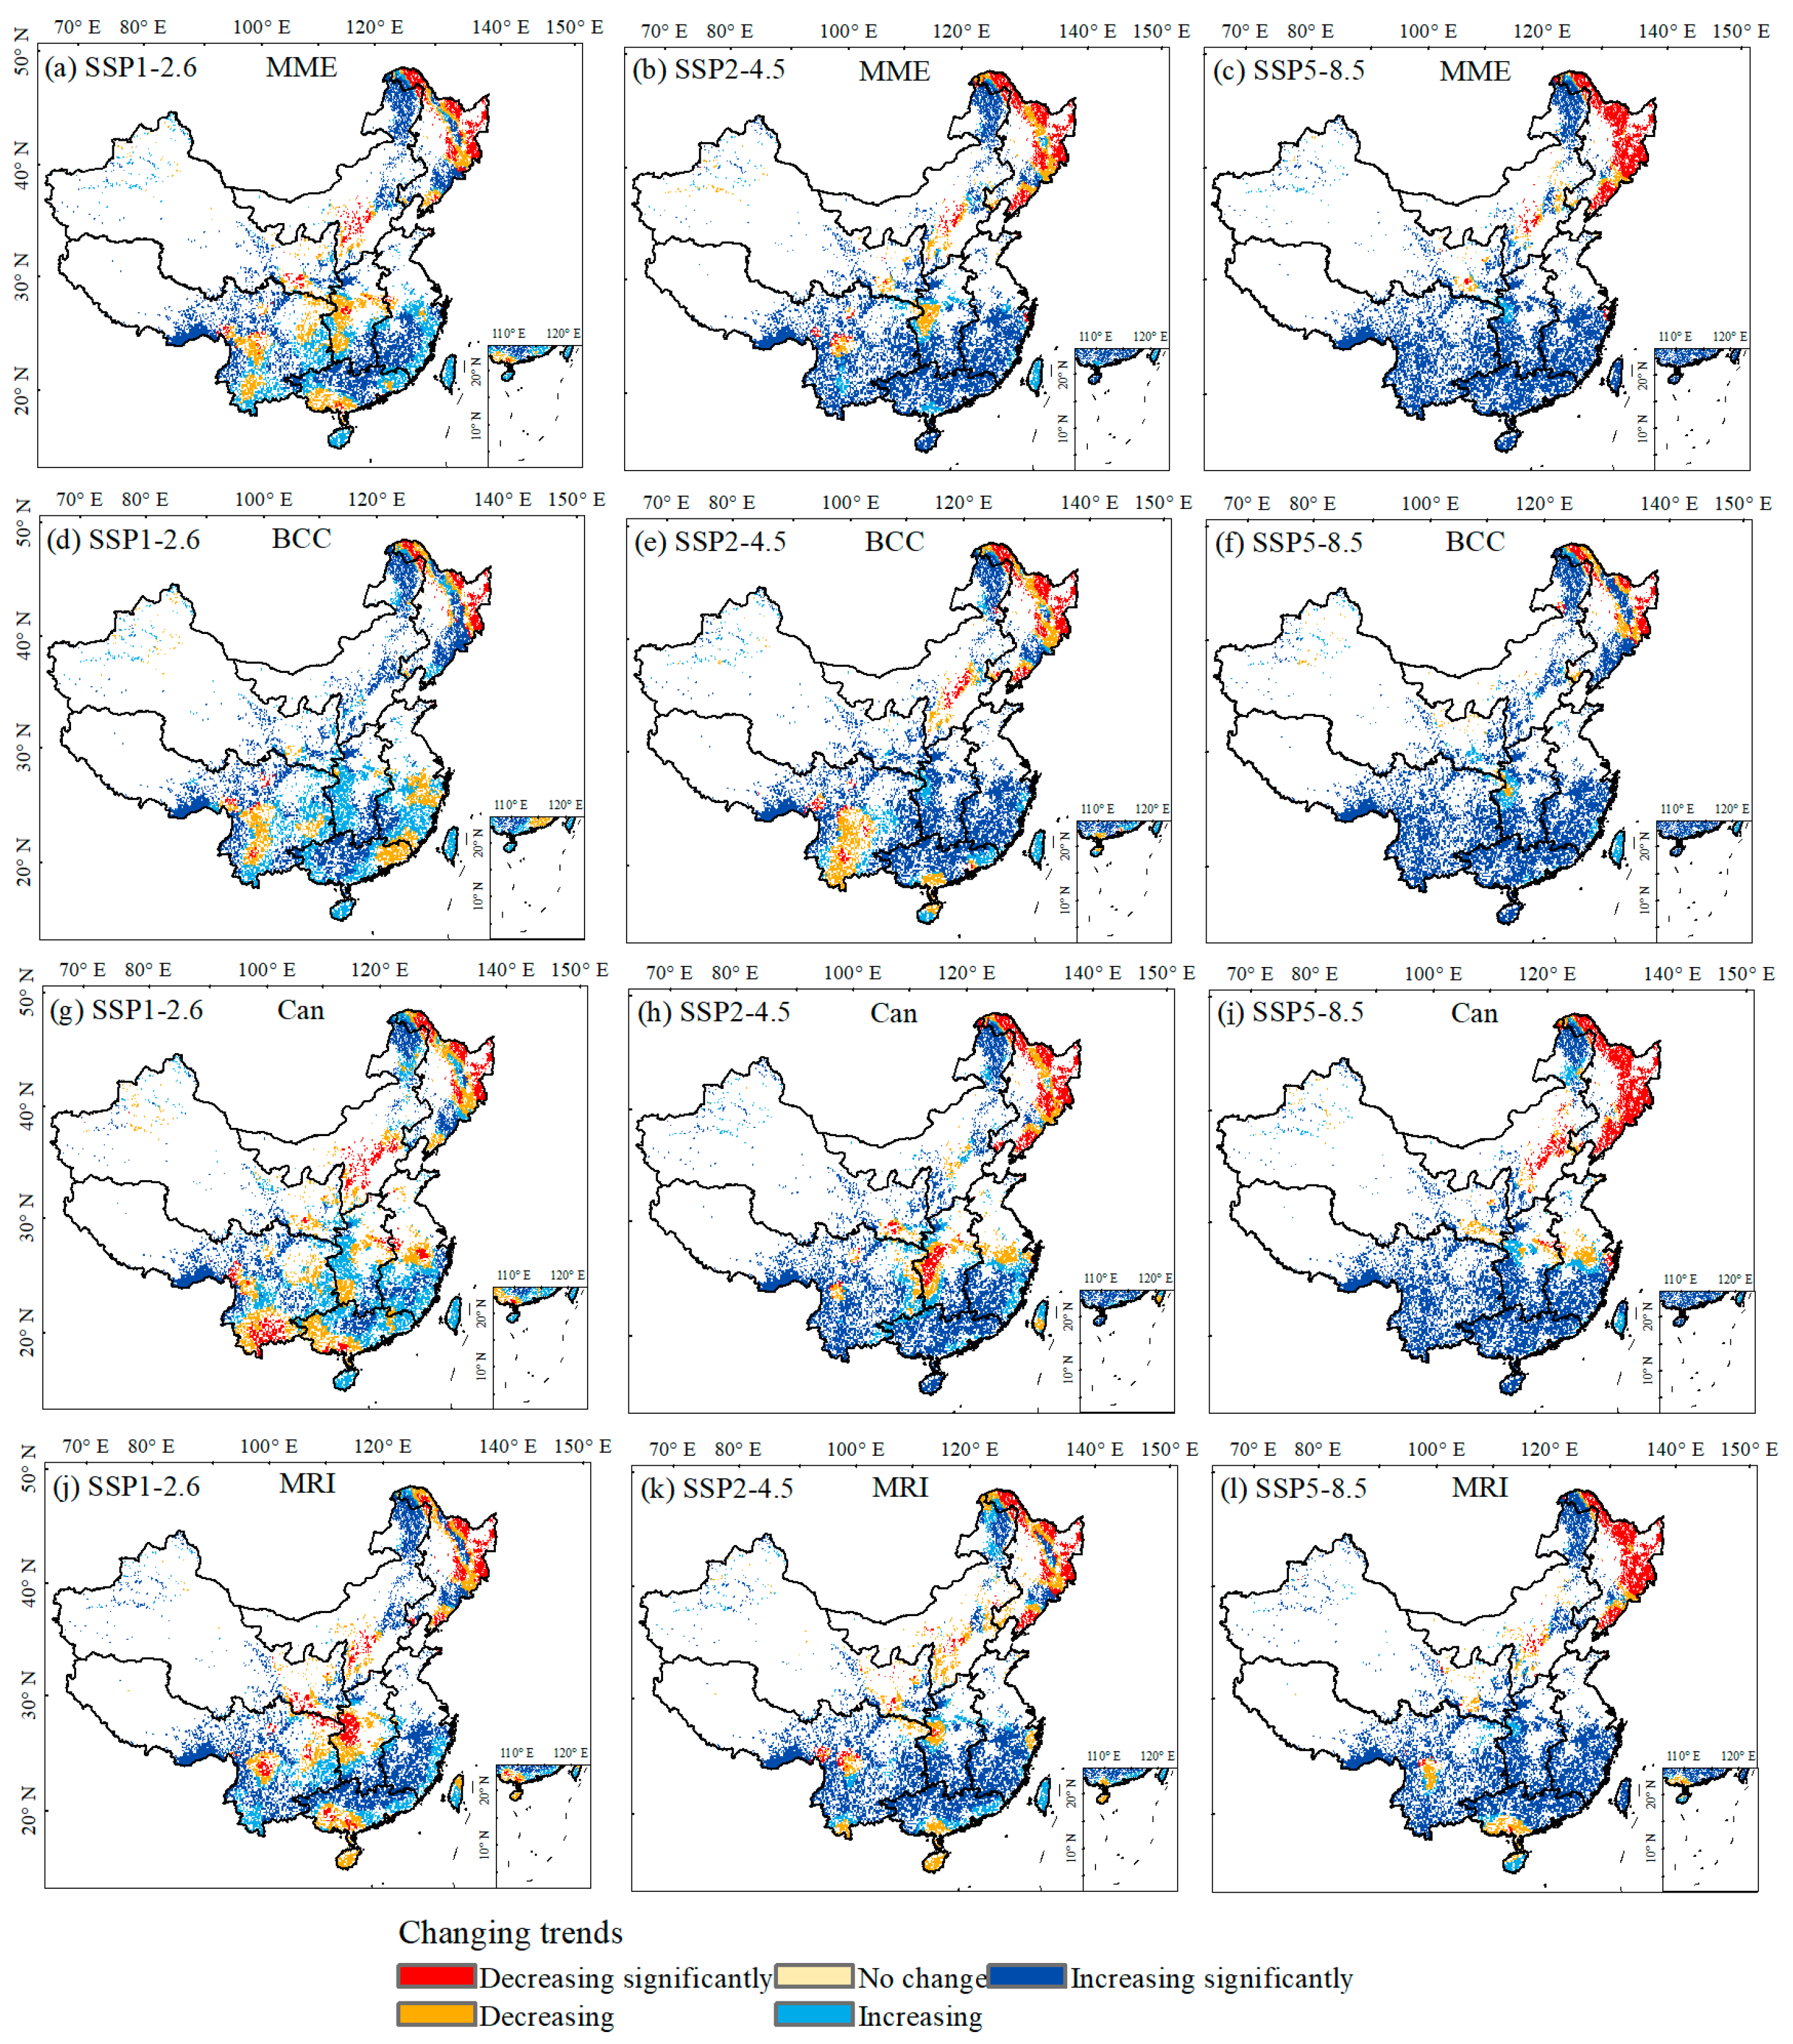
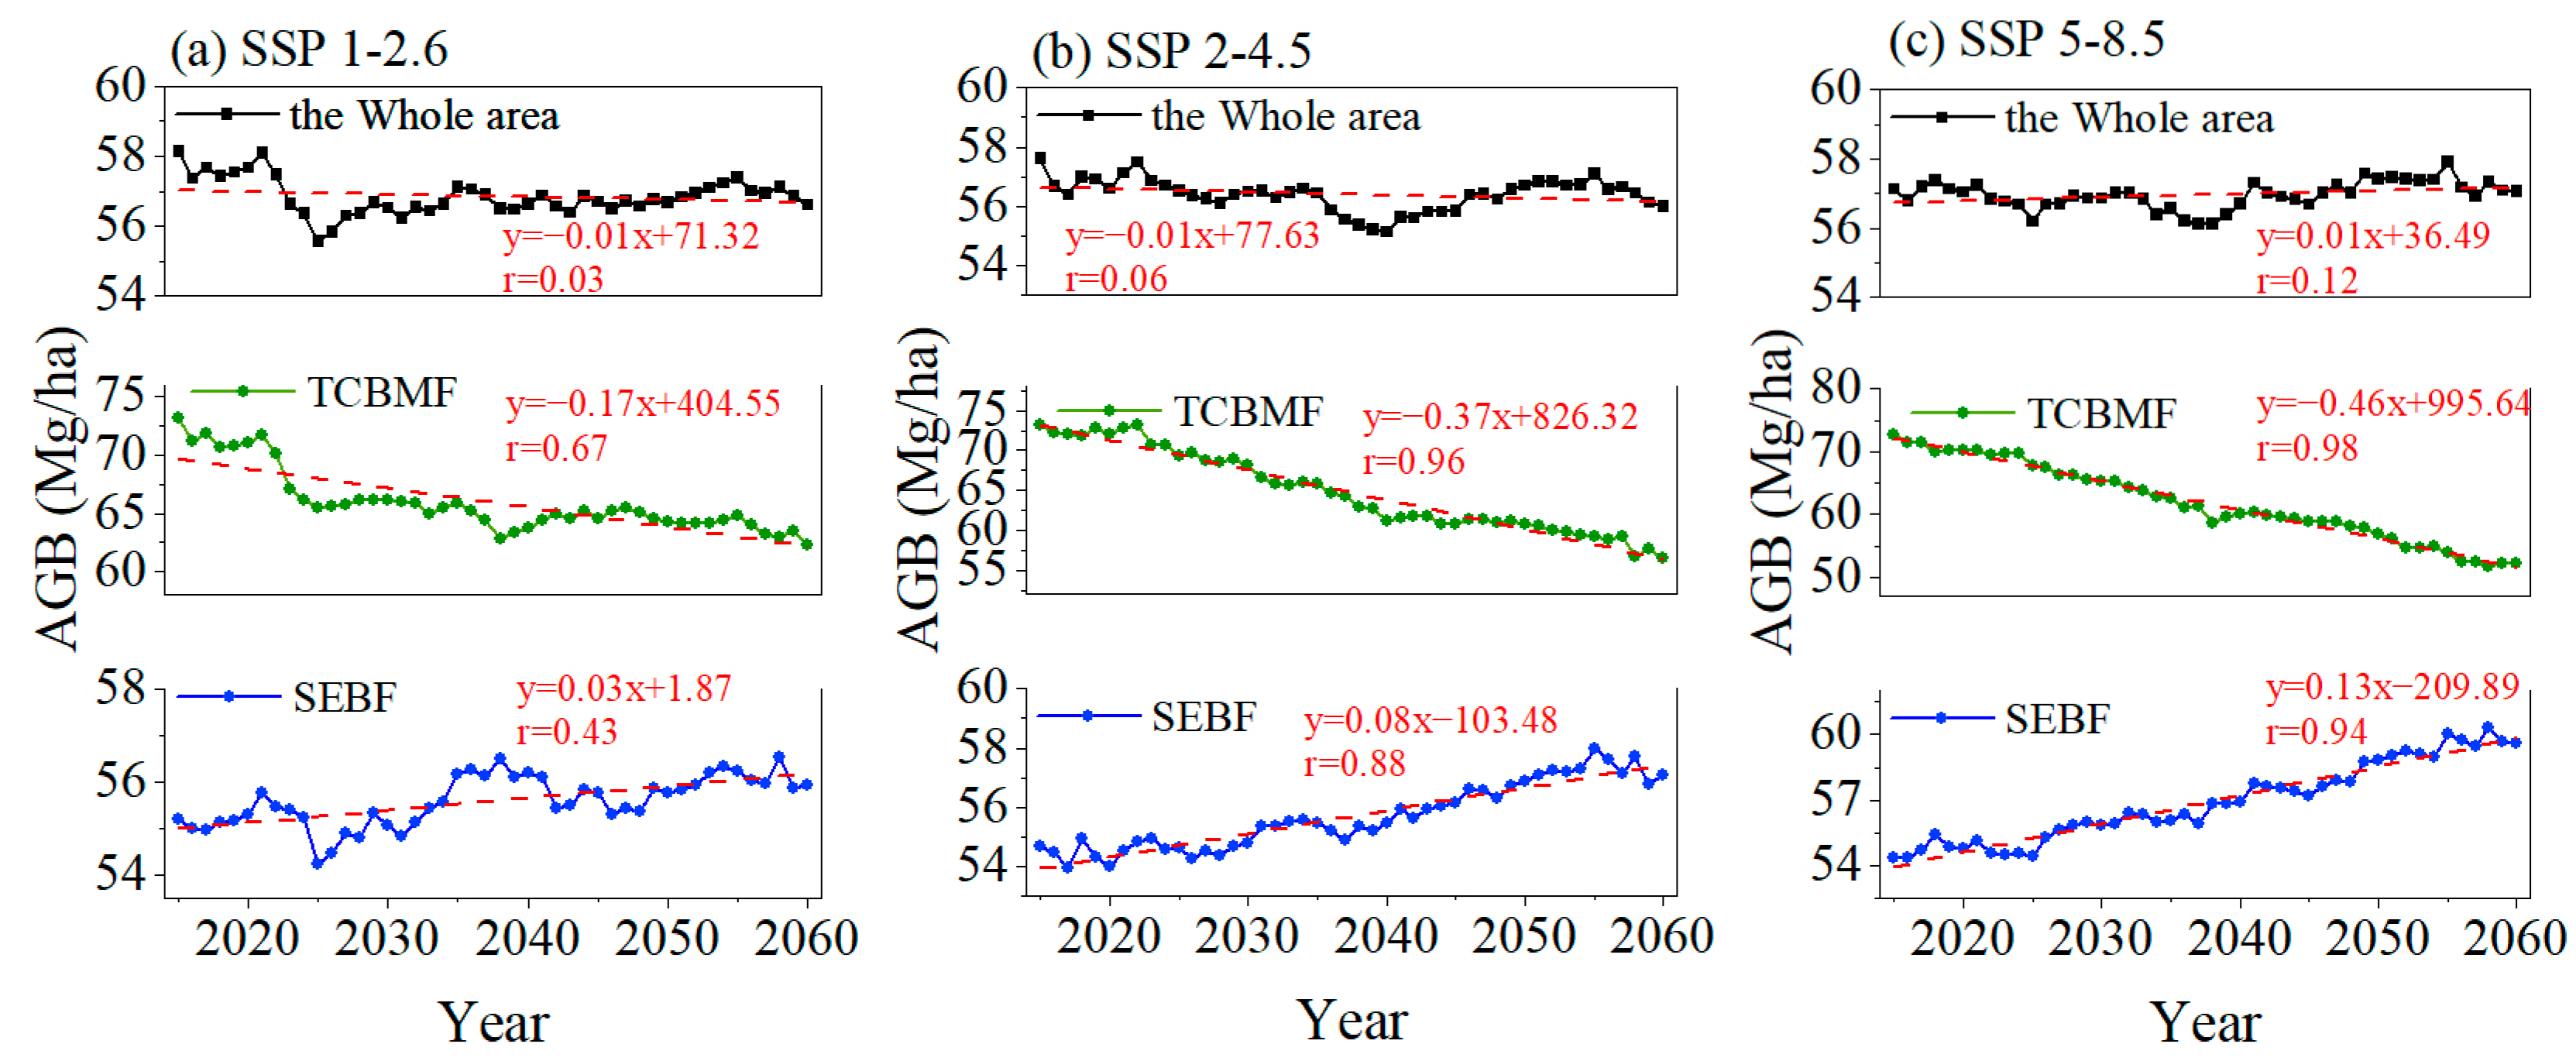
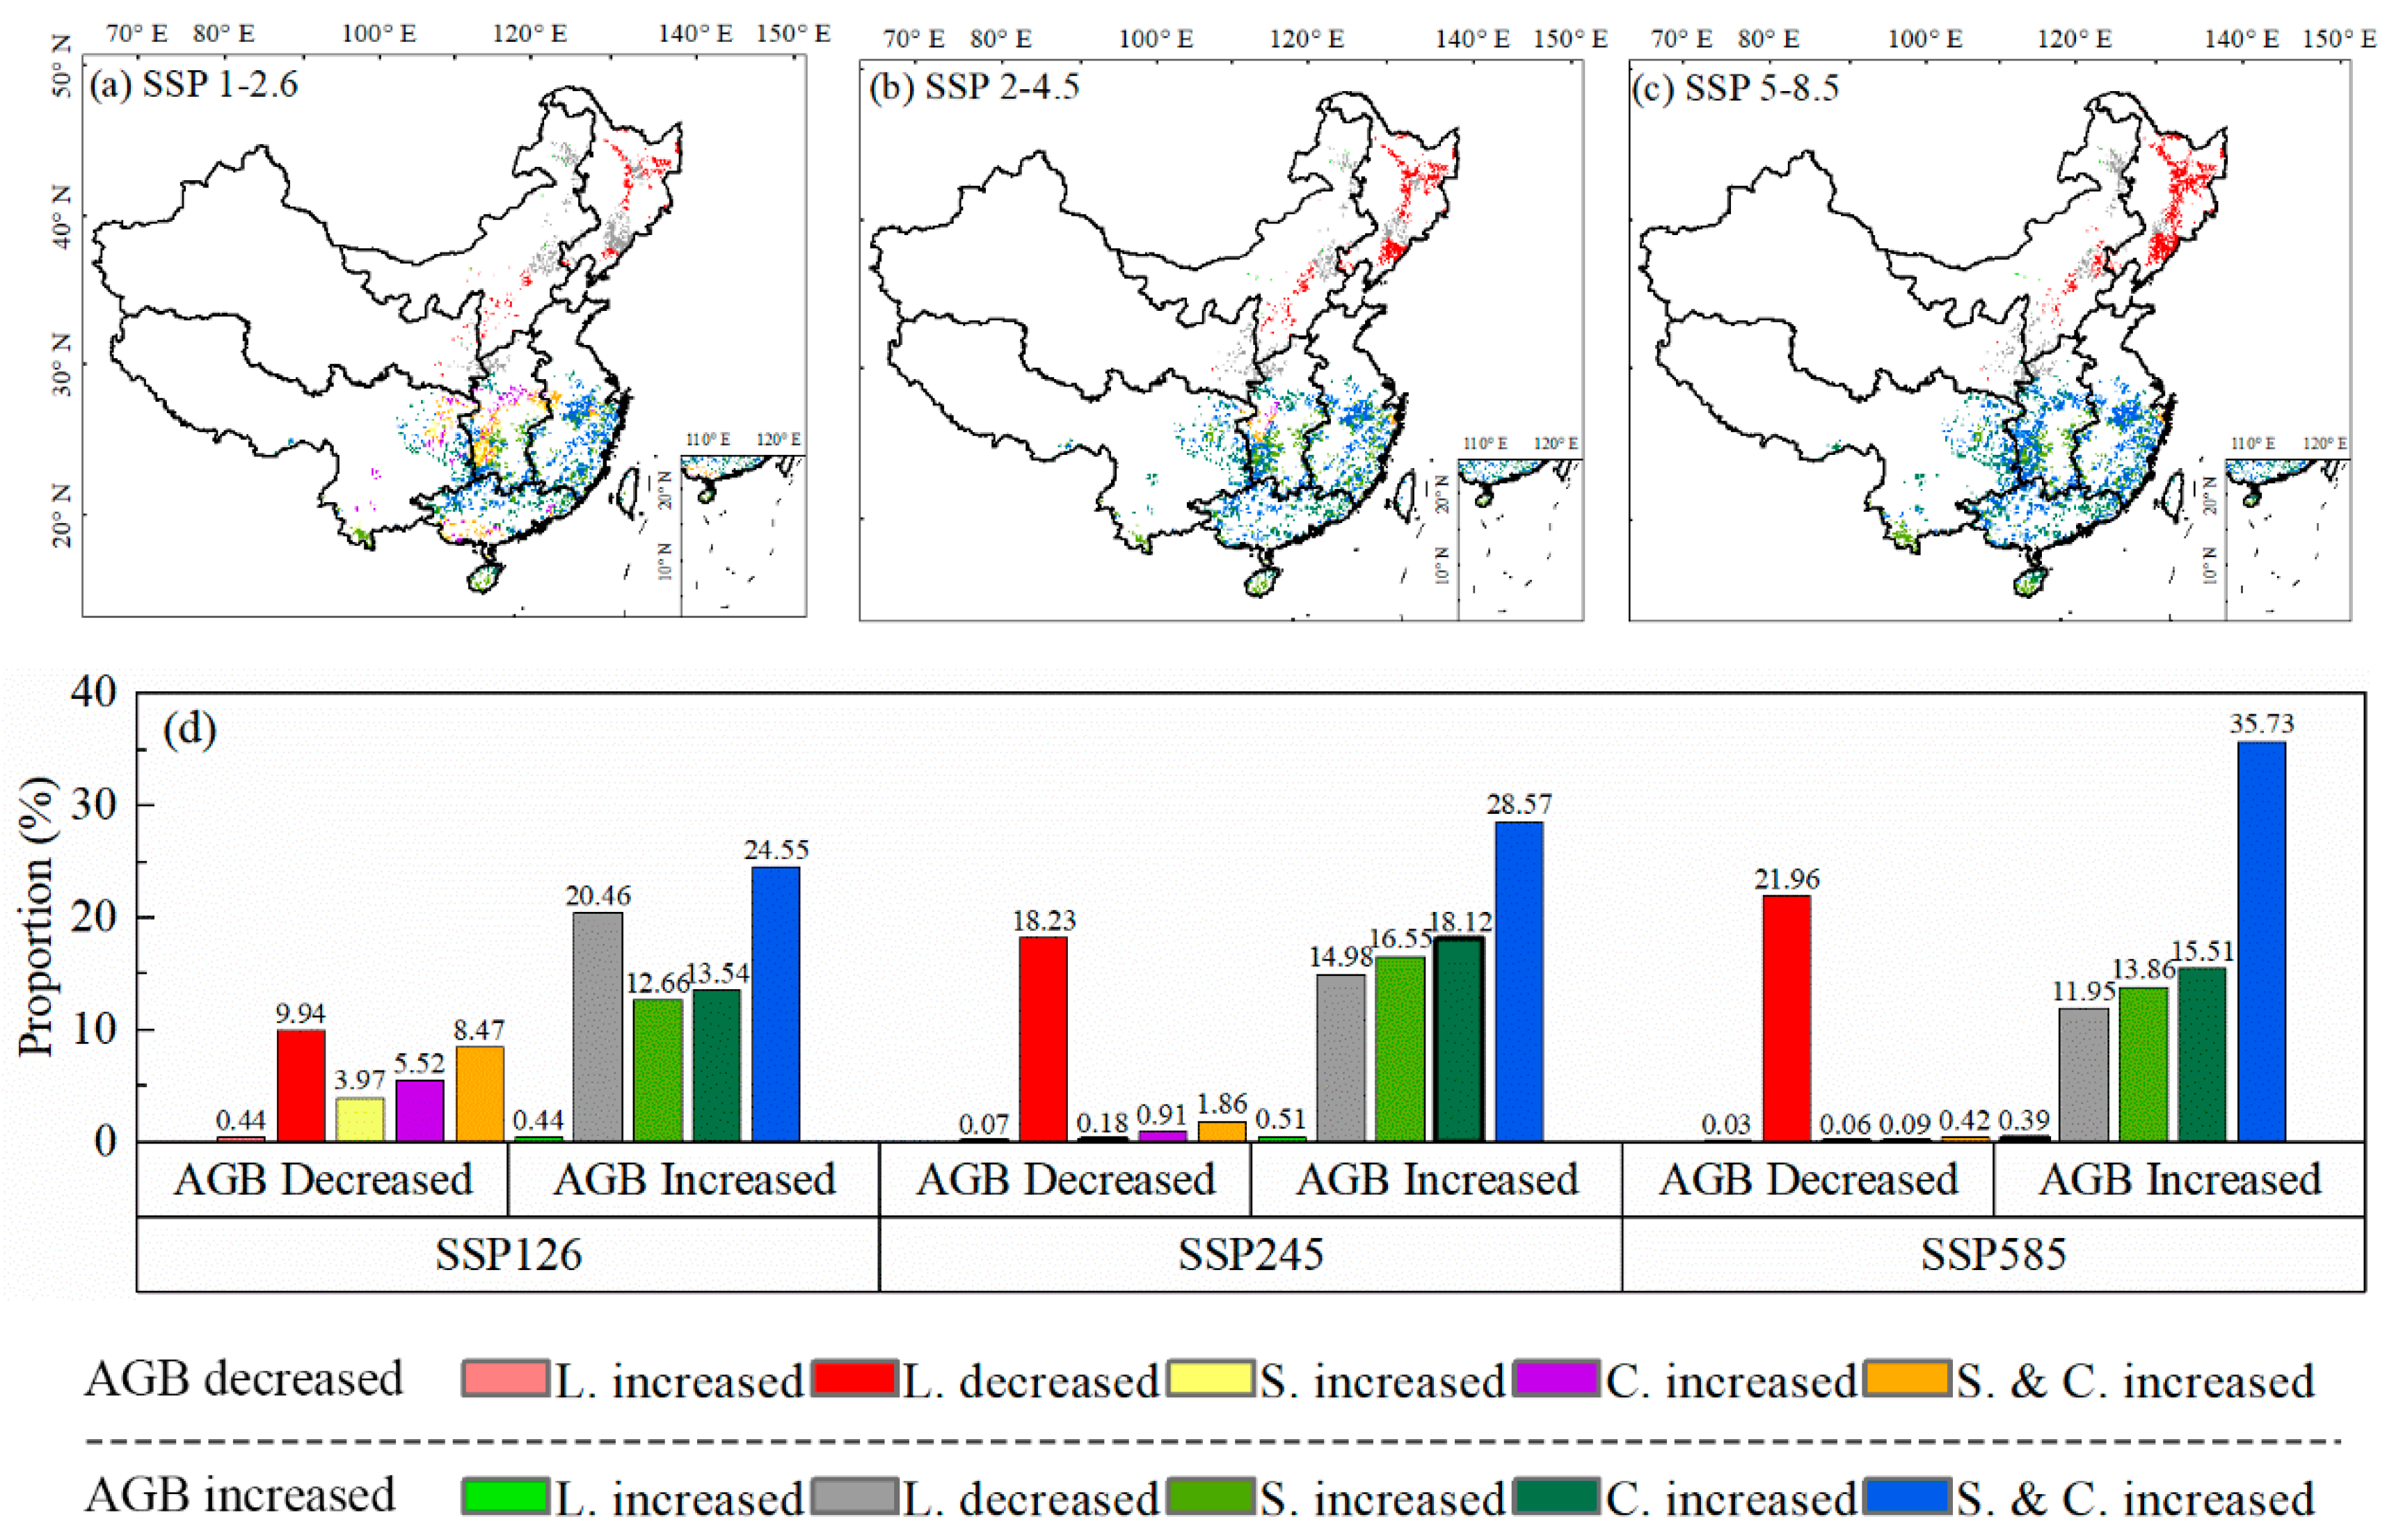
3.3. Coupling Impacts of Climate and Species’ Suitable Area Change on Forest ABC
4. Discussion
5. Conclusions
Supplementary Materials
Author Contributions
Funding
Data Availability Statement
Acknowledgments
Conflicts of Interest
References
- Tang, X.; Zhao, X.; Bai, Y.; Tang, Z.; Wang, W.; Zhao, Y.; Wan, H.; Xie, Z.; Shi, X.; Wu, B.; et al. Carbon Pools in China’s Terrestrial Ecosystems: New Estimates Based on an Intensive Field Survey. Proc. Natl. Acad. Sci. USA 2018, 115, 4021–4026. [Google Scholar] [CrossRef] [PubMed]
- Kong, R.; Zhang, Z.; Huang, R.; Tian, J.; Feng, R.; Chen, X. Projected Global Warming-Induced Terrestrial Ecosystem Carbon across China under SSP Scenarios. Ecol. Indic. 2022, 139, 108963. [Google Scholar] [CrossRef]
- Cairns, M.A.; Brown, S.; Helmer, E.H.; Baumgardner, G.A. Root Biomass Allocation in the World’s Upland Forests. Oecologia 1997, 111, 1–11. [Google Scholar] [CrossRef] [PubMed]
- Ma, H.; Mo, L.; Crowther, T.W.; Maynard, D.S.; Van Den Hoogen, J.; Stocker, B.D.; Terrer, C.; Zohner, C.M. The Global Distribution and Environmental Drivers of Aboveground versus Belowground Plant Biomass. Nat. Ecol. Evol. 2021, 5, 1110–1122. [Google Scholar] [CrossRef]
- Green, J.K.; Keenan, T.F. The Limits of Forest Carbon Sequestration. Science 2022, 376, 692–693. [Google Scholar] [CrossRef]
- Chen, Y.; Feng, X.; Fu, B.; Ma, H.; Zohner, C.M.; Crowther, T.W.; Huang, Y.; Wu, X.; Wei, F. Maps with 1km Resolution Reveal Increases in Above- and Belowground Forest Biomass Carbon Pools in China over the Past 20 Years. Earth Syst. Sci. Data 2023, 15, 897–910. [Google Scholar] [CrossRef]
- Kumar, L.; Mutanga, O. Remote Sensing of Above-Ground Biomass. Remote Sens. 2017, 9, 935. [Google Scholar] [CrossRef]
- He, H.; Wang, S.; Zhang, L.; Wang, J.; Ren, X.; Zhou, L.; Piao, S.; Yan, H.; Ju, W.; Gu, F.; et al. Altered Trends in Carbon Uptake in China’s Terrestrial Ecosystems under the Enhanced Summer Monsoon and Warming Hiatus. Natl. Sci. Rev. 2019, 6, 505–514. [Google Scholar] [CrossRef]
- Zhang, D.; Zhao, Y.; Wu, J. Assessment of Carbon Balance Attribution and Carbon Storage Potential in China’s Terrestrial Ecosystem. Resour. Conserv. Recycl. 2023, 189, 106748. [Google Scholar] [CrossRef]
- Tong, X.; Brandt, M.; Yue, Y.; Horion, S.; Wang, K.; Keersmaecker, W.D.; Tian, F.; Schurgers, G.; Xiao, X.; Luo, Y.; et al. Increased Vegetation Growth and Carbon Stock in China Karst via Ecological Engineering. Nat. Sustain. 2018, 1, 44–50. [Google Scholar] [CrossRef]
- Sitch, S.; Smith, B.; Prentice, I.C.; Arneth, A.; Bondeau, A.; Cramer, W.; Kaplan, J.O.; Levis, S.; Lucht, W.; Sykes, M.T.; et al. Evaluation of Ecosystem Dynamics, Plant Geography and Terrestrial Carbon Cycling in the LPJ Dynamic Global Vegetation Model: Lpj Dynamic Global Vegetation Model. Glob. Change Biol. 2003, 9, 161–185. [Google Scholar] [CrossRef]
- Bondeau, A.; Smith, P.C.; Zaehle, S.; Schaphoff, S.; Lucht, W.; Cramer, W.; Gerten, D.; Lotze-Campen, H.; Mueller, C.; Reichstein, M.; et al. Modelling the Role of Agriculture for the 20th Century Global Terrestrial Carbon Balance. Glob. Change Biol. 2007, 13, 679–706. [Google Scholar] [CrossRef]
- Zhao, S.; Yan, X.; Yang, S.; Tao, D.; Dai, L. Simulating Responses of Northeastern China Forests to Potential Climate Change. J. For. Res. 1998, 9, 166–172. [Google Scholar] [CrossRef]
- Shao, G. Sensitivities of Species Compositions of the Mixed Forest in Eastern Eurasian Continent to Climate Change. Glob. Planet. Chang. 2003, 37, 307–313. [Google Scholar] [CrossRef]
- He, H.S.; Hao, Z.; Mladenoff, D.J.; Shao, G.; Hu, Y.; Chang, Y. Simulating Forest Ecosystem Response to Climate Warming Incorporating Spatial Effects in North-Eastern China. J. Biogeogr. 2005, 32, 2043–2056. [Google Scholar] [CrossRef]
- Li, G.-Q.; Fan, B.A.I.; Wei-Guo, S. Different Responses of Radial Growth to Climate Warming in Pinus Koraiensis and Picea Jezoensis Var. Komarovii at Their Upper Elevational Limits in Changbai Mountain, China. Chin. J. Plant Ecol. 2011, 35, 500. [Google Scholar] [CrossRef]
- Yu, D.; Wang, Q.; Wang, Y.; Zhou, W.; Ding, H.; Fang, X.; Jiang, S.; Dai, L. Climatic Effects on Radial Growth of Major Tree Species on Changbai Mountain. Ann. For. Sci. 2011, 68, 921. [Google Scholar] [CrossRef]
- Dai, L.; Jia, J.; Yu, D.; Lewis, B.J.; Zhou, L.; Zhou, W.; Zhao, W.; Jiang, L. Effects of Climate Change on Biomass Carbon Sequestration in Old-Growth Forest Ecosystems on Changbai Mountain in Northeast China. For. Ecol. Manag. 2013, 300, 106–116. [Google Scholar] [CrossRef]
- Wang, M.; Guan, Q. Prediction of Potential Suitable Areas for Broussonetia Papyrifera in China Using the MaxEnt Model and CIMP6 Data. J. Plant Ecol. 2023, 16, rtad006. [Google Scholar] [CrossRef]
- Fang, J.; Chen, A.; Peng, C.; Zhao, S.; Ci, L. Changes in Forest Biomass Carbon Storage in China Between 1949 and 1998. Science 2001, 292, 2320–2322. [Google Scholar] [CrossRef]
- He, X.; Burgess, K.S.; Gao, L.-M.; Li, D.-Z. Distributional Responses to Climate Change for Alpine Species of Cyananthus and Primula Endemic to the Himalaya-Hengduan Mountains. Plant Divers. 2019, 41, 26–32. [Google Scholar] [CrossRef]
- Rivas, C.A.; Navarro-Cerillo, R.M.; Johnston, J.C.; Guerrero-Casado, J. Dry Forest Is More Threatened but Less Protected than Evergreen Forest in Ecuador’s Coastal Region. Environ. Conserv. 2020, 47, 79–83. [Google Scholar] [CrossRef]
- Zhang, H.; Xiao, Y.; Huang, F. Estimated Carbon Storage and Economic Value on the Mostly Forest Ecosystem in Hunan Province. In The Dynamics of Urban Agglomeration in China: Preferences of Energy-Saving and Environment-Friendly Society; Zhang, H., Zhang, H., Eds.; Aussino Academic Publishing House: Marrickville, Australia, 2009; p. 137. [Google Scholar]
- Zhang, K.; Gong, Y.; Fa, H.; Zhao, M. CO2 Flux Characteristics of Different Plant Communities in a Subtropical Urban Ecosystem. Sustainability 2019, 11, 4879. [Google Scholar] [CrossRef]
- Jiang, S.; Guo, X.; Zhao, P.; Liang, H. Radial Growth–Climate Relationship Varies with Spatial Distribution of Schima Superba Stands in Southeast China’s Subtropical Forests. Forests 2023, 14, 1291. [Google Scholar] [CrossRef]
- Tian, J.; Zhang, Z.; Ahmed, Z.; Zhang, L.; Su, B.; Tao, H.; Jiang, T. Projections of Precipitation over China Based on CMIP6 Models. Stoch. Environ. Res. Risk Assess. 2021, 35, 831–848. [Google Scholar] [CrossRef]
- Merow, C.; Smith, M.J.; Silander Jr, J.A. A Practical Guide to MaxEnt for Modeling Species’ Distributions: What It Does, and Why Inputs and Settings Matter. Ecography 2013, 36, 1058–1069. [Google Scholar] [CrossRef]
- Zaehle, S.; Sitch, S.; Prentice, I.C.; Liski, J.; Cramer, W.; Erhard, M.; Hickler, T.; Smith, B. The Importance of Age-Related Decline in Forest NPP for Modeling Regional Carbon Balances. Ecol. Appl. 2006, 16, 1555–1574. [Google Scholar] [CrossRef]
- Pappas, C.; Fatichi, S.; Rimkus, S.; Burlando, P.; Huber, M.O. The Role of Local-Scale Heterogeneities in Terrestrial Ecosystem Modeling. J. Geophys. Res. Biogeosci. 2015, 120, 341–360. [Google Scholar] [CrossRef]
- Phillips, S.J.; Dudik, M. Modeling of Species Distributions with Maxent: New Extensions and a Comprehensive Evaluation. Ecography 2008, 31, 161–175. [Google Scholar] [CrossRef]
- Phillips, S.J.; Anderson, R.P.; Schapire, R.E. Maximum Entropy Modeling of Species Geographic Distributions. Ecol. Model. 2006, 190, 231–259. [Google Scholar] [CrossRef]
- Zhou, Y.; Zhang, Z.; Zhu, B.; Cheng, X.; Yang, L.; Gao, M.; Kong, R. MaxEnt Modeling Based on CMIP6 Models to Project Potential Suitable Zones for Cunninghamia Lanceolata in China. Forests 2021, 12, 752. [Google Scholar] [CrossRef]
- Fernandes, R.G.; Leblanc, S. Parametric (Modified Least Squares) and Non-Parametric (Theil–Sen) Linear Regressions for Predicting Biophysical Parameters in the Presence of Measurement Errors. Remote Sens. Environ. 2005, 95, 303–316. [Google Scholar] [CrossRef]
- Mann, H.B. Nonparametric Tests Against Trend. Econometrica 1945, 13, 245–259. [Google Scholar] [CrossRef]
- Kong, R.; Zhang, Z.; Zhang, Y.; Wang, Y.; Peng, Z.; Chen, X.; Xu, C.-Y. Detection and Attribution of Changes in Terrestrial Water Storage across China: Climate Change versus Vegetation Greening. Remote Sens. 2023, 15, 3104. [Google Scholar] [CrossRef]
- Zhang, J.; Chu, L.; Zhang, Z.; Zhu, B.; Liu, X.; Yang, Q. Evolution of Small and Micro Wetlands and Their Driving Factors in the Yangtze River Delta—A Case Study of Wuxi Area. Remote Sens. 2023, 15, 1152. [Google Scholar] [CrossRef]
- Ali, A.; Ahmad, A.; Akhtar, K.; Teng, M.; Zeng, W.; Yan, Z.; Zhou, Z. Patterns of Biomass, Carbon, and Soil Properties in Masson Pine (Pinus Massoniana Lamb) Plantations with Different Stand Ages and Management Practices. Forests 2019, 10, 645. [Google Scholar] [CrossRef]
- Liu, Y.Y.; Dijk, A.I.J.M.V.; Jeu, R.A.M.D.; Canadell, J.G.; McCabe, M.F.; Evans, J.P.; Wang, G. Recent Reversal in Loss of Global Terrestrial Biomass. Nat. Clim. Chang. 2015, 5, 470–474. [Google Scholar] [CrossRef]
- Sun, J.; Zhang, Y.; Qin, W.; Chai, G. Estimation and Simulation of Forest Carbon Stock in Northeast China Forestry Based on Future Climate Change and LUCC. Remote Sens. 2022, 14, 3653. [Google Scholar] [CrossRef]
- Bai, X.; Chang, Y.; Zhang, X.; Yan-jun, M.A.; Tao, W.U.; Jun-xia, L.I.; Zhen-ju, C. Impacts of Rapid Warming on Radial Growth of Larix Gmelinii on Two Typical Micro-Topographies in the Recent 30 Years. J. Appl. Ecol. 2016, 27, 3853. [Google Scholar] [CrossRef]
- Chen, C.; Zhang, X.; Wan, J.; Gao, F.; Yuan, S.; Sun, T.; Ni, Z.; Yu, J. Predicting the Distribution of Plant Associations under Climate Change: A Case Study on Larix Gmelinii in China. Ecol. Evol. 2022, 12, e9374. [Google Scholar] [CrossRef]
- Du, Q.; Wei, C.; Liang, C.; Yu, C.; Wang, H.; Wang, W. Future climatic adaption of 12 dominant tree species in Northeast China under 3 climatic scenarios by using MaxEnt modeling. Acta Ecol. Sin. 2022, 42, 9712–9725. [Google Scholar]
- Wu, X.; Liu, H.; Guo, D.; Anenkhonov, O.A.; Badmaeva, N.K.; Sandanov, D.V. Growth Decline Linked to Warming-Induced Water Limitation in Hemi-Boreal Forests. PLoS ONE 2012, 7, e42619. [Google Scholar] [CrossRef]
- Goetz, S.J.; Baccini, A.; Laporte, N.T.; Johns, T.; Walker, W.; Kellndorfer, J.; Houghton, R.A.; Sun, M. Mapping and Monitoring Carbon Stocks with Satellite Observations: A Comparison of Methods. Carbon. Balance Manag. 2009, 4, 2. [Google Scholar] [CrossRef] [PubMed]
- Xu, W.; Jin, X.; Liu, J.; Yang, X.; Ren, J.; Zhou, Y. Analysis of Spatio-Temporal Changes in Forest Biomass in China. J. For. Res. 2022, 33, 261–278. [Google Scholar] [CrossRef]
- Strassburg, B.B.N.; Kelly, A.; Balmford, A.; Davies, R.G.; Gibbs, H.K.; Lovett, A.; Miles, L.; Orme, C.D.L.; Price, J.; Turner, R.K.; et al. Global Congruence of Carbon Storage and Biodiversity in Terrestrial Ecosystems. Conserv. Lett. 2010, 3, 98–105. [Google Scholar] [CrossRef]
- Wen, R.; Xiao, J.; Chang, Z.; Zhai, D.; Xu, Q.; Li, Y.; Itoh, S.; Lomtatidze, Z. Holocene Climate Changes in the Mid-High-Latitude-Monsoon Margin Reflected by the Pollen Record from Hulun Lake, Northeastern Inner Mongolia. Quat. Res. 2010, 73, 293–303. [Google Scholar] [CrossRef]
- Zhu, C.; Liu, H.; Wang, H.; Feng, S.; Han, Y. Vegetation Change at the Southern Boreal Forest Margin in Northeast China over the Last Millennium: The Role of Permafrost Dynamics. Palaeogeogr. Palaeoclimatol. Palaeoecol. 2020, 558, 109959. [Google Scholar] [CrossRef]
- Piao, S.; Ciais, P.; Huang, Y.; Shen, Z.; Peng, S.; Li, J.; Zhou, L.; Liu, H.; Ma, Y.; Ding, Y.; et al. The Impacts of Climate Change on Water Resources and Agriculture in China. Nature 2010, 467, 43–51. [Google Scholar] [CrossRef]
- Jones, M.C.; Booth, R.K.; Yu, Z.; Ferry, P. A 2200-Year Record of Permafrost Dynamics and Carbon Cycling in a Collapse-Scar Bog, Interior Alaska. Ecosystems 2013, 16, 1–19. [Google Scholar] [CrossRef]
- Baltzer, J.L.; Veness, T.; Chasmer, L.E.; Sniderhan, A.E.; Quinton, W.L. Forests on Thawing Permafrost: Fragmentation, Edge Effects, and Net Forest Loss. Glob. Chang. Biol. 2014, 20, 824–834. [Google Scholar] [CrossRef]
- Fisichelli, N.A.; Frelich, L.E.; Reich, P.B. Temperate Tree Expansion into Adjacent Boreal Forest Patches Facilitated by Warmer Temperatures. Ecography 2014, 37, 152–161. [Google Scholar] [CrossRef]
- Li, F.; Zhou, G.; Cao, M. Responses of Larix Gmelinii Geographical Distribution to Future Climate Change: A Simulation Study. J. Appl. Ecol. 2006, 17, 2255–2260. [Google Scholar]
- Wang, Y.; Zhang, Z.; Chen, X. The Dominant Driving Force of Forest Change in the Yangtze River Basin, China: Climate Variation or Anthropogenic Activities? Forests 2022, 13, 82. [Google Scholar] [CrossRef]
- Huang, Y.; Ciais, P.; Santoro, M.; Makowski, D.; Chave, J.; Schepaschenko, D.; Abramoff, R.Z.; Goll, D.S.; Yang, H.; Chen, Y.; et al. A Global Map of Root Biomass across the World’s Forests. Earth Syst. Sci. Data 2021, 13, 4263–4274. [Google Scholar] [CrossRef]


| Variable | Variable Description | L. gmelinii | S. superba | C. officinarum |
|---|---|---|---|---|
| Bio2 | Mean diurnal range (mean of monthly (max temp–min temp)) | √ | √ | |
| Bio3 | Isothermality (bio2/bio7) (×100) | √ | ||
| Bio4 | Temperature seasonality (standard deviation × 100) | √ | √ | |
| Bio5 | Max temperature of the warmest month | √ | √ | |
| Bio6 | Temperature annual range (bio5–bio6) | √ | ||
| Bio8 | Mean temperature of wettest quarter | √ | ||
| Bio12 | Annual precipitation | √ | ||
| Bio13 | Precipitation of the wettest month | √ | ||
| Bio14 | Precipitation of the driest month | √ | √ | |
| Bio15 | Precipitation seasonality (coefficient of variation) | √ | ||
| Bio17 | Precipitation of the driest quarter | √ | ||
| elev | Elevation | √ | ||
| t_ph_h2o | Topsoil pH (H2O) | √ | ||
| t_bs | Topsoil Base Saturation | √ | ||
| s_ece | Subsoil Salinity (Elco) | √ | ||
| s_cec_soil | Subsoil CEC (soil) | √ | ||
| s_teb | Subsoil TEB (Total exchangeable bases) | √ |
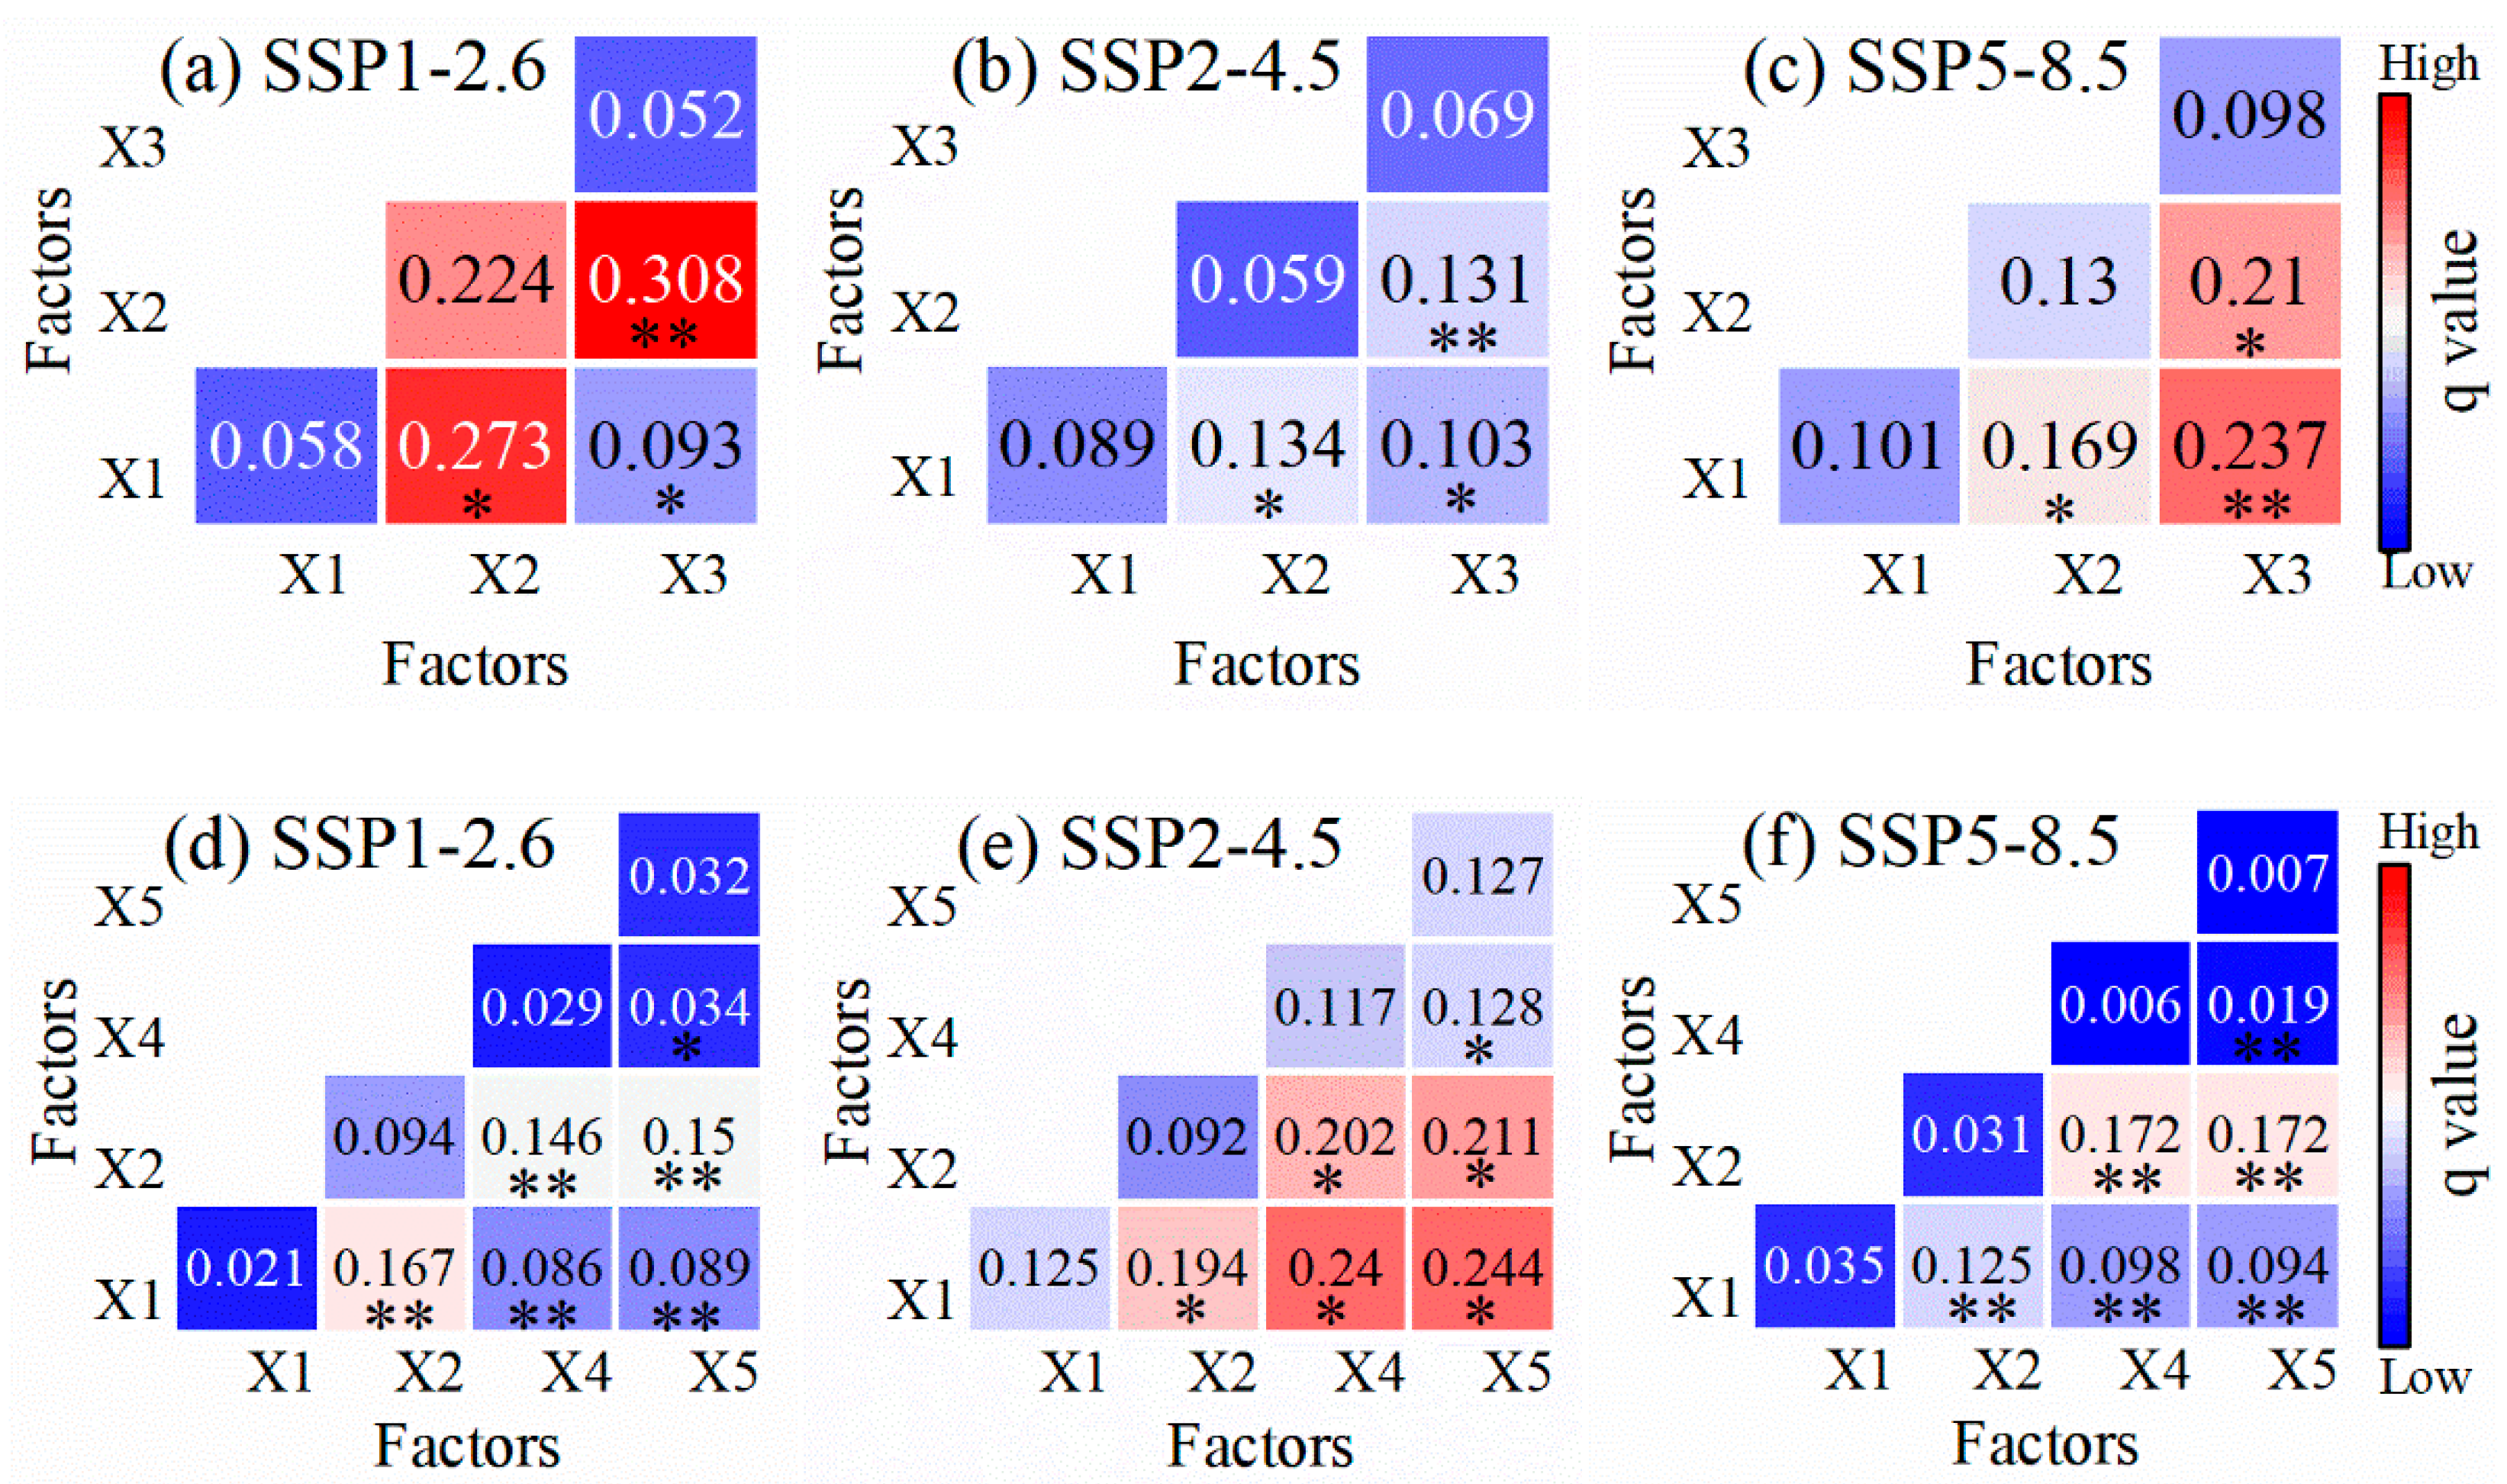
| Interaction Relationship | Interaction Types |
|---|---|
| q(Xi∩Xj) < Min(q(Xi), q(Xj)) | Nonlinear-weaken |
| Min(q(Xi), q(Xj)) < q(Xi∩Xj) < Max(q(Xi), q(Xj)) | Uni-variable weaken |
| q(Xi∩Xj) = q(Xi) + q(Xj) | Independent |
| Max(q(Xi), q(Xj)) < q(Xi∩Xj) < q(Xi) + q(Xj) | Bi-variable enhanced |
| q(Xi∩Xj) > q(Xi) + q(Xj) | Nonlinear-enhanced |
| Species | Periods | Scenarios | Low | Moderate | High | Total |
|---|---|---|---|---|---|---|
| L. gmelinii | Current | 223.58 | 145.31 | 133.47 | 475.25 | |
| 2041–2060 | SSP1-2.6 | 246.86 | 102.60 | 67.81 | 417.27 | |
| SSP2-4.5 | 241.41 | 96.62 | 58.45 | 396.48 | ||
| SSP5-8.5 | 234.24 | 90.49 | 50.56 | 375.29 | ||
| S. superba | Current | 98.20 | 63.55 | 49.96 | 211.71 | |
| 2041–2060 | SSP1-2.6 | 81.85 | 62.68 | 114.47 | 259.00 | |
| SSP2-4.5 | 88.57 | 66.48 | 113.25 | 268.30 | ||
| SSP5-8.5 | 79.09 | 59.57 | 136.97 | 275.63 | ||
| C. officinarum | Current | 93.37 | 76.79 | 60.41 | 230.57 | |
| 2041–2060 | SSP1-2.6 | 84.85 | 55.75 | 141.78 | 282.38 | |
| SSP2-4.5 | 91.86 | 56.63 | 140.98 | 289.47 | ||
| SSP5-8.5 | 92.86 | 52.13 | 157.90 | 302.89 |
| Species | Scenarios | Range Expansion | No Occupancy | No Change | Range Contraction |
|---|---|---|---|---|---|
| L. gmelinii | SSP1-2.6 | 3.97 | 823.86 | 68.86 | 49.05 |
| SSP2-4.5 | 2.80 | 825.03 | 60.29 | 57.61 | |
| SSP5-8.5 | 2.28 | 825.54 | 52.20 | 65.71 | |
| S. superba | SSP1-2.6 | 70.12 | 819.28 | 55.42 | 0.18 |
| SSP2-4.5 | 68.67 | 820.73 | 55.44 | 0.16 | |
| SSP5-8.5 | 94.07 | 795.33 | 55.46 | 0.14 | |
| C. officinarum | SSP1-2.6 | 87.00 | 793.95 | 66.65 | 0.03 |
| SSP2-4.5 | 86.04 | 794.91 | 66.60 | 0.09 | |
| SSP5-8.5 | 104.22 | 776.73 | 66.66 | 0.02 |
Disclaimer/Publisher’s Note: The statements, opinions and data contained in all publications are solely those of the individual author(s) and contributor(s) and not of MDPI and/or the editor(s). MDPI and/or the editor(s) disclaim responsibility for any injury to people or property resulting from any ideas, methods, instructions or products referred to in the content. |
© 2023 by the authors. Licensee MDPI, Basel, Switzerland. This article is an open access article distributed under the terms and conditions of the Creative Commons Attribution (CC BY) license (https://creativecommons.org/licenses/by/4.0/).
Share and Cite
Zhu, B.; Zhang, Z.; Kong, R.; Wang, M.; Li, G.; Sui, X.; Tao, H. Future Reductions in Suitable Habitat for Key Tree Species Result in Declining Boreal Forest Aboveground Biomass Carbon in China. Forests 2023, 14, 2053. https://doi.org/10.3390/f14102053
Zhu B, Zhang Z, Kong R, Wang M, Li G, Sui X, Tao H. Future Reductions in Suitable Habitat for Key Tree Species Result in Declining Boreal Forest Aboveground Biomass Carbon in China. Forests. 2023; 14(10):2053. https://doi.org/10.3390/f14102053
Chicago/Turabian StyleZhu, Bin, Zengxin Zhang, Rui Kong, Meiquan Wang, Guangshuai Li, Xiran Sui, and Hui Tao. 2023. "Future Reductions in Suitable Habitat for Key Tree Species Result in Declining Boreal Forest Aboveground Biomass Carbon in China" Forests 14, no. 10: 2053. https://doi.org/10.3390/f14102053
APA StyleZhu, B., Zhang, Z., Kong, R., Wang, M., Li, G., Sui, X., & Tao, H. (2023). Future Reductions in Suitable Habitat for Key Tree Species Result in Declining Boreal Forest Aboveground Biomass Carbon in China. Forests, 14(10), 2053. https://doi.org/10.3390/f14102053