Abstract
Leaf area index is a key structural parameter for biological and physical processes. Korea is planning to launch CAS500-4 in 2025, so in situ data is needed to validate the leaf area index. Unlike other networks (e.g., NEON and TERN), establishing an elementary sampling unit is difficult in Korea due to the complex forest structure and rugged terrain. Therefore, pixel-level correspondence between the satellite product and fisheye footprints is the best way to verify in complex terrain. In this study, we analyzed the spatial footprint of fisheye lenses in different forest types using terrestrial LiDAR data for the first time. The three-dimensional forest structure was analyzed at various viewing zenith angles, and the footprint radius was approximately 3 m at view zenith angle (VZA) 20° and approximately 10 m at VZA 90°. We also analyzed the Z-values from terrestrial laser data and the plant area index on leafless seasons to assess the impact of obstacles, such as tree trunks, under various viewing zenith angles. The analysis showed that the influence of woody components increases dramatically as the VZA exceeds 40°. Such factors influenced the increase in LAI and the decrease in the clumping index as the VZA increased. Overall, we concluded that narrowing VZA between 20° and 40° is appropriate for Korean forests with complex structures.
1. Introduction
Leaf area index, LAI, defined as half of the total leaf area per unit of horizontal ground surface area [1], is a key structural parameter for biological and physical processes in vegetation [2]. Satellite-based LAI products have played a crucial role in various fields, including land surface models [3,4,5]. However, challenges in field measurement of LAI still limit the temporal and spatial scale of the satellite-based LAI validation which is usually performed on a local-to-regional level. Campaigns and networks—CEOS LPV Subgroup [6,7], US NSF NEON [8], and Australia TERN [9]—are constructed protocols for validating satellite-based LAI data with digital hemispherical photography (DHP) or digital canopy photography (DCP), which are rapid and non-destructive. Such LAI protocols can generate consistent field measurements of LAI across sites within each network, but the distribution of LAI observation sites is sparse, especially in East Asian forests.
The validation methods for satellite-derived LAI products can be distinguished into two approaches: (1) direct comparison between field measurements and satellite-derived LAI products, and (2) comparison with spatially upscaled high-resolution reference imagery obtained from intensive field sampling, particularly for moderate-resolution satellite products [10]. In a heterogeneous forest with complex vertical structures, the leaf area index can be significantly different even for adjacent pixels; such a tendency is more pronounced in high-resolution images. Current sampling strategies target medium-resolution satellite-derived products and follow statistical approaches that rely on a minimum spatial footprint and the size of the elementary sampling unit (e.g., 20–100 m). Specifically, validating satellite products with high-spatial resolution requires a pixel-level analysis with field measurements considering their footprint.
East Asia forms a complex geomorphological structure characterized by relatively steep slopes and rugged terrain compared to surrounding regions [11]. These fine-scale topographical differences have a significant impact on forest structure [12], highlighting the highly heterogeneous nature of forest ecosystems in East Asia. A complex three-dimensional structure of the forest can result in varying degrees of discrepancy in the footprint of a fisheye lens, according to the zenith and azimuth angles of the lens. However, the exact footprint of a fisheye lens in various forest structures has not been addressed in previous studies.
Gap fraction analysis is contingent on how annuli and sectors are separated within a hemispherical image, subsequently impacting the estimation of the LAI. Ref. [13] reported that the angle width of the zenithal annuli and azimuthal sectors significantly affect LAI estimates, and there are no practical solutions for different forest types. It is often recommended to reduce the number of annuli on plant canopy analyzers (e.g., LAI-2000 or LAI-2200) for the following reasons: (1) multiple scattering can bring an underestimation of effective LAI because of increment of incoming light [14]; (2) the plot size is not sufficient for the full coverage of sensor view [15,16]; and (3) obstacles outside the plot can contaminate the incident light on the sensor [15,17]. In addition, the discrete degree of view zenith angles can enhance the error on effective LAI, and weight coefficient of the last annulus can be the main error source of the plant canopy analyzers [18]. Therefore, it is necessary to analyze which method is appropriate for heterogeneous forest structures.
South Korea is planning to launch the Compact Advanced Satellite 500-4 (CAS500-4) in 2025, primarily intended for monitoring forests and agricultural areas. CAS500-4 is designed with a spatial resolution of 10 m, considering the spatial heterogeneity of Korea. To validate LAI products derived from CAS500-4 in the future, we plan to establish approximately 40 validation sites across the country. However, due to the significant spatial heterogeneity of Korean forests, it is essential to precisely define the spatial coverage of the fisheye lens and compare it with satellite products at the pixel level. Additionally, the rugged terrain makes it challenging to install an elementary sampling unit with multiple fisheye lenses.
This paper aims to establish the groundwork for constructing the ground-based LAI observatory network in the Korean forest, characterized by rugged terrain and complex forest structures. We focused on the following questions to optimize the framework for the LAI observatory network in complex forest structures: (1) how does the footprint of a fisheye lens vary with different view zenith angles; (2) how different is the LAI estimates between different view zenith angles; (3) are classical methods of LAI estimation suitable for complex forest structures with rugged terrains; and (4) what is the practical solution using the digital hemispherical photography system for LAI estimation in complex forest structures with rugged terrain?
2. Materials and Methods
2.1. Study Area
Three sites were selected considering forest types in South Korea (Figure 1). The Gwangneung National Arboretum is a warm-temperate deciduous forest and designated as a UNESCO biosphere reserve that has been protected from humans over the last 500 years. The mean annual temperature was 11.2 °C and the mean annual precipitation was 1.502 mm between 1981 and 2010 [19]. One fisheye lens was installed near the GDK, a KoFlux supersite (37°44′55.51″ N, 127°8′55.20″ E). The main tree species near the lens are Carpinus laxiflora (Siebold & Zucc.) Blume, Carpinus cordata var. chinensis Franch, Acer pseudosieboldianum, and Morus bombycis Koidz (Figure S1a). The tree heights range from 3 to 21 m, with an average of approximately 8.95 m. Direct measurement methods, including leaf collection using litter traps and leaf harvesting, are difficult to implement within biosphere reserves due to their destructive nature. So, we collected the ground reference indirectly using a commonly used instrument, a CI-110 Analyzer (CID Inc., Camas, WA, USA). CI-110 was taken from the same location as the fisheye lens, and the field survey dates are listed in Table 1. The LAI values measured by CI-110 were compared with the proposed method in this study.
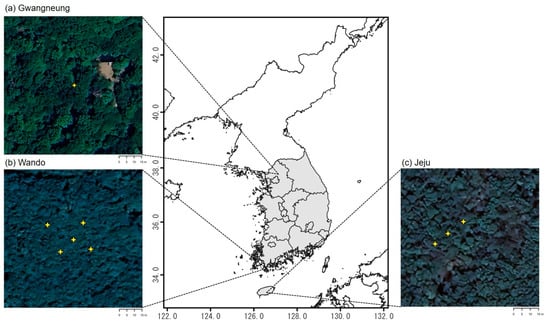
Figure 1.
Study area (a) Gwangneung; (b) Wando; (c) Jeju. The location of fisheye lenses are depicted with yellow cross stars.

Table 1.
Field survey using CI-110 on Gwangneung.
The Wando Arboretum is located in Jeollanam-do, South Korea, and belongs to the warm-temperate evergreen broadleaf forest zone. The mean temperature and precipitation were 14.1 °C and 1532.7 mm between 1981 and 2010 [20]. Five fisheye lens were randomly distributed within a 5 × 5 grid with a 5m spacing, centered around the Wando long-term ecological research site (34°21′33.99″ N, 126°40′40.40″ E; 34°21′33.93″ N, 126°40′39.47″ E; 34°21′33.55″ N, 126°40′40.15″ E; 34°21′33.23″ N, 126°40′39.81″ E; 34°21′33.30″ N, 126°40′40.60″ E). The dominant tree species is Quercus acuta, and Camellia japonica and Castanopsis sieboldii, which are sporadically distributed (Figure S1b). The mean diameter at breast height for each site is 16.01 cm, 16.06 cm, 12.87 cm, 12.29 cm, and 13.05 cm, respectively.
The Jeju experimental forest of National Institute of Forest Science belongs to the warm-temperate forest zone whose annual mean temperature and precipitation were 16.6 °C and 1923 mm, respectively [20]. Jeju Island is surrounded by the sea, with Mt. Halla (1950 m) as its highest centerpiece. This topographical feature has led to the formation of evergreen broad-leaved forests near the coastline and alpine plants near the summit of the mountain. Various habitats have developed according to altitude [21]. Three fisheye lenses were constructed in the Jeju experimental forest of National Institute of Forest Science (33°19′3.95″ N, 126°34′2.97″ E; 33°19′4.15″ N, 126°34′3.27″ E; 33°19′4.39″ N, 126°34′3.64″ E). Major tree species comprising our site are Carpinus yedoensis var. jablonszkyi H.J.P., Quercus serrata, Camellia japonica, Ligustrum japonicum, and Daphniphyllum macropodum (Figure S1c), and the site is classified as a mixed forest. Each mean diameter at breast height near the fisheye lens is 11.71 cm, 12.88 cm, and 13.38 cm.
2.2. Digital Hemispherical Photography System
The digital hemispherical photography (DHP) has been widely used for canopy characterization [22] and the evaluation of LAI products [23]. We developed a low-cost DHP system for maintenance and management at national-level. The configuration of the developed DHP system includes a digital camera with high resolution (2592 × 1944), an exceptionally wide-angle fisheye lens, and a bubble level and a direction indicator. A low-cost Raspberry Pi fisheye lens (Arducam 5MP OV5647), having a focal length below 3.60 mm and a horizontal field of view of 220°, fulfills the measurement requirement. The fisheye lens was positioned at a height of 1.2 m above the ground (Figure 2), and the lens is protected by a cap to guard it against external debris and rain. Photos were taken every hour between 5 am and 9 pm. For LAI estimation, we used enlarged DHP images (1280 × 1024 pixels) without outlying useless pixels.
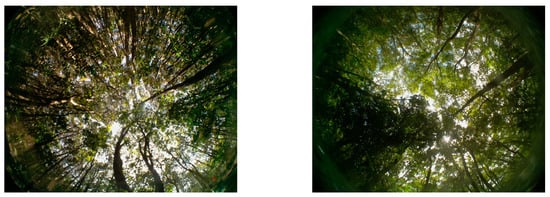
Figure 2.
Hemispheric photos from the DHP system developed in this study (selected).
2.3. Terrestial LiDAR Data
Laser scanning was conducted using Leica RTC360 (Leica, Wetzlar, Hesse, Germany) to grasp the three-dimensional structure of forests. The sensor operates at a wavelength of 1550 nm, offering a maximum horizontal field of view of 360° and a maximum vertical field of view of 300° (Table 2). It can scan objects from 0.5–130 m away at a speed of up to 2,000,000 pts/s. The leaf-on data was obtained on different dates for each site: Gwangneung (10–11 August 2021), Wando (24 September 2022), and Jeju (22 September 2022). We initially registered LiDAR point clouds acquired at multiple locations using the Leica Field360 software version 4.3. However, owing to the intricate terrain, a subsequent precise post-registration was conducted using the Trimble RealWorks program version 12.3.
Table 2.
Specification of the Leica RTC360 instrument.
2.4. Estimation of LAI with the DHP Images
For gap fraction analysis, a meticulous distinction between the canopy and the sky was accomplished in the DHP imagery. Employing a singular threshold value could be insufficient for separating the canopy from the partially heterogeneous sky because of clouds. In this study, the ‘imageseg’ R package [24], a deep learning-based model, was applied to discern between the canopy and the sky. The images taken when precipitation was greater than zero were filtered out using the precipitation data of the nearest mountain meteorological network in Korea (http://apis.data.go.kr/1400377/mtweather, accessed on 15 August 2023). Under the assumption that LAI rarely changes throughout the day, hourly binary images were aggregated to a daily scale with majority voting when two or more binary images exist in a day. We conducted post-processing to rectify misclassified pixels within each canopy and sky class. This is necessary because a deep learning model, trained with a limited dataset, faces challenges in accurately predicting classes under varying illumination conditions. In post-processing, we selected an hourly image with zero precipitation and large luminance deviation throughout the day. We then applied Otsu Thresholding to reclassify each class of the daily binary image based on the luminance histogram of the selected image. The luminance signal was calculated as 0.3 × RED + 0.59 × GREEN + 0.11 × BLUE.
The LAI was estimated using the ‘hemispheR’ R library [25] with the post-processed binary images. The library estimates LAI based on an inversion of the Beer-Lambert law (Equation (1)). The gap fraction () is calculated from the binary image based on user-defined annuli and sectors. , the ratio between leaf areas projected on the plane perpendicular to the and its actual area, serves as a projection coefficient that is dependent on the distribution of leaf inclination angles.
The is a priori parameter that can be presented by the hemispherical integration, as in Equation (2). So, LAI can be driven into Equation (3) by combining Equations (1) and (2) based on the Miller’s theorem [26].
Different averaging formulas of gap fraction were applied for calculating effective LAI (Le, Equation (4)) and actual LAI (L, Equation (5)) [27,28]. The integral between 0 to was substituted for a sum of n discrete number of annuli. A clumping index was derived as the ratio of Le to L.
In this study, we compared LAI for different view zenith angle (VZA) ranges, ranging from 10° to 90° in 10° intervals (Table 3). The number of annuli would vary between 1 to 9 depending on the VZA ranges, while the number of sectors was set to 8. The classical methods additionally compared—LAI-2000/2200 and the hinge-angle (HA). In particular, HA of 57.7° has been demonstrated for stable estimation of LAI, independent of leaf angle distributions [29]. Since days with precipitation undetected by weather stations can contaminate L estimates, temporal filtering of daily L is necessary to exclude these errors. We filtered out outliers that fell outside the standard deviation within the moving window, assuming no significant changes in LAI among the 16 days. The filtered L was then averaged over 8-day intervals.
Table 3.
Parameterization of the number of annuli and sectors for different LAI methods. Shaded rows indicate classical LAI methods. The name rule of LAI method with VZA is written as L{view zenith angle}. The classical methods—LAI-2000/2200 and hinge angle of 57° (HA)—are listed together.
2.5. Spatial Footprint of DHP
A three-dimensional forest structure assists in identifying components that are challenging to distinguish under low-light conditions, especially in dense forests. Understanding the coverage of the fisheye lens is particularly important for validating satellite-based LAI at the pixel level and optimizing ground sampling designs efficiently. In simple forest structures, a fisheye lens captures the canopy, with the Z value of a LiDAR point expected to similar with canopy height regardless of the view zenith angle. Conversely, if the Z value of a LiDAR point is lower than the canopy height, it implies that the point is referencing other components, such as tree trunks, rather than the canopy. As a fisheye lens detects visible light reflected from objects closest to the lens, the LiDAR point cloud near the fisheye lens represents the actual three-dimensional range it captures. We calculated the spatial coverage of a fisheye lens by averaging the X, Y, and Z values of LiDAR point clouds within 5% of the closest distance to the lens. This analysis was performed at zenith angles ranging from 10 to 90 degrees in 10-degree increments, with azimuths performed in 1-degree increments.
3. Results and Discussion
3.1. How the Footprint of DHP Varies over Different View Zenith Angles?
Understanding the footprint of the fisheye lens is beneficial in the validation of LAI derived from satellite data. Grasping the footprint can make correspondence with the satellite-derived LAI products at the pixel level. In addition, the optimal arrangement of the fisheye lens can be determined more economically considering the forest structure. We analyzed how the coverage of fisheye lenses in the study area varies with different VZA in the horizontal plane. Figure 3 illustrates the footprint coverage of DHP across VZA ranging from 20° to 90° (refer to Section 2.5). The data for VZA of 10°, which showed similar results for the VZA of 20°, was excluded. Specifically, in Gwangneung, the average radius of footprint measured from the fisheye lens is 3.72 m at a VZA of 20°, increasing to 8.31 m at a VZA of 80°. In Wando, the average radius at five points ranges from 1.73 to 3.38 m at a VZA of 20° and from 12.74 to 14.04 m at a VZA of 80°. For Jeju, the average radius from three fisheye lenses at a VZA of 20° ranges from 0.83 to 1.79 m, and at a VZA of 80°, it varies from 9.40 to 11.02 m. Commonly, the average and standard deviation of footprint radius exhibited a logarithmic growth as VZA increases. This result is reasonable since the number of obstacles encountered when penetrating the forest rises with the increment of VZA. Even if the fisheye lenses are located within tens of meters of each other, the radii of the footprints can be different, indicating that the forest structure is very heterogeneous even in small areas. So, forest type has a negligible effect on the spatial extent of DHP, and the spatial extent of DHP is mainly influenced by physical characteristics such as location, density, height, and shape of individual trees.
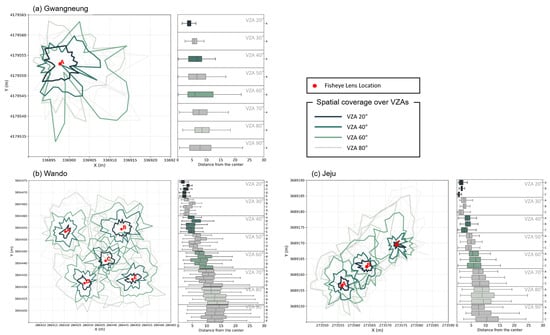
Figure 3.
The footprint of the fisheye lens with the 10° increment from VZA 20° to 90°: (a) Gwangneung, (b) Wando, and (c) Jeju. x-axis and y-axis represent the coordinates of UTM52N. Solid lines from dark green to light green indicate VZA at 20°, 40°, 60°, and 80°, respectively. Footprints of other VZAs are shown as gray dotted lines, and red dots indicate the location of fisheye lens. The boxplot in right side shows the distribution of footprint radii of fisheye lenses per VZA.
3.2. How Does the Vertical Height of a Footprint Vary across View Zenith Angles in a Forest with Complex Structure?
Footprints can describe the spatial extent of a fisheye lens in the XY plane. In an ideal scenario, the fisheye lens would be able to detect foliage within the canopy without any hindrance from branches or tree trunks. In such a case, the Z value would be similar to the canopy height, regardless of the VZA. However, the presence of branches and trunks in real forests hinders the estimation of effective LAI. Since the actual Z value depends on the distance from the fisheye lens to the obstacle and the cosine of VZA, the actual Z value at each zenith angle and azimuth angle can provide information about potential obstacles affecting the viewpoint. Figure 4 depicts the distribution of Z values (i.e., height) over different VZAs. Most of the Z values tended to gradually decrease over VZA, and converge to 1.2 m, the height of the fisheye lens at VZA of 90°. The deviation of the Z values gradually increases and then decreases after peaking at VZA 50–60°. The largest deviation of the Z value at VZA 50–60° is expected to be due to numerous obstacles encountered on the path of light passing through the understory layer.
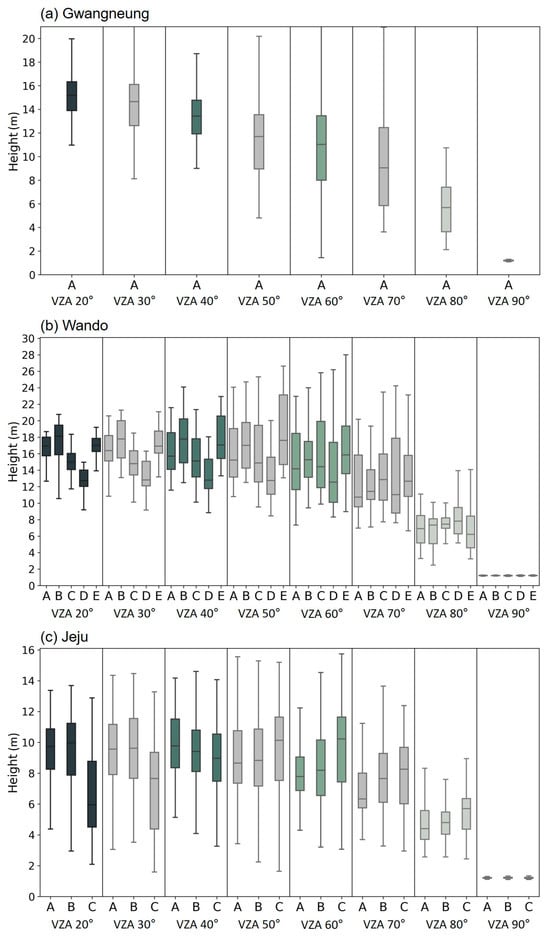
Figure 4.
Distribution of Z values over different zenith and azimuth angles: (a) Gwangneung, (b) Wando, and (c) Jeju. x-axis shows plots under different zenith angles, and y-axis indicates the Z values (i.e., height). The unit of y-axis is a meter. The A, B, C, D, E indicate different location of fisheye lenses in a site.
3.3. How Different Is the LAI Estimates between Different View Zenith Angles?
The time-series of L with different VZAs (refer to Section 2.4) are plotted in Figure 5. Multiple fisheye lenses in a site were averaged considering the spatial alignment with satellite-based LAI products. The Gwangneung site (Figure 5a), a deciduous broadleaf forest, reveals seasonal patterns whose L is the highest in summer (June to August) and lowest in winter (December to February). The estimated L falls within the range of previous results, which are 5.25 [28] and 6.09 ± 0.72 [30]. Wando and Jeju sites (Figure 5b,c) also showed near constant and weak seasonal patterns, reflecting forest types such as evergreen broadleaved forest and mixed forest, respectively.
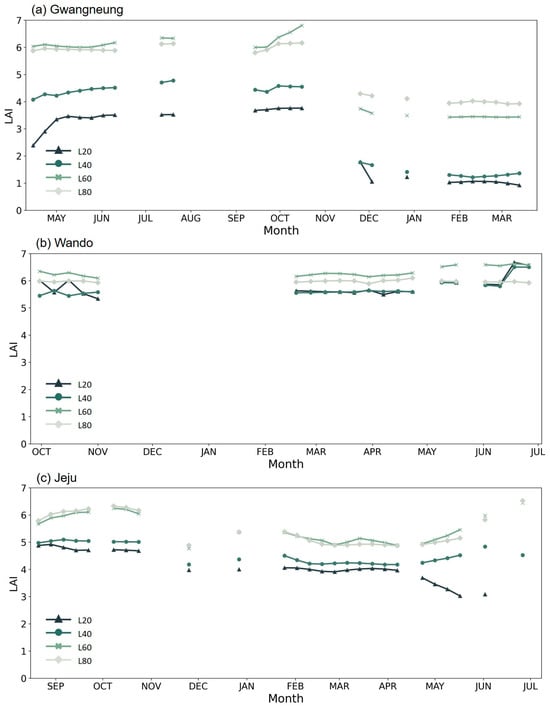
Figure 5.
Time series of LAI across view zenith angles: (a) Gwangneung, (b) Wando, and (c) Jeju. The actual LAI with VZA of 20°, 40°, 60°, and 80° are nominated as L20, L40, L60, and L80, respectively. The x-axis of all three sites starts from 2022.
The variation in L across different VZA values was evident. Figure 5 illustrates that lower VZA values correspond to a smaller L. Particularly, Gwangneung appears to exhibit a larger L deviation between VZAs compared to Wando and Jeju, likely due to its lower tree density in comparison to other regions. In relatively denser forests, Wando and Jeju sites, the L20 and L40 were similar, and the L60 and L80 were similar. Given that L is computed by dividing the Le by the clumping index, we analyzed the discrepancies in L between VZAs using these metrics (Figure 6). Regarding the L values in Gwangneung, there is a general tendency for L to increase as VZA increases. In the leaf-off season, Le also follows this increasing trend with rising VZA. However, during the leaf-on season, a contrasting pattern could partially present (e.g., VZA of over 40°). This phenomenon occurs because clumps of leafy crowns result in varying proportions of plant pixels within each annulus and section. However, the difference in clumping index according to VZA was large, as a result, the trend of L in Gwangneung site was revealed. The difference in L across VZAs was minimal at the Wando site, characterized by a dense evergreen broadleaved forest. Evergreen broadleaved forests typically exhibit little seasonal changes; however, there was a sudden increase in L at low VZAs in June 2023. This increase was caused by the omission of precipitation data from the mountainous meteorological network. The Jeju site exhibited a composite pattern of deciduous and evergreen forests. Le showed slight discrepancies between VZAs during the leaf-off season, whereas larger differences were observed during the leaf-on season. Similar to the Gwangneung site, smaller VZA values were associated with lower Le values. After applying the clumping index, the L interval between VZAs widened, and although the change width in L was minor, the phenological pattern resembled that of the Gwangneung site.
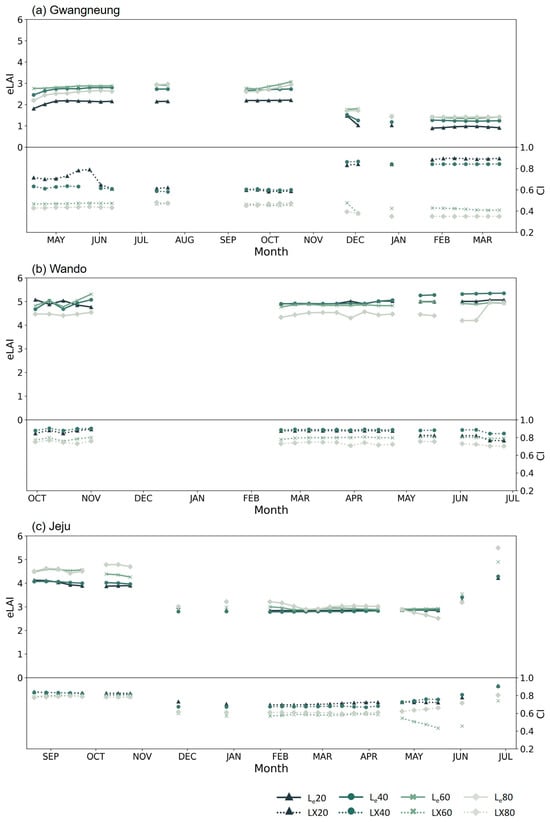
Figure 6.
Time series comparison of effective LAI (Le) and clumping indices (LX) between view zenith angles: (a) Gwangneung, (b) Wando, and (c) Jeju. The solid lines represent the Le, while the dotted lines correspond to the clumping index. Each Le and LX with different VZAs were presented as Le{view zenith angle} or LX{view zenith angle}.The x-axis of all three sites starts from 2022.
Distinguishing woody components from leaves is a significant challenge in indirect optical measurements of LAI, which still poses difficulties in operational measurements [1]. The subtraction of woody components in DHP images is not simple, primarily due to the varying ratio of woody components across phenological stages and the presence of mutual occlusion between woody components and leaves. Hence, using DHP images within a specific VZA that minimizes the impact of the woody component could be advantageous for accurate LAI estimation. Figure 7a shows the raw image of the Gwangneung site which is a comparatively more open forest than Wando and Jeju. A mountainside can be found along the edge of the DHP image spanning over the VZA of 50°. Furthermore, tree trunks appear thicker towards the ground, leading to an increase in wood pixel ratio as VZA increases. Such errors can be inferred using the binary image with the leaf-off season (Figure 7b). In the gap fraction analysis up to a VZA of 20°, which encompasses only twigs and branches, the LAI is estimated as 0.3. The LAI increased to 0.51 as the VZA extended to 40°, which further included the upper part of the tree trunk. After extending the VZA by 60°, the LAI dramatically rose to 0.92 because the edge senses nearby mountain terrain. As larger VZA is used for gap fraction analysis, the potential for error in LAI estimation is likely to rise. Therefore, the range of VZA between 20° and 40° appears to be suitable considering the uncertainty stemming from woody areas and the topographical complexity in South Korea. Further discussions on optimal VZA will continue in Section 3.5.
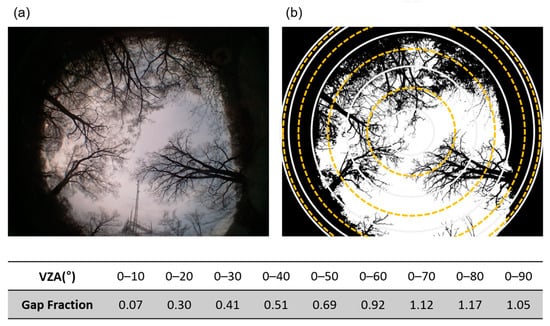
Figure 7.
The (a) raw and (b) binary images with leaf-off season in Gwangneung. The date of image is the 4 February 2023. The circles with yellow dotted lines indicate view zenith angle of 20°, 40°, 60°, and 80°, respectively. Gray solid lines show the view zenith angle from 10° to 90° with the 20° interval. Below table shows the gap fraction corresponding to view zenith angle.
3.4. Are Hinge Angle (57°) and LAI-2000/2200 Methods Suitable for Places with Complex Forest Structures and Rugged Terrain?
In previous analyses, the influence of woody components (e.g., branches and trunks), as well as rugged terrain on LAI, was found to be less pronounced when using smaller VZAs. The L values with narrow VZAs and the conventional LAI algorithms (Section 2.4) were compared with satellite-based LAI (Figure 8) and the CI-110 measurement (Figure 9). Overall, L values with classical methods showed lower distributions compared to the L calculated with small VZAs, which is largely attributed to the fact that clumping indices were consistently set to 1 across all periods. A clumping index of 1 implies a random spatial distribution of foliage, which is not reasonable when considering a phenological cycle. Specifically, pixels near the hinge angle (approximately 57°) are likely to include tree trunks. Refs. [31,32,33,34] discussed that the accuracy of the method for narrowing the leaf inclination angle near 57° varies due to differences in the distribution of the leaf inclination angles depending on the actual crown structure. Figure 9 highlights a significant difference in the intercepts of the regression lines between the conventional LAI algorithms and L20 and L40. The negative intercept values were close to −1 in the conventional LAI algorithms, expected to be influenced by the presence of woody components, while the intercept values were close to 0 for L20 and L40. The L, calculated with small VZAs, tended to slightly overestimate compared to the CI-110 due to differences between sky-canopy classification. However, it exhibited a notably higher coefficient of determination (R2) of approximately 0.7, indicating better performance compared to the conventional LAI algorithms. In cases where the terrain is intricate in open forests, such as Gwangneung, estimating L can be challenging due to not only the presence of woody components, but also the inclusion of the surrounding terrain within the lens. Therefore, we suggest to narrow the VZA when calculating L in complex forest structures such as those found in South Korea.
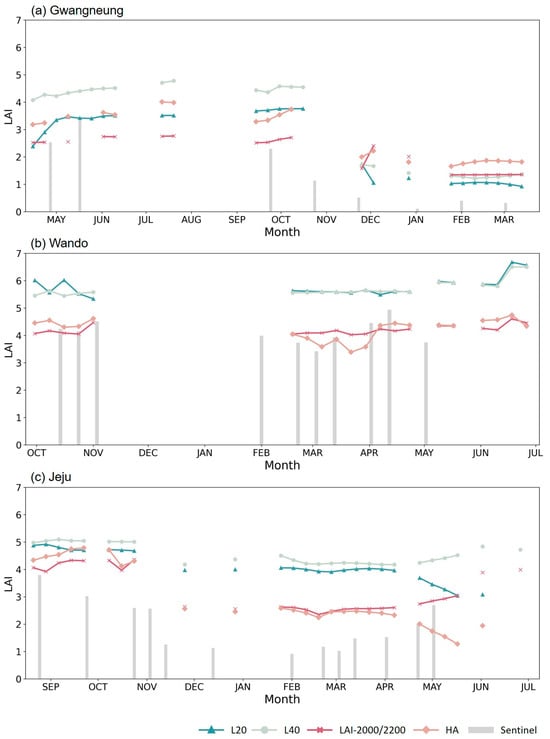
Figure 8.
Comparison between different DHP image-based LAI algorithms and satellite-derived LAI: (a) Gwangneung, (b) Wando, and (c) Jeju. Bar graphs indicate the LAI derived from Sentinel-2A on clear dates. Line graphs with markers represent different LAI algorithms derived from DHP images. The name of LAI method with VZA is written as L{view zenith angle}, and the classical methods are presented as LAI-2000/2200 and HA (hinge angle of 57°). The x-axis shows the dates which starts from 2022.
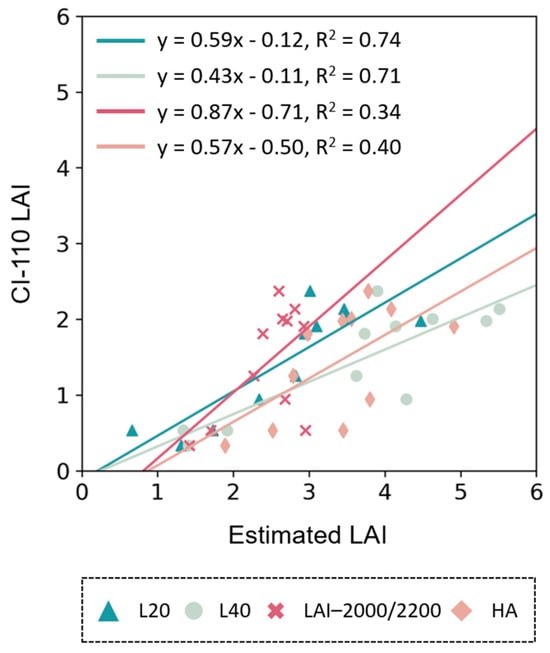
Figure 9.
Comparison between CI-110 and different DHP image-based LAI algorithms in Gwangneung. y-axis indicate the measured LAI using the CI-110 plant canopy imager, and x-axis presents different DHP image-based LAI estimates. Line graphs show regression lines between CI-110 and LAI estimates with different algorithms. The name of LAI method with VZA is written as L{view zenith angle}, and the classical methods are presented as LAI-2000/2200 and HA (hinge angle of 57°).
3.5. What Is the Practical Solution Using the DHP System for LAI Estimation in Complex Forest Structures with Rugged Terrain?
The forests in Korea exhibit a complex structure of both canopy and sub-canopy layers, coupled with a highly undulating terrain. Such characteristics pose challenges when estimating LAI using hemispherical images. In addition, an intricate forest structure makes it hard to distinguish between woody components and leaves in the image, which introduces substantial errors in the LAI estimation. The complex structures of a forest affect not only the distinction of leaves and woody components, but also the presentation of crown clumping. For instance, [35] analyzed that tree trunks can influence both gap fraction and clumping index by more than 10%–30%, especially between 30° and 70° of VZA. The clumping index generally increases with the zenith angle [36], except in cases such as discontinuous, open-canopy woody savannas of California [28]. Our result, consistent with previous studies, indicated a gradual reduction in gaps within an image, encompassing tree trunks, understory vegetation, and the surrounding rugged terrain, with higher VZA correlating with lower clumping indices. A simplistic approach of subtracting the woody area from the overall plant area can fall to mutual occlusion, potentially leading to inaccurate LAI estimation. Therefore, a narrow range of VZA is recommended, considering the reduction of woody components in the image. The spatial coverage at low VZA is also sufficient for validating the satellite-derived LAI products, especially for CAS500-4.
3.6. Potentials and Limitations
The main disadvantage of narrowing the VZAs brings uncertainties due to significant deviations in the mean projection of unit foliage area corresponding to leaf inclination angles. The influence of leaf angle distribution is large at small VZAs [1,37] because the leaf projection function assumes a spherical pattern of the leaf angle distribution with a projection coefficient of 0.5 for different VZAs. Even though [38] showed that the use of VZA between 45°–65° can reduce the uncertainty within 10% in coniferous canopies, using the VZA of 0°–40° is more efficient for reducing impacts of woody components in gap fraction analysis. So, reflecting actual leaf angle distribution is needed to reduce the uncertainty that comes from small VZAs. Estimation of leaf angle with terrestrial LiDAR has been performed in previous studies [39,40,41]. An open-source library for leaf angle estimation using terrestrial laser data was developed [42]. So, we can obtain the leaf angle information on the growing season for each site using terrestrial LiDAR data to reduce the uncertainty of LAI estimation.
Slope correction is another issue in Korean forests due to the rugged terrain. Slopes can distort trees, making it challenging to estimate LAI from DHP images. The position of a fisheye lens can be categorized according to the orientation of the optical axis: leveled (aligned with the local vertical) or tilted (aligned with the slope normal) [43]. Our fisheye lens was installed in a relatively flat area aligned with the local vertical. As we are expanding the number of sites to 38, slope correction may be required at some sites. In future work, we plan to compare and apply slope correction methods to DHP images equipped with a fisheye lens on relatively steep slopes.
4. Conclusions
Indirect measurement of LAI using DHP is an efficient approach for validating satellite-derived LAI. LAI protocols for networks and campaigns based on DHP or DCP propose establishing an elementary sampling unit within tens of meters. However, in South Korea, with its rugged terrain and complex forest structures, establishing this elementary sampling unit is challenging. In this study, we sought to find an optimal solution that considers both LAI and DHP footprints for various VZAs and to assess the feasibility of validating LAI derived from CAS500-4, scheduled for launch in 2025. In Korea, complex forest structures with rugged terrain obstruct the field of view of the fisheye lens. We analyzed the spatial coverage of the fisheye lenses at three sites with different VZAs ranging from 10° to 90°. The footprint radius was approximately 3 m at VZA 20° and around 10 meters at VZA 90°, varying by site due to their three-dimensional structure. We also analyzed the ratio of obstacles (e.g., tree trunks) on different VZAs using Z values of terrestrial LiDAR and gap fraction analysis on leaf-off season. The mean Z values decreased and the standard deviation of the Z value increased as VZA increased, especially after VZA of 40°. In the relatively open deciduous forest, it was found that the plant area index increased with increasing VZA in the season without leaves. VZA of 40° showed a plant area index of 0.5, and it increased rapidly in subsequent VZAs. It can be inferred that the woody components have more influence on the clumping index as VZA increases. Therefore, LAI values tended to be higher as VZA increased. Taking such factors into consideration, we decided to use VZA between 20° and 40° when calculating LAI, resulting in a footprint radius of approximately 5 m. Furthermore, we decided that the methods of LAI-2000/2200 and HA are not appropriate for Korean forests. To validate CAS500-4, which is designed for 10-m resolution, considering the complexity of forest structures, one to four fisheye lenses are expected to be necessary. The limitations in leaf angle distribution at low VZAs and on steep slopes will be considered in future research.
Supplementary Materials
The following supporting information can be downloaded at: https://www.mdpi.com/article/10.3390/f14102047/s1, Figure S1: The distribution of tree species, including diameter at breast height (DBH), in (a) Gwangneung, (b) Wando, and (c) Jeju. The full name of the tree species is represented in Table S1. Table S1: Abbreviation of tree species in Figure S1.
Author Contributions
J.L. (Junghee Lee) led manuscript writing and contributed to the data analysis and research design. S.C. contributed to the data analysis and discussion. J.L. (Joongbin Lim) contributed to data acquisition and discussion of the results. J.C. supervised this study, contributed to the research design, discussion, design and install fisheye lenses, and served as the corresponding author. K.J. contributed to design and install of the fisheye lenses and the discussion of the results. All authors have read and agreed to the published version of the manuscript.
Funding
This study was carried out with the support of the National Institute of Forest Science, Republic of Korea (Project No. ‘FM0103-2021-01-2023’ and ‘FM0103-2021-02-2023’).
Data Availability Statement
The data presented in this study are available on request from the corresponding author. The data are not publicly available due to ongoing QA/QC.
Conflicts of Interest
The authors declare no conflict of interest.
References
- Yan, G.; Hu, R.; Luo, J.; Weiss, M.; Jiang, H.; Mu, X.; Xie, D.; Zhang, W. Review of Indirect Optical Measurements of Leaf Area Index: Recent Advances, Challenges, and Perspectives. Agric. For. Meteorol. 2019, 265, 390–411. [Google Scholar] [CrossRef]
- Parker, G.G. Tamm Review: Leaf Area Index (LAI) Is Both a Determinant and a Consequence of Important Processes in Vegetation Canopies. For. Ecol. Manag. 2020, 477, 118496. [Google Scholar] [CrossRef]
- Bonan, G.B.; Pollard, D.; Thompson, S.L. Influence of Subgrid-Scale Heterogeneity in Leaf Area Index, Stomatal Resistance, and Soil Moisture on Grid-Scale Land--Atmosphere Interactions. J. Clim. 1993, 6, 1882–1897. [Google Scholar] [CrossRef]
- Anav, A.; Murray-Tortarolo, G.; Friedlingstein, P.; Sitch, S.; Piao, S.; Zhu, Z. Evaluation of Land Surface Models in Reproducing Satellite Derived Leaf Area Index over the High-Latitude Northern Hemisphere. Part II: Earth System Models. Remote Sens. 2013, 5, 3637–3661. [Google Scholar] [CrossRef]
- Kumar, S.V.; Mocko, D.M.; Wang, S.; Peters-Lidard, C.D.; Borak, J. Assimilation of Remotely Sensed Leaf Area Index into the Noah-MP Land Surface Model: Impacts on Water and Carbon Fluxes and States over the Continental United States. J. Hydrometeorol. 2019, 20, 1359–1377. [Google Scholar] [CrossRef]
- Morisette, J.T.; Baret, F.; Privette, J.L.; Myneni, R.B.; Nickeson, J.E.; Garrigues, S.; Shabanov, N.V.; Weiss, M.; Fernandes, R.A.; Leblanc, S.G.; et al. Validation of Global Moderate-Resolution LAI Products: A Framework Proposed within the CEOS Land Product Validation Subgroup. IEEE Trans. Geosci. Remote Sens. 2006, 44, 1804–1817. [Google Scholar] [CrossRef]
- Baret, F.; Camacho, F.; Fang, H.; Garrigues, S.; Gobron, N.; Lang, M.; Lacaze, R.; LeBlanc, S.; Meroni, M.; Martinez, B.; et al. Global Leaf Area Index Product Validation Good Practices; Academic Press: Cambridge, MA, USA, 2014. [Google Scholar]
- Meier, C.; Everhart, J.; Jones, K. TOS Protocol and Procedure: Measurement of Leaf Area Index, K ed.; National Ecological Observatory Network: Boulder, CO, USA, 2018. [Google Scholar]
- Karan, M.; Liddell, M.; Prober, S.M.; Arndt, S.; Beringer, J.; Boer, M.; Cleverly, J.; Eamus, D.; Grace, P.; Van Gorsel, E.; et al. The Australian SuperSite Network: A Continental, Long-Term Terrestrial Ecosystem Observatory. Sci. Total Environ. 2016, 568, 1263–1274. [Google Scholar] [CrossRef]
- Fang, H.; Baret, F.; Plummer, S.; Schaepman-Strub, G. An Overview of Global Leaf Area Index (LAI): Methods, Products, Validation, and Applications. Rev. Geophys. 2019, 57, 739–799. [Google Scholar] [CrossRef]
- Park, S.J. Generality and Specificity of Landforms of the Korean Peninsula, and Its Sustainability. J. Korean Geogr. Soc. 2014, 49, 656–674. [Google Scholar]
- Muscarella, R.; Kolyaie, S.; Morton, D.C.; Zimmerman, J.K.; Uriarte, M. Effects of Topography on Tropical Forest Structure Depend on Climate Context. J. Ecol. 2020, 108, 145–159. [Google Scholar] [CrossRef]
- Gonsamo, A.; Walter, J.-M.N.; Pellikka, P. Sampling Gap Fraction and Size for Estimating Leaf Area and Clumping Indices from Hemispherical Photographs. Can. J. For. Res. 2010, 40, 1588–1603. [Google Scholar] [CrossRef]
- Leblanc, S.G.; Chen, J.M. A Practical Scheme for Correcting Multiple Scattering Effects on Optical LAI Measurements. Agric. For. Meteorol. 2001, 110, 125–139. [Google Scholar] [CrossRef]
- Stenberg, P.; Linder, S.; Smolander, H.; Flower-Ellis, J. Performance of the LAI-2000 Plant Canopy Analyzer in Estimating Leaf Area Index of Some Scots Pine Stands. Tree Physiol. 1994, 14, 981–995. [Google Scholar] [CrossRef] [PubMed]
- Varhola, A.; Coops, N.C. Estimation of Watershed-Level Distributed Forest Structure Metrics Relevant to Hydrologic Modeling Using LiDAR and Landsat. J. Hydrol. 2013, 487, 70–86. [Google Scholar] [CrossRef]
- Majasalmi, T.; Korhonen, L.; Korpela, I.; Vauhkonen, J. Application of 3D Triangulations of Airborne Laser Scanning Data to Estimate Boreal Forest Leaf Area Index. Int. J. Appl. Earth Obs. Geoinf. 2017, 59, 53–62. [Google Scholar] [CrossRef]
- Geng, J.; Yuan, G.; Chen, J.M.; Lyu, C.; Tu, L.; Fan, W.; Tian, Q.; Wu, Z.; Tao, T.; Yu, M.; et al. Error Analysis of LAI Measurements with LAI-2000 Due to Discrete View Angular Range Angles for Continuous Canopies. Remote Sens. 2021, 13, 1405. [Google Scholar] [CrossRef]
- Lee, B.; Kim, N.; Kim, E.-S.; Jang, K.; Kang, M.; Lim, J.-H.; Cho, J.; Lee, Y. An Artificial Intelligence Approach to Predict Gross Primary Productivity in the Forests of South Korea Using Satellite Remote Sensing Data. Forests 2020, 11, 1000. [Google Scholar] [CrossRef]
- Korea Meteorological Administration. Climatological Normals of Korea; Korea Meteorological Administration: Seoul, Republic of Korea, 2015.
- Yun, S.J.; Chun, J. Long-Term Ecological Research on Korean Forest Ecosystems: The Current Status and Challenges. Ecol. Res. 2018, 33, 1289–1302. [Google Scholar] [CrossRef]
- Chianucci, F.; Cutini, A. Digital Hemispherical Photography for Estimating Forest Canopy Properties: Current Controversies and Opportunities. IForest-Biogeosci. For. 2012, 5, 290. [Google Scholar] [CrossRef]
- Li, S.; Fang, H.; Zhang, Y.; Wang, Y. Comprehensive Evaluation of Global CI, FVC, and LAI Products and Their Relationships Using High-Resolution Reference Data. Sci. Remote Sens. 2022, 6, 100066. [Google Scholar] [CrossRef]
- Niedballa, J.; Axtner, J.; Döbert, T.F.; Tilker, A.; Nguyen, A.; Wong, S.T.; Fiderer, C.; Heurich, M.; Wilting, A. Imageseg: An R Package for Deep Learning-Based Image Segmentation. Methods Ecol. Evol. 2022, 13, 2363–2371. [Google Scholar] [CrossRef]
- Chianucci, F.; Macek, M. HemispheR: An R Package for Fisheye Canopy Image Analysis. Agric. For. Meteorol. 2023, 336, 109470. [Google Scholar] [CrossRef]
- Miller, J.B. A Formula for Average Foliage Density. Aust. J. Bot. 1967, 15, 141–144. [Google Scholar] [CrossRef]
- Lang, A.R.G.; Yueqin, X. Estimation of Leaf Area Index from Transmission of Direct Sunlight in Discontinuous Canopies. Agric. For. Meteorol. 1986, 37, 229–243. [Google Scholar] [CrossRef]
- Ryu, Y.; Nilson, T.; Kobayashi, H.; Sonnentag, O.; Law, B.E.; Baldocchi, D.D. On the Correct Estimation of Effective Leaf Area Index: Does It Reveal Information on Clumping Effects? Agric. For. Meteorol. 2010, 150, 463–472. [Google Scholar] [CrossRef]
- Leblanc, S.G.; Fournier, R.A. Hemispherical Photography Simulations with an Architectural Model to Assess Retrieval of Leaf Area Index. Agric. For. Meteorol. 2014, 194, 64–76. [Google Scholar] [CrossRef]
- Kwon, B.; Kim, H.S.; Jeon, J.; Yi, M.J. Effects of Temporal and Interspecific Variation of Specific Leaf Area on Leaf Area Index Estimation of Temperate Broadleaved Forests in Korea. Forests 2016, 7, 215. [Google Scholar] [CrossRef]
- Chen, J.M.; Black, T.A. Measuring Leaf Area Index of Plant Canopies with Branch Architecture. Agric. For. Meteorol. 1991, 57, 1–12. [Google Scholar] [CrossRef]
- Macfarlane, C.; Grigg, A.; Evangelista, C. Estimating Forest Leaf Area Using Cover and Fullframe Fisheye Photography: Thinking inside the Circle. Agric. For. Meteorol. 2007, 146, 1–12. [Google Scholar] [CrossRef]
- Wagner, S.; Hagemeier, M. Method of Segmentation Affects Leaf Inclination Angle Estimation in Hemispherical Photography. Agric. For. Meteorol. 2006, 139, 12–24. [Google Scholar] [CrossRef]
- Chianucci, F.; Pisek, J.; Raabe, K.; Marchino, L.; Ferrara, C.; Corona, P. A Dataset of Leaf Inclination Angles for Temperate and Boreal Broadleaf Woody Species. Ann. For. Sci. 2018, 75, 50. [Google Scholar] [CrossRef]
- Bao, Y.; Ni, W.; Wang, D.; Yue, C.; He, H.; Verbeeck, H. Effects of Tree Trunks on Estimation of Clumping Index and LAI from HemiView and Terrestrial LiDAR. Forests 2018, 9, 144. [Google Scholar] [CrossRef]
- Chen, J.M. Optically-Based Methods for Measuring Seasonal Variation of Leaf Area Index in Boreal Conifer Stands. Agric. For. Meteorol. 1996, 80, 135–163. [Google Scholar] [CrossRef]
- Weiss, M.; Baret, F.; Smith, G.J.; Jonckheere, I.; Coppin, P. Review of Methods for in Situ Leaf Area Index (LAI) Determination: Part II. Estimation of LAI, Errors and Sampling. Agric. For. Meteorol. 2004, 121, 37–53. [Google Scholar] [CrossRef]
- Yan, G.; Jiang, H.; Luo, J.; Mu, X.; Li, F.; Qi, J.; Hu, R.; Xie, D.; Zhou, G. Quantitative Evaluation of Leaf Inclination Angle Distribution on Leaf Area Index Retrieval of Coniferous Canopies. J. Remote Sens. 2021, 2021, 2708904. [Google Scholar] [CrossRef]
- Bailey, B.N.; Mahaffee, W.F. Rapid Measurement of the Three-Dimensional Distribution of Leaf Orientation and the Leaf Angle Probability Density Function Using Terrestrial LiDAR Scanning. Remote Sens. Environ. 2017, 194, 63–76. [Google Scholar] [CrossRef]
- Vicari, M.B.; Pisek, J.; Disney, M. New Estimates of Leaf Angle Distribution from Terrestrial LiDAR: Comparison with Measured and Modelled Estimates from Nine Broadleaf Tree Species. Agric. For. Meteorol. 2019, 264, 322–333. [Google Scholar] [CrossRef]
- Liu, J.; Skidmore, A.K.; Wang, T.; Zhu, X.; Premier, J.; Heurich, M.; Beudert, B.; Jones, S. Variation of Leaf Angle Distribution Quantified by Terrestrial LiDAR in Natural European Beech Forest. ISPRS J. Photogramm. Remote Sens. 2019, 148, 208–220. [Google Scholar] [CrossRef]
- Stovall, A.E.L.; Masters, B.; Fatoyinbo, L.; Yang, X. TLSLeAF: Automatic Leaf Angle Estimates from Single-Scan Terrestrial Laser Scanning. New Phytol. 2021, 232, 1876–1892. [Google Scholar] [CrossRef]
- Gonsamo, A.; Pellikka, P. Methodology Comparison for Slope Correction in Canopy Leaf Area Index Estimation Using Hemispherical Photography. For. Ecol. Manag. 2008, 256, 749–759. [Google Scholar] [CrossRef]
Disclaimer/Publisher’s Note: The statements, opinions and data contained in all publications are solely those of the individual author(s) and contributor(s) and not of MDPI and/or the editor(s). MDPI and/or the editor(s) disclaim responsibility for any injury to people or property resulting from any ideas, methods, instructions or products referred to in the content. |
© 2023 by the authors. Licensee MDPI, Basel, Switzerland. This article is an open access article distributed under the terms and conditions of the Creative Commons Attribution (CC BY) license (https://creativecommons.org/licenses/by/4.0/).