
Climatic Stress Test of Scots Pine Provenances in Northeastern Europe Reveals High Phenotypic Plasticity and Quasi-Linear Response to Warming


Abstract
:1. Introduction
- to identify the trend in growth responses across the investigated climate range based on reaction norms of populations;
- to compare transfer functions calculated for selected test locations to analyze their configuration under different climatic conditions;
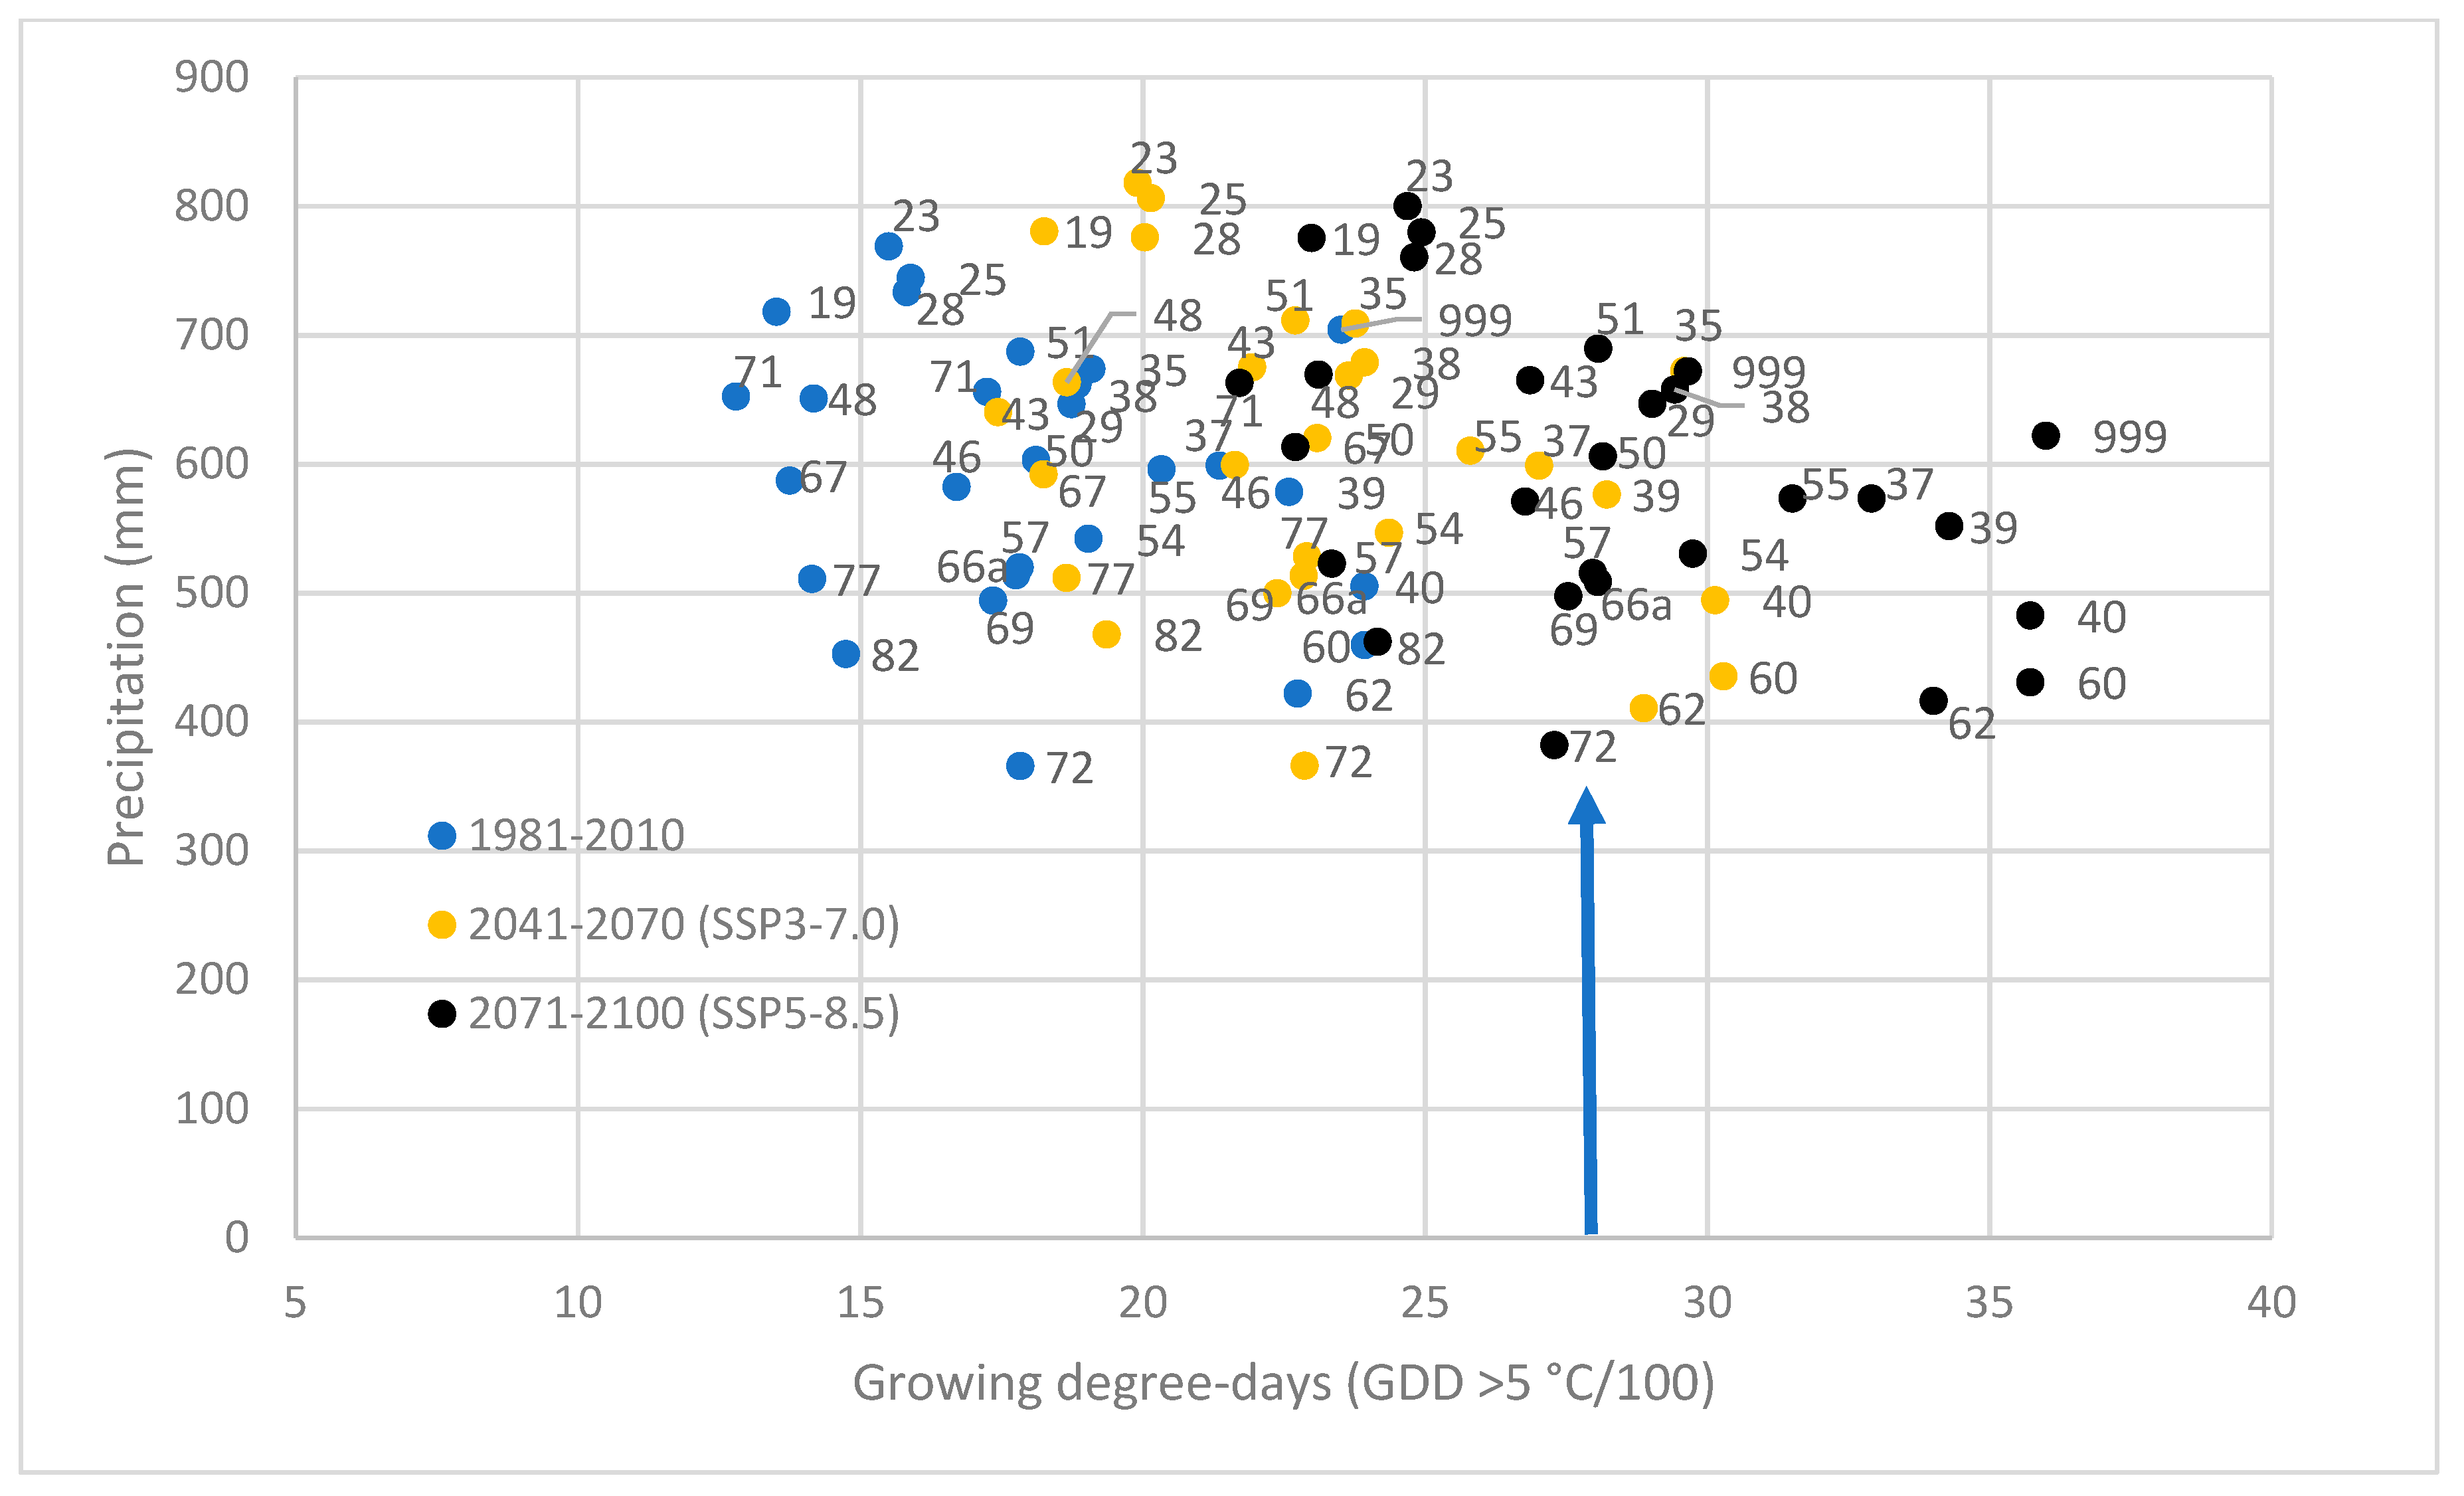
- to place the responses into the context of climate projections; and
- to assess the inherent potential of Scots pine in the study region to withstand projected changes in their original location.
2. Materials and Methods
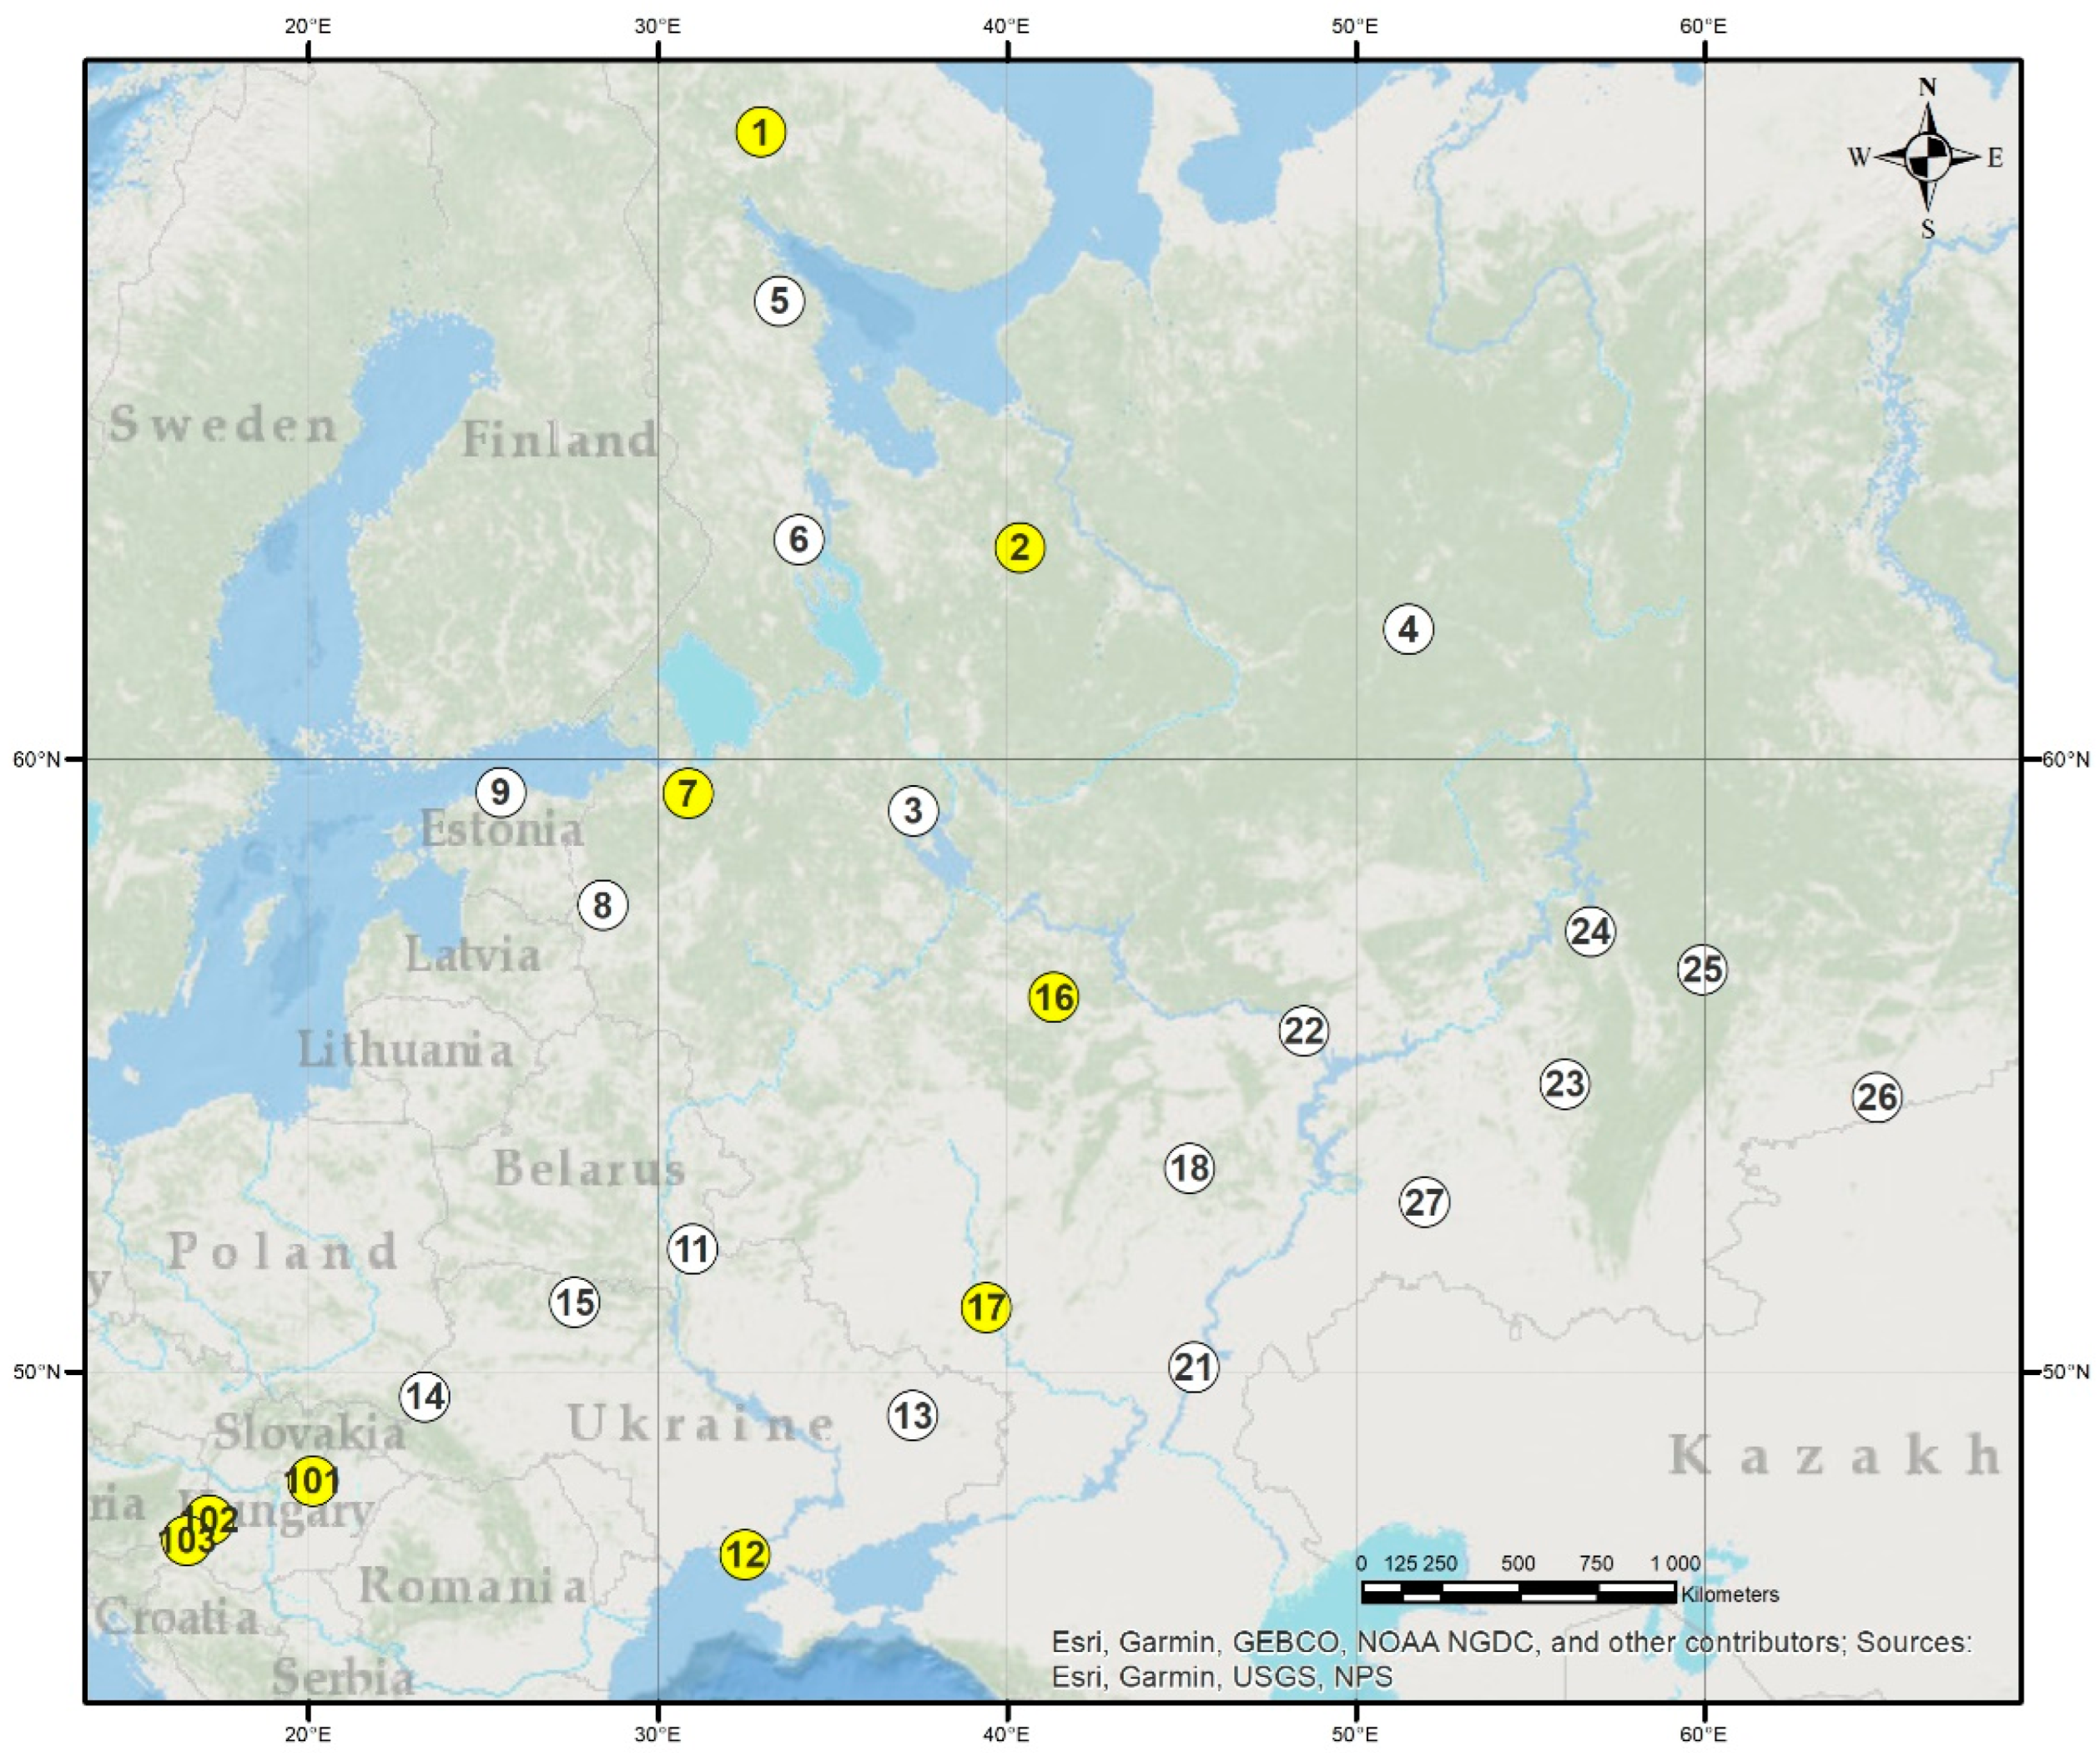
2.1. The VNIILM Provenance Test Network
2.2. The Hungarian Tests

| Code, Location, and County Name | N. Latitude Decim. | E. Longitude Decim. | Elevation (m a.s.l.) | Growing Degree Days * 1981–2010 (CHELSA) | Annual Precipitation (mm) 1981–2010 (CHELSA) | Mean Annual Height Increment ** (cm) |
|---|---|---|---|---|---|---|
| 101. Recsk, Heves | 47.930 | 20.120 | 179 | 24.311 | 607 | 43.5 |
| 102. Egyházashetye, Vas | 47.170 | 17.120 | 134 | 25.896 | 668 | 38.2 |
| 103. Kerkafalva, Zala | 46.770 | 16.490 | 196 | 25.355 | 752 | 42.7 |
2.3. The Selected Study Region within the Range of Scots Pine
2.4. Selection of Climate Variables and the Climate Data Source
2.5. Analysis of Provenance Data
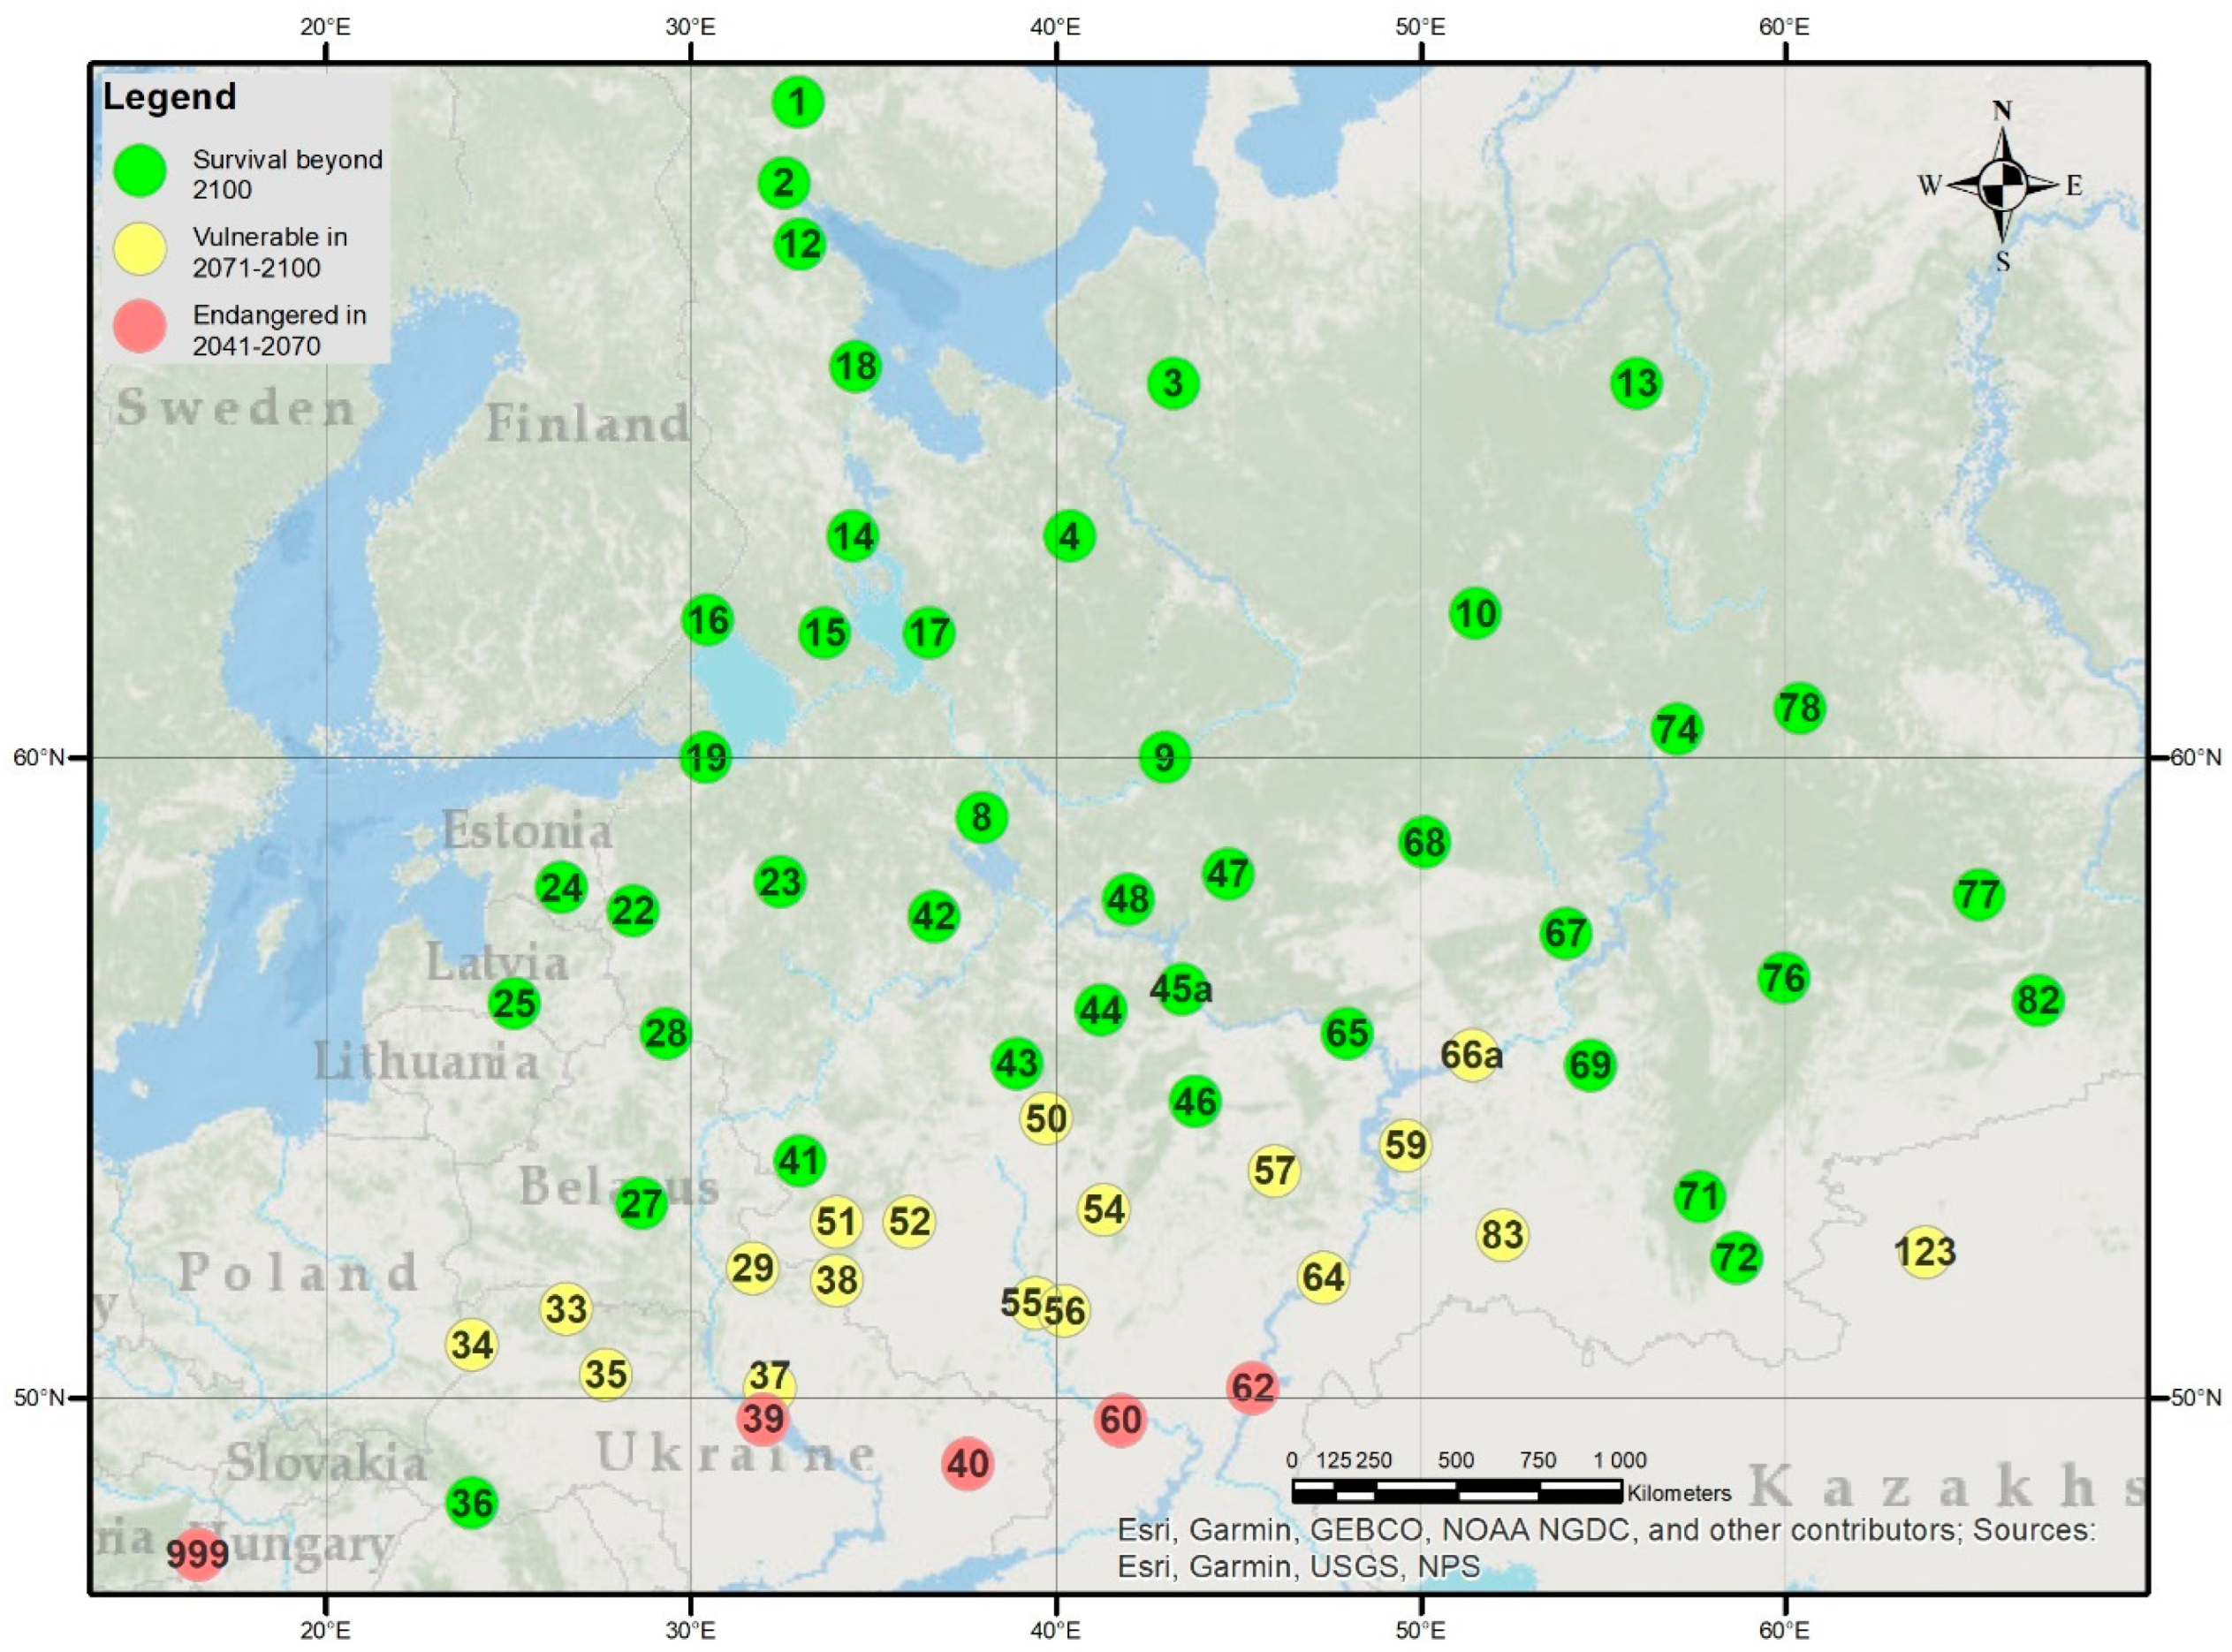
2.6. Estimating the Climatic Limits of Survival
- (1)
- the north–central provenances, to investigate the change in responses along the north–south climate gradient; and
- (2)
3. Results
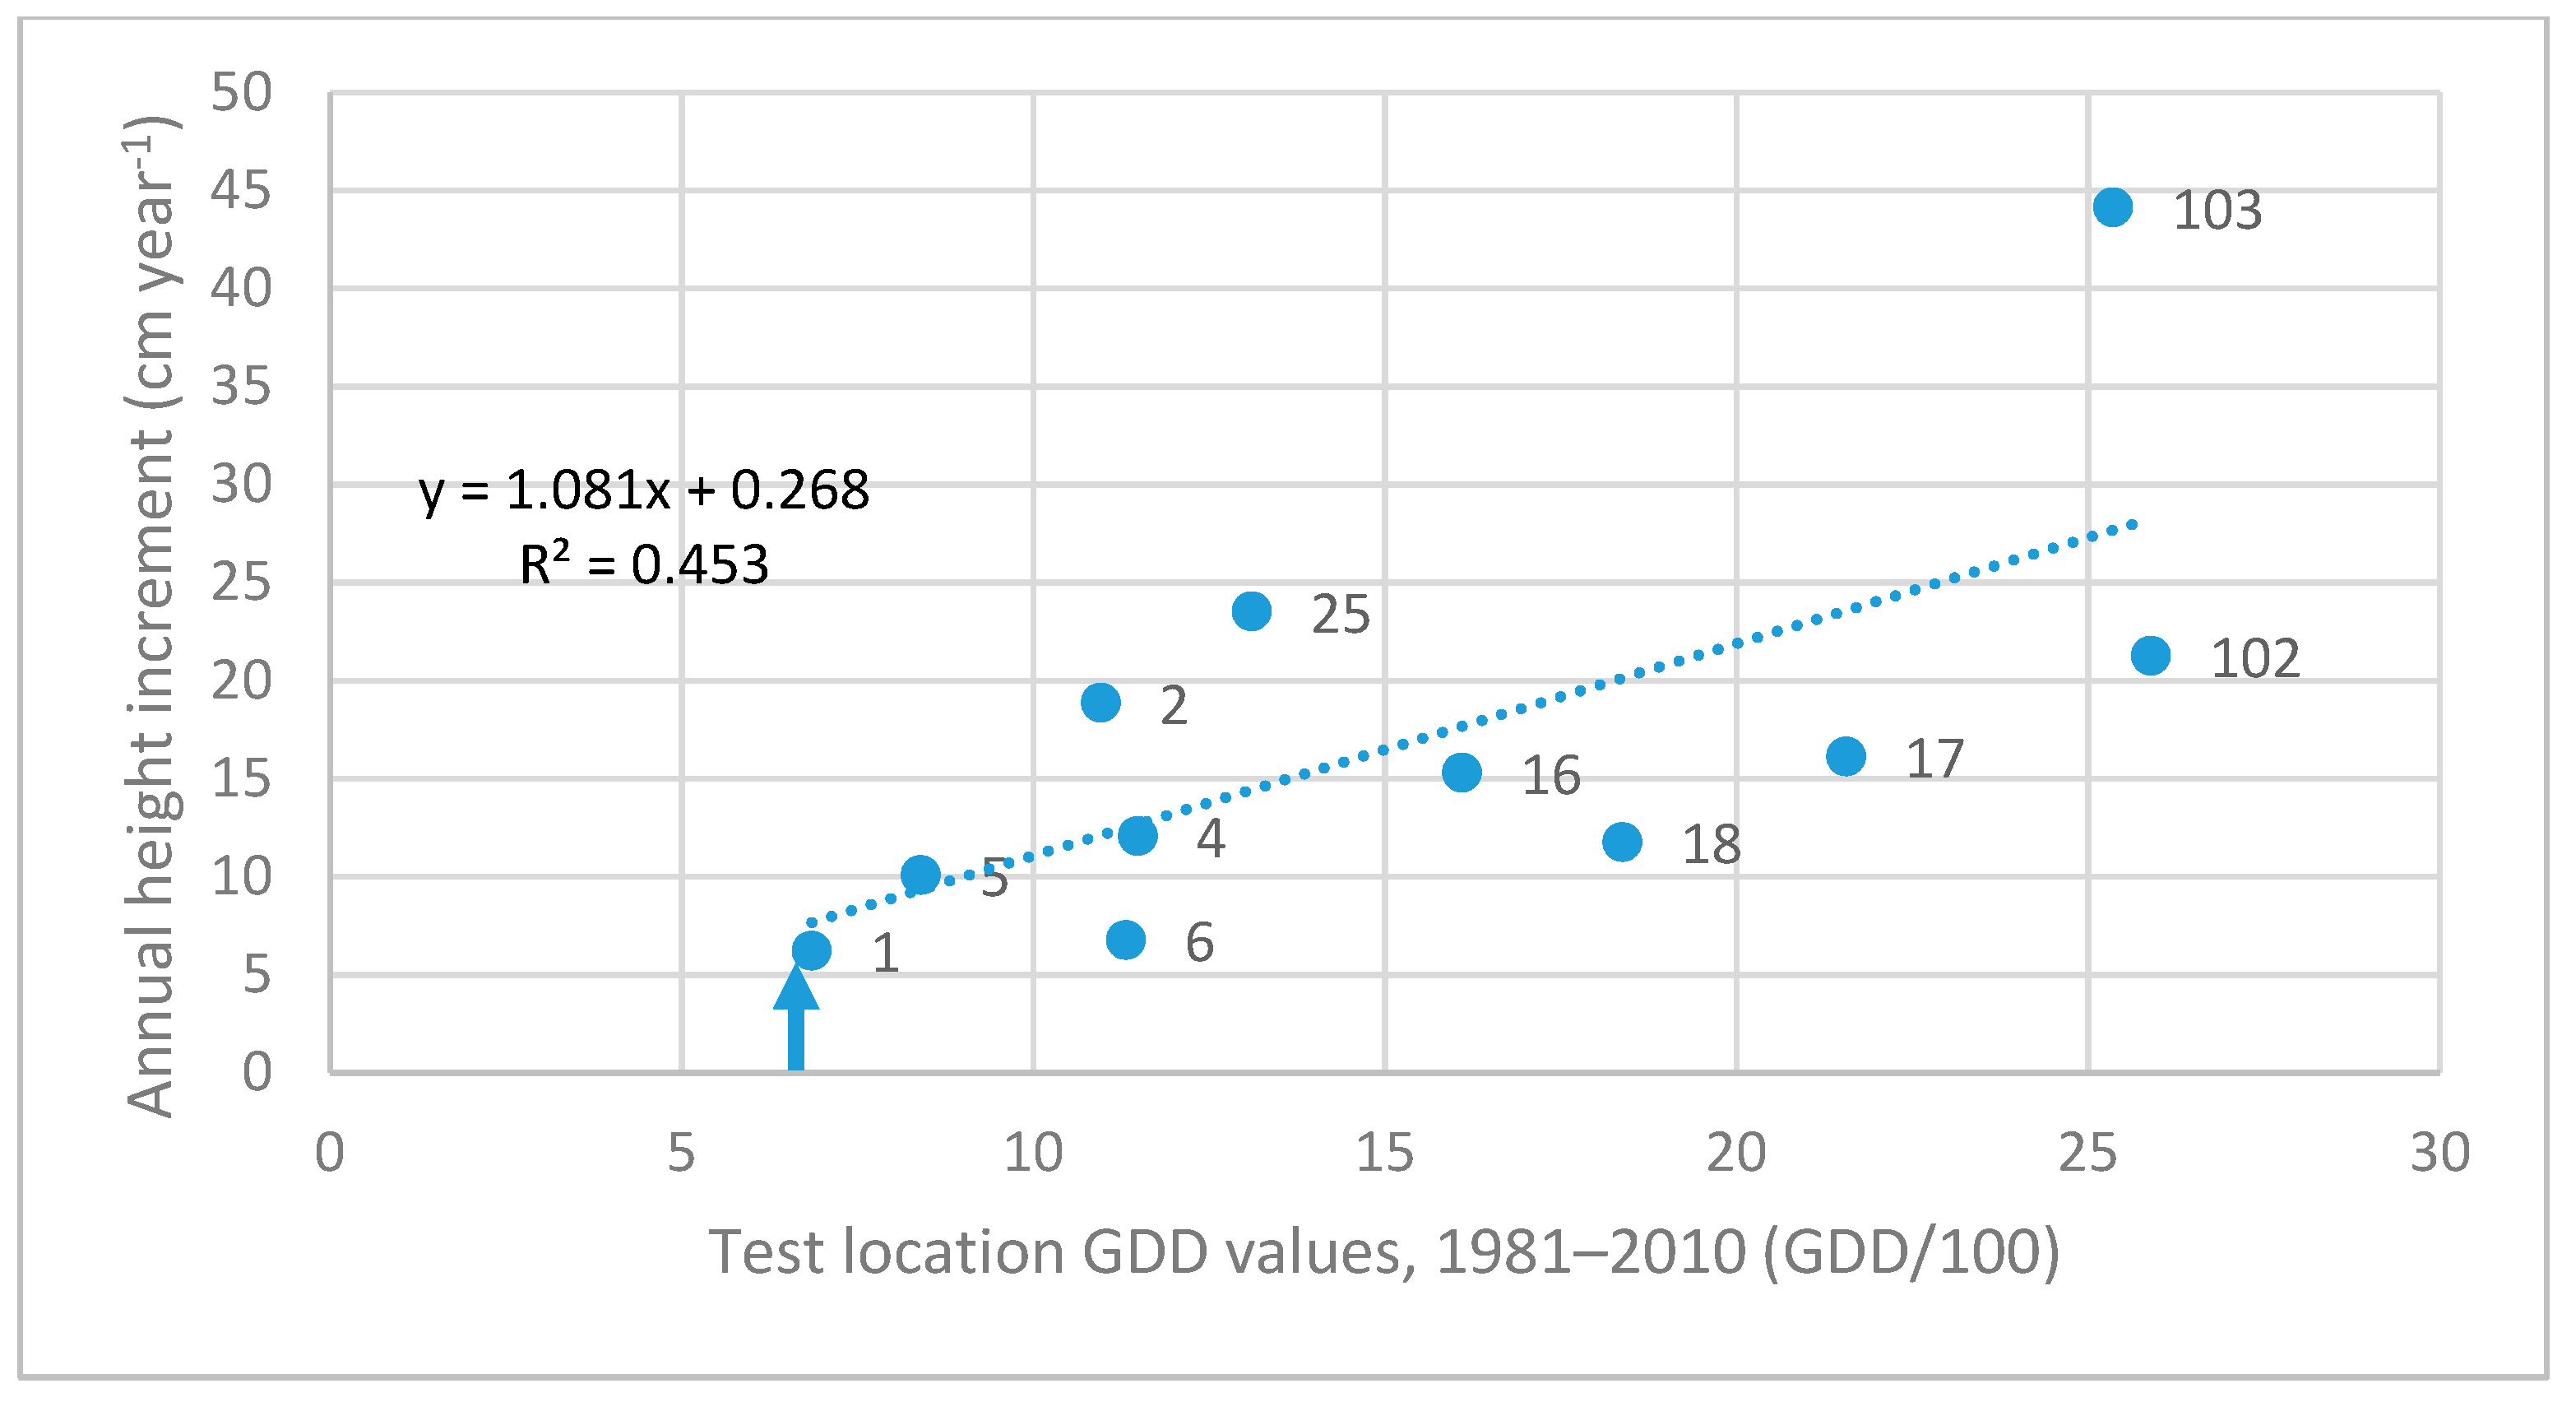
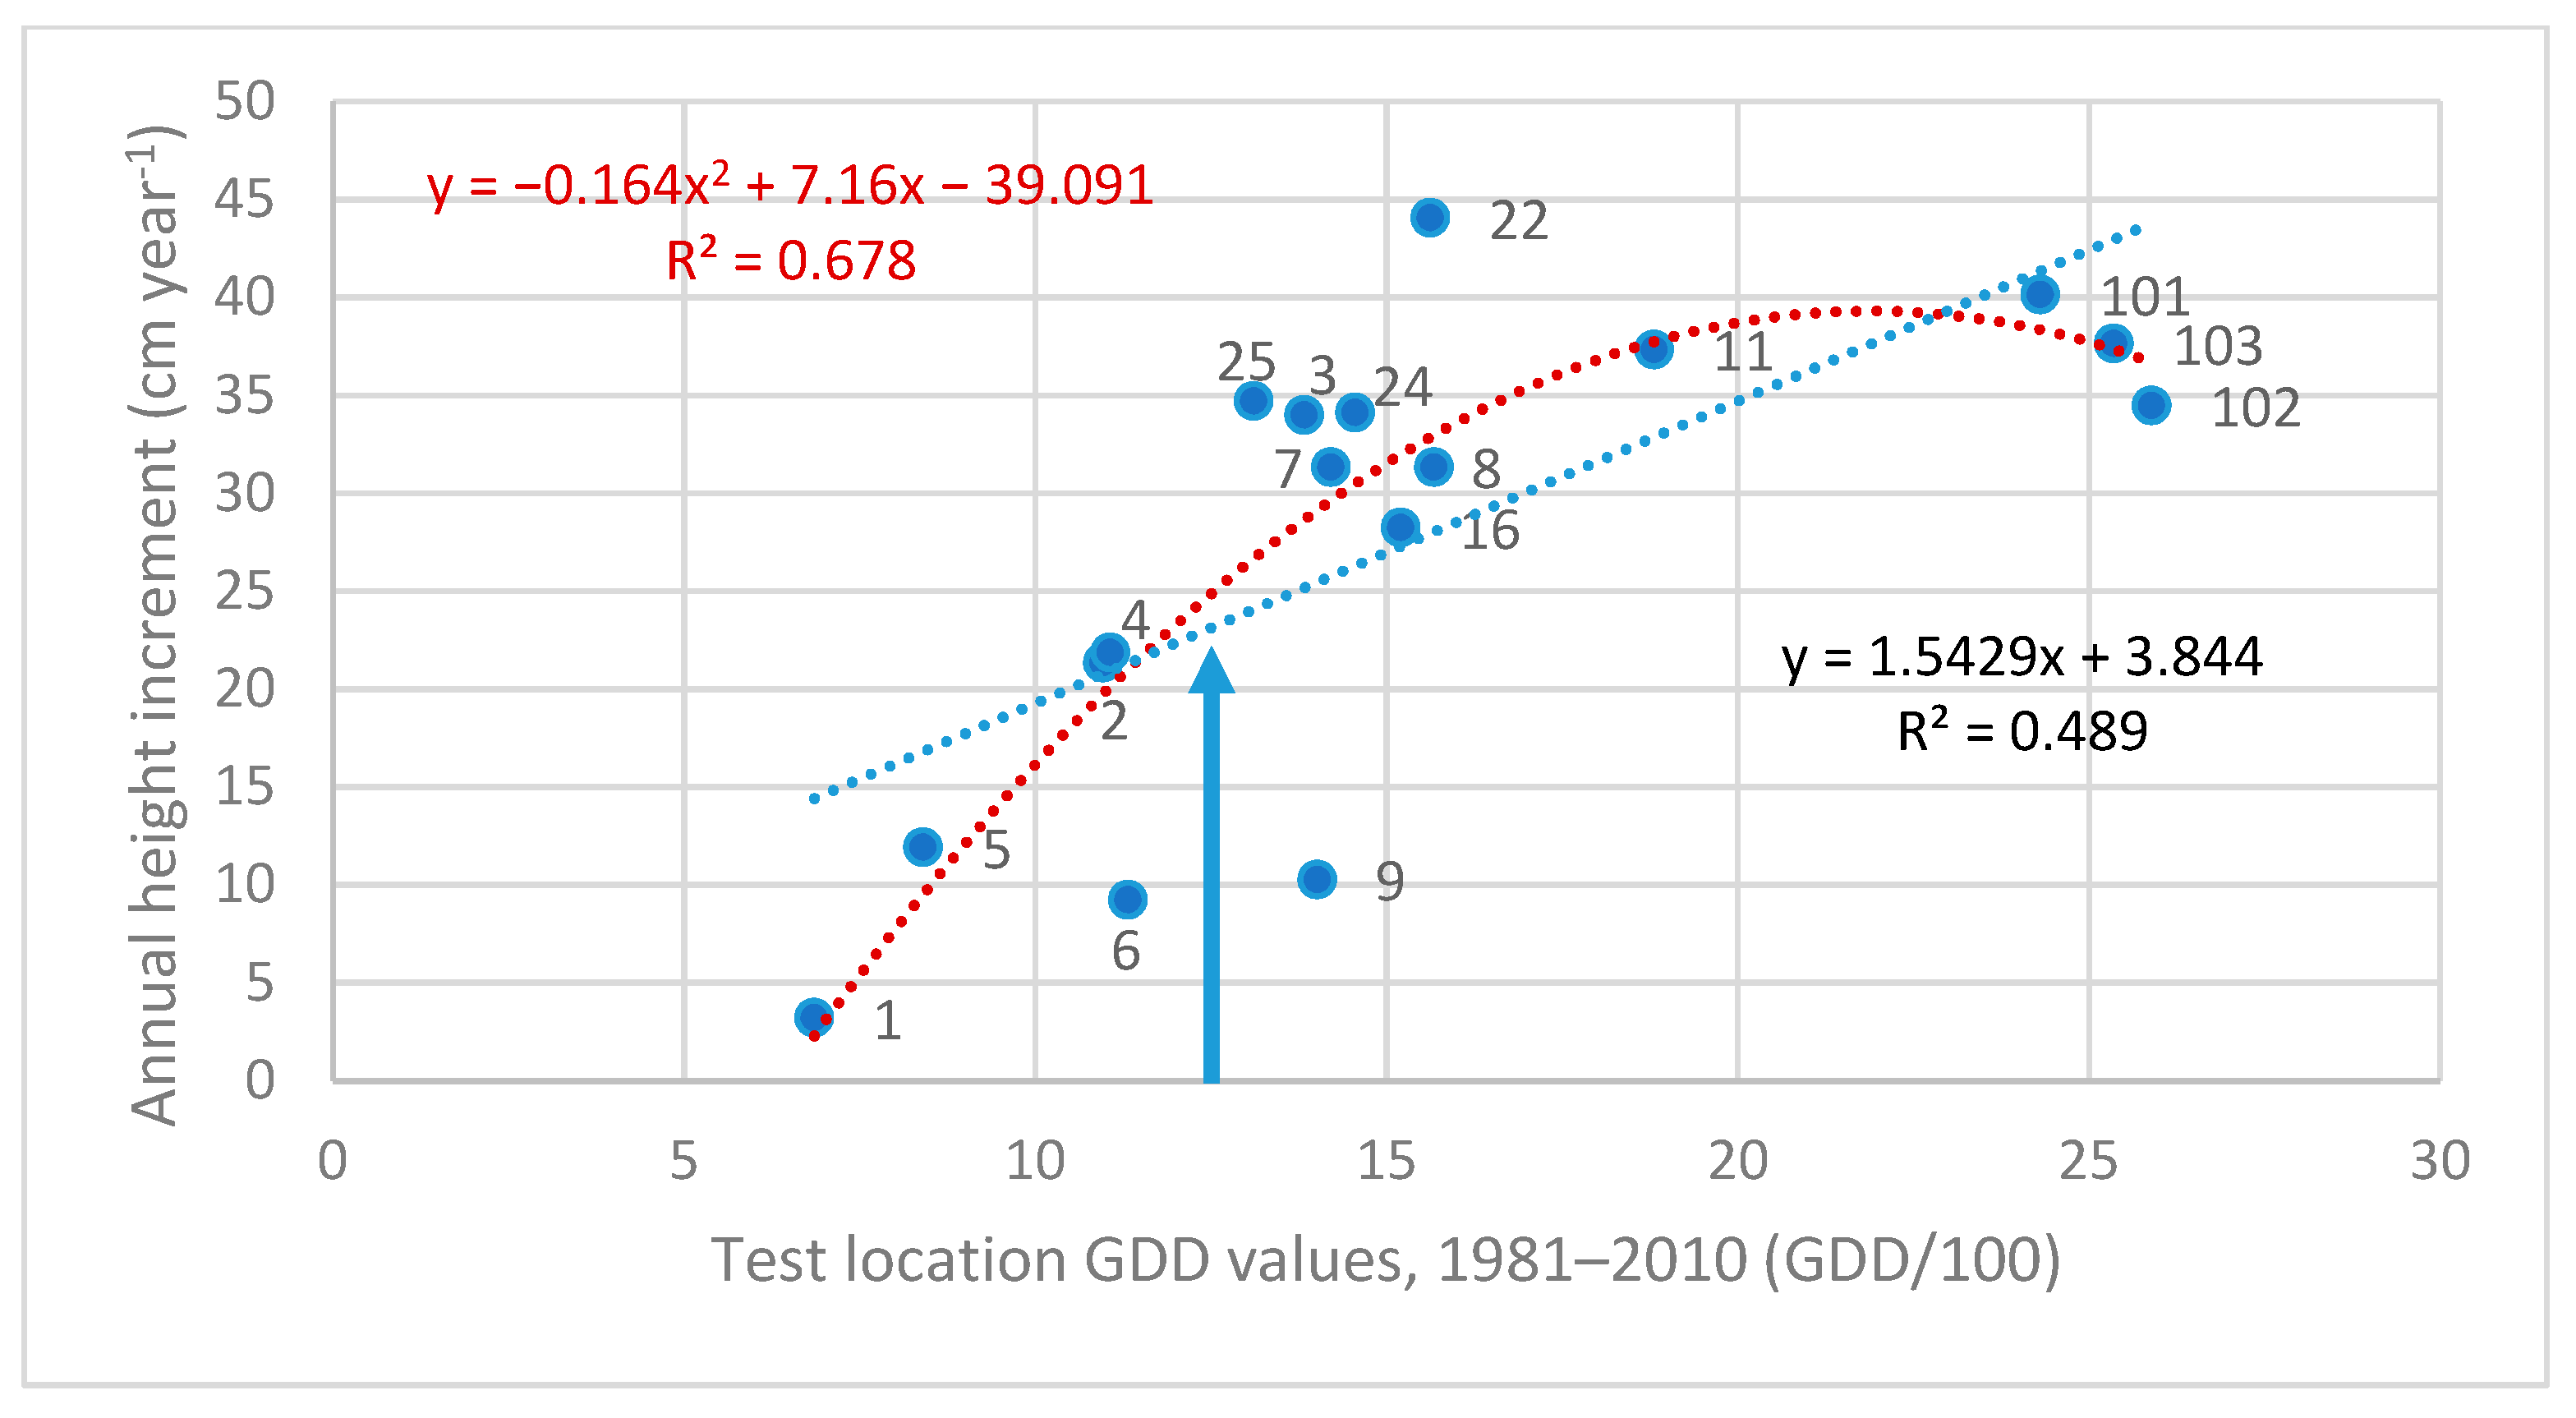
3.1. Reaction Norm (Response Equation) of North–Central Provenances
| Provenance | Linear Equation | Quadratic Equation | |||
|---|---|---|---|---|---|
| Name | GDD * | Slope | R2 | Parameters of x | R2 |
| 02. Kandalaksha, RU | 667 | 1.081 | 0.453 | insignificant ** | - |
| 04. Plesetsk, RU | 1096 | 1.474 | 0.546 | −0.083x2 + 4.327x | 0.597 |
| 15. Pryazha, RU | 1153 | 1.202 | 0.487 | −0.110x2 + 4.895x | 0.623 |
| 09. Totma, RU | 1296 | 1.543 | 0.489 | −0.1635x2 + 7.160x | 0.678 |
| 19. Lisino, RU | 1351 | 1.667 | 0.512 | −0.208x2 + 9.380x | 0.628 |
| 28. Rasony, BY | 1582 | 1.319 | 0.344 | insignificant | - |
| 23. Kresttsy, RU | 1550 | 1.569 | 0.507 | −0.137x2 + 6.659x | 0.557 |
| 25. Jelgava, LAT | 1589 | 1.338 | 0.274 | insignificant | - |

3.2. Reaction Norm (Response Equation) of Southern Provenances
| Provenance | Linear Equation | Quadratic Equation | |||
|---|---|---|---|---|---|
| Code, Name, Country | GDD * | Slope | R2 | Parameters of x | R2 |
| 29. Lenino, BY | 1874 | 1.626 | 0.466 | insignificant ** | - |
| 38. Svessa, UA | 1884 | 0.974 | 0.153 | −0.238x2 + 11.112x | 0.230 |
| 35. Olevsk, UA | 1909 | 1.170 | 0.326 | insignificant | - |
| 56. Voron./Khrenovoe, RU | 2022 | 0.644 | 0.082 | insignificant | - |
| 55. Voron./Grafskaya, RU | 2033 | 0.890 | 0.191 | insignificant | - |
| 37. Borispol, UA | 2136 | 1.581 | 0.426 | insignificant | - |
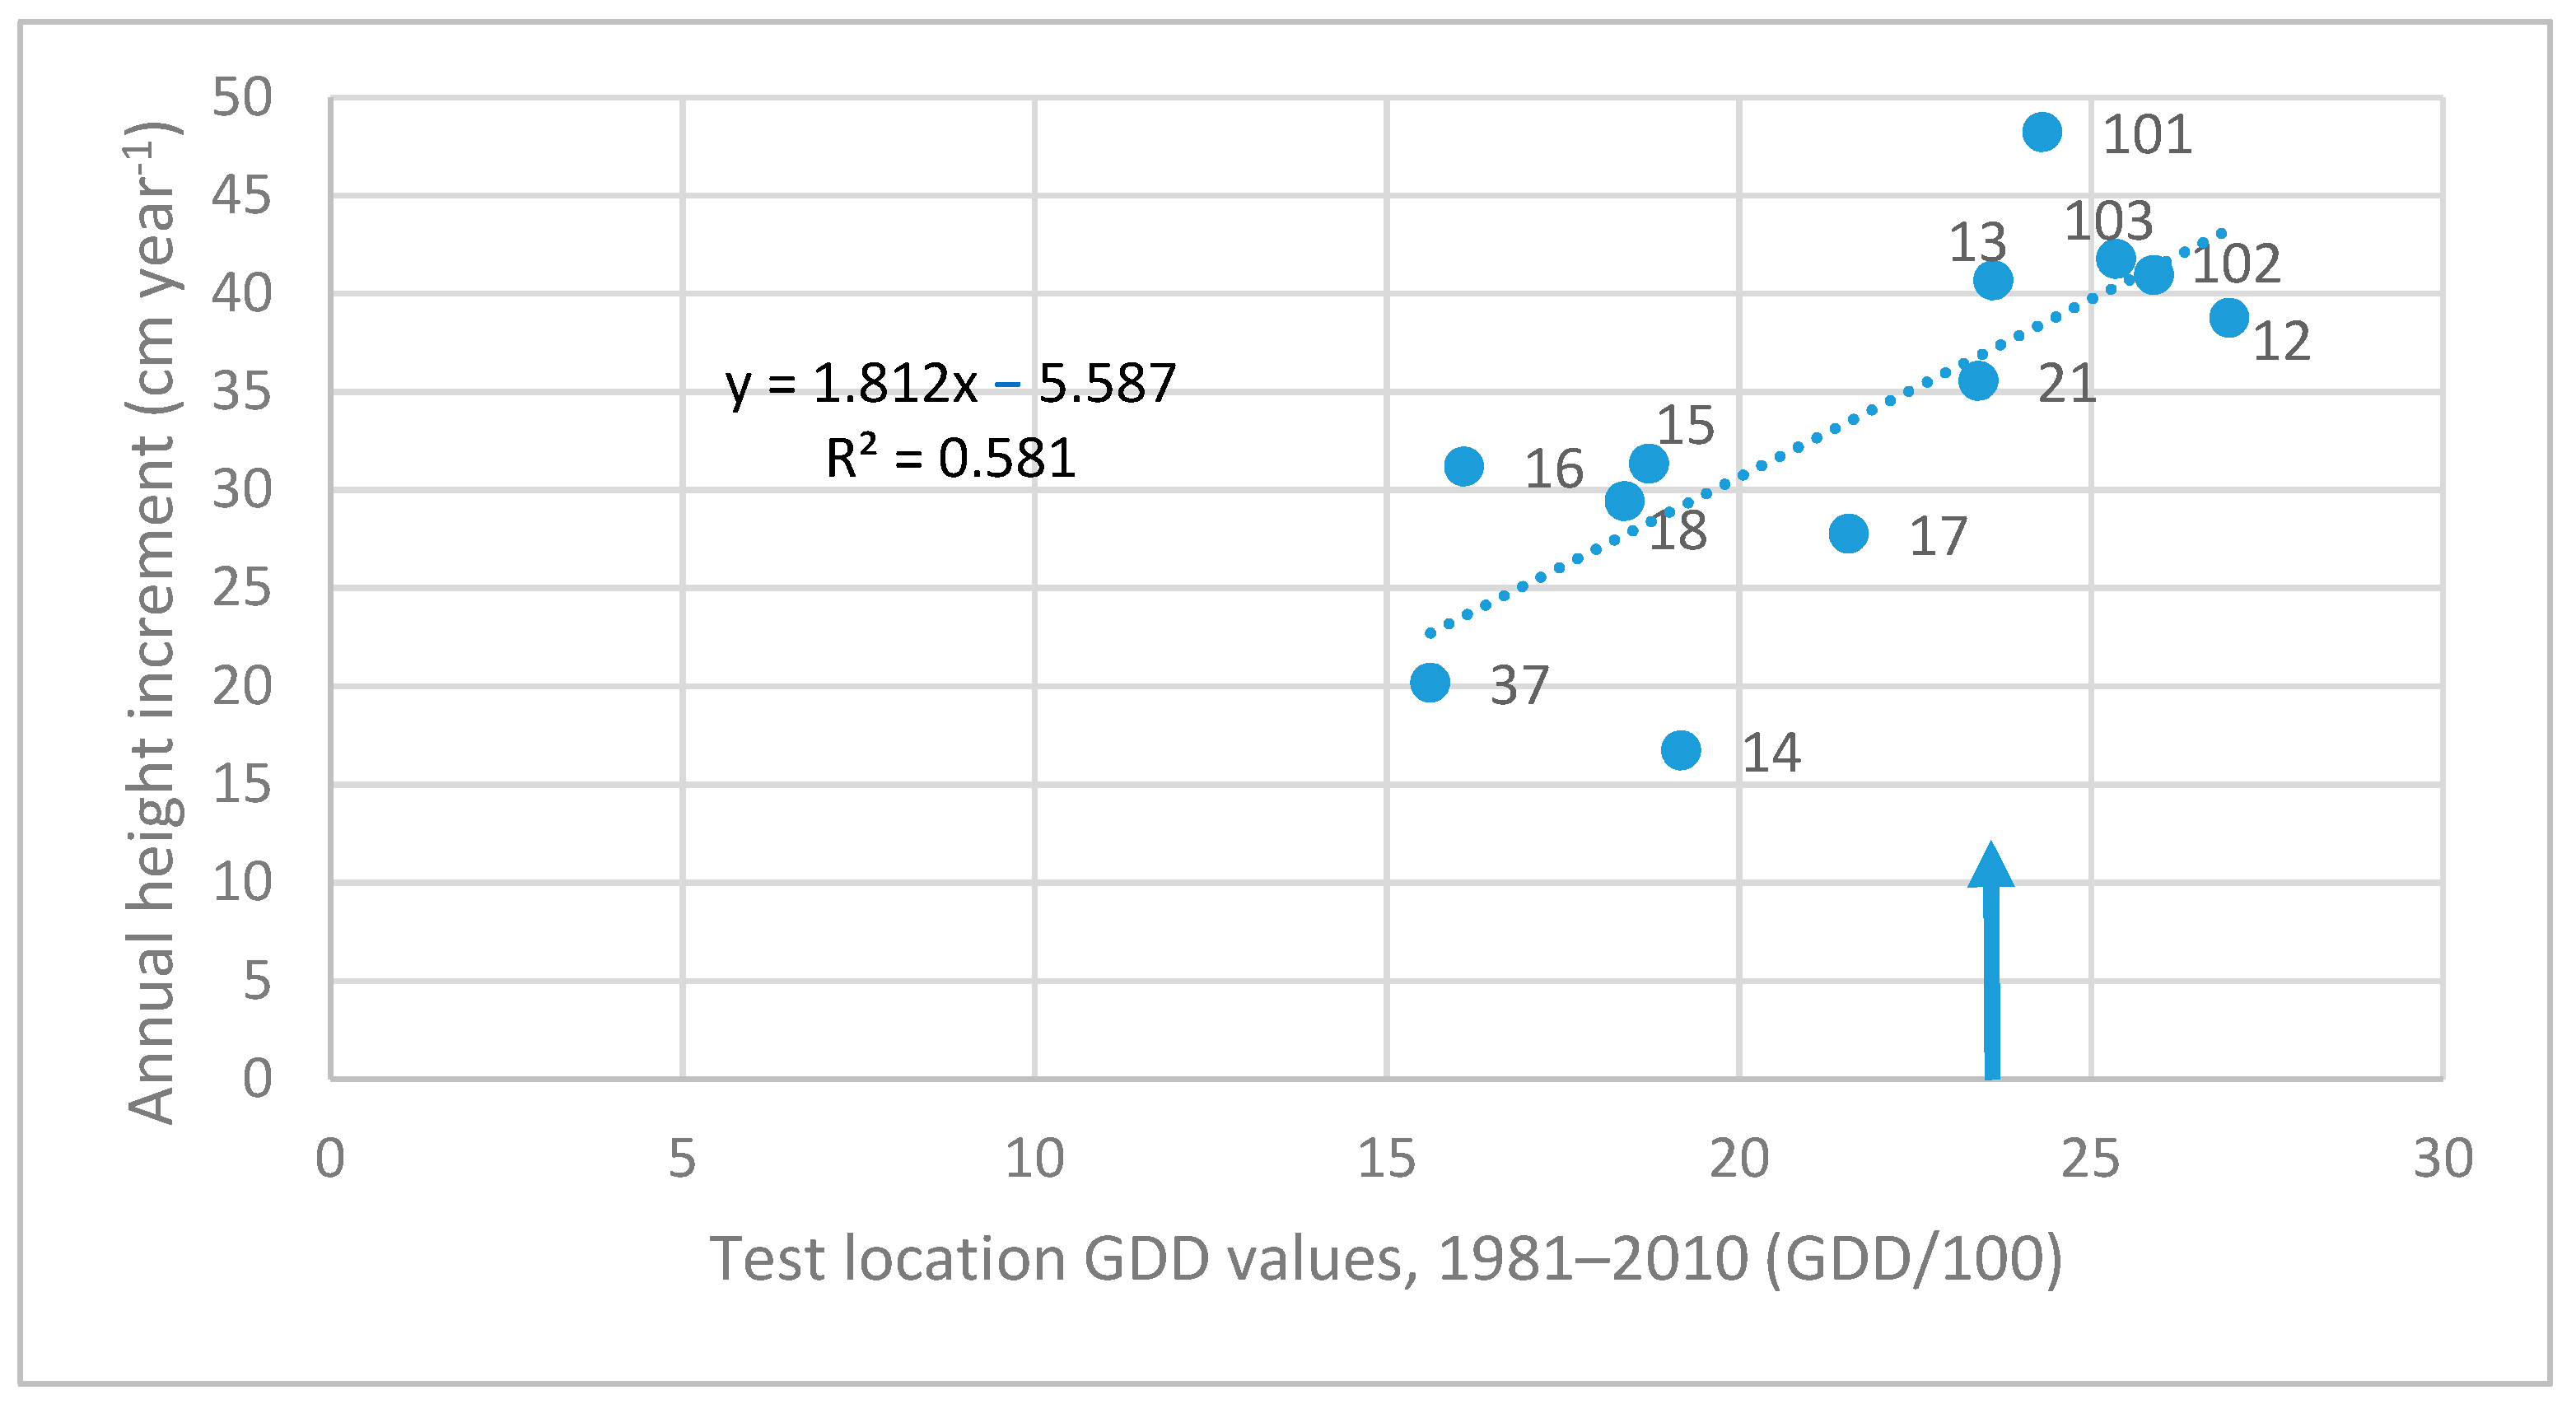
| 40. Slovyansk, UA | 2392 | 1.812 | 0.581 | insignificant | - |
| 60. Veshenskaya, RU | 2393 | 1.774 | 0.719 | −0.0984x2 + 5.9472x | 0.735 |
| 39. Cherkasy, UA | 2259 | 1.370 | 0.399 | insignificant | - |
| 62. Kamyshin, RU | 2274 | 1.413 | 0.404 | insignificant | - |
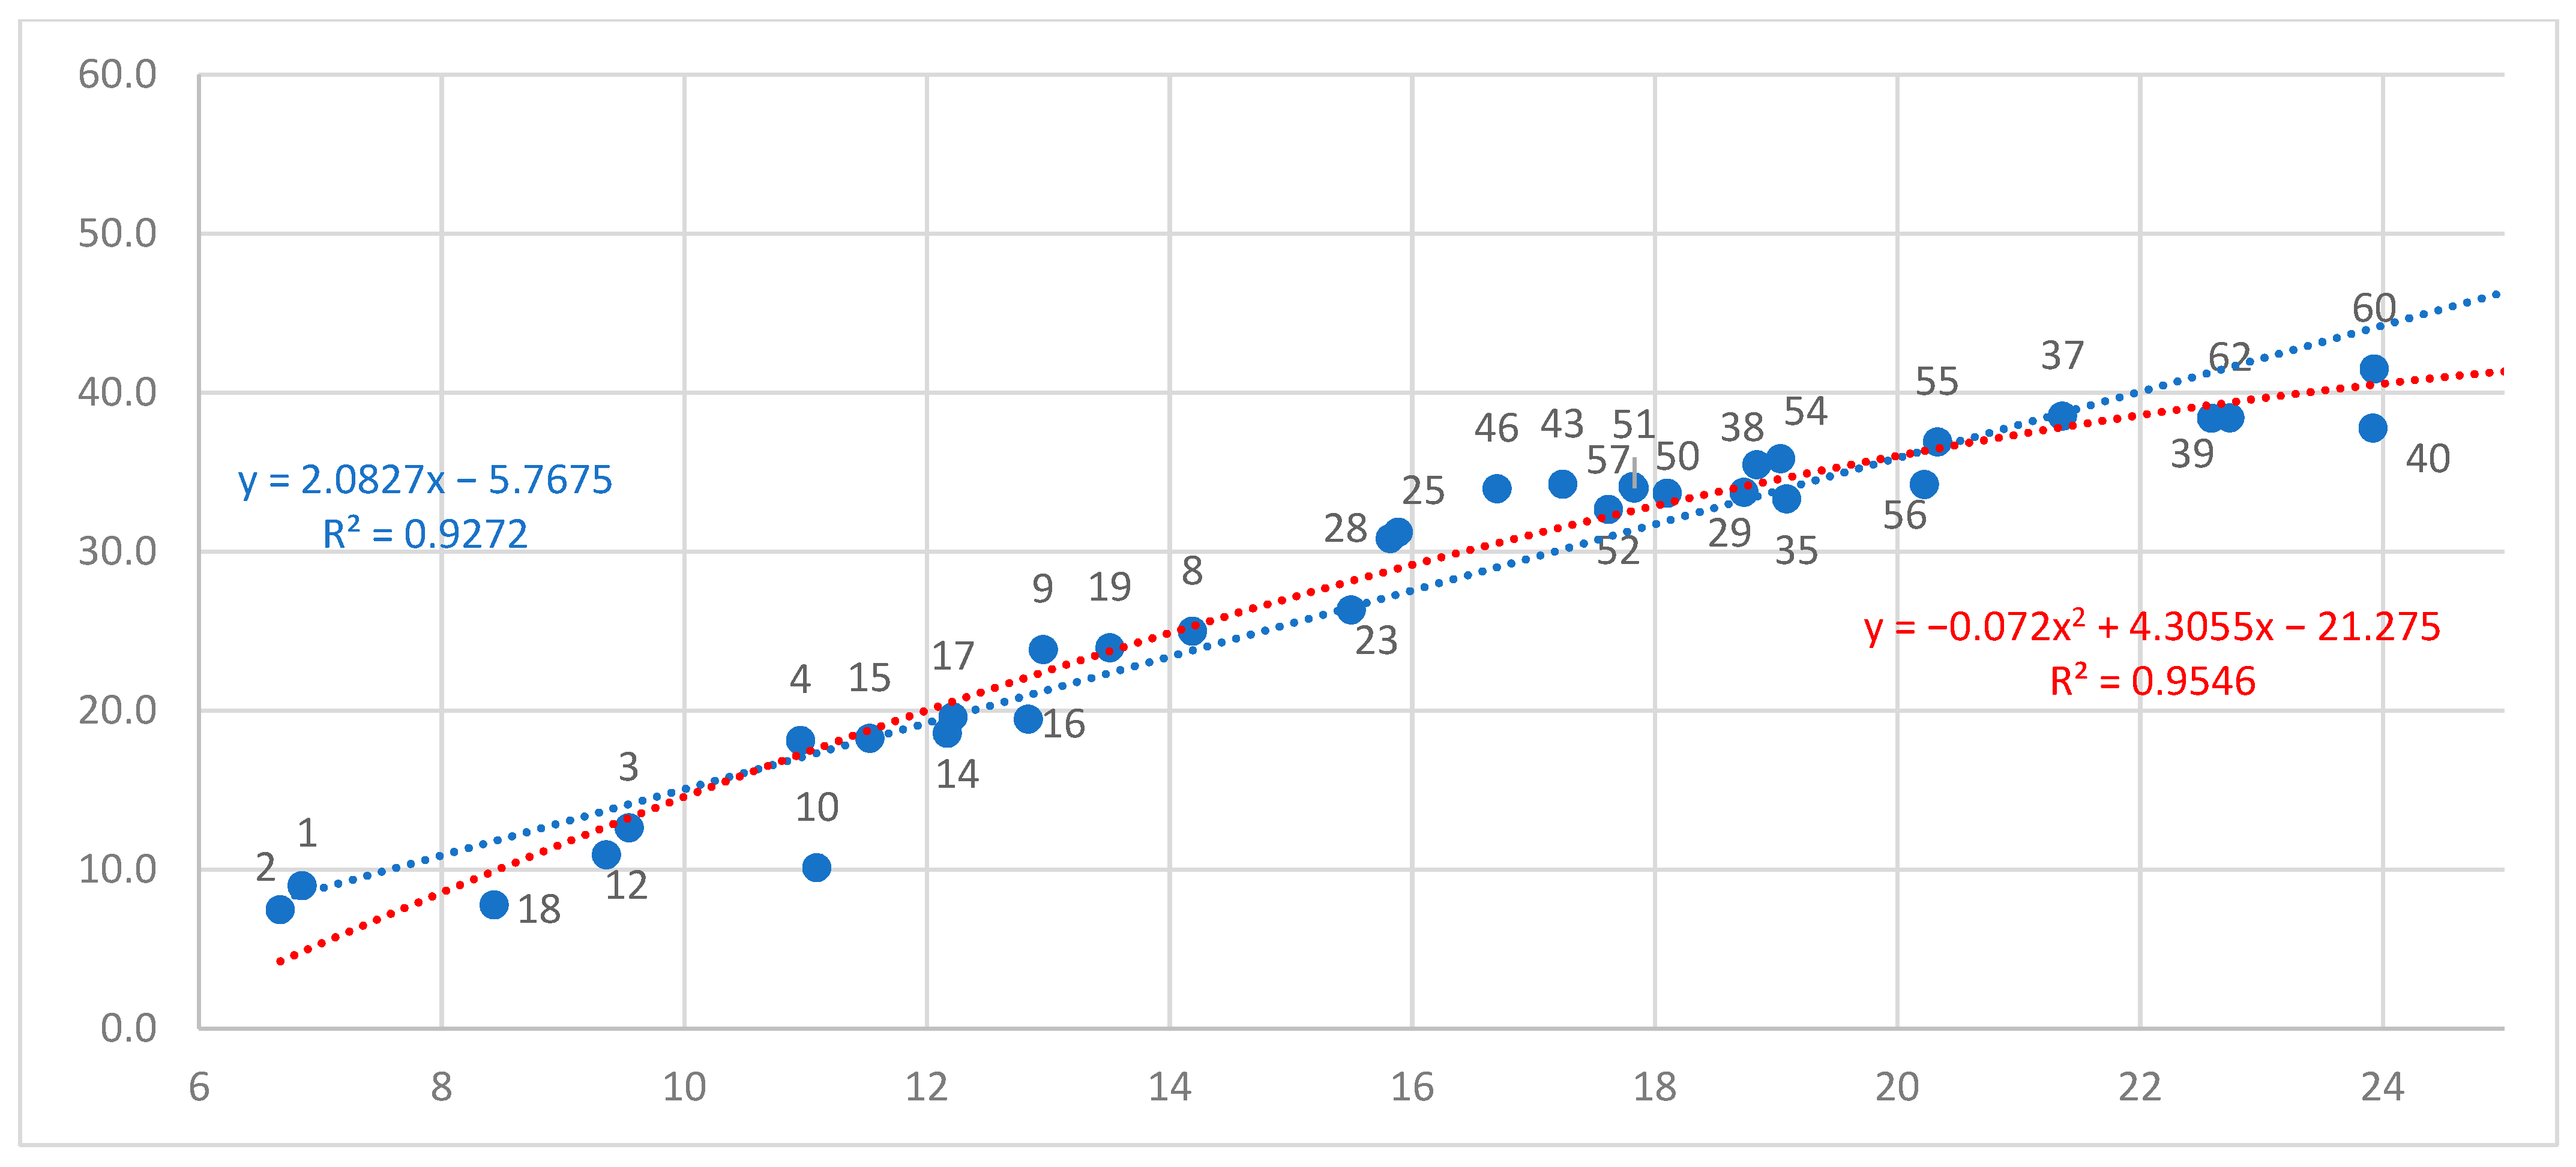
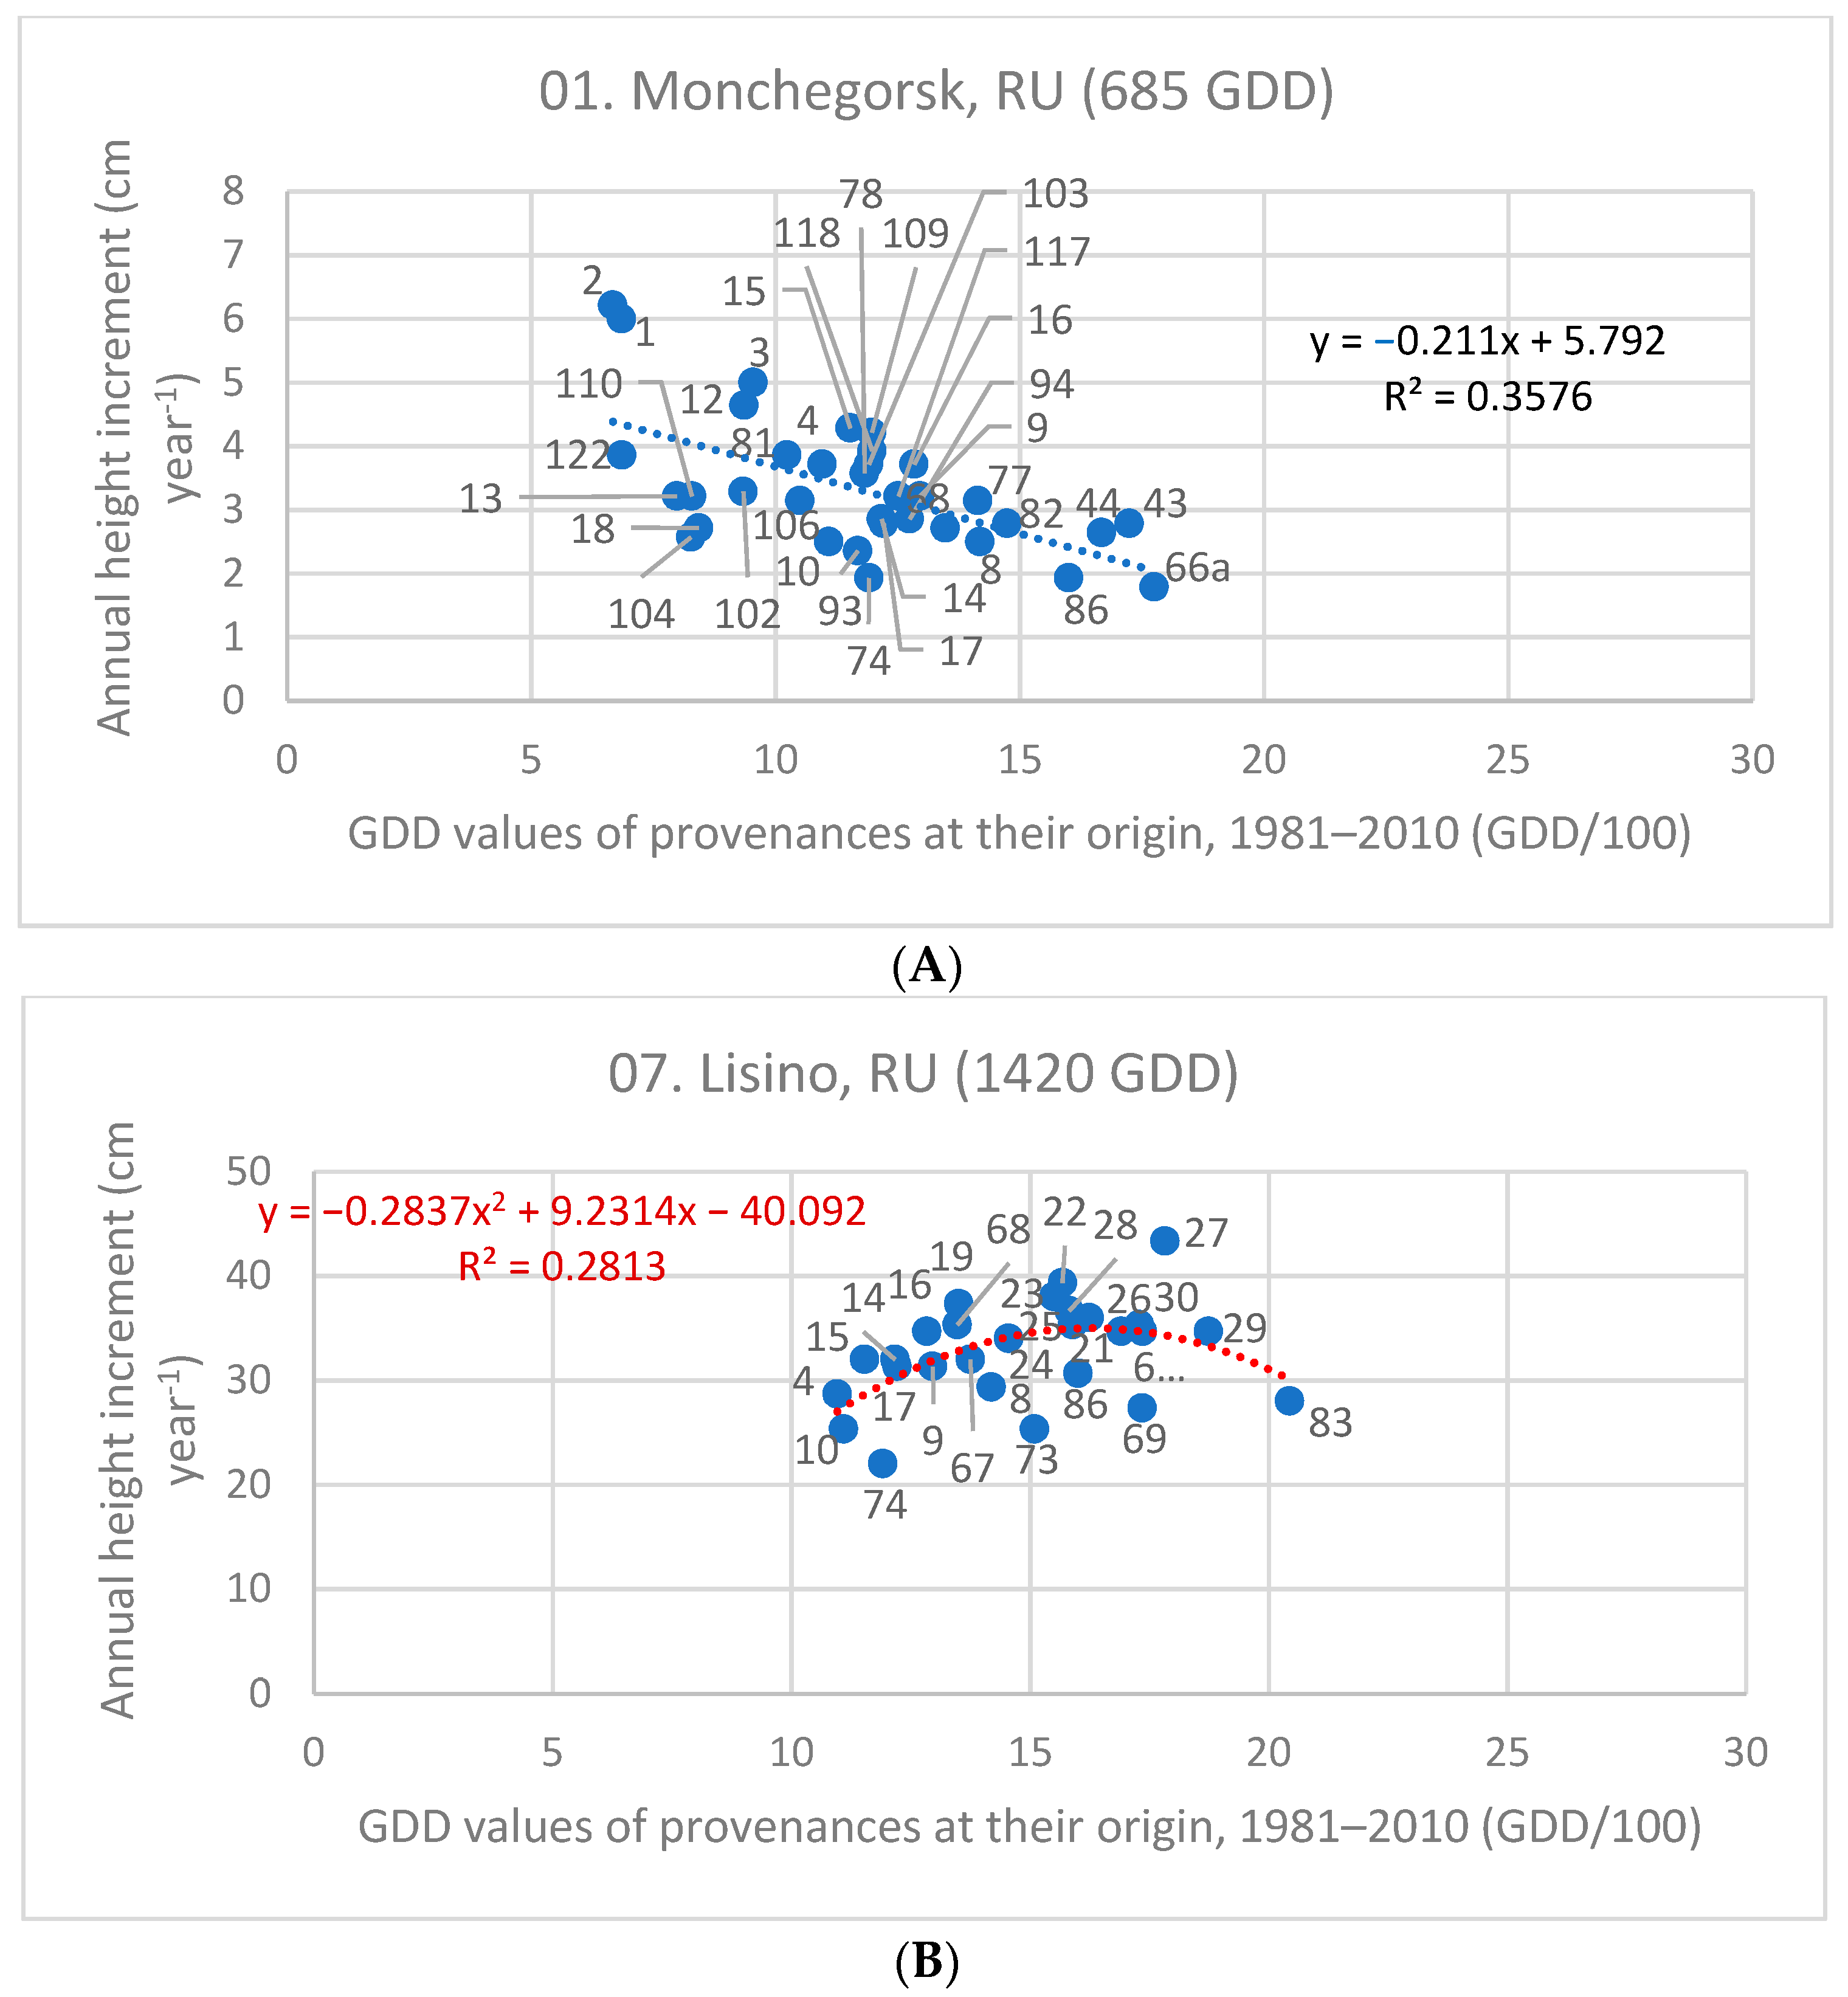
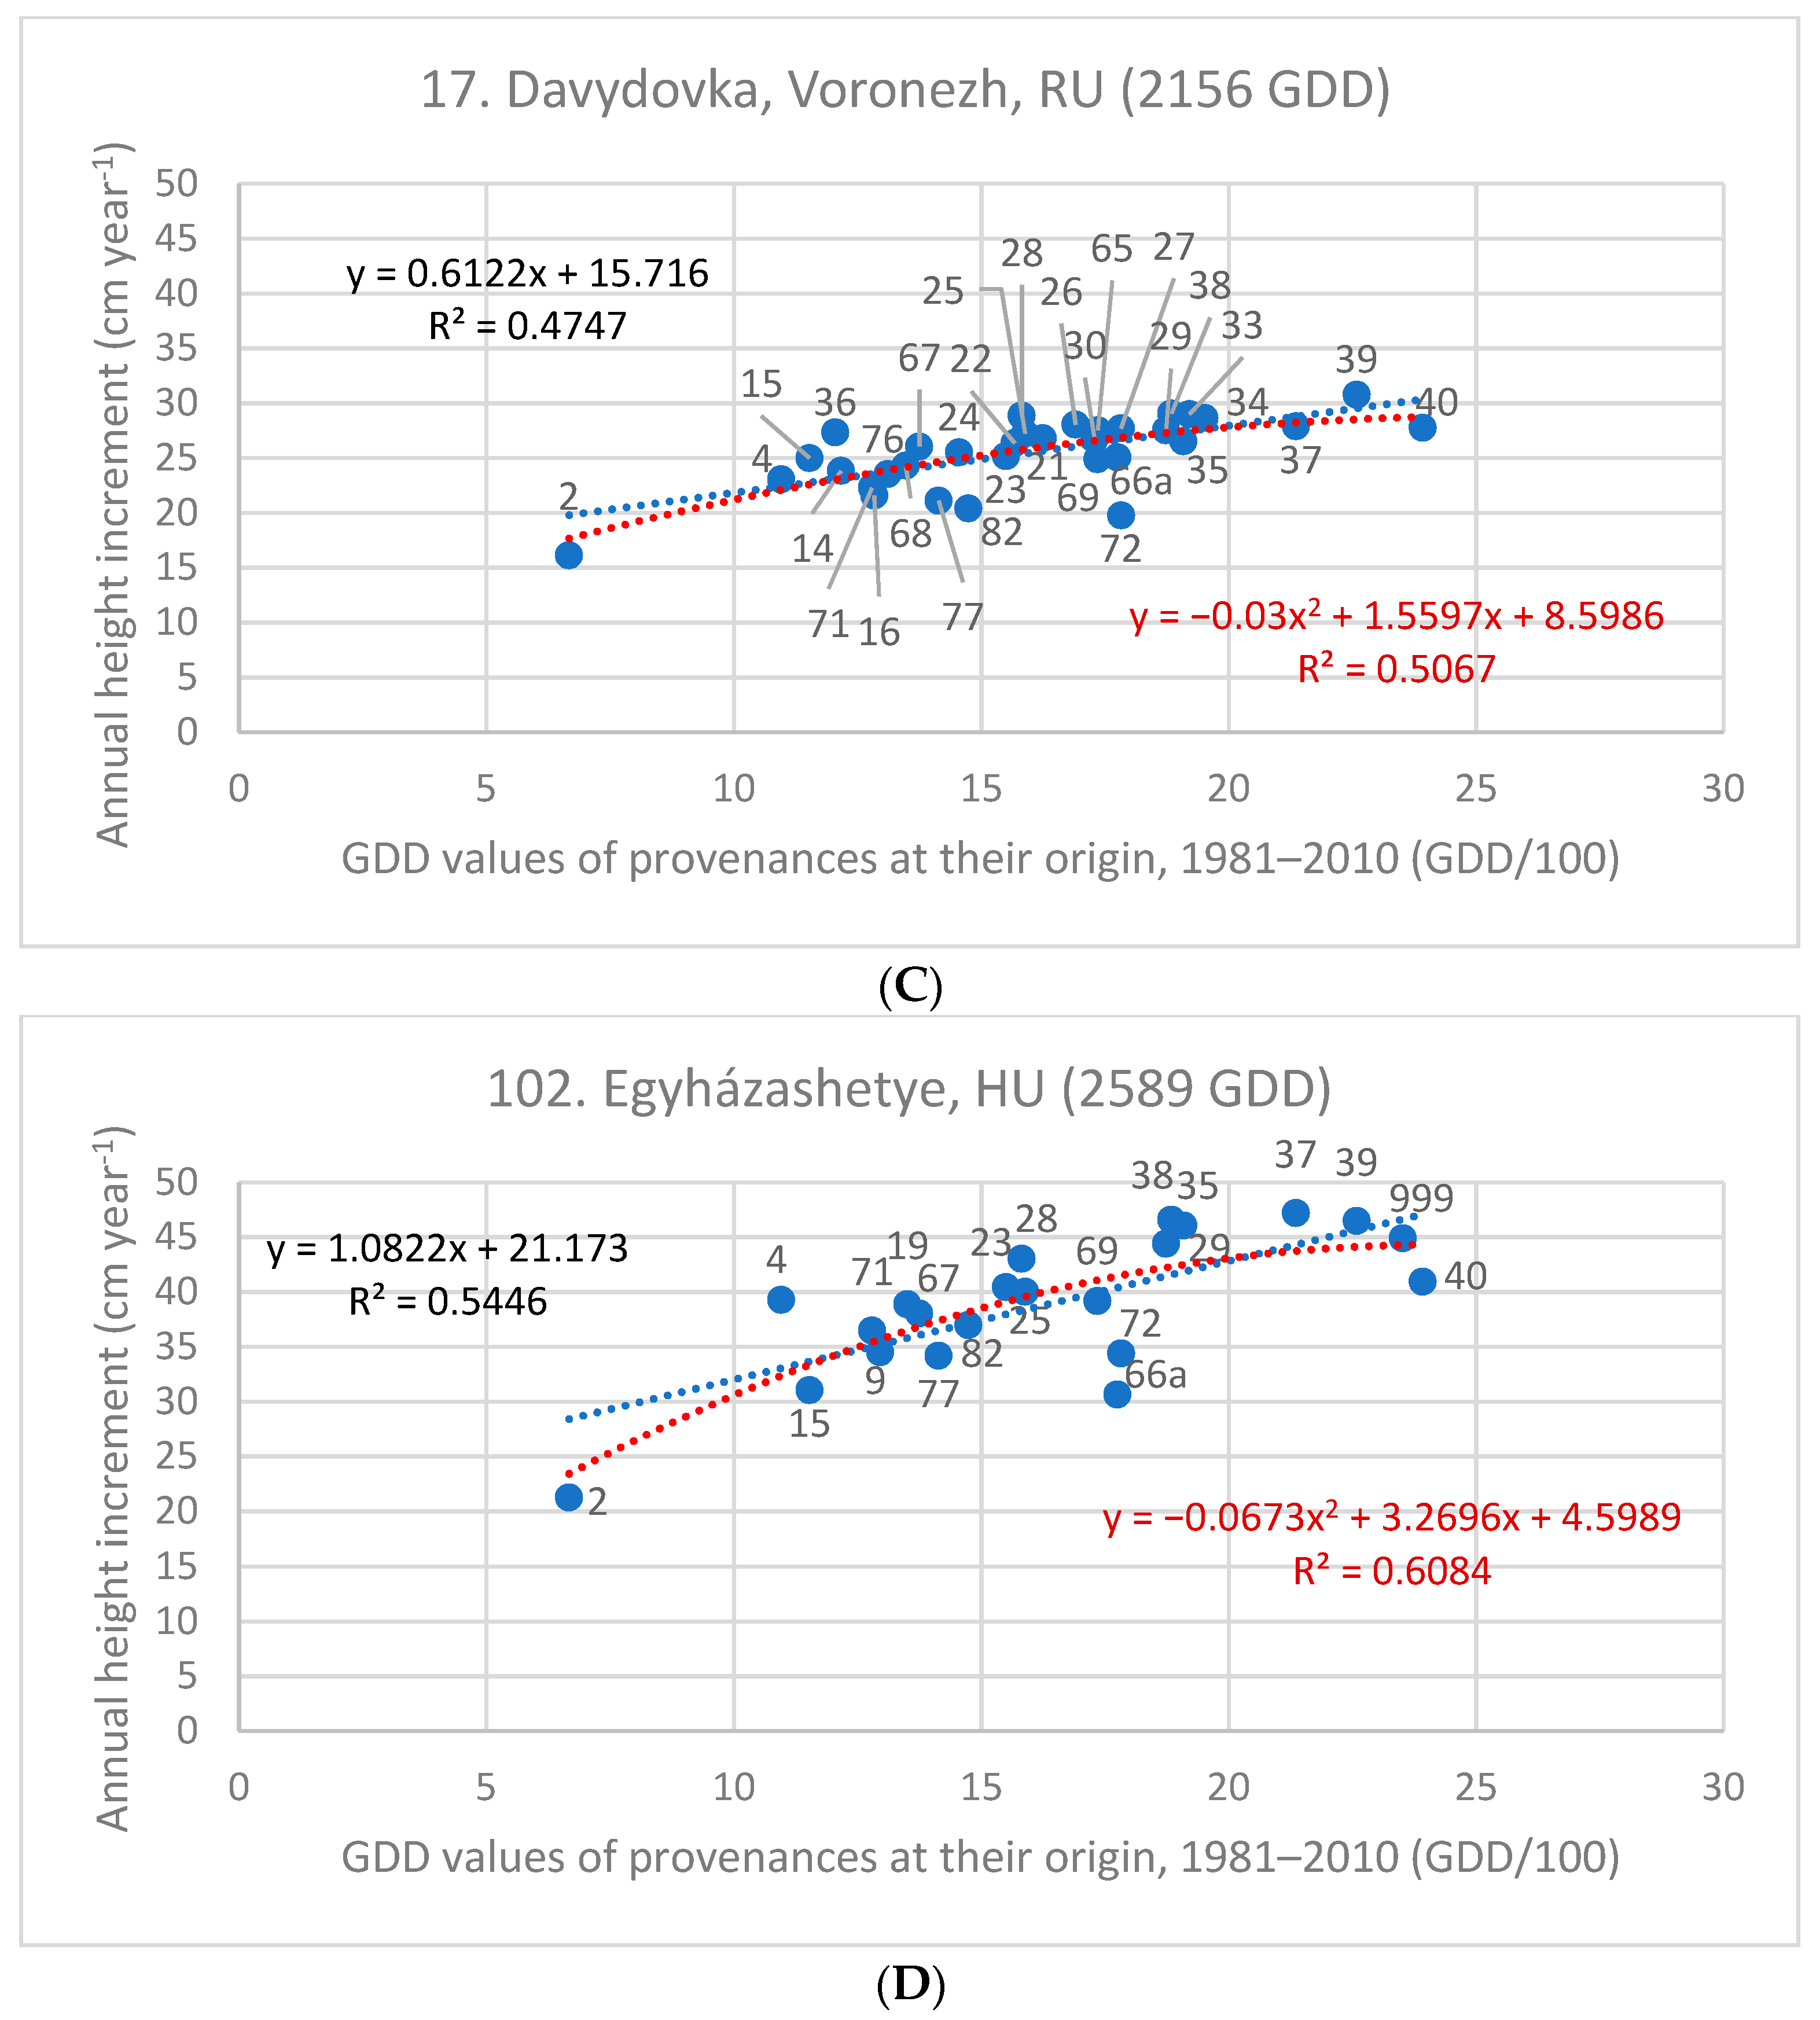
3.3. Investigation of Transfer Functions
| Test Sites and Their GDD Value | Z cm year−1 | Linear Equation | Quadratic Equation | |||
|---|---|---|---|---|---|---|
| Code, Name, and Country | GDD | Slope | R2 | Parameters of x | R2 | |
| 01. Monchegorsk, RU | 685 | 3.34 | −0.211 | 0.358 | insignificant | - |
| 02. Plesetsk, RU | 1095 | 19.00 | insign. | - | −0.133x2 + 3.034x | 0.222 |
| 07. Lisino, RU | 1420 | 33.12 | insign. | - | −0.284x2 + 9.231x | 0.281 |
| 16. Kovrov/Vladimir, RU | 1609 | 30.30 | 0.369 | 0.137 | −0.075x2 + 2.685x | 0.293 |
| 17. Davydovka/Voronezh, RU | 2156 | 25.78 | 0.612 | 0.475 | −0.030x2 + 1.556x | 0.507 |
| 101. Recsk, HU | 2431 | 45.66 | 0.773 | 0.382 | −0.069x2 + 3.2375x | 0.423 |
| 103. Kerkafalva, HU | 2535 | 43.81 | 0.733 | 0.294 | insignificant | - |
| 102. Egyházashetye, HU | 2589 | 40.02 | 1.082 | 0.545 | −0.067x2 + 3.2696x | 0.608 |
| 12. Oleshky, UA | 2696 | 33.45 | 1.290 | 0.311 | insignificant | - |
3.4. Stress Test of Populations in Future Climates
4. Discussion
4.1. Literature Background of Growth and Survival Projections in Northeast Europe
4.2. Discussion of Results
4.2.1. Linearity of Growth Response to Warming
4.2.2. Effective Phenotypic Plasticity Supported by Epigenetics?
4.2.3. Limitations of the Study
5. Conclusions for the Future of Scots Pine in Northeast Europe
Author Contributions
Funding
Data Availability Statement
Acknowledgments
Conflicts of Interest
Appendix A. Tables of Revised Data and Figures on Growth Response
| Nr., Location and District, Country Code | N. Latitude Decim. | E. Longitude Decim. | Elevation (m a.s.l.) | GDD 1981–2010 (CHELSA) | Pann (mm) 1981–2010 (CHELSA) | Z * (cm year−1) |
|---|---|---|---|---|---|---|
| 1. Monchegorsk, Murmansk, RU | 67.850 | 32.950 | 126 | 685.1 | 681 | 3.3 |
| 2. Plesetsk, Arkhangelsk, RU | 62.900 | 40.400 | 108 | 1095.9 | 716 | 19.0 |
| 3. Cherepovets, Vologda, RU | 59.250 | 37.333 | 114 | 1382.7 | 653 | 32.6 |
| 4. Kortkeros, Komi, RU | 61.812 | 51.532 | 95 | 1149 | 691 | 16.3 |
| 5. Chupa, Karelia, RU | 65.950 | 33.500 | 114 | 840.3 | 681 | 12.5 |
| 6. Medvezhyegorsk, Karelia, RU | 63.000 | 34.050 | 119 | 1132 | 762 | 9.3 |
| 7. Lisino, Saint Petersburg, RU | 59.500 | 30.867 | 53 | 1420.8 | 704 | 33.5 |
| 8. Pskov, Pskov, RU | 57.833 | 28.433 | 54 | 1567.6 | 720 | 31.8 |
| 9. Järva, Järva, EST | 59.517 | 25.500 | 32 | 1401.3 | 696 | 9.1 |
| 11. Lenino, Homiel, BY | 52.194 | 31.000 | 124 | 1910.8 | 635 | 39.7 |
| 12. Oleshky, Kherson, UA | 46.500 | 32.500 | 7 | 2696.6 | 437 | 33.6 |
| 13. Izyum, Kharkiv, UA | 49.168 | 37.312 | 73 | 2361.2 | 536 | 36.1 |
| 14. Sambir, Lviv, UA | 49.523 | 23.327 | 317 | 1918.2 | 788 | 25.9 |
| 15. Olevsk, Zhytomyr, UA | 51.235 | 27.624 | 195 | 1872 | 710 | 32.6 |
| 16. Kovrov, Vladimir, RU | 56.396 | 41.357 | 121 | 1609.4 | 629 | 28.8 |
| 17. Davydovka, Voronezh, RU | 51.152 | 39.421 | 90 | 2156 | 556 | 24.4 |
| 18. Lunino, Penza, RU | 53.592 | 45.246 | 128 | 1838 | 553 | 34.9 |
| 21. Kamyshin, Volgograd, RU | 50.072 | 45.363 | 113 | 2340.4 | 419 | 32.4 |
| 22. Zelenodolsk, Tatarstan, RU | 55.865 | 48.520 | 106 | 1684.8 | 545 | 45.8 |
| 23. Ufa, Bashkortostan, RU | 55.000 | 56.000 | 80 | 1810.5 | 667 | 24.4 |
| 24. Kungur, Perm, RU | 57.433 | 56.750 | 145 | 1455.2 | 589 | 33.8 |
| 25. Revda, Yekaterinburg, RU | 56.833 | 59.967 | 298 | 1310.8 | 552 | 35.6 |
| 26. Zverinogolovskoye, Kurgan, RU | 54.783 | 64.967 | 80 | 1783.1 | 374 | 39.2 |
| 27. Buzuluk, Samara, RU | 53.000 | 52.000 | 81 | 1991.1 | 559 | 39.0 |
| 29. Suzun, Novosibirsk, RU | 53.767 | 82.333 | 154 | 1614.7 | 436 | 40.7 |
| 30. Boguchany, Krasnoyarsk, RU | 58.350 | 97.500 | 421 | 1129.1 | 473 | 21.1 |
| 31. Turukhansk, Krasnoyarsk, RU | 66.000 | 89.000 | 46 | 831.3 | 972 | 16.4 |
| 32. Zaudinsk, Buryatiya, RU | 51.833 | 107.667 | 507 | 1521.3 | 253 | 11.0 |
| 34. Svobodny, Amur, RU | 51.398 | 128.077 | 199 | 1696.8 | 591 | 11.7 |
| 35. Urumkai, Kokshetau, KZ | 52.500 | 69.833 | 412 | 1538.4 | 378 | 20.3 |
| 36. Dolon, Semey, KZ | 50.667 | 79.333 | 163 | 2176.5 | 259 | 26.9 |
| 37. Shaki, Shaki, AZ | 41.283 | 47.200 | 1369 | 1561.9 | 1033 | 20.4 |
| 101. Recsk, Heves, HU | 47.930 | 20.120 | 179 | 2431.1 | 607 | 43.5 |
| 102. Egyházashetye, Vas, HU | 47.170 | 17.120 | 134 | 2589.6 | 668 | 38.2 |
| 103. Kerkafalva, Zala, HU | 46.770 | 16.490 | 196 | 2535.5 | 752 | 42.7 |
| Nr., Location and District, Country Code | N. Latitude Decim. | E. Longitude Decim. | Elevation (m a.s.l.) (WC2.1) | GDD 1981–2010 (CHELSA) | Pann (mm) 1981–2010 (CHELSA)) | Zann * (cm year−1) |
|---|---|---|---|---|---|---|
| 1. Monchegorsk, Murmansk, RU | 67.850 | 32.950 | 126 | 685.1 | 681 | 9.0 |
| 2. Kandalaksha, Murmansk, RU | 67.000 | 32.550 | 0 | 667.1 | 825 | 7.5 |
| 3. Pinega, Arkhangelsk, RU | 64.750 | 43.233 | 66 | 954.7 | 765 | 12.6 |
| 4. Plesetsk, Arkhangelsk, RU | 62.900 | 40.400 | 108 | 1095.9 | 716 | 18.1 |
| 8. Cherepovets, Vologda, RU | 59.167 | 38.000 | 103 | 1419 | 663 | 25.0 |
| 9. Totma, Vologda, RU | 60.000 | 43.000 | 126 | 1296 | 632 | 23.8 |
| 10. Kortkeros, Komi, RU | 61.917 | 51.500 | 124 | 1109.4 | 709 | 10.1 |
| 12. Chupa, Karelia, RU | 66.333 | 33.000 | 4 | 936 | 722 | 10.9 |
| 13. Kadzherom, Komi, RU | 64.750 | 55.917 | 128 | 798.2 | 875 | |
| 14. Medvezhyegorsk, Karelia, RU | 62.900 | 34.450 | 23 | 1216.9 | 763 | 18.6 |
| 15. Pryazha, Karelia, RU | 61.667 | 33.667 | 166 | 1153 | 798 | 18.3 |
| 16. Sortavala, Karelia, RU | 61.833 | 30.467 | 61 | 1283.8 | 715 | 19.4 |
| 17. Pudozh, Karelia, RU | 61.667 | 36.550 | 87 | 1221.5 | 871 | 19.6 |
| 18. Kem, Karelia, RU | 64.950 | 34.517 | 21 | 843.3 | 588 | 7.8 |
| 19. Lisino, St. Petersburg, RU | 60.000 | 30.417 | 31 | 1350.9 | 718 | 23.9 |
| 21. Velikie Luki, Pskov, RU | 56.383 | 30.500 | 91 | 1624.2 | 651 | |
| 22. Strugi Krasnye, Pskov, RU | 57.833 | 28.433 | 54 | 1567.6 | 720 | |
| 23. Kresttsy, Novgorod, RU | 58.250 | 32.467 | 67 | 1549.9 | 769 | 26.3 |
| 24. Elva, Tartu, EST | 58.167 | 26.467 | 98 | 1455.3 | 695 | |
| 25. Jelgava, Jelgava, LAT | 56.450 | 25.167 | 79 | 1588.7 | 745 | 31.2 |
| 26. Prienai, Kaunas, LIT | 54.700 | 23.967 | 100 | 1690.8 | 698 | |
| 27. Asipovichi, Mahiljov, BY | 53.300 | 28.667 | 144 | 1782.4 | 631 | |
| 28. Rasony, Vitsebsk, BY | 56.000 | 29.333 | 157 | 1582 | 734 | 30.8 |
| 29. Lenino, Homel, BY | 52.233 | 31.717 | 154 | 1873.7 | 647 | 33.7 |
| 30. Sionim, Hrodna, BY | 53.417 | 25.250 | 156 | 1729.1 | 695 | |
| 33. Dubrovitsya, Rivne, UA | 51.533 | 26.600 | 146 | 1920.8 | 645 | |
| 34. Sambir, Lviv, UA | 50.917 | 24.000 | 178 | 1951.3 | 646 | |
| 35. Olevsk, Zhitomir, UA | 50.400 | 27.667 | 226 | 1908.8 | 674 | 33.3 |
| 36. Rakhiv, Lviv, UA | 48.117 | 24.000 | 965 | 1205.1 | 1361 | |
| 37. Borispil, Kyiv, UA | 50.167 | 32.167 | 116 | 2136.2 | 599 | 38.5 |
| 38. Svesa, Sumi, UA | 52.017 | 34.000 | 163 | 1884.4 | 662 | 35.5 |
| 39. Cherkasi, Cherkasi, UA | 49.617 | 32.000 | 96 | 2259.1 | 579 | 38.4 |
| 40. Slovyansk, Donetsk, UA | 48.833 | 37.600 | 64 | 2392.2 | 506 | 37.8 |
| 42. Bezhetsk, Tver, RU | 57.750 | 36.667 | 128 | 1470.9 | 634 | |
| 43. Orekhovo-Zuyevo, Moskva, RU | 55.533 | 38.950 | 124 | 1724.3 | 656 | 34.2 |
| 44. Kovrov, Vladimir, RU | 56.350 | 41.250 | 83 | 1667.4 | 616 | |
| 46. Pervomaysk, Nizh. Novgorod, RU | 54.933 | 43.833 | 181 | 1670 | 583 | 33.9 |
| 47. Manturovo, Kostroma, RU | 58.367 | 44.733 | 132 | 1424.1 | 647 | |
| 48. Kostroma, Kostroma, RU | 58.000 | 42.000 | 156 | 1417 | 651 | |
| 49. Kaluga, Kaluga, RU | 54.417 | 36.267 | 194 | 1640.2 | 712 | |
| 50. Solotcha, Ryazan, RU | 54.667 | 39.750 | 101 | 1810.3 | 603 | 33.7 |
| 51. Gavan-Kukuyevka, Bryansk, RU | 53.000 | 34.000 | 160 | 1783.1 | 687 | 34.0 |
| 52. Orel, Orel, RU | 53.000 | 36.000 | 200 | 1761.8 | 674 | 32.6 |
| 54. Sosnovka, Tambov, RU | 53.200 | 41.333 | 137 | 1903.8 | 542 | 35.8 |
| 55. Grafskaya, Voronezh, RU | 51.633 | 39.467 | 112 | 2033.1 | 596 | 36.9 |
| 56. Khrenovoye, Voronezh, RU | 51.500 | 40.250 | 165 | 2022.3 | 572 | 34.2 |
| 57. Nikolsk, Penza, RU | 53.833 | 46.000 | 154 | 1782 | 520 | 34.1 |
| 59. Melekess, Ulyanovsk, RU | 54.233 | 49.583 | 83 | 1861.9 | 577 | |
| 60. Veshenskaya, Rostov, RU | 49.600 | 41.800 | 56 | 2393 | 460 | 41.5 |
| 62. Kamyshin, Volgograd, RU | 50.167 | 45.400 | 154 | 2274.2 | 422 | 38.4 |
| 64. Volsk, Saratov, RU | 52.067 | 47.350 | 174 | 1975.1 | 628 | |
| 65. Vasilyevo, Tatarstan, RU | 56.000 | 48.000 | 58 | 1735.6 | 504 | |
| 66a. Kamskie Polyani, Tatarstan, RU | 55.667 | 51.433 | 52 | 1775.4 | 514 | |
| 67. Votkinsk, Udmurtia, RU | 57.500 | 54.000 | 244 | 1374.9 | 588 | |
| 68. Slobodskoy, Kirov, RU | 58.817 | 50.100 | 148 | 1347.6 | 719 | |
| 69. Dyurtyuli, Bashkortostan, RU | 55.500 | 54.667 | 125 | 1734.8 | 494 | |
| 69a. Dyurtyuli, Bashkortostan, RU | 55.500 | 54.667 | 125 | 1734.8 | 494 | |
| 70. Duvan, Bashkortostan, RU | 55.700 | 57.900 | 312 | 1451.2 | 516 | |
| 71. Beloretsk, Bashkortostan, RU | 53.417 | 57.667 | 605 | 1279.2 | 653 | |
| 71a. Beloretsk, Bashkortostan, RU | 53.950 | 58.400 | 537 | 1317.5 | 537 | |
| 72. Zilair, Bashkortostan, RU | 52.400 | 58.667 | 360 | 1782.8 | 366 | |
| 73. Okhansk, Perm, RU | 57.700 | 55.417 | 92 | 1509.4 | 549 | |
| 74. Krasnovishersk, Perm, RU | 60.383 | 57.050 | 128 | 1191.7 | 948 | |
| 76. Revda, Yekatyerinburg, RU | 56.833 | 59.967 | 298 | 1310.8 | 552 | |
| 77. Tavda, Yekaterinburg, RU | 58.067 | 65.300 | 52 | 1414.1 | 511 | |
| 78. Ivdel, Yekaterinburg, RU | 60.667 | 60.400 | 86 | 1182.5 | 551 | |
| 79. Kurgan, Kurgan, RU | 55.467 | 65.333 | 79 | 1699.8 | 396 | |
| 81. Surgut, Tyumen, RU | 61.417 | 73.333 | 70 | 1023.7 | 671 | |
| 82. Zavodoukovsk, Tyumen, RU | 56.500 | 66.950 | 129 | 1474 | 453 | |
| 83. Buzuluk, Orenburg, RU | 52.783 | 52.250 | 72 | 2043.5 | 503 | |
| 123. Novonezhinka, Kostanay, KZ | 52.500 | 63.833 | 205 | 1938.7 | 323 | |
| 126. Tovuz, Tovuz, AZ | 41.000 | 45.500 | 881 | 2779.6 | 495 | |
| 999. Pornóapáti, Vas, HU | 47.170 | 16.500 | 273 | 2351.9 | 704 |

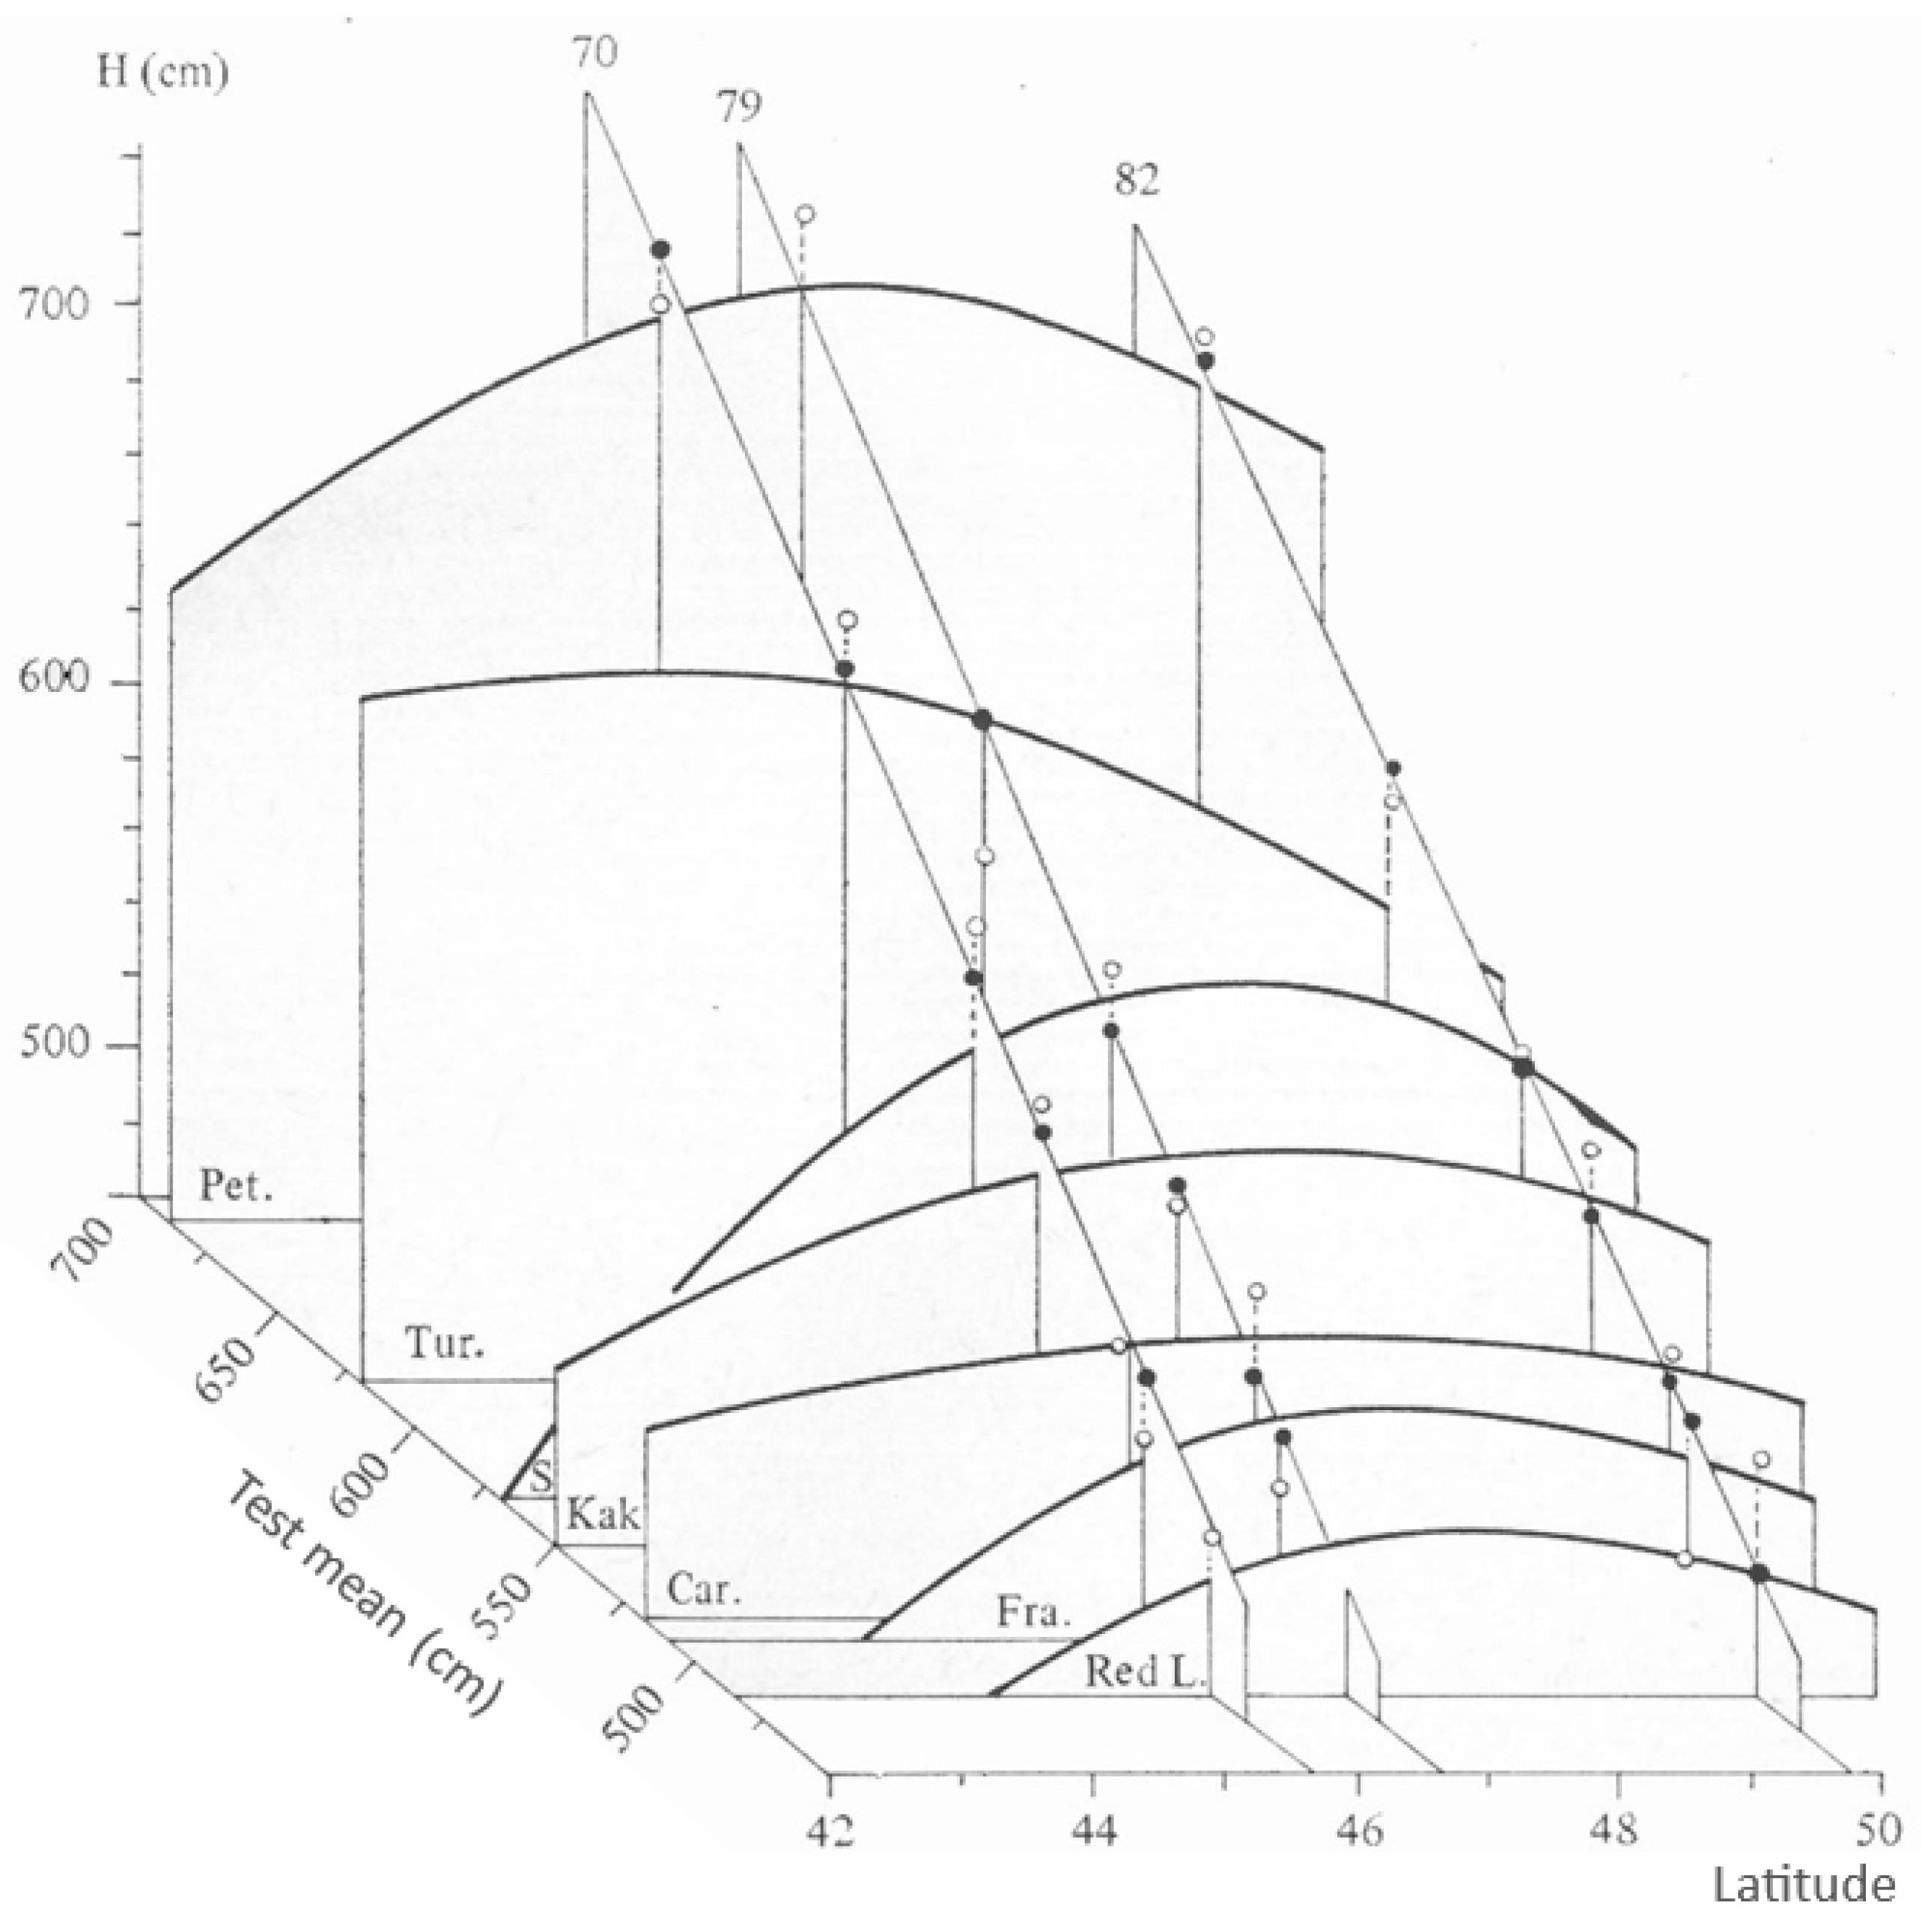
Inherent Growth Potential of Populations (Explanation for Figure A1)

References
- Langlet, O. Two hundred years of genecology. Taxon 1971, 20, 653–722. [Google Scholar] [CrossRef]
- Giertych, M.; Mátyás, C. (Eds.) Genetics of Scots Pine, Developments in Plant Genetics and Breeding; Elsevier: Amsterdam, The Netherlands, 1991; Volume 3. [Google Scholar]
- Giertych, M.; Oleksyn, J. Studies on genetic variation of Scots pine (Pinus sylvestris L.) coordinated by IUFRO. Silvae Genet. 1992, 41, 133–143. [Google Scholar]
- Mátyás, C.; Yeatman, C.W. A magassági növekedés adaptív változatosságának vizsgálata Pinus banksiana populációkban. (Investigation of adaptive height growth variation of jack pine (Pinus banksiana Lamb.) populations.). Erd. Faip. Egy. Tud. Közl. 1987, 1, 191–197, (In Hungarian with English Abstract and Captions). [Google Scholar]
- Mátyás, C.; Yeatman, C.W. Effect of geographical transfer on growth and survival of jack pine (Pinus banksiana Lamb.) populations. Silvae Genet. 1992, 41, 370–376. [Google Scholar]
- Mátyás, C. Modeling climate change effects with provenance test data. Tree Physiol. 1994, 14, 797–804. [Google Scholar] [CrossRef]
- Mátyás, C. Climatic adaptation of trees: Rediscovering provenance tests. Euphytica 1996, 92, 45–54. [Google Scholar] [CrossRef]
- Salminen, H.; Jalkanen, R. Modeling of bud break of Scots pine in northern Finland in 1908–2014. Front. Plant Sci. 2015, 5, 104. [Google Scholar] [CrossRef]
- Shutyaev, A.M.; Giertych, M. Height Growth Variation in a Comprehensive Eurasian Provenance Experiment of Scots Pine (Pinus sylvestris L.). Silvae Genet. 1997, 46, 332–349. [Google Scholar]
- Mátyás, C. Forecasts needed for retreating forests (Opinion). Nature 2010, 464, 1271. [Google Scholar] [CrossRef]
- Leites, L.P.; Robinson, A.P.; Rehfeldt, G.E.; Marshall, J.D.; Crookston, N.L. Height growth response to climatic changes differs among populations of Douglas-fir: A novel analysis of historic data. Ecol. Appl. 2012, 22, 154–165. [Google Scholar] [CrossRef]
- Leites, L.; Benito Garzón, M. Forest tree species adaptation to climate across biomes: Building on the legacy of ecological genetics to anticipate responses to climate change. Glob. Chang. Biol. 2023, 29, 4711–4730. [Google Scholar] [CrossRef] [PubMed]
- Prokazin, E.P.; Bogachev, A.V. Hereditary adaptation of Scots pine to climate factors and possibilities of its assessment and prognosis. In Genetics, Selection, and Seed Production; VNIILM: Pushkino, Russia, 1975. (In Russian) [Google Scholar]
- Mátyás, C.; Harkai, L. Szovjet erdeifenyő populációk fiatalkori értékelése. Eval. Juv. Scots Pine Popul. USSR Agrártud. Közlem. 1982, 41, 543–548. (In Hungarian) [Google Scholar]
- Mátyás, C. Kelet-európai erdeifenyő-származások fenológiai változékonysága. (Phenol. Var. East Eur. Scots Pine Proven.) Erd. Kut. 1981, 74, 71–80, (In Hungarian with English Summary and Captions). [Google Scholar]
- Mátyás, C. Genetic and ecological constraints of adaptation. In Proceedings of the IUFRO International Symposium on Forest Genetic Breeding and Physiology, Moscow, Russia, 30 November 1988; pp. 79–90, Russian edition: Geneticheskie i ekologicheskie ogranichenia adaptatsii; Materialy IUFRO, VNIILH: Moscow, Russia, 1989; pp. 60–67. [Google Scholar]
- Mátyás, C.; Nagy, L. Genetic potential of plastic response to climate change. In Results of Genetic Field Trials and Laboratory Studies and Their Applications in Practical Forestry; Forum Genetik und Wald: Teisendorf, Germany, 2005; pp. 55–69. [Google Scholar]
- Nagy, L. Éghajlati alkalmazkodóképesség és válaszreakció előrejelzése erdeifenyő (Pinus sylvestris L.) populációkon. [Climatic adaptability and forecasting response reactions in populations of Scots pine (Pinus sylvestris L.)]. Ph.D. Dissertation, University of Sopron, Sopron, Hungary, 2011. (In Hungarian). [Google Scholar]
- Rehfeldt, G.E.; Tchebakova, N.M.; Parfenova, Y.I.; Wykoff, W.R.; Kuzmina, N.A.; Milyutin, L.I. Intraspecific responses to climate in Pinus sylvestris. Glob. Chang. Biol. 2002, 8, 912–929. [Google Scholar] [CrossRef]
- Karger, D.N.; Conrad, O.; Böhner, J.; Kawohl, T.; Kreft, H.; Soria-Auza, R.W.; Zimmermann, N.E.; Linder, H.P.; Kessler, M. Climatologies at high resolution for the earth’s land surface areas. Sci. Data 2017, 4, 170122. [Google Scholar] [CrossRef]
- Meinshausen, M.; Zebedee, R.; Nicholls, J.; Lewis, J.; Gidden, M.J.; Vogel, E.; Wang, J. The shared socio-economic pathway (SSP) greenhouse gas concentrations and their extensions to 2500. Geosci. Model Dev. 2020, 13, 3571–3605. [Google Scholar] [CrossRef]
- Wang, T.; Hamann, A.; Yanchuk, A.; O’Neill, G.A.; Aitken, S.N. Use of response functions in selecting lodgepole pine populations for future climates. Glob. Chang. Biol. 2006, 12, 2404–2416. [Google Scholar] [CrossRef]
- Kramer, K.; Bouriaud, L.; Feindt, P.H.; van Wassenaer, L.; Glanemann, N.; Hanewinkel, M.; Yousefpour, R. Roadmap to develop a stress test for forest ecosystem services supply. One Earth 2022, 5, 25–34. [Google Scholar] [CrossRef]
- Tchebakova, N.M.; Parfenova, E.I.; Soja, A.J. Potential climate-induced vegetation change in Siberia in the 21st century. In Environmental Change in Siberia; Baltzer, H., Ed.; Springer: Dordrecht, The Netherlands, 2010; pp. 67–82. [Google Scholar]
- Mátyás, C.; Sun, G. Forests in a water-limited world under climate change. Environ. Res. Lett. 2014, 9, 085001. [Google Scholar] [CrossRef]
- Groisman, P.; Bulygina, O.; Henebry, G.; Speranskaya, N.; Shiklomanov, A.; Chen, Y.; Tchebakova, N.; Parfenova, E.; Kaipov, I. Dryland belt of Northern Eurasia: Contemporary environmental changes and their consequences. Environ. Res. Lett. 2018, 13, 115008. [Google Scholar] [CrossRef]
- Parfenova, E.I.; Kuzmina, N.A.; Kuzmin, S.R.; Tchebakova, N.M. Climate Warming Impacts on Distributions of Scots Pine (Pinus sylvestris L.) Seed Zones and Seed Mass across Russia in the 21st Century. Forests 2021, 12, 1097. [Google Scholar] [CrossRef]
- Horváth, A.; Horváth, F.; Lakatos, F.; Lakatos, P.; Szűcs, P.; Gálos, B. Climate Change Induced Tree Mortality in a Relict Scots Pine (Pinus sylvestris L.). Forest. Acta Silv. Lign. Hung. 2022, 18, 25–40. [Google Scholar] [CrossRef]
- Willi, Y.; Van Buskirk, J. A review on trade-offs at the warm and cold ends of geographical distributions. Philosoph. Transact. R. Soc. B Biol. Sci. 2022, 377, 20210022. [Google Scholar] [CrossRef] [PubMed]
- Mátyás, C. Adaptive pattern of phenotypic plasticity and inherent growth reveal the potential for assisted transfer in sessile oak (Quercus petraea L.). For. Ecol. Manag. 2021, 482, 118832. [Google Scholar] [CrossRef]
- Oleksyn, J.; Tjoelker, M.G.; Reich, P.B. Adaptation to changing environment in Scots pine populations across a latitudinal gradient. Silva Fennica 1998, 32, 129–140. [Google Scholar] [CrossRef]
- Sarvas, R. Investigations on the annual cycle of forest trees. Active period. Com. Inst. For. Fenn. 1972, 84, 101. [Google Scholar]
- Partanen, J.; Koski, V.; Hänninen, H. Effects of photoperiod and temperature on the timing of bud burst in Norway spruce (Picea abies). Tree Physiol. 1998, 18, 811–816. [Google Scholar] [CrossRef]
- Hampe, A.; Petit, R.J. Conserving biodiversity under climate change: The rear edge matters. Ecol. Lett. 2005, 8, 461–467. [Google Scholar] [CrossRef]
- Savolainen, O.; Kujala, S.T.; Sokol, C.; Pyhäjärvi, T.; Avia, K.; Knürr, T.; Kärkkäinen, K.; Hicks, S. Adaptive Potential of Northernmost Tree Populations to Climate Change, with Emphasis on Scots Pine (Pinus sylvestris L.). J. Hered. 2011, 102, 526–536. [Google Scholar] [CrossRef]
- Andersson, G.B.; Persson, T.; Fedorkov, A.; Mullin, T.J. Longitudinal differences in Scots pine shoot elongation. Silva Fenn. 2018, 52, 5–10040. [Google Scholar] [CrossRef]
- Matías, L.; Jump, A.S. Impacts of predicted climate change on recruitment at the geographical limits of Scots pine. J. Exp. Bot. 2014, 65, 299–310. [Google Scholar] [CrossRef] [PubMed]
- Notivol, E.; Santos-del-Blanco, L.; Chambel, R.; Climent, J.; Alía, R. Seed Sourcing Strategies Considering Climate Change Forecasts: A Practical Test in Scots Pine. Forests 2020, 11, 1222. [Google Scholar] [CrossRef]
- Shutyaev, A.M.; Giertych, M. Genetic Subdivisions of the Range of Pinus sylvestris L. based on a Transcontinental Proven. Exp. Silvae Genet. 2000, 49, 137–151. [Google Scholar]
- Fedorkov, A.L. Lesosemennoe rayonirovanie sosny obyknovennoj na severe Evropy (Seed zoning of Scots pine in the north of Europe). Sibirskij Lesn. Zh. (Sib. J. For. Sci.) 2020, 2, 63–68. Available online: https://agris.fao.org/agris-search/search.do?recordID=RU2021000159 (accessed on 3 September 2023). (In Russian with English Abstract).
- Lebedev, A.V.; Gemonov, A.V.; Gradusov, V.M.; Gostev, V.V.; Saykova, D.Y.; Seliverstov, A.M. The influence of seed origin on stand variables of Scots pine (Pinus sylvestris L.) in European Russia according to longterm observations. IOP Conf. Ser. Earth Environ. Sci. 2021, 677, 052116. [Google Scholar] [CrossRef]
- Nakvasina, E.N.; Prozherina, N.A. Scots pine (Pinus sylvestris L.) reaction to climate change in the provenance tests in the north of the Russian plain. Fol. Forest. Polon. Ser. A Fores. 2021, 63, 138–149. [Google Scholar] [CrossRef]
- Shvidenko, A.; Buksha, I.; Krakovska, S.; Lakyda, P. Vulnerability of Ukrainian Forests to Climate Change. Sustainability 2017, 9, 1152. [Google Scholar] [CrossRef]
- Tchebakova, N.M.; Rehfeldt, G.; Parfenova, E.I. Impacts of Climate Change on the Distribution of Larix spp. and Pinus sylvestris and Their Climatypes in Siberia. Mitig. Adapt. Strateg. Glob. Chang. 2006, 11, 861–882. [Google Scholar]
- Shestakova, T.A.; Voltas, J.; Saurer, M.; Siegwolf, R.T.W.; Kirdyanov, A.V. Warming Effects on Pinus sylvestris in the Cold–Dry Siberian Forest–Steppe: Positive or Negative Balance of Trade? Forests 2017, 8, 490. [Google Scholar] [CrossRef]
- Ujvári-Jármay, É.; Nagy, L.; Mátyás, C. The IUFRO 1964/68 Inventory Provenance Trial of Norway Spruce in Nyírjes, Hungary—Results and conclusions of five decades. Acta Silv. Lign. Hung. 2016, 12, 178. [Google Scholar] [CrossRef]
- Mátyás, C.; Beran, F.; Dostál, J.; Čáp, J.; Fulín, M.; Vejpustková, M.; Božič, G.; Balázs, P.; Frýdl, J. Surprising Drought Tolerance of Fir (Abies) Species between Past Climatic Adaptation and Future Projections Reveals New Chances for Adaptive Forest Management. Forests 2021, 12, 821. [Google Scholar] [CrossRef]
- Mátyás, C.; Bozic, G.; Gömöry, D.; Ivankovic, M.; Rasztovits, E. Juvenile growth response of European beech (Fagus sylvatica L.) to sudden change of climatic environment in SE European Trials. Iforest 2009, 2, 213–220. Available online: http://www.sisef.it/iforest/show.php? (accessed on 1 December 2009). [CrossRef]
- Petrik, P.; Grote, R.; Gömöry, D.; Kurjak, D.; Petek-Petrik, A.; Lamarque, L.J.; Fleischer, P., Jr. The Role of Provenance for the Projected Growth of Juvenile European Beech under Climate Change. Forest 2023, 14, 26. [Google Scholar] [CrossRef]
- Sáenz-Romero, C.; Kremer, A.; Nagy, L.; Ujvári-Jármay, É.; Ducousso, A.; Mátyás, C. Common garden comparisons confirm inherited differences in sensitivity to climate change between forest tree species. Peer J. 2019, 7, e6213. [Google Scholar] [CrossRef]
- Mátyás, C. Population, conservation, and ecological genetics. In Encyclopedia of Forest Sciences; Burley, J., Evans, J., Youngquist, J., Eds.; Elsevier: Oxford, UK, 2004; pp. 188–197. [Google Scholar]
- Savolainen, O.; Bokma, F.; García-Gil, R.; Komulainen, P.; Repo, T. Genetic variation in cessation of growth and frost hardiness and consequences for adaptation of Pinus sylvestris to climatic changes. For. Ecol. Manag. 2004, 197, 79–89. [Google Scholar] [CrossRef]
- Bräutigam, K.; Vining, K.J.; Lafon-Placette, C.; Fossdal, C.G.; Mirouze, M.; Gutierrez Marcos, J.; Cervera, M.-T. Epigenetic regulation of adaptive responses of forest tree species to the environment. Ecol. Evolut. 2013, 3, 399–415. [Google Scholar] [CrossRef]
- Skrøppa, T.; Johnsen, Ø. Patterns of adaptive genetic variation in forest tree species; the reproductive environment as an evolutionary force in Picea abies. In Forest Genetics and Sustainability; Mátyás, C., Ed.; Kluwer Academic Publication: Dordrecht, The Netherlands, 2000; pp. 49–58. [Google Scholar]
- Gömöry, D.; Foffová, E.; Longauer, R.; Krajmerová, D. Memory effects associated with early-growth environment in Norway spruce and European larch. Eur. J. For. Res. 2015, 134, 89–97. [Google Scholar] [CrossRef]
- Dormling, I.; Johnsen, Ø. Effects of the parental environment on full-sib families of Pinus Sylvestris. Can. J. For. Res. 1992, 22, 88–100. [Google Scholar] [CrossRef]
- Bose, A.K.; Moser, B.; Rigling, A.; Lehmann, M.M.; Milcu, A.; Peter, M.; Gessler, A. Memory of environmental conditions across generations affects the acclimation potential of Scots pine. Plant Cell Environ. 2020, 43, 1288–1299. [Google Scholar] [CrossRef]
- Alakärppä, E.; Salo, H.M.; Valledor, L.; Cañal, M.J.; Häggman, H.; Vuosku, J. Natural variation of DNA methylation and gene expression may determine local adaptations of Scots pine populations. J. Exp. Bot. 2018, 69, 5293–5305. [Google Scholar] [CrossRef]
- Hellmann, L.L.; Agafonov, F.; Charpentier, C.; Ljungqvist, O.; Churakova, E.; Düthorn, J.; Myglan, V.S. Diverse growth trends and climate responses across Eurasia’s boreal forest. Environ. Res. Lett. 2016, 11, 074021. [Google Scholar] [CrossRef]
- Ujvári-Jármay, É.; (University of Sopron, Forest Research Institute, Mátrafüred, Hungary). Personal communication, 2023.
- Mátyás, C. Adaptation lag: A general feature of natural populations. In Proceedings of the WFGA-IUFRO Symposium, Olympia, WA, USA, 11 August 1990; pp. 20–24. Available online: https://www.researchgate.net/publication/338764655 (accessed on 15 July 2022).
- Beissinger, S.R.; Riddell, E. Why Are Species’ Traits Weak Predictors of Range Shifts? Ann. Rev. Ecol. Evol. Syst. 2021, 52, 47–66. [Google Scholar] [CrossRef]
- Nissinen, K.; Virjamo, V.; Kilpeläinen, A.; Ikonen, V.-P.; Pikkarainen, L.; Ärväs, I.-L.; Kirsikka-aho, S.; Peltola, H. Growth responses of boreal Scots pine, Norway spruce and silver birch seedlings to simulated climate warming over three growing seasons in a controlled field experiment. Forests 2020, 11, 943. [Google Scholar] [CrossRef]
- Hallingbäck, H.R.; Burton, V.; Vizcaíno-Palomar, N.; Trotter, F.; Liziniewicz, M.; Marchi, M.; Benito Garzón, M. Managing uncertainty in Scots pine range-wide adaptation under climate change. Front. Ecol. Evol. 2021, 9, 724051. [Google Scholar] [CrossRef]
- Briceño-Elizondo, E.; Garcia-Gonzalo, J.; Peltola, H.; Matala, J.; Kellomäki, S. Sensitivity of growth of Scots pine, Norway spruce and silver birch to climate change and forest management in boreal conditions. For. Ecol. Manag. 2006, 232, 152–167. [Google Scholar] [CrossRef]
- Matías, L.; Linares, J.C.; Sánchez-Miranda, A.; Jump, A.S. Contrasting growth forecasts across the geographical range of Scots pine due to altitudinal and latitudinal differences in climatic sensitivity. Glob. Chang. Biol. 2017, 23, 4106–4116. [Google Scholar] [CrossRef]
- Ameztegui, A.; Cabon, A.; De Cáceres, M.; Coll, L. Managing stand density to enhance the adaptability of Scots pine stands to climate change: A modelling approach. Ecol. Model. 2017, 356, 141–150. [Google Scholar] [CrossRef]
- Gömöry, D.; Krajmerová, D.; Hrivnák, M.; Longauer, R. Assisted migration vs. close-to-nature forestry: What are the prospects for tree populations under climate change? Cent. Eur. For. J. 2020, 66, 63–70. [Google Scholar] [CrossRef]
- Rehfeldt, G.E.; Tchebakova, N.M.; Milyutin, L.I.; Parfenova, E.I.; Wykoff, W.R.; Kouzmina, N.A. Assessing Population Responses to Climate in Pinus sylvestris and Larix spp. of Eurasia with Climate Transfer Models. Eurasian J. For. Res. 2003, 6, 83–98. [Google Scholar]
- Mátyás, C. Genetic Resources and Adaptive Management of Conifers in a Changing World. Forests 2021, 12, 1213. [Google Scholar] [CrossRef]
Disclaimer/Publisher’s Note: The statements, opinions and data contained in all publications are solely those of the individual author(s) and contributor(s) and not of MDPI and/or the editor(s). MDPI and/or the editor(s) disclaim responsibility for any injury to people or property resulting from any ideas, methods, instructions or products referred to in the content. |
© 2023 by the authors. Licensee MDPI, Basel, Switzerland. This article is an open access article distributed under the terms and conditions of the Creative Commons Attribution (CC BY) license (https://creativecommons.org/licenses/by/4.0/).
Share and Cite
Mátyás, C.; Balázs, P.; Nagy, L. Climatic Stress Test of Scots Pine Provenances in Northeastern Europe Reveals High Phenotypic Plasticity and Quasi-Linear Response to Warming. Forests 2023, 14, 1950. https://doi.org/10.3390/f14101950
Mátyás C, Balázs P, Nagy L. Climatic Stress Test of Scots Pine Provenances in Northeastern Europe Reveals High Phenotypic Plasticity and Quasi-Linear Response to Warming. Forests. 2023; 14(10):1950. https://doi.org/10.3390/f14101950
Chicago/Turabian StyleMátyás, Csaba, Pál Balázs, and László Nagy. 2023. "Climatic Stress Test of Scots Pine Provenances in Northeastern Europe Reveals High Phenotypic Plasticity and Quasi-Linear Response to Warming" Forests 14, no. 10: 1950. https://doi.org/10.3390/f14101950
APA StyleMátyás, C., Balázs, P., & Nagy, L. (2023). Climatic Stress Test of Scots Pine Provenances in Northeastern Europe Reveals High Phenotypic Plasticity and Quasi-Linear Response to Warming. Forests, 14(10), 1950. https://doi.org/10.3390/f14101950