Article

Species Composition and Diversity of Plants along Human-Induced Disturbances in Tropical Moist Sal Forests of Eastern Ghats, India

by
Madhab Chandra Behera
1,2,
Uttam Kumar Sahoo
1,*,
Tanmay Lalitendu Mohanty
3,
Piotr Prus
4,
Laura Smuleac
5,* and
Raul Pascalau
5
1
Department of Forestry, Mizoram University, Aizawl 796004, India
2
Department of Natural Resource Management, College of Forestry, Odisha University of Agriculture and Technology, Bhubaneswar 751003, India
3
Department of Forest Biology and Tree Improvement, College of Forestry, Odisha University of Agriculture and Technology, Bhubaneswar 751003, India
4
Department of Agronomy, Faculty of Agriculture and Biotechnology, Bydgoszcz University of Science and Technology, Al. prof. S. Kaliskiego 7, 85-796 Bydgoszcz, Poland
5
Faculty of Agriculture, University of Life Sciences “King Mihai I”, 300645 Timisoara, Romania
*
Authors to whom correspondence should be addressed.
Forests 2023, 14(10), 1931; https://doi.org/10.3390/f14101931
Submission received: 17 August 2023 / Revised: 18 September 2023 / Accepted: 19 September 2023 / Published: 22 September 2023

Abstract

:
Plant biodiversity data are prerequisites for the sustainable management of a forest. We used quantitative ecological tools to determine the species composition, diversity (richness and evenness), population structure, distribution patterns, and regeneration status of trees in a Tropical Moist Sal Forest of Eastern Ghats, India. For this purpose, a field inventory was conducted during 2020–2022 in sixteen 1.0 ha forest stands along a human-induced disturbance gradient. A total of 161 species (61 trees, 40 shrubs, 60 herbs) belonging to 77 families and 143 genera were recorded in the 16.0 ha of forest area. The results revealed a significant (p < 0.01) decrease in the tree and shrub species density, basal area, species richness, and diversity along the gradient of disturbance. However, in the case of herbs, the Shannon–Weiner diversity index increased significantly (p < 0.01) with increasing disturbance levels. Irrespective of forest types and disturbance levels, the tree diameter class (10–30 cm) accounted for the highest stem density in the forest. A mixed trend was found in the case of the basal area; the >41 cm diameter class constituted the highest basal area in the Pure Sal Forest while the 10–30 cm class was in the Moist Deciduous Forest without Sal. Tree species richness was found higher in lower diameter classes. Disturbances impacted the distribution pattern of trees; in the Pure Sal Forest, the contagious distribution of trees were 61.54%, 40%, and 12.5% in undisturbed, low-disturbed, and moderately disturbed sites, respectively. The percent of trees showing random and regular distribution increased with the increased level of disturbance in all forest types. The number of tree species having good regeneration decreased with the increased disturbance intensity in all forest types. Frequent grazing, repeated forest fires, and poor soil seed banks at the Moderately Disturbed site were the main reasons for the poor/no regeneration of Pterocarpus marsupium, Adina cordifolia, Terminalia bellerica, and some other economical species. Significant changes in structural attributes of the tree community revealed the impact of human-induced disturbances in the Moist Sal Forests of Eastern Ghats. The disturbance mosaics promoted the growth of many invasive weed species and lianas, depleting the number of valuable species in the forest. This study suggests the adaption of sustainable biodiversity conservation approaches through the active participation of the tribal so that the remnants the Moist Sal Forests of Eastern Ghats can be controlled to prevent further degradation.

1. Introduction

Species composition defines the identity of species in a community and is regarded as one of the most important indicators of ecological and management processes at a site. Species diversity that encompasses both species richness (number of species in a local community) and species evenness (relative abundance of a species in a community) is a measurable indicator of a community, which reflects the basic characteristics of the ecosystem [1]. In an ecosystem, all the species are dependent on each other directly or indirectly, though each species shares a different portion of the resource for its sustenance. A system which is more species-diverse is considered to be more efficient, productive, and sustainable [2]. Therefore, it is crucial to record the biodiversity data of a forest for sustainable development and making decisions for its conservation priorities.
Tropical forest ecosystems vary in topographic edaphic features, provide an array of microhabitats, and are an abode of more than half of the planet’s plant species diversity [3]. By virtue of location, magnitude of deliverables, and accessibility, tropical forest ecosystems receive constant shocks from numerous anthropogenic activities, and this it is more chronic in developing countries. The disturbances, whether due to natural phenomena or human-induced, cannot be eliminated completely from forest ecosystems. The disturbance acting directly or indirectly alters the space and resource availability, shapes the evolutionary processes, and compels individuals or species to develop adaptive traits and mechanisms to suit the surrounding environment. It creates opportunities for suppressed ones to explore the space and resources which, once upon a time, were not accessible [4]. The ability of individuals or species in utilizing spaces and resources differ greatly, creating variation among populations of the perturbed forest community. Disturbances occurring within forests open up the forest canopy, allow more solar radiation, create a higher temperature, reduce soil moisture, upset litter mineralization and nutrient recycling, and, over all, modify the microclimate [5,6]. However, at the landscape level, these act through edge and cause isolation effects [7]. In a few instances, it has been observed that disturbances at low levels promote species diversity [8,9]. On the contrary to this, accelerated anthropogenic disturbances such as fire, grazing [10,11], encroaching forest land for rain fed farming, and land use change [10], quite often degenerative in nature, culminate to habitat deterioration, fragmentation, and destruction [12,13]. This impairs natural regeneration, promotes the mortality of established recruits, and reduces plant species diversity and demography, ultimately affecting the structural features of the forests [11,14]. The ecosystem undergoes a recovery process after every perturbation and it is not necessary that the same species will regenerate in the recovery process. The outcome will be the differential efforts of species to the disturbing forces and habitat modification. In this process, many species persist, few perish, and some opportunists such as Lantana camara and Chromolaena odorata invade and colonize. The decline in native species diversity, increased rarity, and the invasion of non-exacting ones threatens ecosystem functioning and its sustainability [15].
In the path of the geological timeline, the tropical forests have progressed in a direction in which numerous human-centered impediments diminished their biological richness, compelling many species to perish, threatening the epicenter of mass extinction [16]. This fascinates researchers to know about human-centered disturbing forces and their mode of action [17,18], the impact on the chemical and physical nature of forest ecosystems [19], and the response of species to the modified habitats [20,21,22]. It is well established that disturbances alter most the structural features of the forests, hamper resource availability, and impair ecosystem functioning, culminating in reduced taxonomic and functional diversity matrices [16,20,22]. In India, several inventories have been conducted in the past to understand the impact of anthropogenic disturbances on tropical forest ecosystems spreading across the county viz. the Western Himalayas [23,24], Central Himalayas [25,26,27,28], Eastern Himalayas [4,15,28,29,30], outer Himalayas [31], central India [32,33], Western Ghats [34,35], and Eastern Ghats [36,37]. However, the majority of the studies centered at tropical dry deciduous forests and the information pertaining to tropical moist deciduous forests of the Eastern Ghats is rudimentary. Sahoo et al. [38] conducted a field inventory to know the impact of anthropogenic disturbances on tropical moist deciduous forests of the adjoining Nayagarh district and their findings focused on the tropical moist forest as a whole without accounting for the inter- and intra-community variations. In tropical moist forests there are many identifiable communities, such as Pure Sal, the Sal-dominated community, and the Mixed community without the existence of Sal, which have specific structural and functional characteristics. The interactions within and among populations, ecosystem functioning, and service provisioning vary greatly with keystone species that a tropical community harbors.
The last lap of the great line of the Eastern Ghats, interspersed with numerous hills and plateaus, constitutes a large share of the forest wealth of Odisha. Vegetation of this tract primarily comprises of the tropical deciduous type (moist and dry depending on soil wetness) with the presence of randomly scattered semi-evergreen patches [39]. The Kandhmal district is a part of the Eastern Ghats, endowed with bountiful forest resources, is biologically very rich, and spreads over 67.37% of the area in the district [40]. In addition, 53.58% of the populations of the district are tribal, amongst whom Kondha and Kolha [41] are predominant. Due to crude social taboos and cultural associations with forests, these aboriginal people live within the forest or its vicinity. Hilly terrain, landlockedness, no noticeable industrial setup, and subsistence rain-fed agriculture make forest-based livelihoods a major source of revenue for the tribes. The forest provides food, fuel wood, fodder for livestock, medicine, thatching, and construction materials [42]. Major non-timber forest products (NTFPs) collected from the area include sal leaf, siali leaf, kendu leaf, mahua flower, mahua seed, sal seed, marking nut seed, chara seed, myrobalans, hill broom grass, wild mushrooms, siali fibres, bamboo, and cycas tuber. These products provide subsistence and non-farm income during the slack periods of agriculture and play a critical role in alleviating the hunger of these forest dwellers. However, shifting cultivation found in the district to a limited extent was absent in the present study sites. They often clear a patch of forest, encroach, and conduct rain-fed farming without any soil conservation measures. These disturbances often regulate the natural recovery of the forest ecosystem, even though these do not override the ecological limits. The severity and type of disruption in forest ecosystem functioning depend on the intensity and frequency of such an anthropogenic intrusion [43].
Barlow et al. [5] observed that human-induced disturbances are much more destructive than deforestation alone. A bundle of anthropogenic events acting directly or indirectly modifies most of the structural features of a forest ecosystem, exacerbating biodiversity loss. One major pathway is the change in stem density of large trees which triggers ground level modification, ultimately retarding the plant recruitment status, the mortality of established plants, and the demography of coexisting species, causing forest degradation and finally leaving species in the diversity loss vortex to perish [44]. Secondly, modification in the demography of tree species creates variation in the structural complexity of the forests and promotes the growth of generalist species, excluding a few specialist species from the upper strata [45]. The disturbances also eliminate species which have specific adoptive traits as they seldom withstand the impulsive force of perturbation.
Plant communities with varying proportions of dominant and co-dominant trees can be observed within the moist deciduous forests of this tract of the Eastern Ghats. While the perturbation impulses because of fringe villagers’ dependency on these forests can be counted easily, the response of plant communities to this resource utilization needs proper assessment for sustainability. Field enumeration focusing on descriptive and numerical plant community attributes, such as species composition, demographics, and the status of recruits along disturbance gradients, will enrich the knowledge bank and assist in devising a road map for the conservation and sustained use of forest resources in the area. Some past studies carried out elsewhere showed that disturbances in the forests may create unfavorable conditions for the successful regeneration of many of the existing species [4,7,8,15]; however, there is very limited information on how human-induced disturbances influence the species composition, diversity and distribution pattern, population structure, and regeneration of trees in the Tropical Moist Deciduous Forests of Eastern Ghats, India. In recent years, there has been an increasing level of human interference in the different forest types of this region. We hypothesize that the removal of forest biomass (through felling, fuel wood, and non-timber forest production collection), grazing, and other forms of human disturbances may create unfavorable conditions; thereby, this will bring change in the species’ composition, structure, and regeneration patterns. Therefore, we conducted a study to (i) compare the species composition, plant diversity, and tree population structure in different forest types, (ii) to examine the effect of human-induced disturbances on the vegetation with special reference to the regeneration pattern, species rarity, and abundance, and (iii) to prescribe the species that needs priority conservation to improve biodiversity and ecosystem services.

2. Materials and Methods
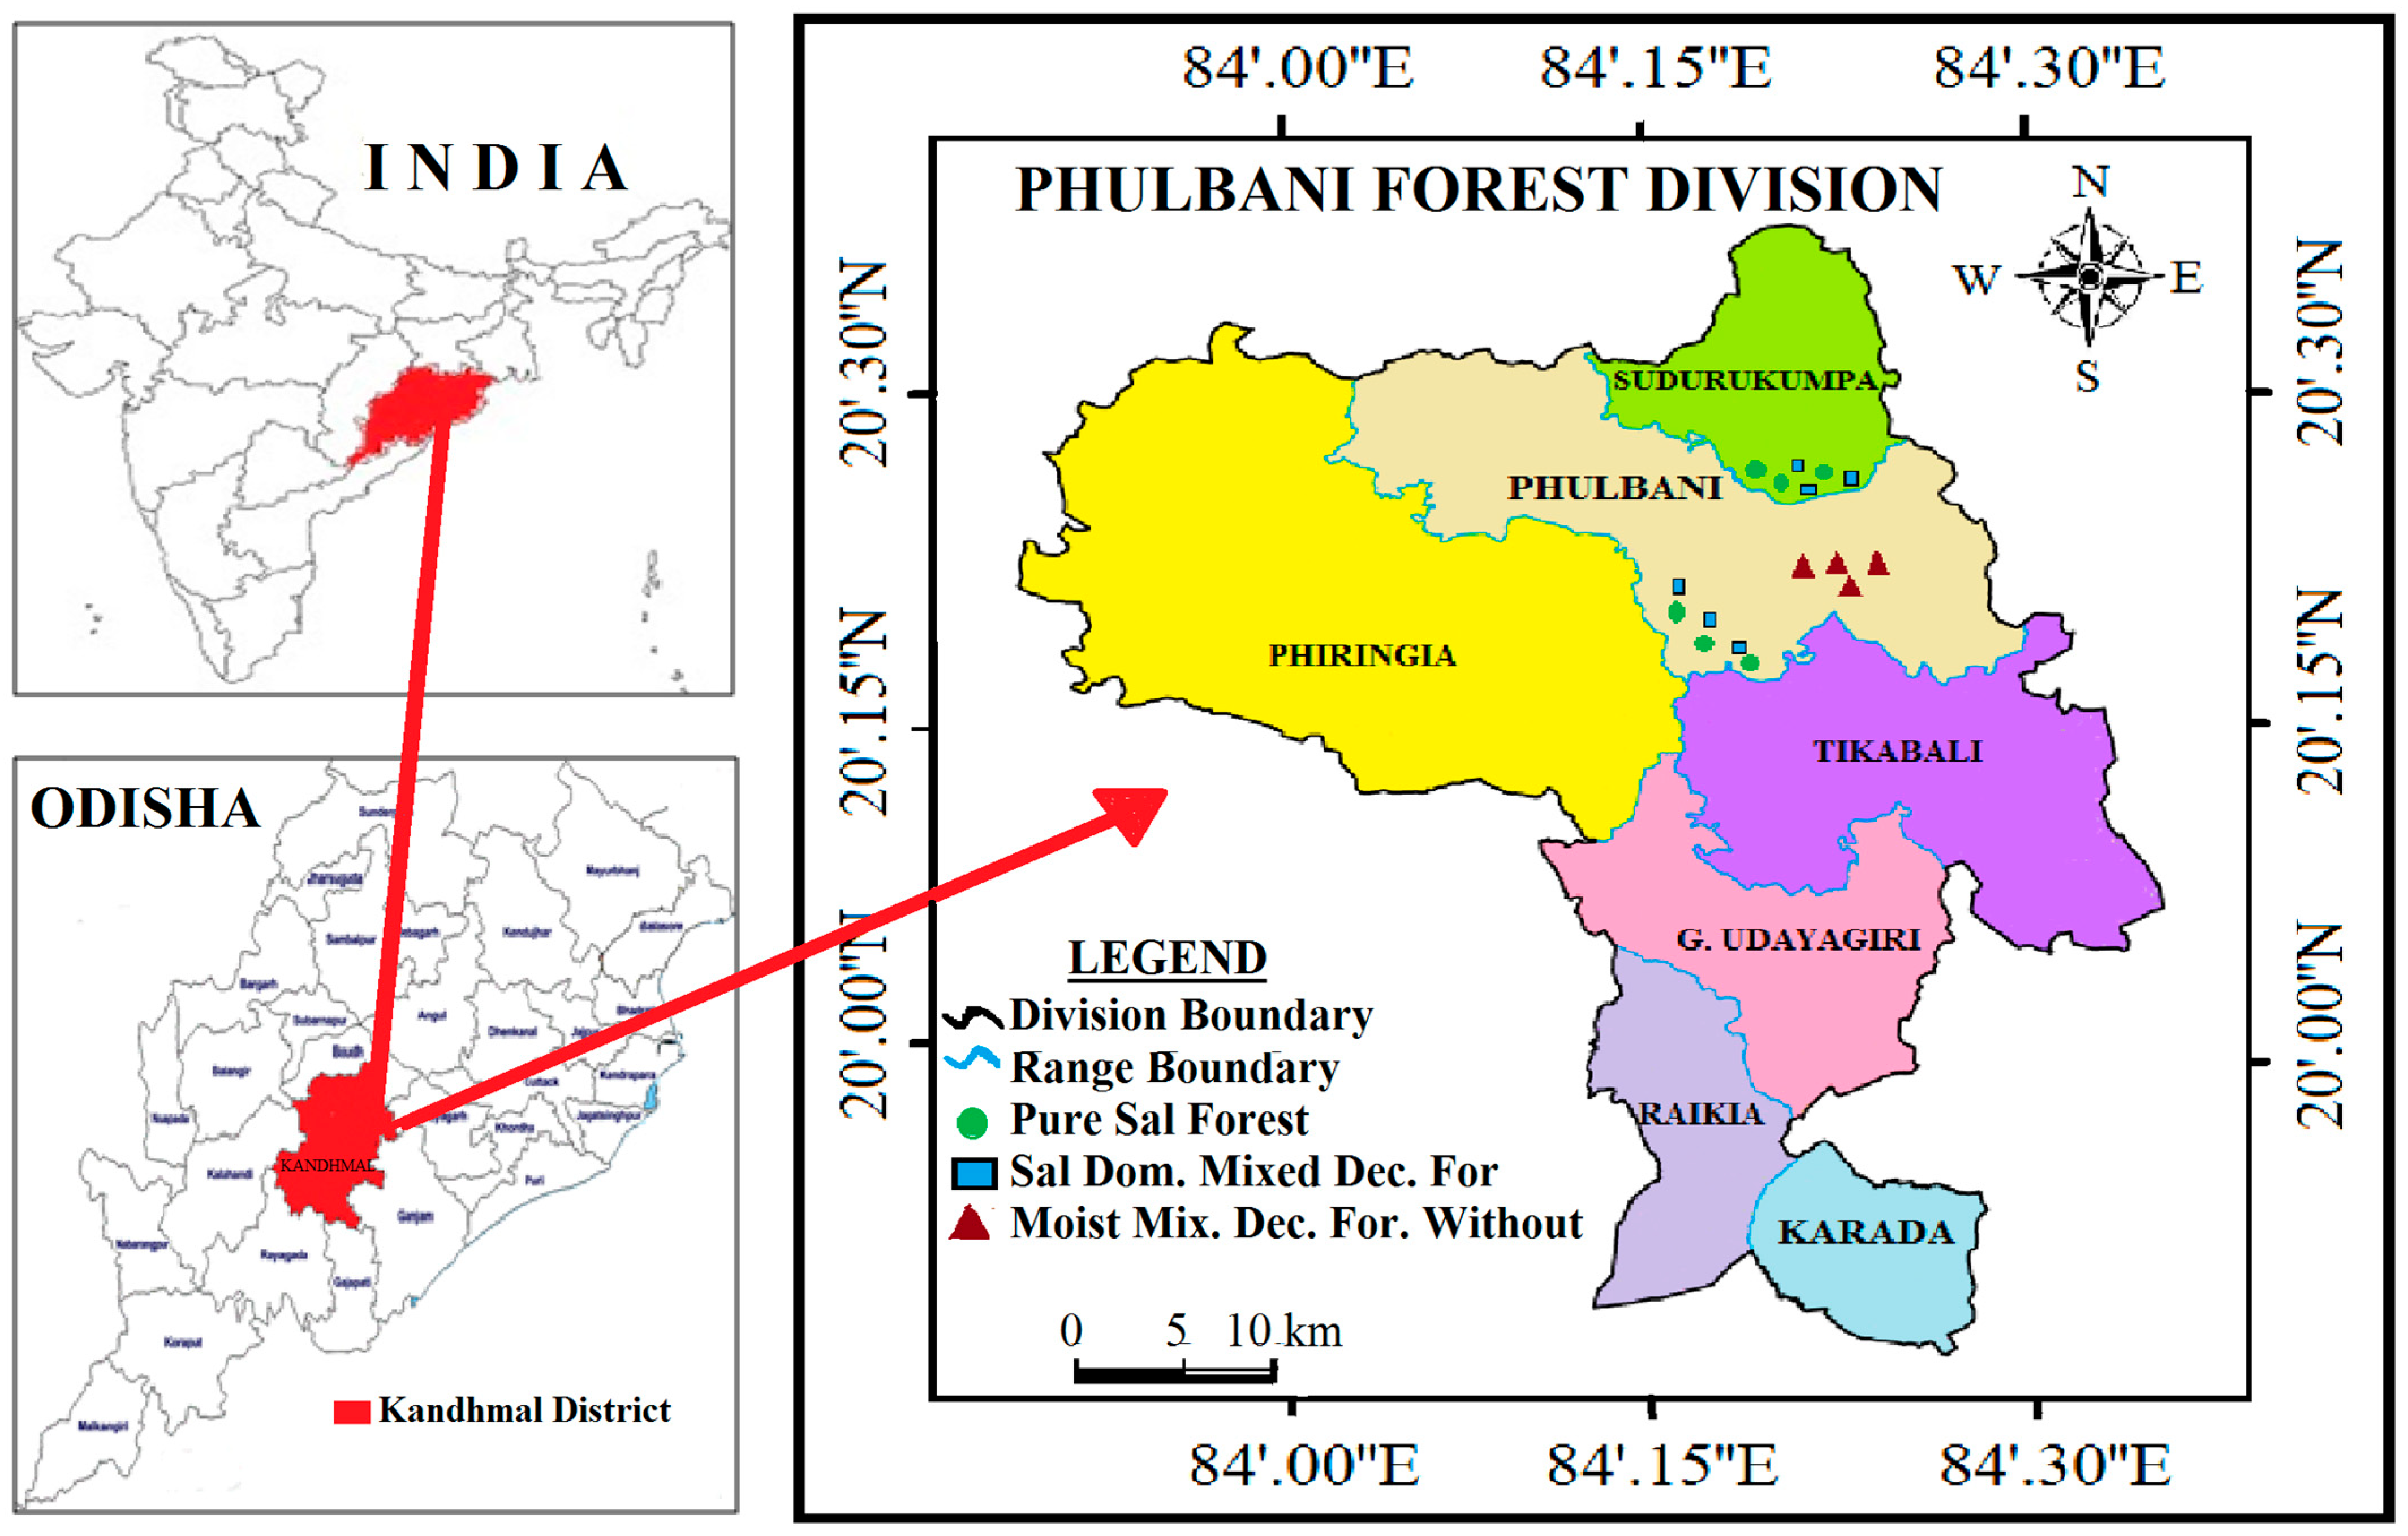
2.1. Study Area

The study was undertaken in Phulbani Forest Division, a part of the hilly ranges of the Eastern Ghats spreading over 3629.37 km2 within 19°49′50″ to 20°41′20″ N latitude and 83°46′53″ to 84°35′15″ E longitude, having a mean altitude of 485 m a.m.s.l. The climate of the study area is subtropical, hot, and dry with maximum mean summer temperature of 45.5 °C and minimum winter temperature of 2.0 °C. The area recorded 1523 to 1602 mm of mean annual rainfall, of which 80% is received during monsoon season from June to September, and the rest from October to May. The topography of the study site is undulating, having medium-sized hillocks interspersed with patches of plain land and plateaus. The tract is well drained due to the presence of numerous small nalahs, streams, and rivulets draining into the river Salki and Baghnadi. The rocks occupying the greater part of study area consisted of alluvium, laterite, sandstone, and Archean rocks. The soils of the major part of study site are immature, deep, well drained, fine, loamy in texture, and acidic in reaction. Being a part of the Eastern Ghats, the Phulbani Forest division is rich in forest resources. The forests fall under North Indian tropical moist deciduous, moist mixed deciduous, and tropical dry deciduous types [39]. In the lower hills and plains, depending upon the soil depth and moisture content, Sal (Shorea robusta) forms pure stand and Sal-dominated mixed forest; however, Mixed forest, without any dominant species, exists along the higher altitudes. The tribal communities living in the fringe villages depend on these forests for small timber, poles, fuel wood, thatching materials, non-timber forest products, wild foods, and ranching of domestic animals. All these activities including illegal timber extraction and trade by few antisocial individuals exert tremendous biotic pressure, altering structure and composition of the forests.
Repeated field surveys were conducted during 2020–2022 in the four reserve forests (Khajuripada RF, Dutimundi RF, Dakapalla-B RF, and Sudurukumpa RF) of tropical moist deciduous forest in Phulbani Forest Division, Odisha, India (Figure 1). We identified three forest communities, viz. Pure Sal Forest community (PSF), Sal-Dominated Mixed Deciduous Forest community (SDMDF), and Moist mixed Deciduous Forest Without Sal community (MDFWS), experiencing different degrees of disturbance. A composite disturbance index was developed for all sites by summing up the relative scores (3.0 scales-based) for every anthropogenic action, and tree stump-based disturbance index was determined by adopting the equation of Rao et al. [46]. After comparing the composite disturbance index value, the sites were categorized as moderately disturbed (MD), low-disturbed (LD), and undisturbed (UD) (Table 1).

2.2. Vegetation Sampling

Within tropical moist deciduous forests, three categories of forest community, viz. Pure Sal Forest (PSF), Sal-Dominated Moist Deciduous Forest (SDMDF), and Moist Deciduous Forest Without Sal (MDFWS) were selected (Figure 2).
Major disturbance bundles received from different sources are measured and categorized into three levels based on the cumulative disturbance index, viz. moderately disturbed (MD), low-disturbed (LD), and undisturbed (UD). In MDFWS type, only two levels of disturbance were found, viz. moderately and undisturbed (Figure 3). In each forest community and disturbance category two sample plots of 1.0 ha each were established, totaling 16.0 ha of sampling area. Within each plot, four sub plots (31.5 m × 31.5 m for trees, 5 m × 5 m for shrubs and saplings, and 1 m × 1 m for herbs and seedlings) were randomly delineated following the procedures of Curtis and Cottom [47]. All encountered plant species were identified, counted, and measured for their height and diameter in the field itself.
Tree diameter was measured at breast height (1.37 m from ground) over the bark. The individuals with diameter at breast height (DBH), ≥10 cm, were considered as adult, DBH < 10 cm and height ≥ 20 cm as sapling, and DBH < 10 cm and height < 20 cm as seedlings [48]. The proportion of individuals which were trees, saplings, and seedlings was taken to determine the regeneration status of the forest types at each disturbance level [49]. The regeneration status of tree species was expressed at five levels as follows: (a) ‘good’, if number of individuals in seedling > sapling > adult; (b) ‘fair’, if seedling > sapling ≤ adult; (c) ‘poor’, if a species has only saplings, but no seedlings (may be saplings <, =, or > adult); (d) ‘none’, if a species survives as adult only (no seedling and saplings); and (e) ‘new’, if a species exists as sapling or seedlings, but has no adults. The population structure of the forest was analyzed based on the tree diameter classes across five classes, viz. 10–20 cm, 21–30 cm, 31–40 cm, 41–50 cm, and >51 cm. The distribution patterns of tree species were examined at three levels, viz. contagious, random, and regular based on abundance to frequency ratio, as described by Curtis and Cottam [47]. The descriptive variables for community structure, viz. basal area, frequency, density, and importance value index (IVI), were computed following the formulae of Misra [50]. The diversity indices such as Shannon–Weiner diversity index (H′), Simpson’s dominance index (Cd), Pielou’s evenness index (E), Margalef’s species richness index (R), and Sorensen’s index for similarity (S) were calculated according to Shannon and Weiner [51], Simpson [52], Pielou [53], Margalef [54], and Sorensen [55]. The mathematical formulae used for calculating various vegetation indicators are as follows:
A b u n d a n c e A = N o .   o f   i n d i v i d u a l s   o f   t h e   s p e c i e s N o .   o f   q u a d r a t s   o f   o c c u r a n c e
D e n s i t y D = N o .   o f   i n d i v i d u a l s   o f   t h e   s p e c i e s T o t a l   N o .   o f   q u a d r a t   s t u d i e d
R e l a t i v e   D e n s i t y R D = T o t a l   N o .   o f   i n d i v i d u a l s   a   s p e c i e s T o t a l   N o   o f   i n d i v i d u a l s   o f   a l l   s p e c i e s × 100
R e l a t i v e   F r e q u e n c y R F = N o   o f   q u a d r a t s   o f   o c c u r a n c e   o f   a   s p e c i e s N o   o f   q u a d r a t s   o f   o c c u r a n c e   o f   a l l   s p e c i e s × 100
R e l a t i v e   B a s a l   A r e a R B A = T o t a l   b a s a l   a r e a   a   s p e c i e s T o t a l   b a s a l   a r e a   o f   a l l   s p e c i e s × 100
Importance Value Index (IVI) = RF + RD + RBA
Shannon–Weiner diversity index (H’):  H = i = 1 n ( n i N ) logon ( n i N )
where ni = Number of individuals of the species ‘i’ and N = Number of individuals of all species.
Simpson s   dominance   index   ( Cd ) :   C d = ( n i / N ) 2
where ni = total number of individuals of tree species and N = total number of individuals of all tree species.
Pielou’s evenness index (E):  E = H / ln ( S )
where H′ = diversity index, S = number of species, N = total number of individuals of all tree species, and Ln is the natural logarithm to the base ‘e’.
Margalef’s species richness index (R):  R = ( S 1 ) / N
where S = number of species and N = total number of individuals of all tree species.
Sorensen s   index   for   similarity   Index   ( S ) :   S = 2 C / ( A + B )
where C = is the number of species common to both the sites, A = is the total number of species in stand ‘A’, and B = is the total number of species in stand ‘B’.
To understand the impact of disturbances on species rarity, the species were grouped into five categories, following the rarity categorization of Kadavul and Parthasarathy [56] as follows: (a) very rare (species having <2 individuals/ha), (b) rare (species having 2–10 individuals/ha), (c) common (species having 10–20 individuals/ha), (d) dominant (species having 20–50 individuals/ha), and (e) Pre-dominant (species having >50 individuals/ha). The plant species which could not be identified in the field, however, were brought to the laboratory and identified with the help of herbaria of Odisha biodiversity board, and using the published literatures on floras of the region, viz. Saxena and Brahmam [57] and Mishra et al. [58].

2.3. Statistical Analysis of Data

Statistical analysis of data for descriptive variables was done using statistical package (SPSS 20.0; IBM Corp., Armonk, NY, USA) [59]. To ascertain the impact of disturbances on species composition and diversity, Permutation analysis of variance (PREMANOVA) test was done using software R-“vegan (2.6-4)” (R Foundation for Statistical Computing, Vienna, Austria) [60]. Rank abundance curve was prepared using Past Software (4.3) following Magurran and McGill (Redfern, NSW, Australia) [61].

3. Results

3.1. Floristic Composition

A total number of 161 species (61 trees, 40 shrubs, 60 herbs) belonging to 77 families and 143 genera were recorded in the selected eight sites. In the PSF, Dipterocarpaceae was the dominant family and Anacardiaceae, Combretaceae, and Sapotaceae were the other co-dominant families found. In the SDMDF, Dipterocarpaceae was also the dominant family, and Phyllanthaceae and Sapindaceae were the co-dominant families. In the MDFWS type, Combretaceae was the dominant family, and Anacardiaceae and Sapindacaeae were the co-dominant families found. Out of the twenty-four families, eight families were represented by a single species, thirteen families were represented by more than one species, two families were represented by five species, and one family was represented by ten species. With a maximum of ten species Fabaceae was the most conspicuous family among the trees in all the three forest types studied. Anacardiaceae, Combretaceae, Dipterocarpaceae, and Phyllanthaceae were the tree families common to all sites. Rubiaceae, with four species, and Apocynaceae, with three species, were the largest families among the shrubs. Asteraceae, with six species, was the largest among the herbs (Table 2).
The enumeration of the site-wise familial distribution of trees (DBH > 10 cm) reveals that in the PSF, the undisturbed site contained 10 families and 13 genera, the LD site contained 7 families and 10 genera, and the MD site contained 6 families and 8 genera. Out of the ten families in the undisturbed site, Anacardiaceae, Fabaceae, and Phyllanthaceae were comprised of two genera and species each, and the other six families were represented by a single genus and species. In the low-disturbed site, Anacardiaceae was represented by three genera and species, Fabaceae was represented by two genera and species, and the other five families were found having a single genus and species. In the MD site, Anacardiaceae and Dipterocarpaceae were represented by two genera and species each, while the other four families were represented by a single genus and species. The SDMDF forest comprised of 15 families and 26 genera in the undisturbed site, 11 families and 20 genera in the low-disturbed site, and 13 families and 21 genera in the MD site. Out of the 15 families in the undisturbed site, 8 families were represented by a single genus and species, and the rest had more than one genus and species. In the low-disturbed site, five families were represented by one genus and species and the rest were represented by more than one genus and species. Anacardiaceae, with four genera and species, was the most conspicuous family in the moderately disturbed sal-dominated forest, followed by Phyllanthaceae (three genera and species), Combretaceae, Dipterocarpaceae, and Euphorbiaceae (two genera and species each). The other seven families were represented by a single genus and species. The MDFWS site consisted of 20 families and 37 genera in the undisturbed site and 20 families and 33 genera in the MD site. Out of the 44 species observed in the undisturbed site, Fabaceae was the most conspicuous, having six genera and eight species. Ten families were represented by a single genus and species, and the rest were represented by more than one genus and species. In the MD site, Fabaceae was represented by six genera and six species, eight families were singleton, and the rest were represented by more than one genus and species (Table 2). The number of tree families and genera decreased from undisturbed sites to MD sites in all three forest types. A total of 23 families (35 genera and 40 species) of shrubs were recorded in the three forest types. The PSF and SDMDF comprised of 20 families each and the MDFWS type had 18 families. The number of families and genera in undisturbed sites was highest in the undisturbed sites and decreased to the lowest in MD sites. A reverse order was observed in herb diversity. The number of herb families was higher in MD sites as compared to the low-disturbed and undisturbed sites in all the forest types (Table 3).
The results of the PREMANOVA test showed that disturbances had a significant negative impact on the diversity of trees (p < 0.001) and shrubs (p < 0.001), whereas the herb species showed a significant (p < 0.004) opposite trend (Table 4). The density and basal area of the trees (mature, saplings, and seedlings) decreased with the increase in the disturbance level. The shrub density, basal area, and herb density showed an increasing value with the increased disturbance level in all forest types. The Margalef’s species richness index and Shannon–Weiner diversity index were decreased with the increased disturbance level for trees and shrubs, but in the case of herbs, it showed an opposite trend. The Simpson’s dominance index value for trees and shrubs increased with the disturbance level, except in the case of the sal-dominated moist forest, in which the dominance index for the trees did not follow any definite pattern. Simpson’s dominance index and Pielou’s evenness index value for herbs did not follow a definite pattern.
The Rank abundance curve (Figure 4) indicates the distribution patterns of abundance in three forest types along a disturbance gradient. In the PSF, the dominance was concentrated among a few species and its equitability was increased or dominance reduced with the replacement of the dominant species sal with other species in the order PSF > SDMDF > MDFWS. As far as the impact of disturbance is concerned, it had a noticeable impact on abundance sharing in all the three forest types. In the undisturbed sites, the relative abundance was distributed among many species and the dominance was shared by more than one species of trees. With the increase in the disturbance level (the low-to-moderate disturbance level) the distribution patterns of dominance changed randomly to an uneven pattern and the dominance was shared primarily by one or two species.
The Sorensen’s similarity index value of trees in the three forest types shows maximum species similarities among the low-disturbed sites with the undisturbed site and minimum among the MD site with the undisturbed site (Table 5). In shrubs, the similarity among the species was high among MD sites with the low-disturbed sites, but in herb species, no definite pattern was observed.

3.2. Distribution Pattern and Rarity of Species

In the PSF moderately disturbed site, 62.5% of tree species were found to be in the rare category, while in the low-disturbed site, it was 10%, and in the undisturbed, no species fell under this category (Table 6). Our results revealed that 12.5% of species in the MD site were common, while this was the case for 70% in the low-disturbed and 61.54% in the undisturbed sites. The percentage of dominant species in the community was high in the undisturbed PSF (30.77%) and 12.5% in both the low- and moderately disturbed sites. Shorea robusta was predominant in three sites of the pure sal forest. In the SDMDF, 28.57% of the species fell under the rare category, while it was 15% in the low-disturbed and 7.14% in the undisturbed sites. The tree species which were common contributed 52.38%, 40%, and 39.27% of the species in the moderately, low, and undisturbed sites, respectively. The number of species under the dominant category was reduced with the increased degree of disturbance. Shorea robusta and Cleistanthus collinus formed the predominant group of the species in the undisturbed site, while Shorea robusta was predominant in the low- and moderately disturbed sites of the SDMDF. In the moderately disturbed sites, 36.11% of tree species fell into the rare category, while it was 6.82% for the undisturbed site. The number of species falling under the common and dominant category reduced with the increased degree of disturbance. The predominant group of trees species were absent in both sites of the MDFWS type.
The disturbances had a negative impact on the distribution patterns of the tree species and they were not uniform in all the sites. In the undisturbed (UD) site of the PSF, 61.54% of trees showed a contagious distribution, which reduced to 40% in the low-disturbed (LD) site and 12.50% in the moderately (MD) disturbed site. On the other hand, the random and regular pattern of distribution increased (UD < LD < MD) with the increase in the degree of disturbance (Table 7). In the SDMDF, 67.86% of trees followed a contagious distribution pattern in the UD site, which reduced to 30.00% and 19.05% in the LD and MD sites, respectively. In the MDFWS, the contagious distribution pattern of trees was 90.91% and 77.78% in the UD and MD sites, respectively. The percentage of trees showing random and regular distribution patterns increased with the degree of disturbance in all forest types. In shrubs, a contagious distribution pattern was most prevalent, followed by random patterns in all sites of the three forest types. The distribution patterns in herbs were opposite to that of the trees and shrubs. They mostly showed a contagious distribution and their percentage share increased with the increased level of disturbance (Table 7). Noticeable variations in the density and distribution of the taxa (family and genus) with respect to the degree of disturbance were also observed in all forest types (Table 6).

3.3. Regeneration Status of Tree Species

Based on the importance value index (IVI), Shorea robusta was found to be dominant in all the sites (UD, LD, MD) and it had good regeneration. The density of its seedlings decreased with the disturbance level, viz. 65,000 ha−1 in UD, 43,125 ha−1 in LD, and 30,625 in MD (Supplementary Table S1). Out of the 13 tree species at the PSFUD site, all species found to be regenerating; 11 had good regeneration and 2 species had fair regeneration (Table 8). Madhuca latifolia and Cleistanthus collinus were the co-dominant species in the site, exhibited fair and good regeneration, respectively. In the PSF low-disturbed site, out of ten species, eight species were found to be regenerating which represented 80% of the total species; six species had good regeneration and two species were fairly regenerating. The co-dominant species Terminalia alata had good regeneration (3125 seedlings ha−1). In the PSF moderately disturbed site, out of eight species, four species exhibited good regeneration and one species showed fair regeneration. The co-dominant species Vateria indica and Semecarpus anacardium exhibited poor regeneration (no seedlings).
In the SDMDF community, Shorea robusta was dominant in all the sites (UD, LD, MD) and exhibited good regeneration. Its seedling density decreased with the increased disturbance level, viz. 75,625 ha−1 in UD, 45,000 ha−1 in LD, and 28,750 in MD (Annexure 1). In the SDMDFUD site, out of the 28 species, 12 species exhibited good regeneration (42.86%), 15 species showed fair regeneration (53.57%), and one species had poor regeneration. The results showed that Cleistanthus collinus and Buchanania lanzan were the co-dominant species, both showing good regeneration (8750 seedlings ha−1 and 62,508,750 seedlings ha−1, respectively). In the SDMDFLD forest site, out of the 28 species, 5 species showed good regeneration (25.0%), 14 species showed fair regeneration (70.0%), and one species did not regenerate. The major associates in the forest were Cleistanthus collinus which exhibited good regeneration (2500 seedlings ha−1). Other co-dominant species such as Madhuca latifolia, though, had a higher number of seedlings (3125 seedlings ha−1) in the forest and showed fair regeneration. In the MD sal-dominated moist deciduous forest site, out of the 21 species, 3 species had good regeneration (14.29%), 10 species were fairly regenerating (47.62%), and 6 species had no regeneration. Schleichera oleosa and Cleistanthus collinus were the major associates in this forest and they exhibited fair regeneration. No regeneration was found in Adina cordifolia, Anogeissus latifolia, Holoptelea integrifolia, Grewia tiliifolia, Macaranga peltata, or Vateria indica.
In the moist deciduous forest without sal, Terminalia alata was dominant in both the UD and MD sites and had good regeneration (16,250 seedlings ha−1 in UD and 3125 seedlings ha−1 in MD). The density of its seedlings reduced from 159,375 ha−1 in the UD site to 112,500 ha−1. Out of the 44 species in the UD moist deciduous forest without sal site, 13 species had good regeneration (29.55%), 26 species were fairly regenerating (59.09%), 3 species had poor regeneration, and 2 species did not have any sign of regeneration. Based on the IVI, Bridelia retusa and Mitragyna parvifolia were the major co-dominant species. The regeneration status in Bridelia retusa was good (8750 seedlings ha−1) and in Mitragyna parvifolia the regeneration was fair (8125 seedlings ha−1). Pterospermum xylocarpum and Schrebera swietenioides had no regeneration. In the MD moist deciduous forest without sal site, out of the 36 species, 31 species were regenerating, implying high species regeneration (86.11%). In this forest, 10 species showed good regeneration (27.78%), 17 fair regeneration (47.22%), 4 had poor regeneration, and 5 species had no regeneration. Based on the IVI, Diospyros melanoxylon and Anogeissus latifolia were the major co-dominant species, and were fairly regenerating (Supplementary Table S1).

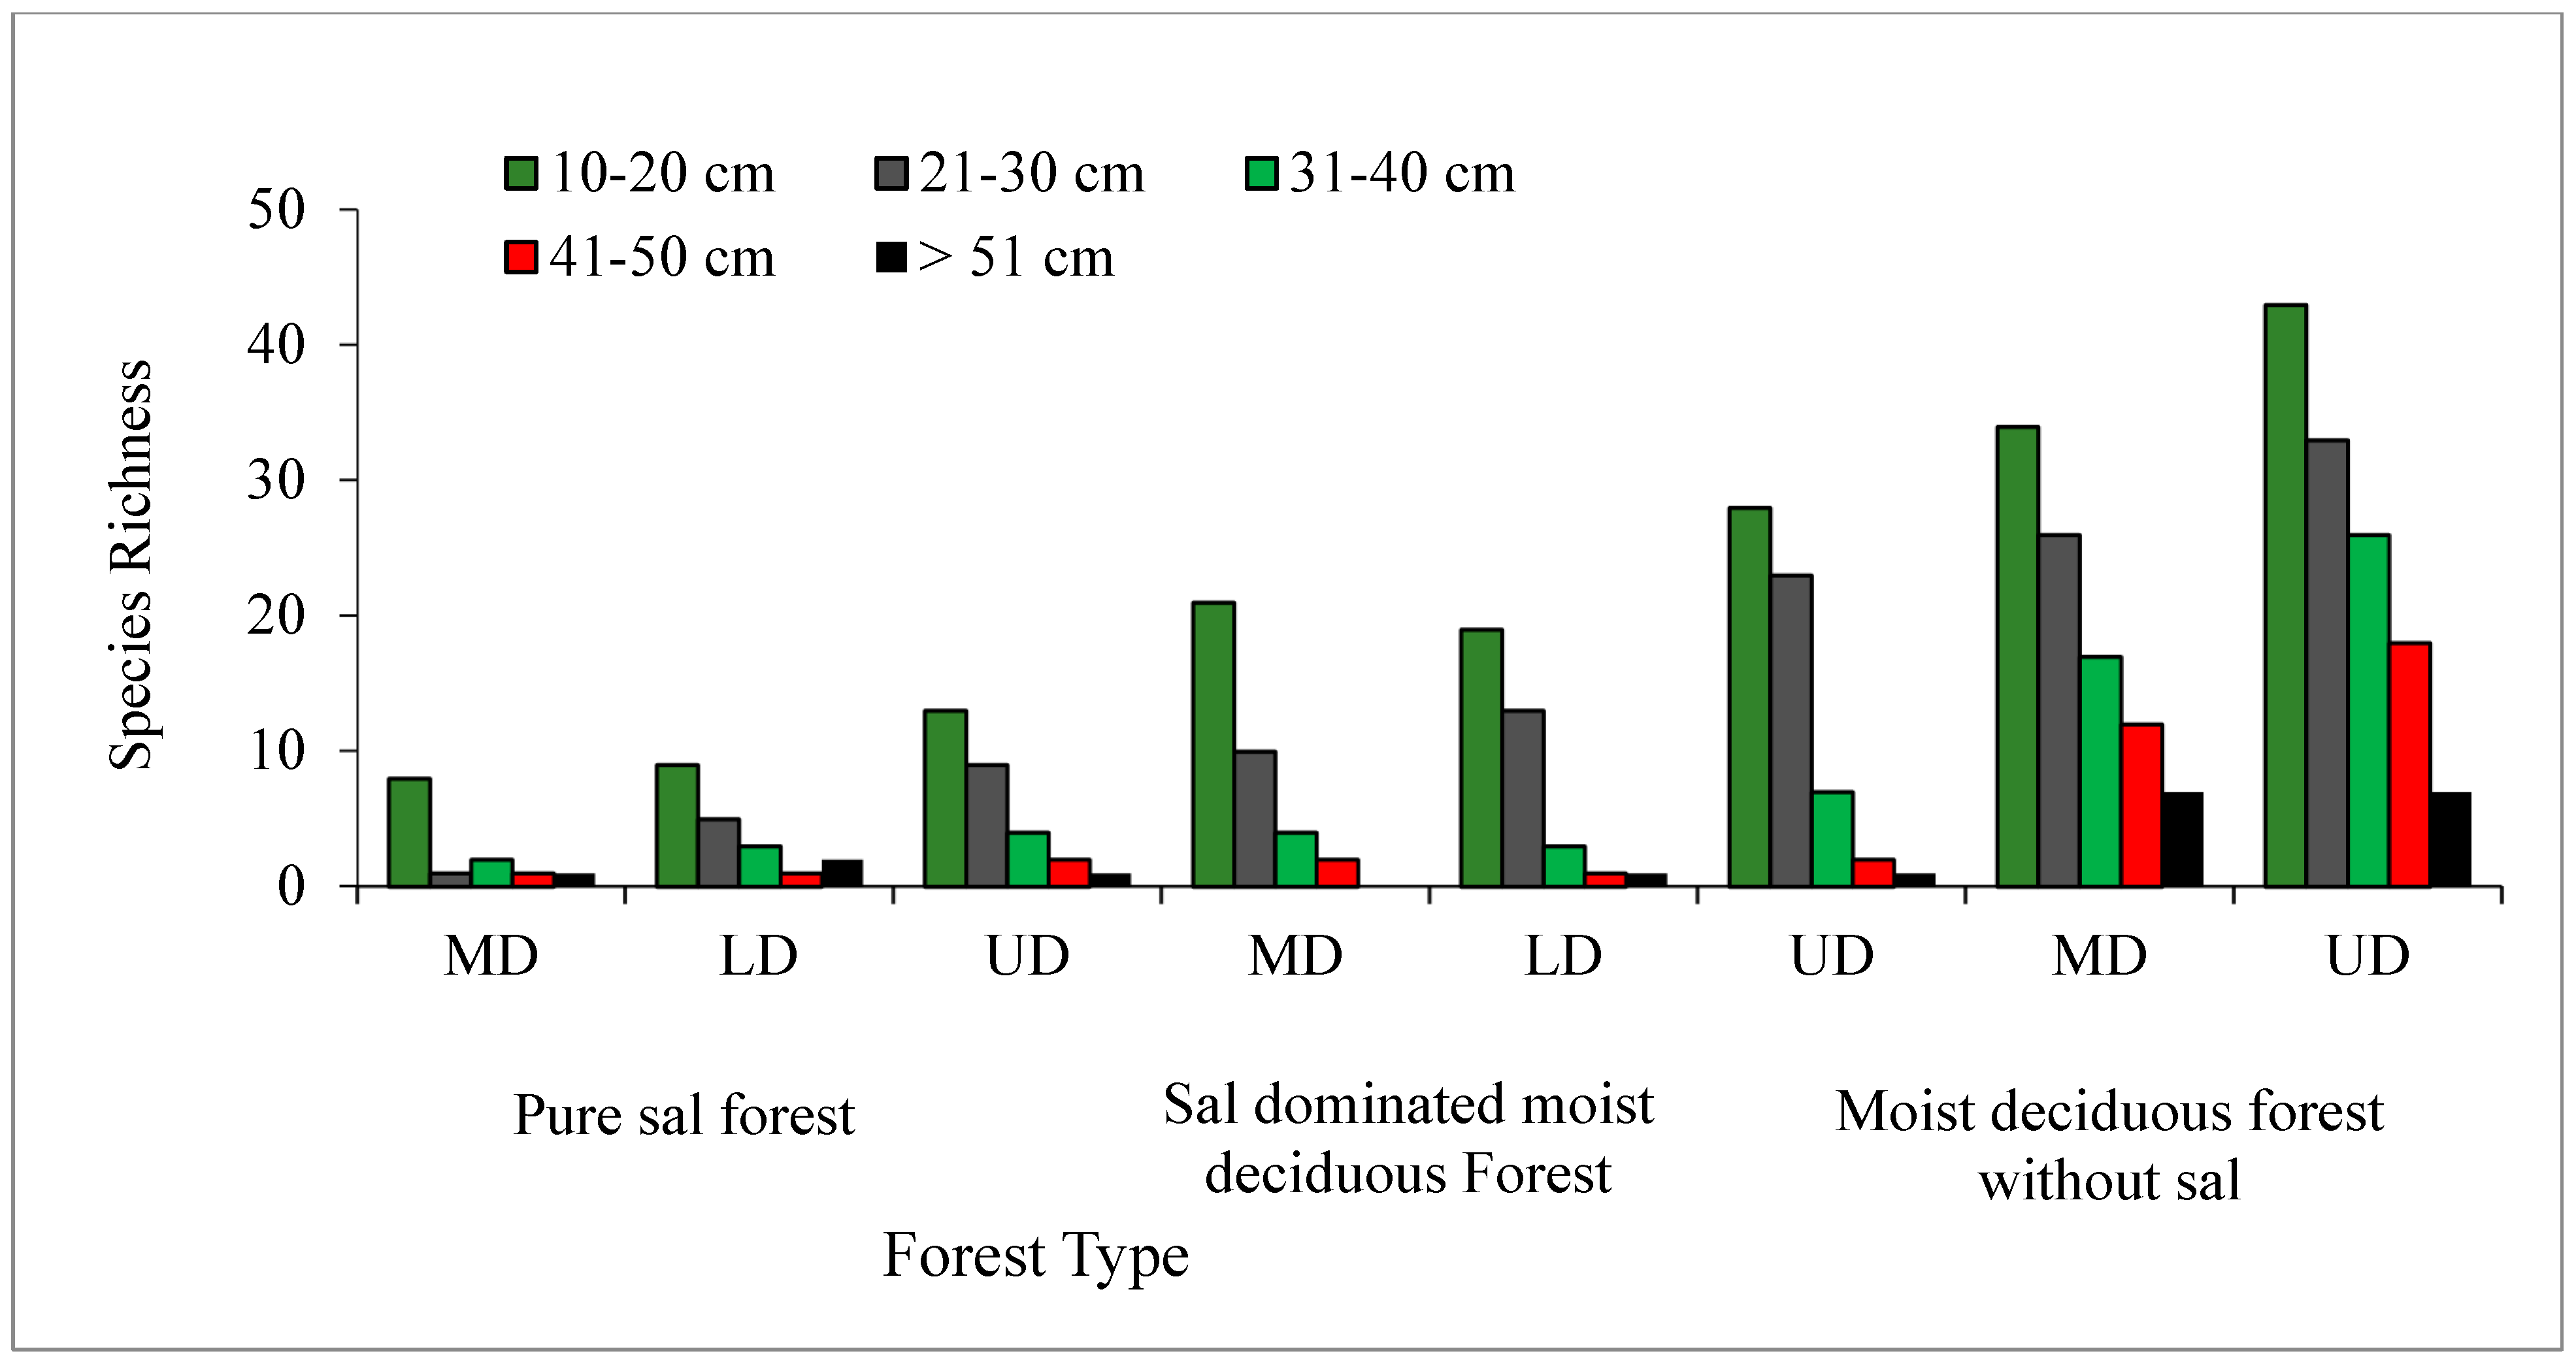
3.4. Population Structure of Tree Species

In all the three forest types, the tree density and basal area decreased significantly (p < 0.05) with the increased level of disturbance (Figure 5 and Figure 6). In the PSF, the total density, total basal area, and mean basal area per tree was computed as 625 stems ha−1, 30.12 m2 ha−1, and 2.32 m2 ha−1 per tree species in the UD site, 520 stems ha−1, 18.12 m2 ha−1, and 1.87 m2 ha−1 per tree species in the LD site, and 490 stems ha−1, 16.66 m2 ha−1, and 2.08 m2 ha−1 per tree species in the MD site, respectively (Supplementary Table S1). In the SDMDF, the total density, total basal area, and mean basal area per tree was computed as 756 stems ha−1, 21.69 m2 ha−1, and 0.77 m2 ha−1 per tree species in the UD site, 600 stems ha−1, 20.13 m2 ha−1, and 1.01 m2 ha−1 per tree species in the LD site, and 473 stems ha−1, 11.68 m2 ha−1, and 0.55 m2 ha−1 per tree species in the MD site, respectively (Supplementary Table S1). In the MDFWS, the total density, total basal area, and mean basal area per tree was computed as 825 stems ha−1, 32.06 m2 ha−1, and 0.73 m2 ha−1 per tree species at the UD site, and 663 stems ha−1, 22.26 m2 ha−1, and 0.68 m2 ha−1 per tree species in the MD site, respectively (Supplementary Table S1). The density distribution of matured trees among the diameter classes showed that the lowest diameter class (10–30 cm) constituted the highest stem density in all sites (UD, LD, and MD) and in all forests (Figure 4). In the pure sal forest, the basal area distribution among the diameter classes showed that the 21–30 cm diameter class had the maximum share in the MD site, and the >50 cm diameter class had the highest basal area in the UD and LD sites. In the SDMDF, the highest basal area was recorded in the 10–20 cm class in the MD and UD sites, and it was the 21–30 cm diameter class that constituted the maximum basal area in the LD site. In the MDFWS, all of the diameter classes had more or less an equal share to the total basal area (Figure 5). Tree species richness was the highest in the lower diameter class, viz. 10–20 cm and 21–30 cm, and it decreased in the higher diameter classes (Figure 5). In all the three forest types, the density of the seedlings, saplings, and basal area of the saplings decreased with the increased level of disturbance (Table 2). In the PSF and SDMDF, Shorea robusta was the dominant seedling species in all sites, but its seedling density decreased along the disturbance gradient (Supplementary Table S1). In the MDFWS, Terminalia alata was the dominant species in the UD site, while Diospyros melanoxylon was the dominant species in the MD site. Among the saplings, Shorea robusta was dominant in the PSF and SDMDF forests irrespective of the levels of disturbance, but its density was high in the LD sites in both forest types. Bridelia retusa and Diospyros melanoxylon were the dominant saplings in the UD and MD sites of the MDFWS (Supplementary Table S1).

4. Discussion

Environmental gradients such as rainfall pattern, temperature regime, topography, and edaphic factors create variations among tropical forest formations; even relatively small partial scale microhabitat modifications (such as soil physic-chemical properties) can regulate floristic attributes [19]. Plant diversity and richness in a tropical forest can be as low as 20 species per hectare in the flooded Varzea forest of Rio Xingu Brazil to 307 species per hectare in the Amazonian forest near the Equator [62]. The overall measurable value of 161 plant species (trees 61, shrubs 40, and herbs 60) in the 16.0 hectares of the studied forest area (all three forest types) reflects a moderate level of diversity. The results are compared well with the plant species richness of 187 enumerated species (trees 91, shrub 10, climbers 12, and herb 74) of the adjoining Boudh forest division [63]. The plant species richness in the present study was also high compared to the reported species richness of 89 plant species (34 tree, 15 shrubs, 25 herbs, and 15 climbers) in tropical moist deciduous forests of Assam [29], but lower than the reported 388 plants (trees, shrubs, climbers, and herbs) in the moist deciduous forest of the neighboring Nayagarh forest division [37], and the 266 species (trees 117, shrubs 31, climbers 17, and herbs 101) in the moist deciduous forest of the Similipal biosphere reserve [58]. The site-specific edaphic characters, such as soil texture, slope gradient, wetness and dryness of soil, and non-inclusion of climbers, in the present floristic study are the key determinants of this lowered plants diversity. A wide range of variations in species richness was observed among the three forest types, viz. the PSF, SDMDF, and MDFWS. They differed from one another with respect to the species composition, species dominance in the canopy layer, and stocking density. Two forest communities, viz. the PSF and SDMDF, were inter-mixed at the foot hill of the forests under similar edaphic conditions, whereas the MDFWS communities were found at relatively moist parts of the Eastern Ghats.
Anthropogenic disturbances such as illegal felling [29], lopping [64], livestock grazing [8], and NTFPs collection [65] lead to species-specific changes in the population structure, culminating in evasion from the communities [66]. Perturbations of any magnitude encourage alterations in biogeochemical processes, retrogression, recovery, and rejuvenation, but not necessarily with the same species. Species richness of a perturbed forest, therefore, will be the outcome of the differential resilience power of species to disturbances [67]. A decrease in the species richness with respect to the disturbance gradient was observed in all the communities in varying degrees. The rate of species evasion (trees species number) was the highest in the PSF (23.07% in LD to 38.46% in MD), followed by the SDMDF community (25% in MD to 28.5% in LD), and the least in the MDFWS community (18% in MD). The higher species richness in undisturbed sites may be due to minimal human interference because of the inaccessibility and distance of sites of human habitation. In moderately disturbed forests, fringe villagers frequently collected firewood, small timber, and NTFPs, and were found grazing livestock herds. More often, landless tribes intentionally killed trees by ring-barking for making charcoal, fire wood, and for the expansion of agriculture. The connectivity of these forest sites with state highways eased illegal felling and timber smuggling, and this was one of the major causes of reduced species richness. The selective removal of trees opens up a canopy and allows more sunlight to reach to the ground floor, altering the edaphic and microclimatic condition of the site, favoring the germination and growth of short-lived herbs, thus increasing the diversity of the herbaceous layer of the forests [68]. Annual ground fire, frequent livestock grazing, and the removal of floor litter also provide a congenial environment for the colonization of new herbs species. The diversity and species richness of a herbaceous layer in a perturbed forest ecosystem are the cumulative outcomes of the intensity of the canopy opening and the gap size, the degree of ground disturbance, and the resilience power of seral in the species mosaic [69]. It is quite common to see a dense growth of annual herbs and short-lived perennials following the disturbances [70]. The effects of disturbance bundles clearly testify to the familial distribution patterns of trees, shrubs, and herbs in all the three communities. The reduced tree and shrub diversity along the disturbance gradient decreased the familial dominance, whereas it showed an opposite trend in the case of herb families. Poaceae, Fabaceae, Asteraceae, Malvaceae, and Acanthaceae were the dominant herb species families in the studied communities. A similar result was also reported in the forest floor diversity in the tropical moist deciduous forests of Eastern Ghats, Odisha [38]. Amongst the tree species families, Fabaceae was the most conspicuous in both the UD and MD sites of the MDFWS community, Rubiaceae was dominant in the UD site, and Anacardiaceae in the MD site of the SDMDF community.

4.1. Species Composition

In the PSF community the upper canopy layer was dominated by Shorea robusta, and species such as Buchanania lanzan, Careya arbore, Cleistanthus collinus, Terminalia alata, and Semecarpus anacardium were common in MD, LD, and UD sites. Economically important species such as Madhuca latifolia, Pterocarpus marsupium, and Syzygium cumini were replaced by Lannea coromandelica in the LD site and Vateria indica in the MD site. Tree species, such as Cassia fistula, Desmodium oojeinensis, Albizia lebbeck, Dalbergia sissoo, and Bauhinia variegate, were common to both UD and MD sites in the MDFWS community. In the PSF and SDMDF, sal was predominant (>50 ind. ha−1) in all sites. The dominance of sal increased with the disturbance level in the PSF community (IVI increase 151.19 UD < 167.29 LD < 192.54 MD), but decreased in the SDMDF community (IVI decrease 94.31 UD > 90.43 LD > 78.22 MD) and was shared over other associate species. In the MDFWS community, none of the species was predominant in nature and eight species fell under the dominance (20–50 ind. ha−1) category, amongst which Terminlia alata (IVI range 16.87 UD–21.21 MD site) was the most conspicuous one. Dominance increased as a function of environmental stress and past disturbances [54] and the variation in the proportions of the dominant species in different sites in the present study was attributed to site history, resource limitation due to human actions, and competition among species. Anthropogenic disturbances triggered demographic instability, and this has been reported in Madhuca latifolia in the tropical dry deciduous forest of the Vindhyan hill tract [71], Syzygium cumini in the riparian forest of the Cauvery Wildlife Sanctuary [72], and in the tropical forest at the Xuan Nha Nature Reserve, Vietnam [73]. The threatened plant species, viz. Pterocarpus marsupium, having a density of 20–35 ind. ha−1 in undisturbed sites of all the communities, was found absent in the MD sites. Anthropogenic disturbances, primarily the illegal smuggling of higher diameter trees, forest fires, and NTFP collection, create gaps, favoring the growth of other associates and influxes of many invasive shrubs such as lantana (Lantana camera) and siam weed (Chromolaena odorata). This creates competition and the alteration of the ecosystem balance, resulting in a poor population in disturbed sites. Kumar et al. [74] observed the skewed population structure of P. marsupium in the central and eastern zone of India due to poor natural regeneration, which was a result of anthropogenic factors and the vigorous growth of associated species. Regional-scale climate change in tandem with deforestation and habitat unsuitably are also responsible for the declined population of P. marsupium from it natural geographical ranges in India [75].

4.2. Community Structure

Species composition, successional status, intensity of disturbance events, and resilience power of a stand contribute to variations in density, basal area, and overall community structure of forests [76,77,78,79]. The total stand basal area was found in the undisturbed sites of the PSF (30.12 m2 ha−1), SDMDF (21.69 m2 ha−1), and MDFWS (32.06 m2 ha−1), and these values were within the range of the stand basal area observed in similar forests of the region [80]. The stand basal area in tropical forests of Indian region ranges from low, 1.3 m2 ha−1 in the Vindhyan hills [66], to high, 98.6 m2 ha−1 in Namdapha National Park [81]. Sahoo et al. [82] observed a wide range of variation in the stand basal area (7.77 m2 ha−1–31.62 m2 ha−1) in different patches of the forest community within the tropical moist deciduous forests of the Eastern Ghats. We observed a non-uniform reduction in the stem density and basal area with respect to the disturbance intensity attributed to the differences in the degree of ongoing human actions in the study sites. The rate of reduction was high in the SDMDF community as compared to the other two communities (PSF and MDFWS). Illicit felling, fuel wood collection, and the closeness of site from fringe villages may be the reasons for this. The reduction in the stand density and basal area due to fuel wood collection [83] and the closeness of site from fringe villages [84] in tropical forests have been previously reported. The density of higher diameter classes was low in all communities (Figure 4) and it showed a linear negative relationship between the density and diameter, confirming the earlier observations of Rao et al. [46]. In the MD sites, the proportion of higher diameter classes is very low and it may be due to the selective felling of individuals of larger diameter classes. A similar trend in density and total basal area with respect to human-induced disturbances has been reported by others [67,85].

4.3. Distribution Patterns

Ecological processes such as seedling establishment, biotic interactions, and mortality allow a species to leave an initial foot print in a habitat. Species develop many adoptive traits to sustain the below growth and above growth competitions and interactions. The ability of species to adopt habitat variables differs from species to species and this creates variation in spatial distribution patterns [86]. The analysis of spatial distribution patterns of tree species revealed contagious pattern (PSF 61.54%, SDMDF 67.86%, and MDFWS 90.91%) followed by random and regular patterns in the UD sites. The contagious distribution pattern is most common among plant species in nature [87,88]. Most of the tree species in the study area regenerated through seeds. Disturbance-driven forest floor modifications such as gap creation, repeated grazing, soil compaction, and the heavy growth of the herbaceous layer reduces moisture availability and retards natural regeneration from seeds. This promotes increased random distribution patterns of species. The increase in random distribution patterns in LD and MD sites at varying degrees in all communities may be due to limited regeneration from coppice shoots. The decreasing trend in stem density in LD and MD sites as compared to UD sites supports the earlier observations of Sagar et al. [67] in dry tropical forests. The proportion of different age groups in a population determines the future of a species in a community and the stability of the forests [89]. In the present study, the maximum amount of stem density was observed in lower diameter classes (10–20 cm) and the amount decreased in higher girth classes (reverse ‘J’-shape population structure), indicating a progressive community.

4.4. Regeneration

Disturbances are key drivers of natural regeneration in tropical forests [90]. The removal of trees from the upper strata opens up the canopy, allows sunlight to reach the forest floor, modifies the local nutrient pool, and promotes seedling establishment and growth [91]. Hence, low-to-moderate disturbances creating gaps in the forest floor favors the natural regeneration of light-demanding species [30,92]. In the present study, the density of seedlings and saplings decreased (UD > LD > MD) with the increased disturbance which was the outcome of recurrent forest fires, grazing, and a diminished soil seed bank. In the PSF and SDMDF, the regeneration status of the dominant species S. robusta was good, but the sapling and seedling numbers decreased with the increase in intensity of the disturbance. Sal is a light demander and prefers canopy openness and gaps for seedling establishment. Repeated ground fires were the main factor for the observed a moderate seedling density in Sal. Most of the tree species showed impaired regeneration, the percentage of good and fairly regenerating species decreased with the disturbance intensity. Many species such as Semecarpus anacardium, Madhuca longifolia, Terminalia belerica, Emblica officinalis, Vaterica indica, Pterocarpus marsupium, Adina cordifolia, and Macaranga peltata were found absent in the seedling and sapling class at MD sites. Terminalia alata, having good regeneration, showed fair regeneration (lower number in the sapling stage) at the MD sites. In natural settings, the diminished number of recruits were attributed to resource competition, biotic pressure, and an altered microhabitat. The heavy collection of seeds by fringe villagers was the prime cause of the reduced soil seed bank in S. anacardium, T. belerica, and E. officinalis resulting poor–nil regeneration at the MD sites. Unrestricted cutting, lopping, litter removal, grazing, and trampling increases soil compactness and dryness. Recurrent forest fires, which are much common in the area, burn the seeds in the forest floor and make the ground situation harsher for the germination and seedling establishment of keystone resident species. The invasion of species such as Lantana camara and Chromolaena odorata is very common after fires in tropical forests, and the moderate infestation of these species at MD sites is observed. Anthropogenic disturbance-induced impaired regeneration have been previously reported [4]. At a critical level of disturbance, species exhibiting a poor–nil coppicing ability may become gradually rare or even locally extinct [91,93]. Increasing the number of rare species along the disturbance gradient (UD < LD < MD) supports this theory. The higher percentage of rare species in MD sites in all communities (PSF 62.5%, SDMDF 28.5%, and MDFWS 36.0%) signifies the impact of disturbance on forests. Anthropogenic disturbance in a forest increases rarity through two pathways: Directly by the over-utilization of a species for domestic or market use and the browsing of palatable plants. Secondly, in an indirect way via alterations in habitat features and associated species mosaics [94]. Another important thing we observed is that many of the species are locally rare (low abundances), but have a wide range of distribution in the regional scale species pool. This is because of habitat discontinuity, the unsuitability of the modified niche condition, and the preferential growth of plant species. It is quite often noticed that many of the tropical tree species growing abundantly in one locality seems to be relatively rare in other localities [95].
The tropical moist sal forest of Eastern Ghats acts as lifeline for the tribal people of the Kandhmal district. The major source of anthropogenic disturbance is from people’s dependency on forest for livelihood, small scale queering, and forest encroachment for agriculture expansion. These bundles of disturbances coupled with the improper management of forest resources reduces plant diversity, primarily the trees species of the locality. This tract of forest harbors many important tree species such as P. marsupium, T. belerica, T. chebula, M. longifolia, and S. anacardium, including sal. Indiscriminate felling and poor natural regeneration has been observed in P. marsupium, and unless immediate conservation measures are undertaken, it may become extinct locally. The lower tree abundance and high species rarity coupled with poor regeneration in moderately and low-disturbed sites warrants the need for adequate protection. It is, therefore, important to develop bottom up policies involving tribes of the locality to protect and manage the remnant forest resources so that further degradation can be checked.

4.5. Study Limitations

The study was conducted using quantitative ecological approaches and determined various vegetation indicators subjected to varying degrees of human-induced disturbances. Though there was no sampling-related bias, various factors that determine the regeneration potential of tree species such as seed production, soil conditions, age of the trees, and other micro-climatic parameters were not included in this study. This information could have provided better clues on the regeneration mechanism of some economically important/rare species found in the forest for their conservation. The local ecological and economic importance of vegetation (tree, shrub, herb, liana, etc.) was also not part of this study, which otherwise would have provided better clues for the developmental prescription and restoration of biodiversity.

5. Conclusions

Our study leads to the following conclusions:
-
The species composition varied with respect to forest types: S. robusta, M. latifolia, C. collinus, and B. lanzan in the SDMDF, and T. alata, B. retulsa, D. melanxylon, and A. latifolia in the MDFWS were identified as the dominant tree species.
-
The magnitude of human-induced forest disturbance had a significant impact on the species composition, diversity, and richness of the species at sites.
-
Species diversity on undisturbed and low-disturbed sites was significantly higher than the mildly disturbed sites in all forest types.
-
Tree density and the basal area decreased with the increased level of disturbance; the regeneration density of S. robusta was higher in undisturbed sites compared to low- and moderately disturbed sites.
-
Forest disturbance was found affecting the population structure/regeneration of several economically important tree species, viz. P. marsupium, T. belerica, T. chebula, M. longifolia, S. anacardium, etc.
-
The increased number of rare species in the order of Moderately disturbed > Low-disturbed > Undisturbed sites signifies the conservation priorities of the species.
-
The study recommends the development of proper conservation plans with the help of local communities to enhance the regeneration potential of the trees, restore biodiversity, and promote ecosystem services to the local communities.

Supplementary Materials

The following supporting information can be downloaded at: https://www.mdpi.com/article/10.3390/f14101931/s1, Table S1: Density, basal area, important value index and regeneration status of trees in the three selected forest types Eastern Ghats, India.

Author Contributions

M.C.B. and U.K.S. designed the study; M.C.B. performed the field study/investigation; M.C.B., U.K.S. and T.L.M. analyzed the data; U.K.S. supervised the work; M.C.B. wrote the first draft; U.K.S., P.P., L.S. and R.P. reviewed and revised the paper; L.S. and R.P. made APC fund requisition. All authors have read and agreed to the published version of the manuscript.

Funding

The APC of this paper was funded by a project grant (Code 6PFE) under the scheme “Increasing the impact of excellence research on the capacity for innovation and technology transfer within USV Timisoara” Romania.

Data Availability Statement

All data are available with the paper. Additional data can be available from the corresponding author upon reasonable request.

Acknowledgments

The Principal Chief Conservator of Forests and Head of Forest Force, the Department of Forest, Environment, and Climate, and the Government of Odisha is acknowledged for providing logistic support during the field survey. The APC of this paper was supported by a project grant (Code 6PFE) under the scheme “Increasing the impact of excellence research on the capacity for innovation and technology transfer within USV Timisoara” Romania.

Conflicts of Interest

The authors declare that they have no known competing financial interest or personal relationship that could have appeared to influence the work reported in the paper.

References

  1. Magurran, A.E. Ecological Diversity and Its Measurement; Princeton University Press: Princeton, NJ, USA, 1988. [Google Scholar]
  2. Huang, X.; Lang, X.; Li, S.; Liu, W.; Su, J. Indicator selection and driving factors of ecosystem multifunctionality: Research status and Perspectives. Biodivers. Sci. 2021, 29, 1673. [Google Scholar] [CrossRef]
  3. May, R.M.; Stumpf, M.P. Species-area relations in tropical forests. Science 2000, 290, 2084–2086. [Google Scholar] [CrossRef] [PubMed]
  4. Lalfakawma; Sahoo, U.K.; Roy, S.; Vanalalhriatpuia, K.; Vanlalhluna, P.C. Community composition and tree population structure in undisturbed and disturbed tropical semievergreen forest stands of northeast India. Appl. Ecol. Environ. Res. 2009, 7, 303–318. [Google Scholar] [CrossRef]
  5. Tripathi, O.P.; Tripathi, R.S. Community composition, structure and management of subtropical vegetation of forests in Meghalaya State, northeast India. Int. J. Biodivers. Sci. Ecosyst. Serv. Manag. 2010, 6, 157–163. [Google Scholar] [CrossRef]
  6. Sagar, R.; Devy, M.S. The Impact of Anthropogenic Disturbance to the Canopy Microclimate of Tropical Forests in the Southern Western Ghats, India. Front. For. Glob. Chang. 2022, 5, 734448. [Google Scholar] [CrossRef]
  7. Barlow, J.; Lennox, G.D.; Ferreira, J.; Berenguer, E.; Lees, A.C.; Nally, R.M.; Thomson, J.R.; de Barros Ferraz, S.F.; Louzada, J.; Gardner, T.A. Anthropogenic disturbance in tropical forests can double biodiversity loss from deforestation. Nature 2016, 535, 144–147. [Google Scholar] [CrossRef]
  8. Singh, S. Low to Moderate Level Forest Disturbance Effects on Plant Functional Traits and Associated Soil Microbial Diversity in Western Himalaya. Front. For. Glob. Chang. 2021, 4, 710658. [Google Scholar] [CrossRef]
  9. Chapagain, U.; Chapagain, B.P.; Nepal, S.; Manthey, M. Impact of disturbances on species diversity and regeneration of Nepalese Sal (Shorea robusta) forests managed under different management regimes. Earth 2021, 2, 826–844. [Google Scholar] [CrossRef]
  10. Dufour-Dror, J.M. Influence of cattle grazing on the density of oak seedlings and saplings in a Tabor oak forest in Israel. Acta Oecologica 2007, 31, 223–228. [Google Scholar] [CrossRef]
  11. Thakur, U.; Sahoo, U.K.; Bisth, N.S.; Kumar, A.; Kumar, M. Regeneration potential of forest vegetation of Churdhar Wildlife Sanctuary of India: Implications for forest management. Air Water Soil Pollut. 2021, 232, 373. [Google Scholar] [CrossRef]
  12. Wassenaar, T.; Gerber, P.; Verburg, P.H.; Rosales, M.; Ibrahim, M.; Steinfeld, H. Projecting land use changes in the Neotropics: The geography of pasture expansion into forest. Glob. Environ. Chang. 2007, 17, 86–104. [Google Scholar] [CrossRef]
  13. Morris, R.J. Anthropogenic impacts on tropical forest biodiversity: A network structure and ecosystem functioning perspective. Philos. Trans. R. Soc. B Biol. Sci. 2010, 365, 3709–3718. [Google Scholar] [CrossRef] [PubMed]
  14. Caviedes, J.; Ibarra, J.T. Influence of anthropogenic disturbances on stand structural complexity in Andean temperate forests: Implications for managing key habitat for biodiversity. PLoS ONE 2017, 12, e0169450. [Google Scholar] [CrossRef] [PubMed]
  15. Gogoi, A.; Sahoo, U.K. Impact of anthropogenic disturbance on species diversity and vegetation structure of a lowland tropical rainforest of eastern Himalaya, India. J. Mt. Sci. 2018, 15, 2453–2465. [Google Scholar] [CrossRef]
  16. Bradshaw, C.J.; Sodhi, N.S.; Brook, B.W. Tropical turmoil: A biodiversity tragedy in progress. Front. Ecol. Environ. 2009, 7, 79–87. [Google Scholar] [CrossRef]
  17. Jara-Guerrero, A.; González-Sánchez, D.; Escudero, A.; Espinosa, C.I. Chronic disturbance in a tropical dry forest: Disentangling direct and indirect pathways behind the loss of plant richness. Front. For. Glob. Chang. 2021, 4, 723985. [Google Scholar] [CrossRef]
  18. Sfair, J.C.; de Bello, F.; de França, T.Q.; Baldauf, C.; Tabarelli, M. Chronic human disturbance affects plant trait distribution in a seasonally dry tropical forest. Environ. Res. Lett. 2018, 13, 025005. [Google Scholar] [CrossRef]
  19. Cielo-Filho, R.; Gneri, M.A.; Martins, F.R. Position on slope, disturbance, and tree species coexistence in a seasonal semi-deciduous forest in SE-Brazil. Plant Ecol. 2007, 190, 189–203. [Google Scholar] [CrossRef]
  20. Cardelús, C.L.; Woods, C.L.; Mekonnen, A.B.; Dexter, S.; Scull, P.; Tsegay, B.A. Human disturbance impacts the integrity of sacred church forests, Ethiopia. PLoS ONE 2019, 14, e0212430. [Google Scholar] [CrossRef]
  21. Silva, J.L.S.; Cruz-Neto, O.; Rito, K.F.; Arnan, X.; Leal, I.R.; Peres, C.A.; Tabarelli, M.; Lopes, A.V. Divergent responses of plant reproductive strategies to chronic anthropogenic disturbance and aridity in the Caatinga dry forest. Sci. Total. Environ. 2020, 704, 135240. [Google Scholar] [CrossRef]
  22. Walker, L.R. The Biology of Disturbed Habitats; Oxford University Press: Oxford, UK, 2012. [Google Scholar]
  23. Malik, Z.A.; Bhatt, A.B. Regeneration status of tree species and survival of their seedlings in Kedarnath Wildlife Sanctuary and its adjoining areas in Western Himalaya, India. Trop. Ecol. 2016, 57, 677–690. [Google Scholar]
  24. Shekhar Silori, C. Status and distribution of anthropogenic pressure in the buffer zone of Nanda Devi Biosphere Reserve in western Himalaya, India. Biodivers. Conserv. 2001, 10, 1113–1130. [Google Scholar] [CrossRef]
  25. Pokhriyal, P.; Chauhan, D.S.; Todaria, N.P. Effect of altitude and disturbance on structure and species diversity of forest vegetation in a watershed of central Himalaya. Trop. Ecol. 2012, 53, 307–315. [Google Scholar]
  26. Uniyal, P.; Pokhriyal, P.; Dasgupta, S.; Bhatt, D.; Todaria, N.P. Plant diversity in two forest types along the disturbance gradient in Dewalgarh Watershed, Garhwal Himalaya. Curr. Sci. 2010, 98, 938–943. [Google Scholar]
  27. Kumar, A.; Ram, J. Anthropogenic disturbances and plant biodiversity in forests of Uttaranchal, central Himalaya. Biodivers. Conserv. 2005, 14, 309–331. [Google Scholar] [CrossRef]
  28. Majumdar, K.; Datta, B.K. Vegetation types, dominant compositions, woody plant diversity and stand structure in Trishna wildlife sanctuary of northeast India. J. Environ. Biol. 2015, 36, 409–418. [Google Scholar]
  29. Dutta, G.; Devi, A. Plant diversity, population structure, and regeneration status in disturbed tropical forests in Assam, northeast India. J. For. Res. 2013, 24, 715–720. [Google Scholar] [CrossRef]
  30. Bhuyan, P.; Khan, M.L.; Tripathi, R.S. Tree diversity and population structure in undisturbed and human-impacted stands of tropical wet evergreen forest in Arunachal Pradesh, Eastern Himalayas, India. Biodivers. Conserv. 2003, 12, 1753–1773. [Google Scholar] [CrossRef]
  31. Gautam, M.K.; Manhas, R.K.; Tripathi, A.K. Patterns of diversity and regeneration in unmanaged moist deciduous forests in response to disturbance in Shiwalik Himalayas, India. J. Asia-Pac. Biodivers. 2016, 9, 144–151. [Google Scholar] [CrossRef]
  32. Kala, C.P. Forest structure and anthropogenic pressures in the Pachmarhi biosphere reserve of India. J. For. Res. 2015, 26, 867–874. [Google Scholar] [CrossRef]
  33. Kala, C.P.; Dubey, Y. Anthropogenic disturbances and status of forest and wildlife in the dry deciduous forests of Chhattisgarh state in India. J. For. Res. 2012, 23, 45–52. [Google Scholar] [CrossRef]
  34. Anitha, K.; Joseph, S.; Ramasamy, E.V.; Prasad, S.N. Changes in structural attributes of plant communities along disturbance gradients in a dry deciduous forest of Western Ghats, India. Environ. Monit. Assess. 2009, 155, 393–405. [Google Scholar] [CrossRef]
  35. Daniels, R.J.R.; Gadgil, M.; Joshi, N.V. Impact of human extraction on tropical humid forests in the Western Ghats Uttara Kannada, South India. J. Appl. Ecol. 1995, 32, 866–874. [Google Scholar] [CrossRef]
  36. Chittibabu, C.V.; Parthasarathy, N. Attenuated tree species diversity in human-impacted tropical evergreen forest sites at Kolli hills, Eastern Ghats, India. Biodivers. Conserv. 2000, 9, 1493–1519. [Google Scholar] [CrossRef]
  37. Sahoo, T.; Acharya, L.; Panda, P.C. Plant diversity along disturbance gradients in Tropical Moist deciduous forests of Eastern Ghats of India. Plant Arch. 2020, 20, 2007–20017. [Google Scholar]
  38. Sahoo, T.; Acharya, L.; Panda, P.C. Structure and composition of tree species in tropical moist deciduous forests of Eastern Ghats of Odisha, India, in response to human-induced disturbances. Environ. Sustain. 2020, 3, 69–82. [Google Scholar] [CrossRef]
  39. Champion, H.G.; Seth, S.K. A Revised Survey of the Forest Types of India; Natraj Publications: Dehra Dun, India, 1968. [Google Scholar]
  40. Ministry of Environment, Forest and Climate Change, Government of India, New Delhi. India State of Forest Report 2019. Available online: https://fsi.nic.in/forest-report-2021-details (accessed on 12 June 2023).
  41. Government of India, Ministry of Home Affairs. Census of India 2011. Population Census of India; Government of India, Ministry of Home Affairs: New Delhi, India, 2011. [Google Scholar]
  42. Behera, M. Non timber forest products and tribal livelihood: A case study from Kandhamal district of Orissa. Indian For. 2009, 135, 1127–1134. [Google Scholar]
  43. Chown, S.L. Temporal biodiversity change in transformed landscapes: A southern African perspective. Philos. Trans. R. Soc. B Biol. Sci. 2010, 365, 3729–3742. [Google Scholar] [CrossRef]
  44. Ishii, H.T.; Tanabe, S.I.; Hiura, T. Exploring the relationships among canopy structure, stand productivity, and biodiversity of temperate forest ecosystems. For. Sci. 2004, 50, 342–355. [Google Scholar]
  45. Clark, J.A.; Covey, K.R. Tree species richness and the logging of natural forests: A meta-analysis. For. Ecol. Manag. 2012, 276, 146–153. [Google Scholar] [CrossRef]
  46. Rao, P.; Barik, S.K.; Pandey, H.N.; Tripathi, R.S. Community composition and tree population structure in a sub-tropical broad-leaved forest along a disturbance gradient. Vegetation 1990, 88, 151–162. [Google Scholar] [CrossRef]
  47. Curtis, J.T.; Cottam, G. Plant Ecology Workbook: A Laboratory, Field and Reference Manual; Burgess Publication Company: Minneapolis, MN, USA, 1956; p. 193. [Google Scholar]
  48. Sundriyal, R.C.; Sharma, E. Anthropogenic pressure on tree structure and biomass in the temperate forest of Mamlay watershed in Sikkim. For. Ecol. Manag. 1996, 81, 113–134. [Google Scholar] [CrossRef]
  49. Shankar, U. A case of high tree diversity in a sal (Shorea robusta)-dominated lowland forest of Eastern Himalaya: Floristic composition, regeneration and conservation. Curr. Sci. 2001, 81, 776–786. [Google Scholar]
  50. Misra, R. Ecology Work Book; Oxford and IBH Publishing Company: New Delhi, India, 1968. [Google Scholar]
  51. Shannon, C.E.; Weaver, W. The Mathematical Theory of Communication; University of Illinois Press: Urbana, IL, USA, 1963; p. 117. [Google Scholar]
  52. Simpson, E.H. Measurement of diversity. Nature 1949, 163, 688. [Google Scholar] [CrossRef]
  53. Pielou, E.C. Species-diversity and pattern-diversity in the study of ecological succession. J. Theor. Biol. 1966, 10, 370–383. [Google Scholar] [CrossRef] [PubMed]
  54. Margalef, R. Perspectives in Ecological Theory; University of Chicago Press: Chicago, IL, USA, 1968; p. 111. [Google Scholar]
  55. Sorensen, T. A method of establishing groups of equal amplitude in plant sociology based on similarity of species content and its application to analyses of the vegetation on Danish commons. Biol. Skr. 1948, 5, 1–34. [Google Scholar]
  56. Kadavul, K.; Parthasarathy, N. Plant biodiversity and conservation of tropical semi-evergreen forest in the Shervarayan hills of Eastern Ghats, India. Biodivers. Conserv. 1999, 8, 419–437. [Google Scholar] [CrossRef]
  57. Saxena, H.O.; Brahmam, M. The Flora of Orissa; Orissa Forest Development Corporation Ltd: Bhubaneswar, India, 1996; Volume I–IV. [Google Scholar]
  58. Mishra, R.K.; Upadhyay, V.P.; Nayak, P.K.; Pattanaik, S.; Mohanty, R.C. Composition and stand structure of Tropical moist deciduous forest of Similipal biosphere reserve, Orissa, India. In Forest Ecosystems—More Than Just Trees; Blanco, J.A., Ed.; Intech: London, UK, 2012; pp. 106–136. ISBN 978-953-51-0202-1. [Google Scholar]
  59. Statistical Package for Social Sciences, Version 20.0; IBM SPSS Statistics: Belmont, CA, USA; Wadsworth, Australia, 2021.
  60. Anderson, M.J. Permutational Multivariate Analysis of Variance; Wiley: Hoboken, NJ, USA, 2017; pp. 1–15. [Google Scholar] [CrossRef]
  61. Magurran, A.E.; McGill, B.J. (Eds.) Biological Diversity: Frontiers in Measurement and Assessment; OUP Oxford: Oxford, UK, 2010. [Google Scholar]
  62. Sahoo, T.; Panda, P.C. Comparative assessment of structure, composition and diversity of tree species of tropical moist deciduous forests in three forest ranges of Nayagarh Forest Division, Odisha, India. Plant Sci. Res. 2015, 37, 39–48. [Google Scholar]
  63. Sahu, S.C.; Dhal, N.K.; Reddy, C.S.; Pattanaik, C.; Brahmam, M. Phytosociological study of tropical dry deciduous forest of Boudh district, Orissa, India. Res. J. For. 2007, 1, 66–72. [Google Scholar] [CrossRef]
  64. Sarmah, R. Non-timber forest products: Extraction and impact on plant community structure in and around Namdapha National Park of Arunachal Pradesh, India. Indian J. Plant Sci. 2012, 1, 192–207. [Google Scholar]
  65. Borah, N.; Athokpam, F.D.; Garkoti, S.C.; Das, A.K.; Hore, D.K. Structural and compositional variations in undisturbed and disturbed tropical forests of Bhuban hills in south Assam, India. Int. J. Biodivers. Sci. Ecosyst. Serv. Manag. 2014, 10, 9–19. [Google Scholar] [CrossRef]
  66. Dutta, G.; Devi, A. Impact of lopping on tree species of tropical Indian forests. Trop. Plant Res. 2015, 2, 1–4. [Google Scholar]
  67. Sagar, R.; Raghubanshi, A.S.; Singh, J.S. Tree species composition, dispersion and diversity along a disturbance gradient in a dry tropical forest region of India. For. Ecol. Manag. 2003, 186, 61–71. [Google Scholar] [CrossRef]
  68. Zenner, E.K.; Kabrick, J.M.; Jensen, R.G.; Peck, J.E.; Grabner, J.K. Responses of ground flora to a gradient of harvest intensity in the Missouri Ozarks. For. Ecol. Manag. 2006, 222, 326–334. [Google Scholar] [CrossRef]
  69. Jackson, S.W.; Harper, C.A.; Buckley, D.S.; Miller, B.F. Short-term effects of silvicultural treatments on microsite heterogeneity and plant diversity in mature Tennessee oak-hickory forests. North. J. Appl. For. 2006, 23, 197–203. [Google Scholar] [CrossRef]
  70. Raizada, A.; Joshi, S.P.; Srivastava, M.M. Composition and vegetational diversity in an alpine grassland in the Garhwal Himalayas. Trop. Ecol. 1998, 39, 133–141. [Google Scholar]
  71. Sagar, R.; Singh, J.S. Predominant phenotypic traits of disturbed tropical dry deciduous forest vegetation in northern India. Community Ecol. 2003, 4, 63–71. [Google Scholar] [CrossRef]
  72. Sunil, C.; Somashekar, R.K.; Nagaraja, B.C. Impact of anthropogenic disturbances on riparian forest ecology and ecosystem services in Southern India. Int. J. Biodivers. Sci. Ecosyst. Serv. Manag. 2011, 7, 273–282. [Google Scholar] [CrossRef]
  73. Ngoc Le, D.T.; Van Thinh, N.; Mitlöhner, R. Effect of disturbance regimes on spatial patterns of tree species in three sites in a tropical evergreen forest in Vietnam. Int. J. For. Res. 2016, 2016, 4903749. [Google Scholar] [CrossRef]
  74. Kumar, A.; Kumar, A.; Adhikari, D.; Gudasalamani, R.; Saikia, P.; Khan, M.L. Ecological niche modeling for assessing potential distribution of Pterocarpus marsupium Roxb. In Ranchi, eastern India. Ecol. Res. 2020, 35, 1095–1105. [Google Scholar] [CrossRef]
  75. Khanal, S.; Timilsina, R.; Behroozian, M.; Peterson, A.T.; Poudel, M.; Alwar, M.S.S.; Wijewickrama, T.; Osorio-Olvera, L. Potential impact of climate change on the distribution and conservation status of Pterocarpus marsupium, a Near Threatened South Asian medicinal tree species. Ecol. Inform. 2022, 70, 101722. [Google Scholar] [CrossRef]
  76. Buragohain, M.K.; Dar, A.A.; Babu, K.N.; Parthasarathy, N. Tree community structure, carbon stocks and regeneration status of disturbed lowland tropical rain forests of Assam, India. Trees For. People 2023, 11, 100371. [Google Scholar] [CrossRef]
  77. Sharma, A.; Patel, S.K.; Singh, G.S. Variation in Species Composition, Structural Diversity, and Regeneration Along Disturbances in Tropical Dry Forest of Northern India. J. Asia-Pac. Biodivers. 2023, 16, 83–95. [Google Scholar] [CrossRef]
  78. Nayak, S.; Sahoo, U.K. Tree diversity and ecological status of Madhuaca latifolia (Roxb.) JF Macbr. in forests of Odisha. Ind. J. Ecol. 2020, 47, 138–149. [Google Scholar]
  79. Sahoo, U.K.; Lalfakawma. Population dynamics of Schima wallichii in an undisturbed vs. disturbed forest stand of northeast India. Int. J. Ecol. Environ. Sci. 2010, 36, 157–165. [Google Scholar]
  80. Joshi, V.C.; Bisht, D.; Sundriyal, R.C.; Pant, H. Species richness, diversity, structure, and distribution patterns across dominating forest communities of low and mid-hills in the Central Himalaya. Geol. Ecol. Landsc. 2022, 10, 1–11. [Google Scholar] [CrossRef]
  81. Nath, P.C.; Arunachalam, A.; Khan, M.L.; Arunachalam, K.; Barbhuiya, A.R. Vegetation analysis and tree population structure of tropical wet evergreen forests in and around Namdapha National Park, northeast India. Biodivers. Conserv. 2005, 14, 2109–2135. [Google Scholar] [CrossRef]
  82. Sahoo, T.; Panda, P.C.; Acharya, L. Structure, composition and diversity of tree species in tropical moist deciduous forests of Eastern India: A case study of Nayagarh Forest Division, Odisha. J. For. Res. 2017, 28, 1219–1230. [Google Scholar] [CrossRef]
  83. Opuni-Frimpong, E.; Gabienu, E.; Adusu, D.; Opuni-Frimpong, N.Y.; Damptey, F.G. Plant diversity, conservation significance, and community structure of two protected areas under different governance. Trees For. People 2021, 4, 100082. [Google Scholar] [CrossRef]
  84. Lolila, N.J.; Shirima, D.D.; Mauya, E.W. Tree species composition along environmental and disturbance gradients in tropical sub-montane forests, Tanzania. PLoS ONE 2023, 18, e0282528. [Google Scholar] [CrossRef]
  85. Pande, R.; Bargali, K.; Pande, N. Impacts of disturbance on the population structure and regeneration status of tree species in a Central Himalayan Mixed-Oak Forest, India. Taiwan J. For. Sci. 2014, 29, 179–192. [Google Scholar]
  86. Ben-Said, M. Spatial point-pattern analysis as a powerful tool in identifying pattern-process relationships in plant ecology: An updated review. Ecol. Process. 2021, 10, 56. [Google Scholar] [CrossRef]
  87. Odum, E.P. Fundamentals of Ecology; W. B. Saunders: Philadelphia, PA, USA, 1971; p. 574. [Google Scholar]
  88. Devi, L.S.; Yadava, P.S. Floristic diversity assessment and vegetation analysis of tropical semievergreen forest of Manipur, northeast India. Trop. Ecol. 2006, 47, 89–98. [Google Scholar]
  89. Malik, Z.A.; Pandey, R.; Bhatt, A.B. Anthropogenic disturbances and their impact on vegetation in Western Himalaya, India. J. Mt. Sci. 2016, 13, 69–82. [Google Scholar] [CrossRef]
  90. Khaine, I.; Woo, S.Y.; Kwak, M.; Lee, S.H.; Je, S.M.; You, H.; Lee, T.; Jang, J.; Lee, H.K.; Cheng, H.C.; et al. Factors affecting natural regeneration of tropical forests across a precipitation gradient in Myanmar. Forests 2018, 9, 143. [Google Scholar] [CrossRef]
  91. Hérault, B.; Piponiot, C. Key drivers of ecosystem recovery after disturbance in a neotropical forest. For. Ecosyst. 2018, 5, 2. [Google Scholar] [CrossRef]
  92. Sapkota, I.P.; Tigabu, M.; Odén, P.C. Spatial distribution, advanced regeneration and stand structure of Nepalese Sal (Shorea robusta) forests subject to disturbances of different intensities. For. Ecol. Manag. 2009, 257, 1966–1975. [Google Scholar] [CrossRef]
  93. Pandey, S.K.; Shukla, R.P. Regeneration strategy and plant diversity status in degraded sal forests. Curr. Sci. 2001, 81, 95–102. [Google Scholar]
  94. Davidar, P.; Munoz, F.; Puyravaud, J.P.; Mohandass, D.; Ramachandran, V.S. Multiple facets of rarity among rain forest trees in the Western Ghats of India. Biol. Conserv. 2018, 228, 110–119. [Google Scholar] [CrossRef]
  95. Hubbell, S.P.; Foster, R.B. Diversity of canopy trees in a neotropical forest and implications for conservation. In The Tropical Rain Forest: Ecology and Management; Sutton, S.L., Whitmore, T.C., Chadwick, A., Eds.; Blackwell Scientific: Oxford, UK, 1983; pp. 25–41. [Google Scholar]
Figure 1. Map of Phulbani Forest division showing location of sampling spots in three forest types (Pure Sal, Sal-Dominated Moist Deciduous, and Moist Deciduous Forest without Sal) within the tropical moist deciduous forests, Eastern Ghats, India.
Forests 14 01931 g001
Figure 2. (A). Pure Sal Forest (PSF), (B) Sal-Dominated Moist Deciduous Forest (SDMDF), (C) Moist Deciduous Forest Without Sal (MDFWS), (D) Moderately Disturbed Moist deciduous Forest Without Sal (MDFWS-MD).
Forests 14 01931 g002
Figure 3. Bray–Curtis similarity index of tree species along disturbance gradients in selected forest types of Eastern Ghats, India. PSF—Pure Sal Forest, SDMDF—Sal-Dominated Moist Deciduous Forest, MDFWS—Moist Deciduous Forest Without Sal, UD—Undisturbed, LD—Low disturbed, MD—Moderately disturbed.
Forests 14 01931 g003
Figure 4. Rank abundance curve of trees in three selected forest types of Eastern Ghats, India. PSF—Pure sal forest, SDMDF—Sal-dominated moist deciduous forest, MDFWS—Moist deciduous forest without sal, UD—Undisturbed, LD—Low disturbed, MD—Moderately disturbed.
Forests 14 01931 g004
Figure 5. Distribution of density (A) and basal area (B) in various diameter classes along disturbance gradient in selected forest types of Eastern Ghats, India.
Forests 14 01931 g005
Figure 6. Variation in tree species richness among different diameter classes in selected forest types of Eastern Ghats, India.
Forests 14 01931 g006
Table 1. Relative scoring of human-centric disturbing elements (total disturbance factor ≤10% undisturbed, 11%–40% low, 41%–70% moderate, and ≥71% high) in tropical moist deciduous forests, Eastern Ghats, India.
Disturbance
Source
Relative Score (%)Impact on Different Forest Types
PSFSDMDFMDFWS
MDLDUDMDLDUDMDUD
Forest road≤1 road—1, 2–4 road—2, ≥5 roads—323133031
Distance from human settlement≤3.0 km—3, 4–7 km—2, ≥8.0 km—132132131
Forest fire
(previous year)
Surface fire—1, Ground fire—2, crown fire—311111111
Grazing intensity≤50 cattle units/day—1, 51–100 cattle units/day—2, ≥101 cattle units/day—332032030
NTFP collection≤5 items—1, 6–9 items—2, ≥10 items—321121121
Fuel wood collection2–3 months—1, 4–5 months—2, >5 months—332132030
Wild animal≤5 spots—1, 6–9 spots—2, ≥10 spots—311310212
Canopy cover
(densitometer-based)
≥70%—1, 40–70%—2, <40%—322122121
Tree stump-based disturbance factorSDI 46.522.25043.024.25249.751
Total disturbance factor63.536.259.061.0037.258.067.758.0
PSF—Pure Sal Forest, SDMDF—Sal-Dominated Moist Deciduous Forest, MDFWS—Moist Deciduous Forest Without Sal. Sampling area: 2.0 ha in each category totaling 16.0 ha.
Table 2. Family-wise distribution of genera, species, and density of trees (having DBH >10 cm) in the three selected forest communities.
FamilyPure Sal ForestSal-Dominated Moist
Deciduous Forest
Moist Deciduous Forest without Sal
UDLDMDUDLDMDUDMD
G(S)DG(S)DG(S)DG(S)DG(S)DG(S)DG(S)DG(S)D
Anacardiaceae2(2)233(3)332(2)203(3)703(3)604(4)554(4)533(3)88
Bignoniaceae------ - ---1(1)31(1)8
Burseraceae1(1)23----1(1)13 ---1(1)381(1)20
Combretaceae1(1)31(1)301(1)82(3)552(2)582(2)333(5)1342(4)149
Dipterocarpaceae1(1)4181(1)4132(2)4432(2)2562(2)2782(2)1601(1)101(1)13
Ebenaceae1(1)151(1)5--1(1)212(2)25- 1(2)451(1)35
Fabaceae2(2)402(2)25--2(3)563(3)48--6(8)1296(6)112
Lecythidaceae1(1)31(1)5--1(1)201(1)131(1)81(1)151(1)3
Loganiaceae------ - ---1(1)101(2)10
Lythraceae----1(1)81(1)111(1)28--1(2)211(1)10
Malvaceae------1(1)20 -1(1)74(4)582(2)20
Moraceae------ -1(1)15--1(1)51(1)8
Myrtaceae1(1)15----1(1)20 -1(1)181(2)48--
Oleaceae------2(2)31 ---2(2)281(1)8
Phyllanthaceae2(2)501(1)101(1)83(3)833(3)703(3)683(3)1262(2)68
Rubiaceae------4(4)34 -1(1)252(2)433(3)56
Rutaceae------ - ---1(1)32(2)8
Sapindaceae 1(1)5 -1(1)131(1)181(1)381(1)33
Sapotaceae1(1)38----1(1)241(1)201(1)171(1)81(1)13
Sterculiaceae------------1(1)15--
Dilleniaceae------1(1)11--1(1)18--1(1)8
Lamiaceae--------------1(1)3
Euphorbiaceae----------2(2)45----
Ulmaceae----------1(1)5----
Total13(13)62810(10)5218(8)49226(28)72520(20)62821(21)47737(44)83033(36)673
G—Number of genera, S—Number of Species, D—Density of individuals per hectare, MD—Moderately disturbed, LD—Low disturbed, UD—Undisturbed.
Table 3. Species richness, density, basal area, and diversity of tree, shrub, and herb layer along disturbance gradient in three selected forest types of Eastern Ghats, India.
Vegetation AttributesGrowth Form Pure Sal ForestSal-Dominated Moist
Deciduous Forest
Moist Deciduous
Forest without Sal
Total
(All
Sites)
UDLDMDUDLDMDUDMD
No. of SpeciesTree 13108282021443661
Shrub241717242218221940
Herb 252734253335454960
No. of Family Tree 1076151113202024
Shrub161514181713171423
Herb 182225182223272830
No. of GeneraTree 13108261821373351
Shrub221717232217221835
Herb 252232183333454957
Density
(Ind. ha−1)
Tree
Mature625520490756600473825663619
Sapling11759437281070963730748615872
Seedling184,37598,12559,375204,375102,50062,500159,375112,500122,891
Shrub7400840012,100630010,90013,350645012,2009638
Herb 92,500112,500235,00075,000115,000223,125112,500185,000143,828
Basal area
(m−2 ha−1)
Tree
Mature30.1218.8216.6621.6920.1311.6832.0622.2621.68
Sapling3.272.882.174.973.062.755.942.253.41
Shrub6.807.248.855.987.4910.146.5811.688.10
Margalef’s species richness indexTree 5.072.061.335.155.413.827.245.747.05
Shrub4.754.092.924.553.902.864.534.023.47
Herb 4.805.015.235.015.245.788.478.444.23
Shannon–Weiner diversity indexTree 1.551.060.712.672.622.373.633.302.92
Shrub3.032.682.522.982.862.272.912.693.21
Herb 2.993.203.422.983.343.413.733.763.87
Simpson’s dominance indexTree 0.400.590.710.150.180.120.030.040.15
Shrub0.050.080.110.060.060.160.060.090.06
Herb 0.060.040.030.060.030.370.020.030.03
Pielou’s evenness indexTree 0.460.430.340.760.860.870.970.940.71
Shrub0.960.870.890.950.930.800.930.860.87
Herb 0.930.970.980.980.970.950.980.960.94
Table 4. Effects of human-induced disturbing forces on quantitative attributes of vegetation such as number of species, basal area, density, and diversity indices in PSF, SDMDF, and MDFWS of Eastern Ghats, India (PERMANOVA test results are significant at 0.05 level).
ParameterFR2p
Tree Number of species30.7540.8720.001
Basal area16.3940.7840.001
Density 41.6270.9020.002
Margalef’s species richness index23.6420.8400.001
Shannon–Weiner diversity index22.2410.8320.001
Simpson’s dominance index26.6710.8560.001
Pielou’s evenness index11.2420.6020.001
ShrubNumber of species20.7030.6630.001
Basal area8.3640.4430.001
Density 8.6720.4520.001
Margalef’s species richness index24.0050.6950.002
Shannon–Weiner diversity index27.9450.7270.001
Simpson’s dominance index35.7490.7730.005
Pielou’s evenness index36.6670.7780.001
Herb Number of species97.1250.9560.001
Density 65.0660.9360.001
Margalef’s species richness index95.720.9630.001
Shannon–Weiner diversity index53.340.9710.001
Simpson’s dominance index17.4180.7940.001
Pielou’s evenness index16.4140.7850.008
Table 5. Sorensen’s similarity index of plants in three forest types along disturbance gradient in selected forest types of Eastern Ghats, India.
Forest TypeDisturbance LevelTreeShrubHerb
Pure Sal ForestUD vs. MD47.6253.6640.68
LD vs. MD55.5682.3545.90
UD vs. LD78.2658.5453.85
Sal-Dominated Moist Deciduous ForestUD vs. MD51.0661.9066.67
LD vs. MD58.5480.0066.67
UD vs. LD60.8778.2658.62
Moist Deciduous Forest Without SalUD vs. MD80.0078.0578.72
MD—Moderately disturbed, LD—Low disturbed, UD—Undisturbed.
Table 6. Rarity of tree species based on number of individuals in the selected forest types of Eastern Ghats, India. The value indicates the number of species under a particular category.
Species CategoryPure Sal ForestSal-Dominated Moist
Deciduous Forest
Moist Deciduous
Forest without Sal
UDLDMDUDLDMDUDMD
Very Rare
(<2 ind./ha)
--------
Rare
(2–10 ind./ha)
-15236313
Common
(10–20 ind./ha)
87111811218
Dominant
(20–50 ind./ha)
41113832015
Pre-dominant
(>50 ind./ha)
111211--
Total131082820214436
MD—Moderately disturbed, LD—Low disturbed, UD—Undisturbed.
Table 7. Distribution patterns of plants in the three selected forest types (values are percentages of total number of individuals).
Forest Type Disturbance
Level
Distribution
Pattern
ContagiousRandomRegular
Pure Sal ForestUDTree61.5423.0815.38
Shrub70.8325.004.17
Herb64.0036.00-
LDTree40.0040.0020.00
Shrub52.9435.2911.76
Herb70.3729.630.00
MDTree12.5037.5050.00
Shrub47.0617.6535.29
Herb58.8241.18-
Sal-Dominated Moist
Deciduous Forest
UDTree67.8625.007.14
Shrub70.8329.17-
Herb66.6730.952.38
LDTree30.0055.0015.00
Shrub63.6427.279.09
Herb76.4723.53-
MDTree19.0552.3828.57
Shrub50.0044.445.56
Herb81.8218.18-
Moist Deciduous
Forest Without Sal
UDTree90.919.9-
Shrub68.3231.82-
Herb77.7822.22-
MDTree77.7813.898.33
Shrub53.3343.333.34
Herb73.4724.492.04
MD—Moderately disturbed, LD—Low disturbed, UD—Undisturbed.
Table 8. Regeneration status of trees (number of species) in selected forest types of Eastern Ghats, India.
Regeneration StatusPure Sal ForestSal-Dominated Moist
Deciduous Forest
Moist Deciduous
Forest without Sal
UDLDMDUDLDMDUDMD
Good 116412531310
Fair2211514102617
Poor00010234
None02301625
New arrival 2718211510231017
Total4028294335445453
MD—Moderately disturbed, LD—Low disturbed, UD—Undisturbed.
Disclaimer/Publisher’s Note: The statements, opinions and data contained in all publications are solely those of the individual author(s) and contributor(s) and not of MDPI and/or the editor(s). MDPI and/or the editor(s) disclaim responsibility for any injury to people or property resulting from any ideas, methods, instructions or products referred to in the content.

