Article

Ecosystem Functioning of the Loess Plateau in China from Vegetation Restoration Relied Largely on Climate

1
National Hulunber Grassland Ecosystem Observation and Research Station, Institute of Agricultural Resources and Regional Planning, Chinese Academy of Agricultural Sciences, Beijing 100081, China
2
School of Life Science, Shanxi University, Taiyuan 030006, China
3
Forestry College, Fujian Agriculture and Forestry University, Fuzhou 350002, China
4
Institute of Loess Plateau, Shanxi University, Taiyuan 030006, China
5
School of Ecology and Environment, Inner Mongolia University, Hohhot 010021, China
*
Authors to whom correspondence should be addressed.
Forests 2023, 14(1), 27; https://doi.org/10.3390/f14010027
Submission received: 29 November 2022 / Revised: 17 December 2022 / Accepted: 20 December 2022 / Published: 23 December 2022
(This article belongs to the Special Issue Ecosystem Degradation and Restoration: From Assessment to Practice)

Abstract

:
Climate change and anthropogenic replantation are supposed to greatly change vegetation coverage and ecosystem stability and functions, e.g., net primary productivity (NPP), evapotranspiration (ET) and water use efficiency (WUE). Our study compared WUE of nature- and human-induced forest cover increase on the Loess Plateau since 2000 using satellite-derived Vegetation Continuous Fields (VCF), NPP, ET. This study also applied over 30 years of model-based NPP and meteorological observations to compare the stability and changes brought up by the Grain for Green Project. The result showed that the average forest coverage fraction increased from 7.1% (~4.5 × 10⁴ km2) in 2000 to 11.2% (~7.3 × 10⁴ km2) in 2014. Artificial forest cover increase occupied 76.43% of the significantly increasing tree cover regions. The role of revegetation practice in NPP and ET became gradually more dominant than climate factors in artificial forests from the northern to the southern part of the Loess Plateau. For areas experiencing limited forest coverage increase, artificial forest areas showed higher WUE than natural forest areas under similar mean annual precipitation (MAP). The difference in stability was small between neighboring natural and artificial forest areas. The northwest of the Loess Plateau had an increasing resilience, whereas the south of the Plateau had an increased resistance to precipitation and temperature change. The higher dependency of the northern reforested areas on climate fluctuation indicates a growing threat of water scarcity to the sustainability of anthropogenic reforestation in semi-arid regions.

1. Introduction

Reforestation has been implemented worldwide in sparsely vegetated regions to alleviate soil erosion, salinization, and sandstorm and to restore ecosystem services. As the world’s largest carbon emitter, China had made a pledge to become carbon neutral before 2060 [1], which required the development of not only clean energy systems to rein in but also net carbon sinks (e.g., through ecological restoration) to efficiently offset anthropogenic carbon emissions (e.g., CO2 and other greenhouse gases, GHG). To restore ecosystem functions and enhance terrestrial carbon sink, large reforestation programs (e.g., the Three-North Shelterbelt Program (TNSP) and the Grain for Green Project (GFG)) were launched to replace former cropland and uncultivated land with artificial forest plantations since 1999 nationwide, including the Loess Plateau, the largest eroded area with the highest sediment concentration in the world [2] that suffered from sandstorms, limited and uneven rainfall distribution, drought, desertification and landscape fragmentation [3,4,5]. As a consequence of these restoration projects, China has undergone a dramatic increase in planted forest area (from 0.53 × 10⁸ ha (5.6%) to 0.79 × 10⁸ ha (8.3%)) and timber volume (from 15.05 × 10⁸ m3 to 33.88 × 10⁸ m3) between 1999–2003 and 2014–2018 [6]. However, given the complex geographical and climatic conditions, the recovery of forest coverage on the Loess Plateau exhibited a dramatic spatiotemporal variation that was influenced by the combined effects of climate factors and anthropogenic reforestation [7,8,9,10]. Meanwhile, the natural forest was predicted to expand due to climatic conditions and CO2 fertilization [11]. These changes in forest cover could potentially cause even greater divergences of the carbon and water cycling across the Plateau, yet the balance of carbon sequestration and water loss in climate-induced and artificial forested areas has received little attention [12,13,14,15].
Hydrological cycling changed accompanied by increasing forest coverage and ecosystem productivity on the Loess Plateau since the implementation of GFG, which would influence ecosystem water use efficiency (WUE, the ratio of net primary productivity (NPP) to evapotranspiration (ET)), as the result of climate change and artificial reforestation programs [16,17,18]. NPP and ET are vital ecological components and the most commonly used criteria to measure increments in biomass and water loss, with quotient WUE evaluating their balances under climatic and anthropogenic influences [19,20]. The vegetation coverage in the Plateau was 58.6% in 2015, leading to an annual increase of NPP by 9.3 ± 1.3 g C m−2 yr−1 and ET by 4.3 ± 1.7 mm yr−2 in the 2000s [8,21]. The temporal trend of NPP was significantly positive, where mean annual precipitation (MAP) was above 300 mm on the Loess Plateau in the 2000s [22], whereas ET and annul runoff were usually closely related to forest cover change in water-limited watersheds [23]. Besides, forest transpiration usually exceeds that of other vegetation types, e.g., native grassland [24]. Consequently, WUE varies with different regions, seasonality, and land-use types on the Loess Plateau. Due to the interactive effect of climate change and anthropogenic replantation, averaged WUE of the whole Plateau showed a significantly increasing trend with vegetation cover change, while the magnitude and regulators of WUE change were poorly investigated and varied spatially [21].
The climate-induced vegetation recovery in arid and semi-arid areas mainly depends on climate variability under natural circumstances, especially precipitation, which is different from artificial reforestation. This difference forms the basis of the residual trends method that distinguishes climate (mainly by precipitation, P) and non-climate effect (e.g., artificial reforestation) on vegetation growth, thus has been widely applied in identifying natural and artificial vegetation cover change in dryland using satellite-based data [25,26,27,28,29]. The water and carbon cycling of both artificial and natural forests is under the control of changing climate and frequent extreme climate events on the Loess Plateau. Increasing precipitation stimulated NPP by accelerating photosynthesis and carbon storage needed for cambium at local scales [30]. However, the drying trend challenged the phenology, water balance and WUE in the ecologically fragile area [23,31,32,33]. Uncertainty in regional water balance exists in that the northern reforested area in Loess Plateau is not only experiencing a warming, drying trend from 1960–2014 [33,34] but is also threatened by greater potential ET than predicted P input over the 21st century [35]. Moreover, the western Loess Plateau has been experiencing an extended growing season featured by an advanced start and delayed end [36], which, on the one hand, would promote NPP by prolonging the vegetation growing period in spring and autumn, on the other hand, suppress vegetation growth by accelerating ET and aggravating soil water deficiency.
However, the intense demand for water in large-scale reforestation and agriculture imposed heavy pressure on this water-limited area and was a great threat to ecological sustainability [3]. Local precipitation is fundamental to soil water that directly regulates vegetation growth rate [13]. Compared with a gradual natural forest recovery induced by rising precipitation input, there is a growing concern that rapid artificial afforestation and reforestation would intensify water scarcity due to enhanced ET, thus aggravating soil desiccation and water shortage in husbandry, agriculture, and residential use in semi-arid areas [3,37]. The decline of water yield and soil moisture of surface and deep layers was proved by many researchers as artificial forests accelerated canopy interception and transpiration that exceeded the water consumption of native species [38,39,40]. Hence, it addressed the importance of selecting appropriate species for reforestation that utilize less water in the Loess Plateau [41]. Contrarily, some studies suggested that afforestation promoted soil water infiltration to groundwater and impeded evaporation of water loss via dense canopy shadow [42]. Maintaining sustainable vegetation growth without damaging the water supply becomes a major concern in reforestation programs. However, the consensus of WUE and carbon sequestration ability for artificial forest and natural forest recovery in the world’s largest reforested region remains poorly investigated at large spatial scales yet. It is essential to evaluate the extent of forest cover change and water-carbon cycling relying on environmental change (e.g., water availability) and artificial forest for sustainable forestry development in the water-limited Loess Plateau.
Evaluating vegetation stability in changing environment is a major concern for sustainable vegetation growth and tree coverage increase in ecologically fragile areas. Stability is meant to evaluate the speed that an ecosystem recovers from perturbations and its ability to resist changes without stateshift, namely, resilience and resistance [43]. It is acknowledged that forest has lower resilience than grass ecosystem because of a more complicated structure and long succession time to establish. A study of forest stability found that resilience and resistance are influenced by woody species taxonomy, hydraulic traits, drought intensity and management regimes [44,45]. Disturbances are more likely to happen in the future and cause a massive impact on forest ecosystems. The most common disturbances influencing both artificial and natural forest sustainability are droughts and periodic warming. Anthropogenic management can impose a strong effect on vegetation production in favor of human interests, leading to a different response to disturbances. However, little was known about whether a difference exists in forest stability between artificial forests and artificial forests and how it changes over time and space with the implementation of reforestation. To better preserve the fragile ecological and reforested areas, it is necessary to assess the resilience and resistance of forest recovery across the Loess Plateau.
This study applied satellite-derived Vegetation Continuous Fields (VCF) tree cover, NPP, ET, as well as meteorological observations to (1) distinguish climatically-sensitive and anthropogenic-driven influences for enhancing carbon sequestration and water use in Loess Plateau, (2) make an assessment of stability across the Loess Plateau over long time series.

2. Materials and Methods
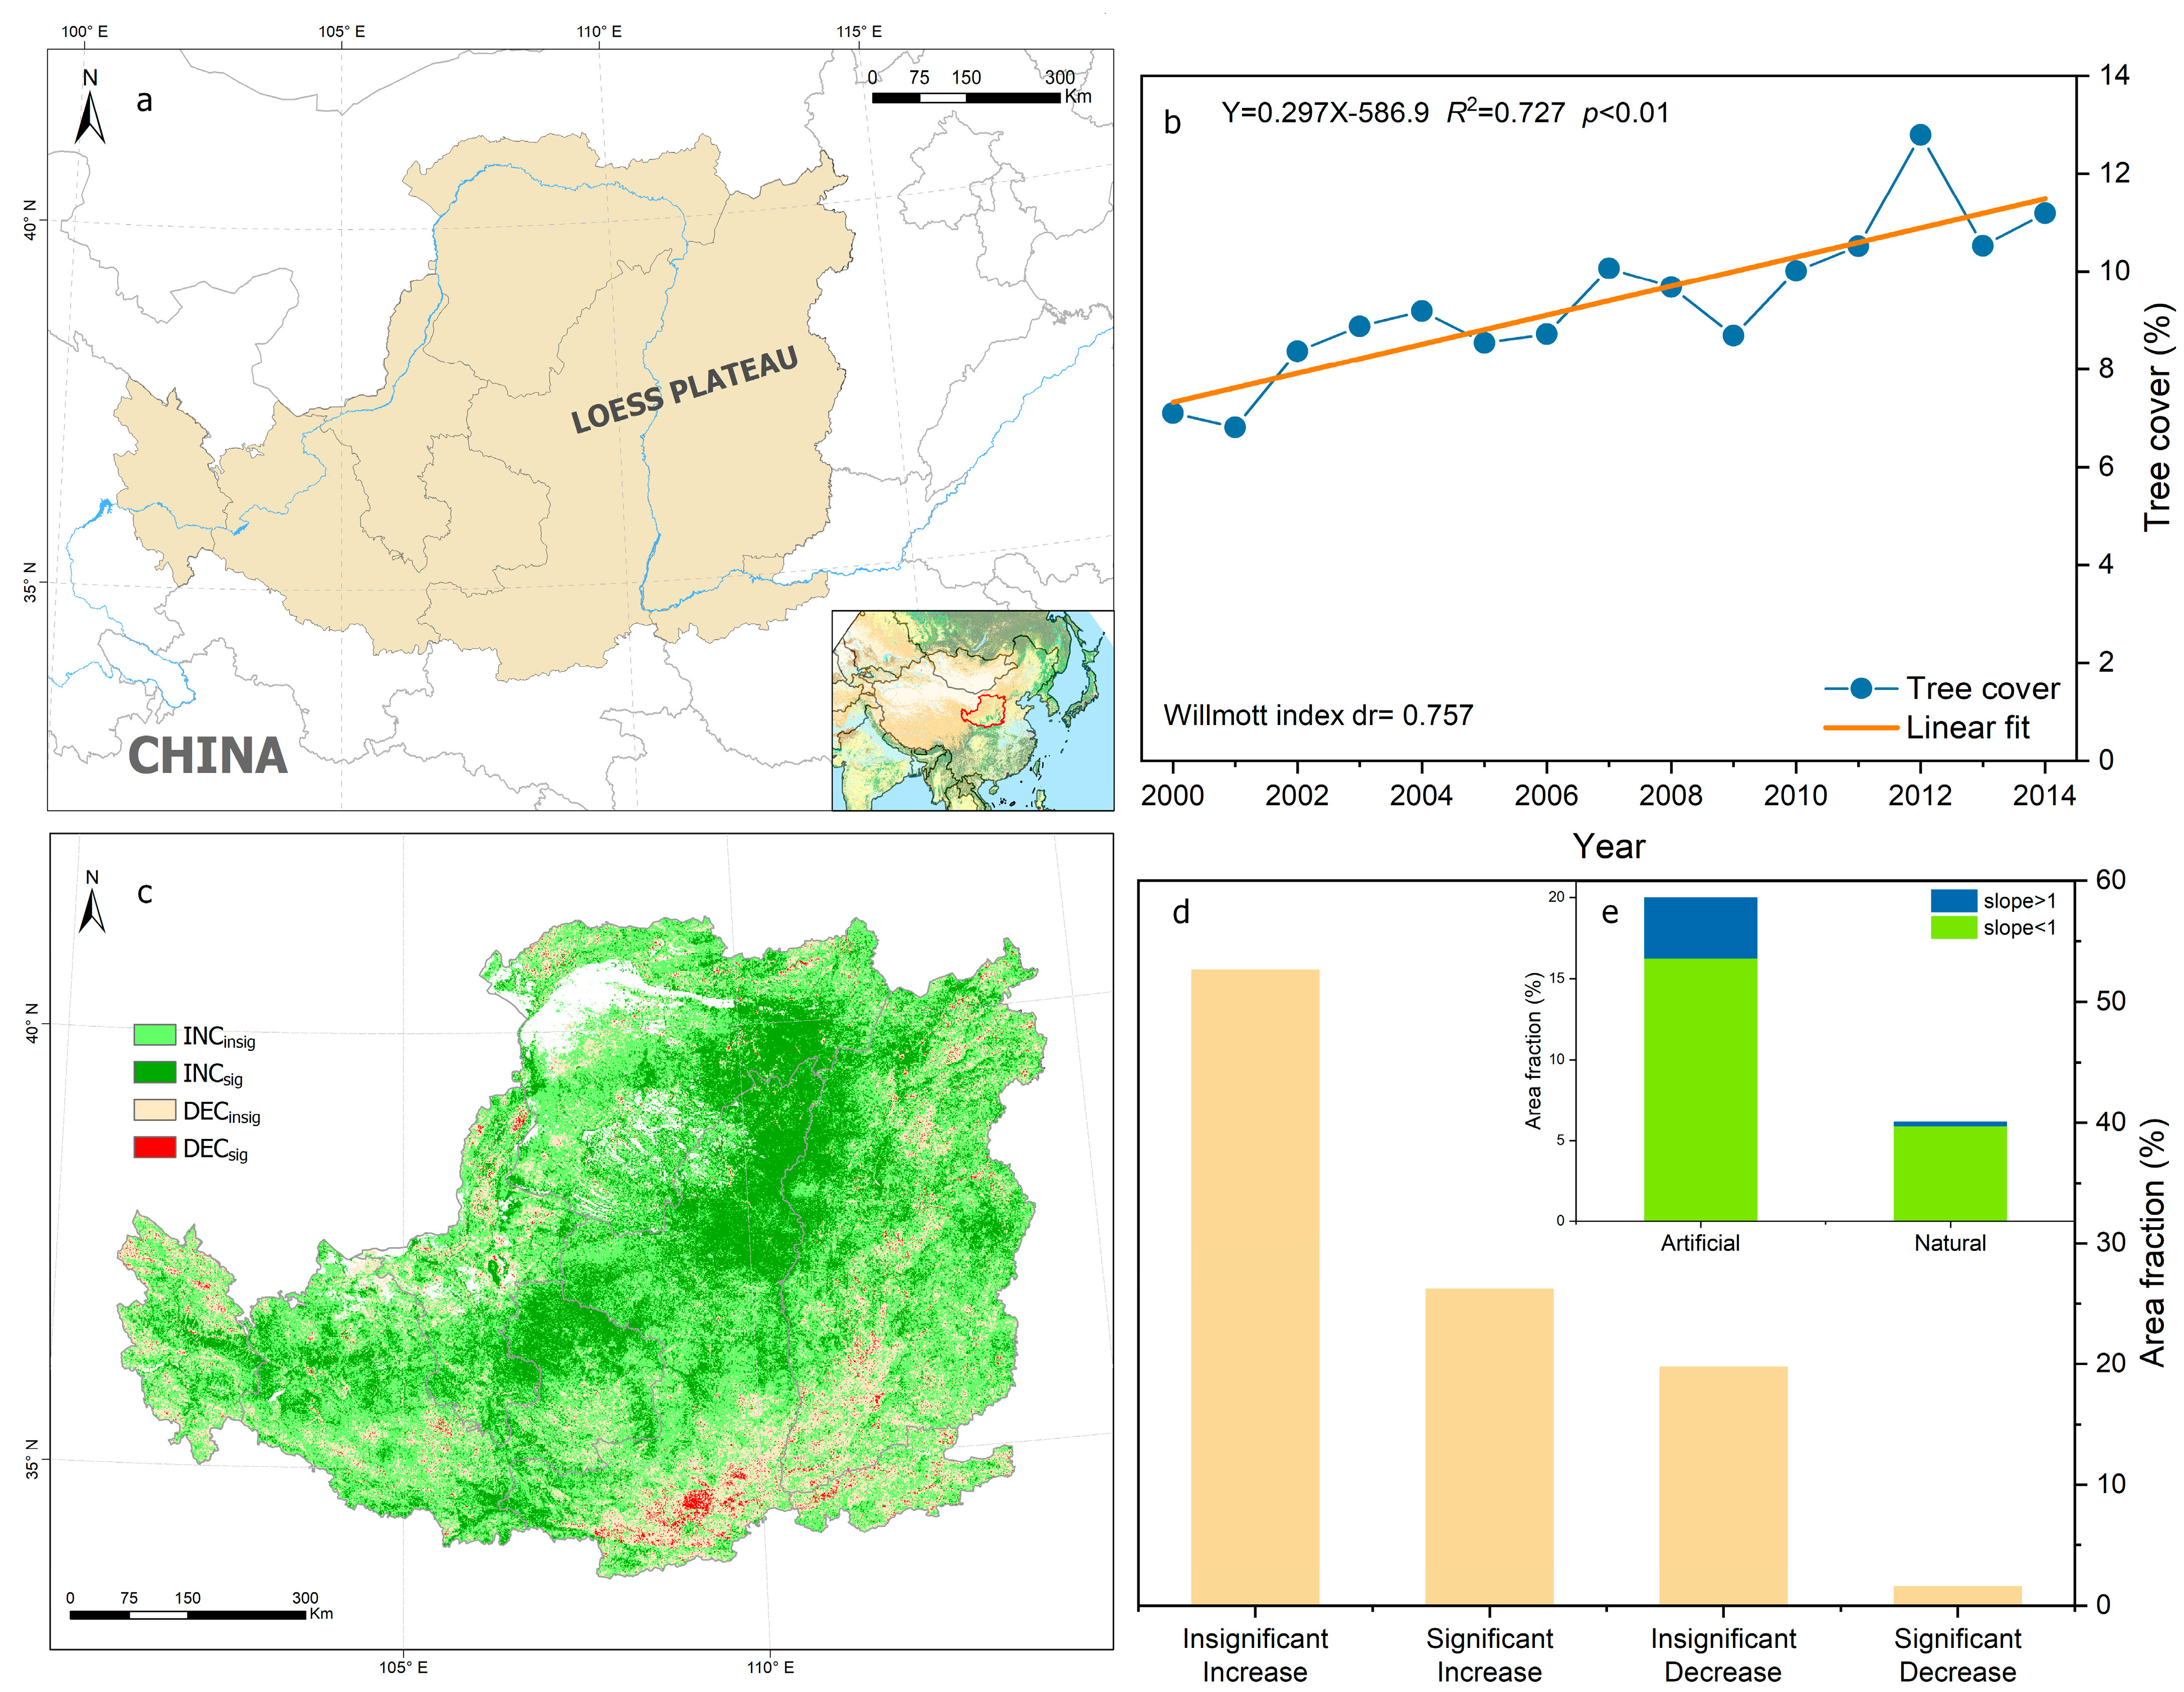
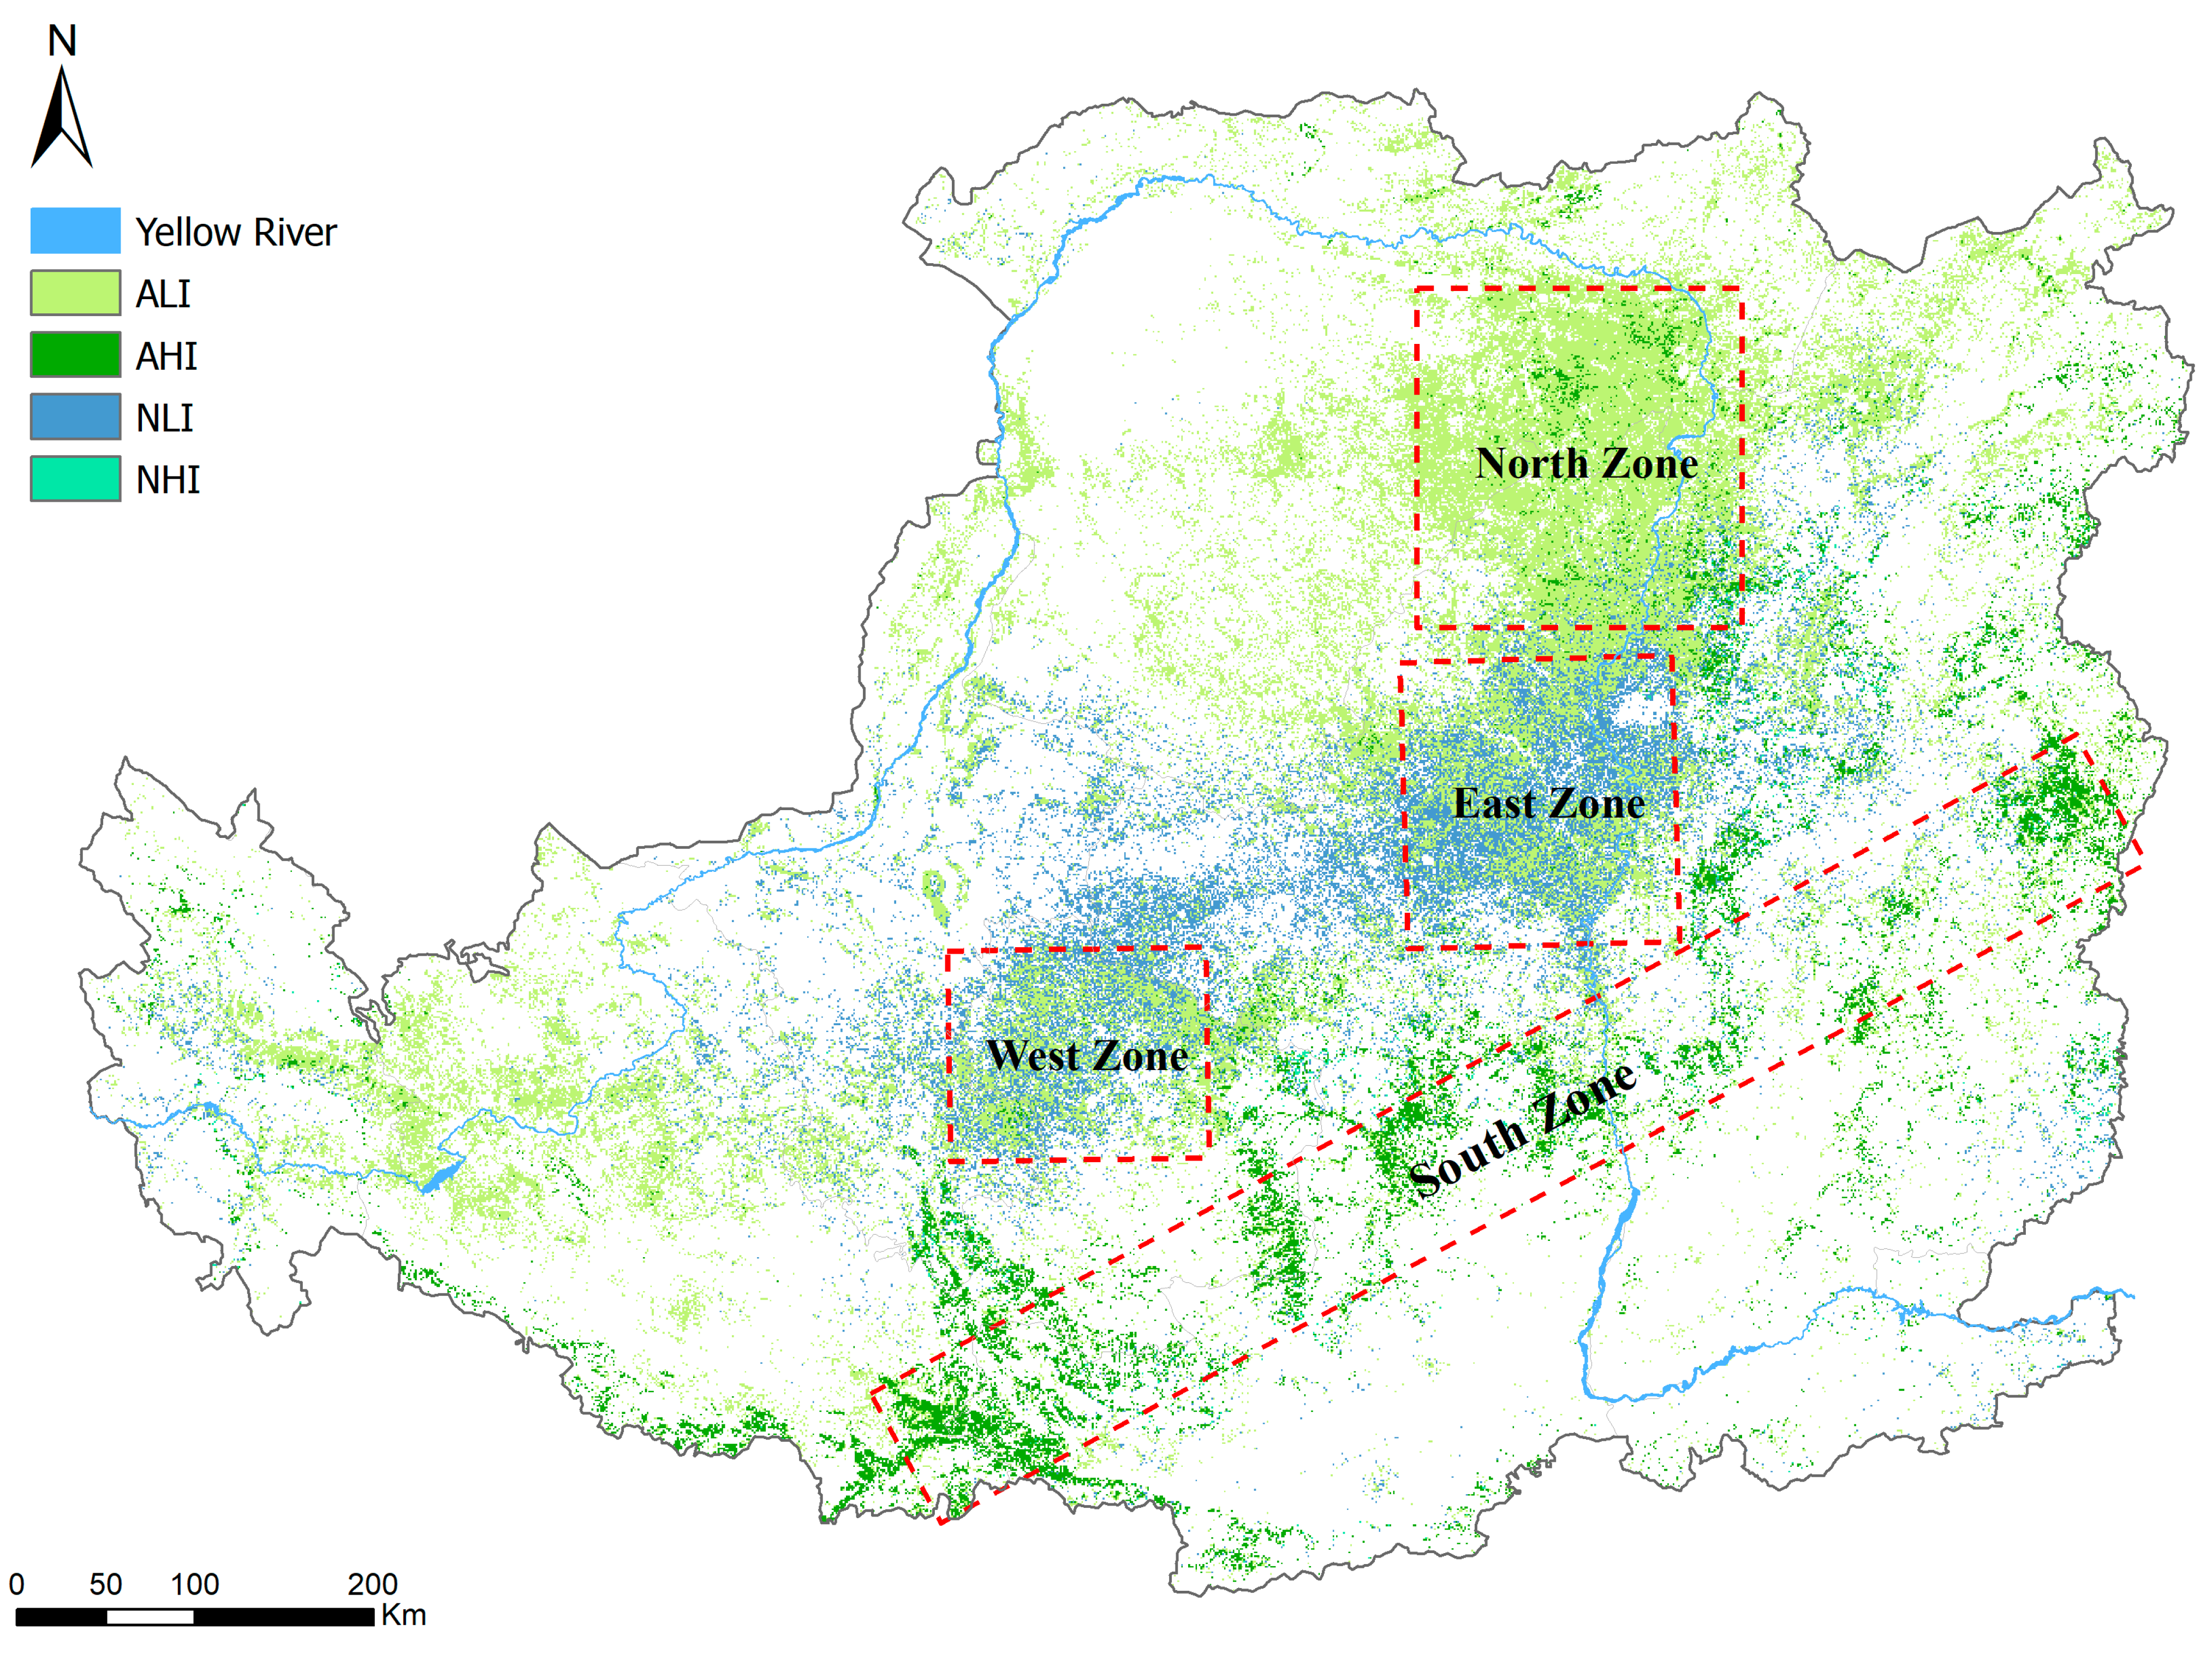
2.1. Study Area

The Loess Plateau is a large loess-distribution highland in the mid-reach of the Yellow River, Northern China (100°54′–114°33′ E, 33°43′–41°16′ N) (Figure 1). It covers an area of 6.4 × 10⁵ km2 and has an arid to semi-humid climate with mean annual temperature (MAT) ranging from 4.3 °C to 14.3 °C and MAP of 110 mm to 800 mm from northwest to southeast [31,46,47]. The Loess Plateau is composed of 7 provinces, including the entirety of Ningxia, Shanxi, part of Shaanxi, Gansu, Henan, Inner Mongolia, and Qinghai. The spatially decreasing precipitation trend strongly affected the distribution of vegetation types, with areas of forests, croplands and grasslands occupying 15%, 32% and 42% of the Plateau in 2010, respectively [33]. As the implementation of GFG, large farmland and barren land has been reforested by trees (e.g., Robinia pseudoacacia, Populus simonii, Tamarix chinensis and Pinus tabulaeformis), shrubs (e.g., Caragana korshinskii) or grass (e.g., Medicago sativa) [48], thus increasing total afforested areas by over 3.8 × 10⁴ km2 from 1999 to 2012 [8].

2.2. Data Collection

2.2.1. Climate and Land-Use Data

Daily meteorological data of precipitation, temperature, and solar radiation of 217 meteorological stations within and near Loess Plateau are obtained from China Meteorological Data Service Center (CMDC) (http://data.cma.cn/) (accessed on 1 January 2018) and Shanxi Meteorological Bureau from 1982 to 2014. They were then interpolated into 1 km resolution via digital elevation model (DEM) based thin-plate smoothing splines (ANUSPLIN 4.1) to the same time interval of MODIS NDVI and then projected under UTM WGS-1984. Land-use maps of the years 1980, 1995, 2000, 2005 and 2010 are acquired from the Institute of Geographic Sciences and Natural Resources Research, CAS (http://www.gscloud.cn) (accessed on 1 January 2016) and projected to UTM WGS-1984 as well. Due to the major concern of tree cover change, other land-use types (e.g., water bodies, urbanized areas) are therefore discarded.

2.2.2. Satellite Data

Large-scale continuous monitoring of tree cover is of great importance to a better assessment of the result of reforestation [8]. Annual tree/non-tree vegetated cover data is acquired from the MODIS VCF product (MOD44B) from 2000 to 2014 at 250 m resolution and resampled [49] to represent the percentage of the tree or non-tree vegetation in pixels of 1 km2. The temporal trend and significance of VCF tree cover during 2000–2014 were calculated by linear regression model using MATLAB 2016a (the MathWorks, Inc.) with p < 0.05 (t-test).
Net primary productivity (NPP) is estimated using Carnegie-Ames-Stanford Approach (CASA) model. The basic equation for the CASA model [50] is as follows:
N P P ( x , t ) = A P A R ( x , t ) × ε ( x , t )
A P A R ( x , t ) = F P A R ( x , t ) × P A R ( x , t )  
APAR(x, t) stands for the absorbed photosynthetically active radiation in pixel x during the time t, and ε(x, t) refers to the actual maximum light use efficiency in pixel x (g C/MJ). F P A R ( x , t ) and ε ( x , t ) are calculated following the formula in reference [50,51]. P A R ( x , t ) is based on interpolated solar radiation from climate data by ANUSPLIN. CASA is acknowledged as suitable and effective for NPP estimation of Loess Plateaus in many pieces of research concerning climate and landuse [52,53]. The estimation of NPP is based on NDVI time series data from NOAA GIMMS (1982–2006) (15 days, 1/12° × 1/12°, ~8 km) and MODIS (2000–2014) (MOD13A2, 16 days, 1 km) respectively (https://earthdata.nasa.gov/) (accessed on 1 July 2020) (https://reverb.echo.nasa.gov/reverb/) (accessed on 1 June 2016). NPP is calculated following the initial time scale of NDVI datasets and then summed to monthly and Annual NPP. Before doing so, processes were needed to eliminate the impact of GIMMS and MODIS NDVI intrinsic differences in the analysis of long-term NPP trends so that data consistency of different datasets was guaranteed. GIMMS NDVI before 2000 was initially rescaled according to the linear regression of overlapped GIMMS and MODIS NDVI datasets in 2000–2006. Water consumption (i.e., evapotranspiration, ET) is obtained from the MODIS product for 2000–2014. WUE is obtained by dividing the sum NPP by ET annually.

2.3. Anthropogenic and Climatic Effects Decomposition

Trends of the residuals from the precipitation-tree coverage regression are applied widely to identify areas with significant tree cover increment mainly resulting from precipitation or artificial reforestation [25,26,27]. The premise for the residual trends (RESTREND) method is that the primary productivity is closely coupled with precipitation in semi-arid and arid ecosystems, while other climate factors, especially air temperature, had a minor effect on vegetation dynamics and that the increment motivated by precipitation per unit falls with ongoing ecosystems degradation. The significant positive residual trends (p < 0.05) are a sign of improved vegetation coverage and growth by artificial forest and conservation, while the negative trends (p < 0.05) are due to degradation, such as grazing and urbanization [25,27]. On the contrary, the pixel-based residual trend method produces an insignificant positive result when precipitation plays the leading role in vegetation cover increase. Generally, trends of the residuals of the regression distinguished these pixels into the natural forest and artificial forest based on trend significance.
Here, pixels with significant tree cover increase (p < 0.05, t-test) are classified into artificial and natural forests according to the significance of residual trends (p < 0.05) (Figure 1b and Figure 2, Table 1). To make a further comparison of the extent of tree cover increase, the slope of significant tree cover increase is used to divide natural and artificial forest recovery into high (slope > 1) and limited (slope < 1) increases (Figure 2). There are two zones mixed with both artificial and natural limited tree cover increase in the west (west zone, WZ) and east (east zone, EZ), a zone which is mainly composed of artificially limited tree cover increase in the north (north zone, NZ), and a collection of areas with artificial highly increased tree cover in the south (south zone, SZ) (Figure 2).

2.4. Resilience and Resistance

Stability metrics, i.e., Resilience and resistance, are evaluated using the autoregressive exogenous (ARx) model, a linear function of monthly precipitation and temperature anomaly and one-month lagged NPP anomaly acting as exogenous and autoregressive terms, respectively [54]:
N P P a n m l ( t ) = α N P P a n m l ( t 1 ) + β P a n m l ( t ) + φ T a n m l ( t ) + ϵ ( t )
where NPPanml (t) is the standardized NPP anomaly at time t, and NPPanml (t − 1) is the standardized NPP anomaly at time t − 1. Panml (t) and Tanml (t) stand for standardized anomalies of precipitation and temperature at time t, and ϵ ( t ) means residual for the model at time t. The absolute value of coefficient α exhibits how strong the antecedent month NPP anomaly is related to the current month NPP for this pixel. Resilience is represented by 1 α for convenience because a larger coefficient α suggests a slow ecosystem recovery, i.e., weak resilience [55,56]. The large absolute value of coefficient β and φ imply a great dependency of the current month’s NPP anomaly on climate variability, thus indicating weak resistance to drought or temperature anomaly. Positive metrics of β and φ imply that NPP anomaly would increase under a wetter and warmer climate, while negative metrics of β and φ implies NPP anomaly would decrease [54]. Since β and φ represent the dependency of NPP anomaly to P anomaly and T anomaly, respectively, the difference between 1 and this dependency is defined as resistance to the corresponding environmental factor. Thus, resistance to P a n m l ( t ) was 1 β (shortened as Resistance P, or resP); resistance to T a n m l ( t ) was 1 φ (shortened as Resistance T, or resT).
To perform the ARx model, Mann-Kendall nonparametric test (MK) should be applied at the beginning to test the time series data trend [57]. MK method is popular in detecting and characterizing trends because its usage is not restricted by data distribution and a small number of outliers. To minimize the effect of long-time gradual changes, data should be detrended for long-term NPP and climate time series data when the MK trend test exhibits a significant increasing or decreasing trend. The seasonal component was then removed by deleting the monthly mean of four stages (1982–1989, 1990–1999, 2000–2007, 2008–2014). Data were normalized to ensure stationarity before the ARx procedure. The above procedures of the ARx model are conducted in Matlab 2016a (MathWorks, Inc.). Pixels with changed landuse in the study period are also excluded in the analysis to deprive the effect of land-use change on NPP. Partial correlation analysis is applied to clarify the impact of VCF change and climate factors on ecosystem WUE and stabilities in artificial and natural forest coverage change areas using SAS 9.4, respectively. The significances mentioned in this paper are at the p = 0.05 level.

3. Results

3.1. Vegetation Cover Change

The satellite-based tree cover percentage showed a substantial increasing trend that varied spatially since the launch of GFG on the Loess Plateau in 1999. The average tree cover percentage has increased from 7.1% (~4.5 × 10⁴ km2) to 11.2% (~7.3 × 10⁴ km2), with a relative increase of 57.7% on the Plateau during 2000–2014 (Figure 1b: y = 0.297x − 586.912, R2 = 0.727, p < 0.01, Willmott index dr = 0.757, calculated via R package of ie2misc version 0.9.0.) [58]. More than 75% of the Plateau exhibited a rising trend of tree cover. The central Loess Plateau, including Northern Shaanxi, north-east Gansu, and east of Ordos in Inner Mongolia, showed a significant tree cover increase, which accounted for 26.16% of the whole Plateau (p < 0.05). Only a tiny portion near densely populated cities showed a significant decrease in tree cover (p < 0.05) (Figure 1c).
By applying the RESTREND method, regions of artificial and natural significant tree cover increase were recognized and further separated into highly increased (slope > 1, HI) and limited increased (slope < 1, LI) groups based on the slope of increasing tree cover trend (p < 0.05) (Figure 1b and Figure 2). Artificial forested areas occupied 76.43% of the significantly increased tree cover regions (Figure 1b). HI, and LI areas are made up of 3.75% and 16.24% of the whole Plateau by anthropogenic reforestation and 0.23% and 5.89% by climate, respectively (Figure 1b). Artificial forested areas were mainly distributed in Northern Shaanxi, Eastern Ordos in Inner Mongolia and partly Northeast of Gansu. Natural forested areas overlapped the southern part of artificial forested areas on the Plateau. Artificial HI forest places expanded further south, together with the middle reach of Taihang and Lvliang Mountain of Shanxi, where precipitation was much higher (Figure 2).

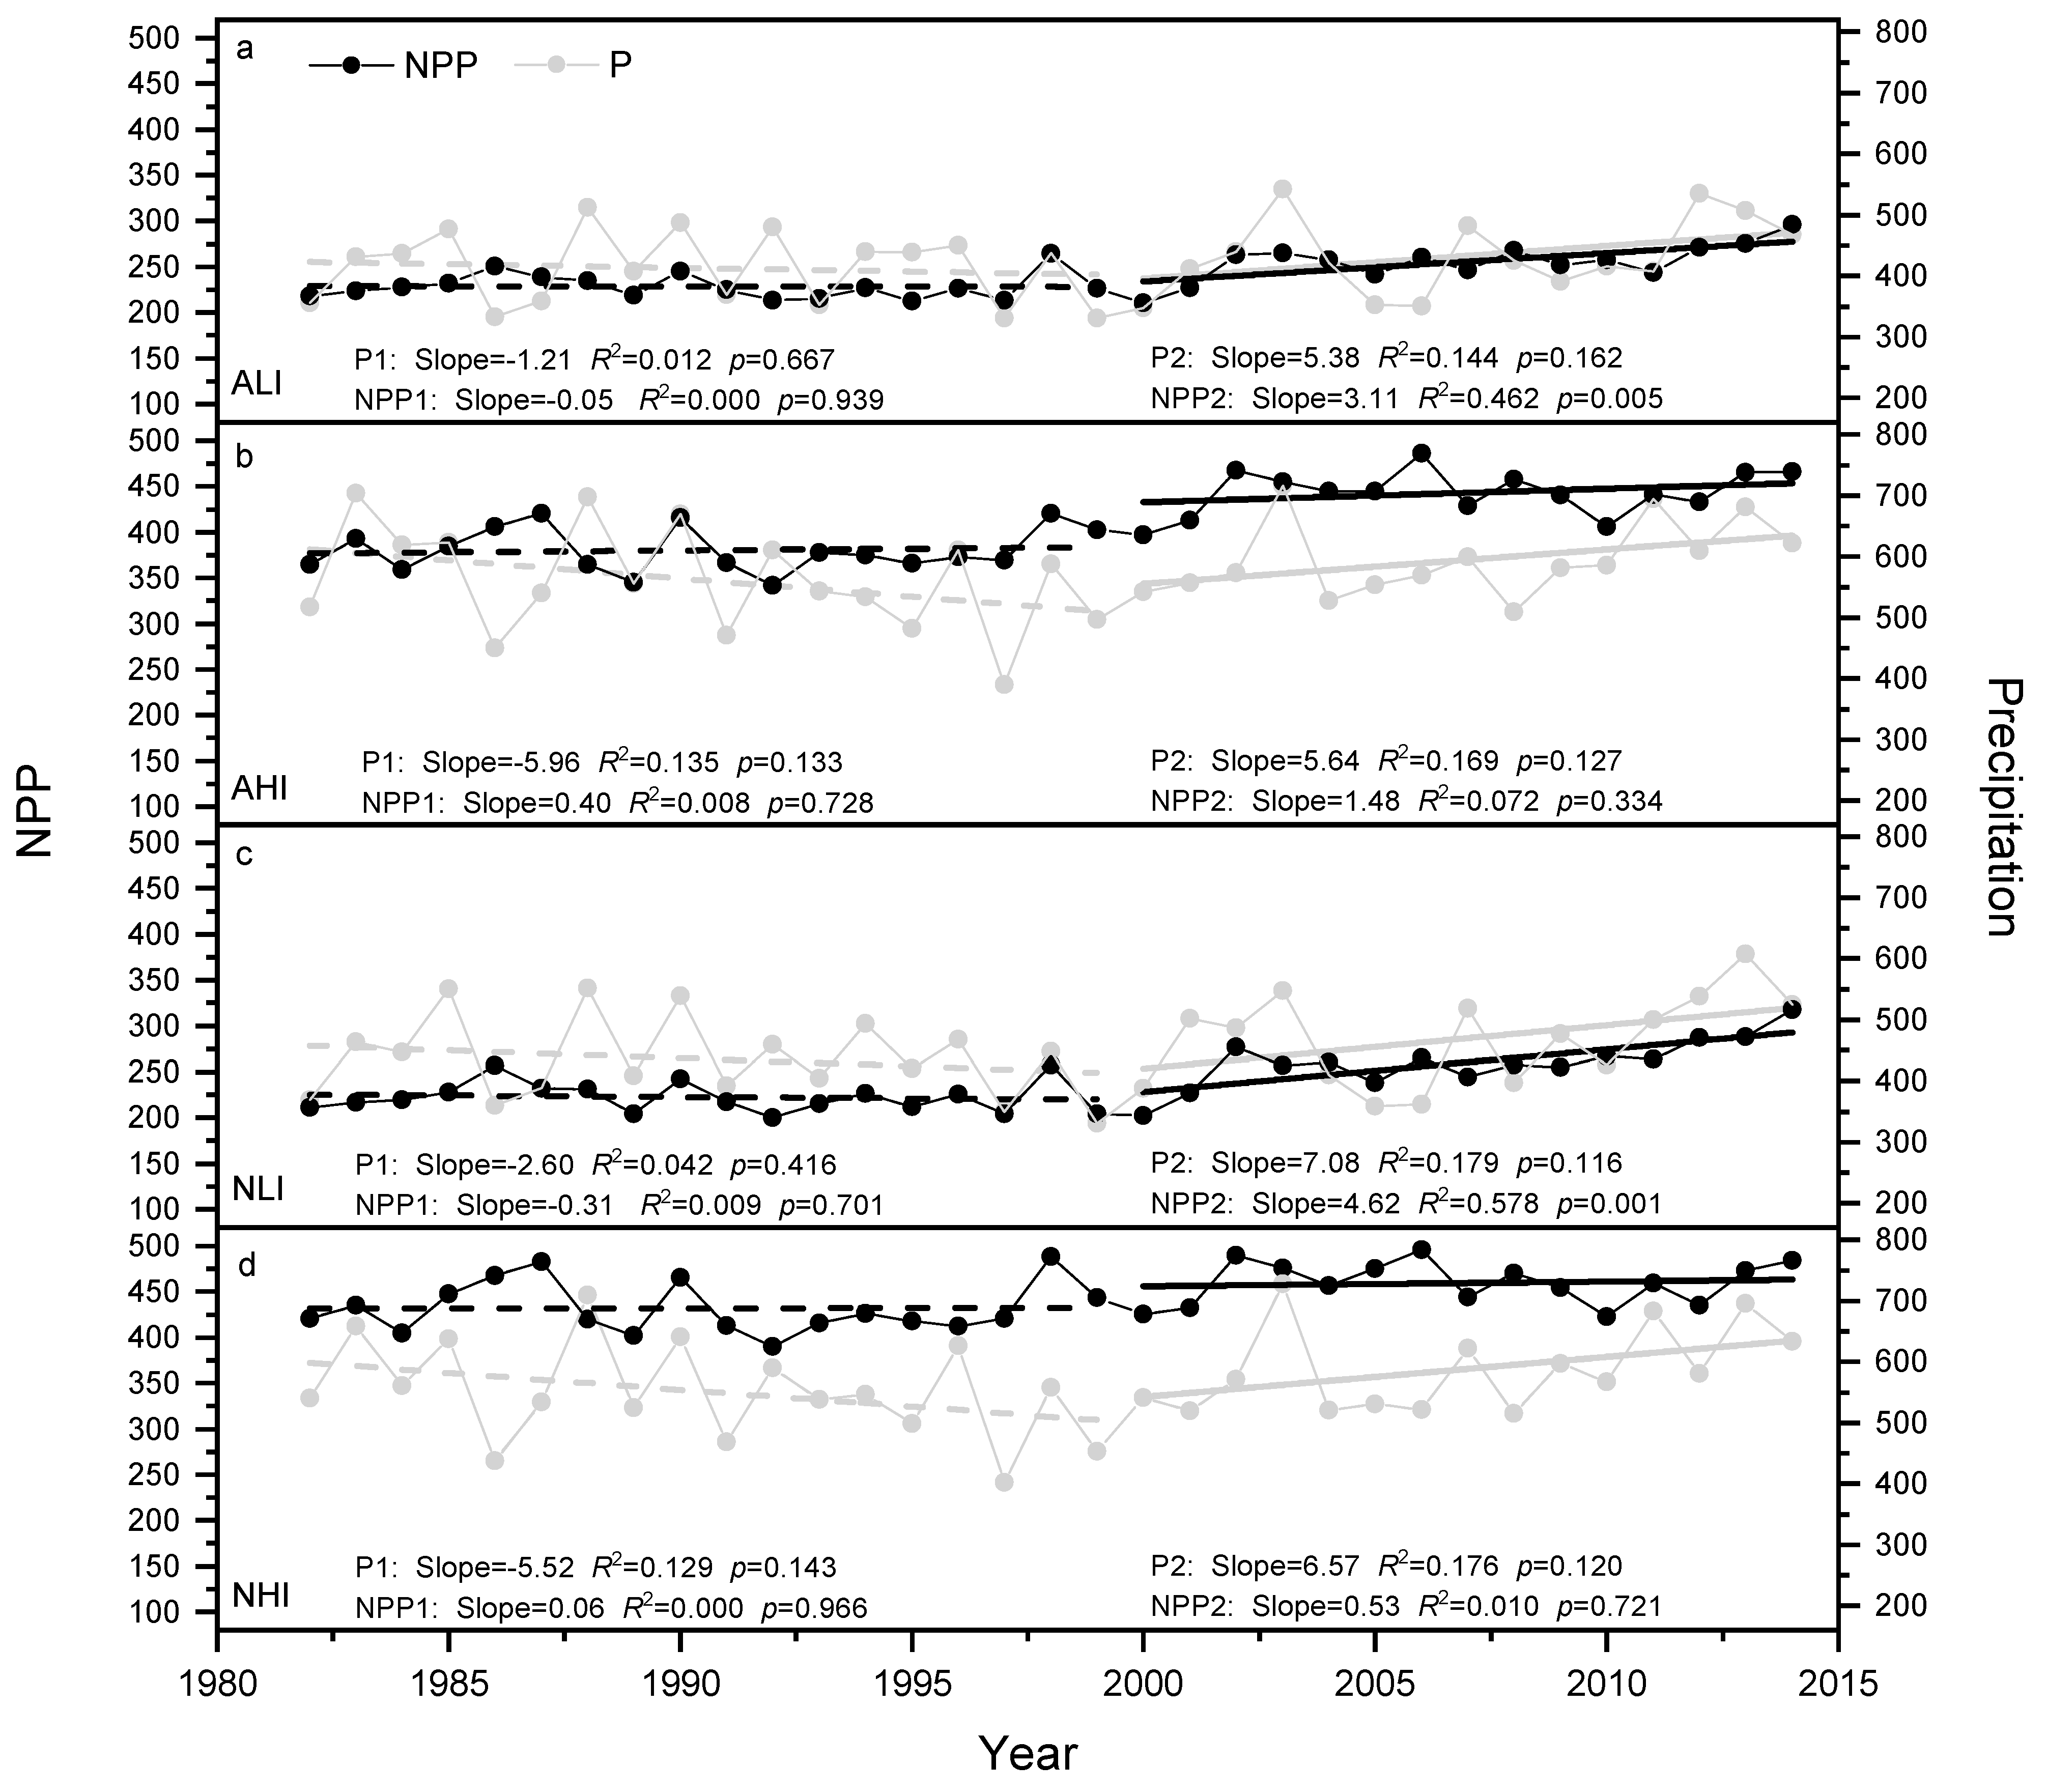
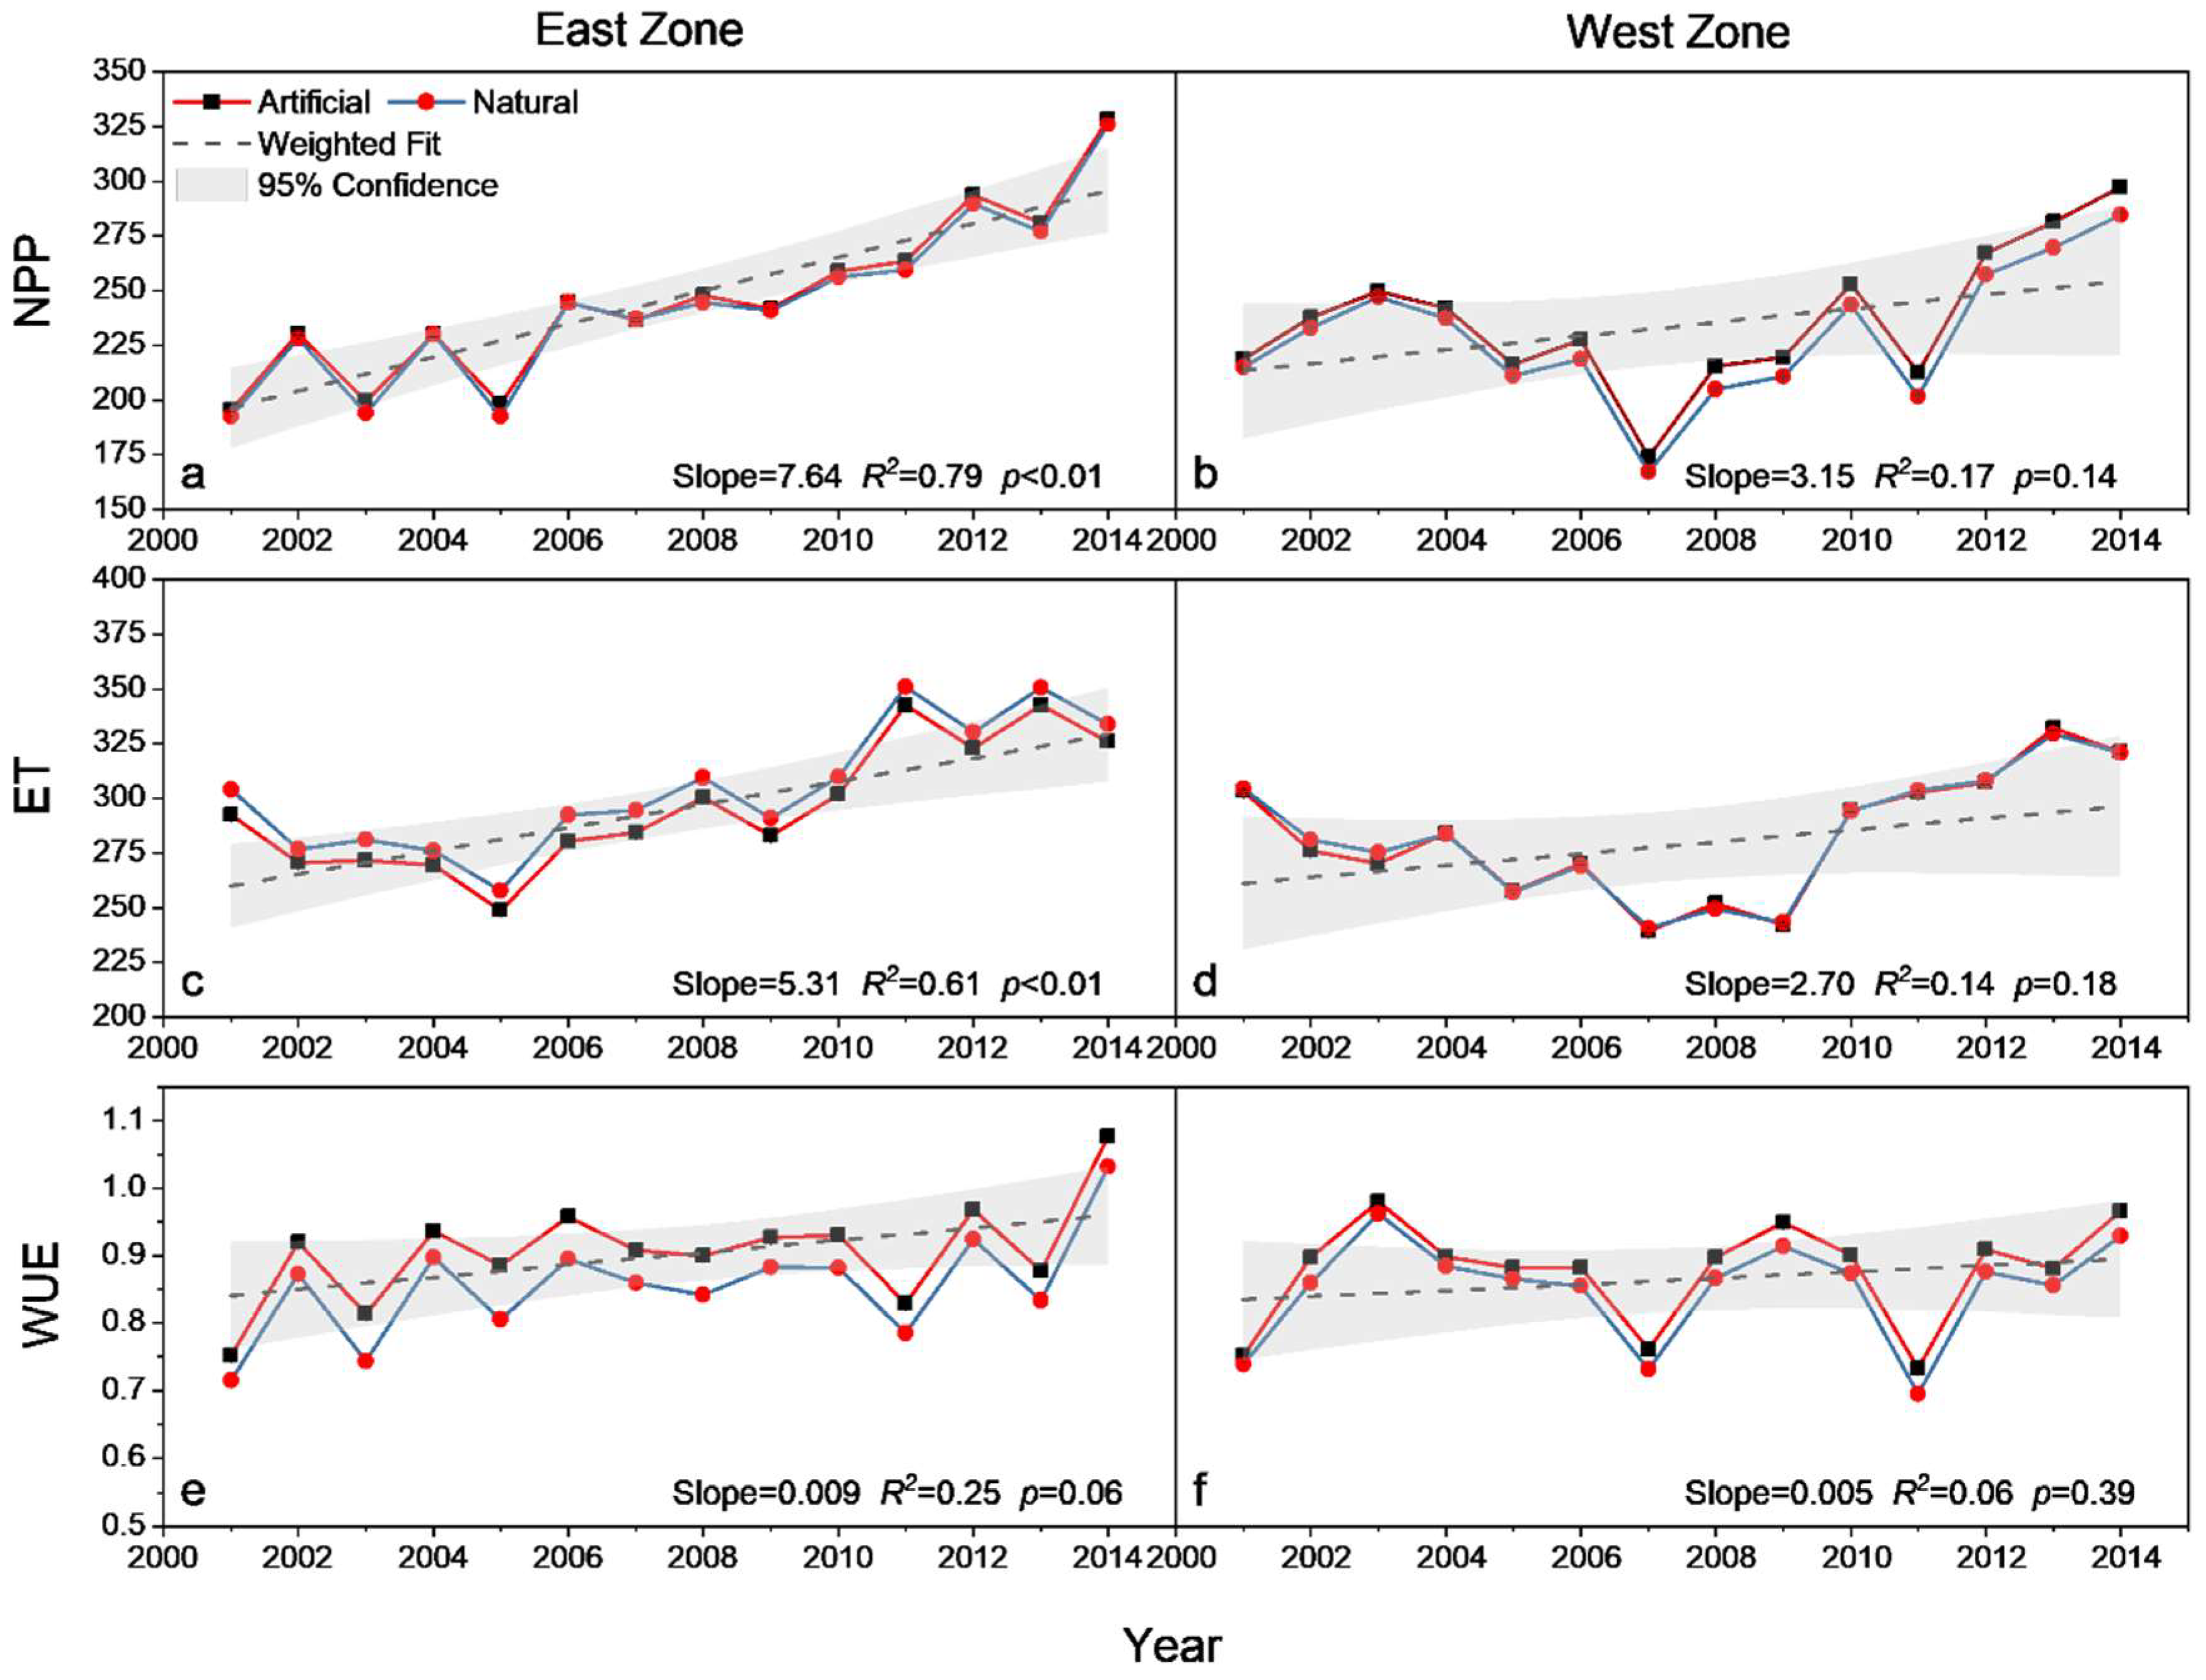
3.2. NPP, ET and WUE

The large increase of NPP occurred in areas with significant tree cover increase in comparison with the period before the GFG started (Figure 3). In both artificial and natural LI (HLI and NLI) areas, NPP had significantly increased since 2000 but did not exhibit any trend before 2000 (p < 0.01) (Figure 3a,c). Besides, although averaged NPP was roughly equivalent for the two LI regions, precipitation in natural forested areas (NLI) was substantially higher than that in artificial forested LI areas (ALI) (Figure 3a,c).
A comparison of NPP, ET and WUE was made between artificial and natural forests under similar precipitation and geographically close conditions (within West Zone, WZ, and East Zone, EZ). In the EZ, NPP had a significant increase of 7.6 gC·m2 y−1 in 2001–2014 (p < 0.01), and no difference was found between artificial and natural forested areas. ET significantly increased at a rate of 5.2 mm y−1 and was constantly higher for the natural forest in the EZ (p < 0.01). The divergence in ET resulted in larger WUE in the artificial forest than natural forest in the EZ (Figure 4e). In contrast, both NPP and ET had no significant trend in 2001–2014 in the WZ (Figure 4b,d). The relatively higher WUE in the WZ was attributed to higher NPP and equivalent ET in the artificial forest.
NPP, ET and WUE were driven by factors that differed in the origin of tree cover increase and varied spatially. p was the dominant factor influencing NPP and ET of both artificial and natural forested WZ (p < 0.01 in the artificial forest, and p < 0.01 in the natural forest for NPP; p < 0.01 for ET). In the EZ, NPP was strongly related to precipitation (p < 0.01) and tree cover (p < 0.01) in natural forests, while it was significantly influenced by precipitation (p < 0.01), temperature (p < 0.01), radiation (p < 0.01) and tree cover (p < 0.01) in areas artificial forest. ET was mainly affected by precipitation and temperature in natural forested EZ (p < 0.01, p < 0.01), while it was significantly influenced by precipitation and tree cover (p < 0.01, p < 0.01) in artificial forested areas of the same zone. WUE was significantly influenced by NPP and ET in both EZ and WZ, with a relatively higher dependency on NPP in the EZ (NPP: p < 0.01, ET: p < 0.01 in the east; NPP: p < 0.01, ET: p < 0.01 in the west). Moreover, WUE was significantly influenced by precipitation and tree cover in the EZ (Precipitation: p < 0.01, Tree cover: p < 0.01).

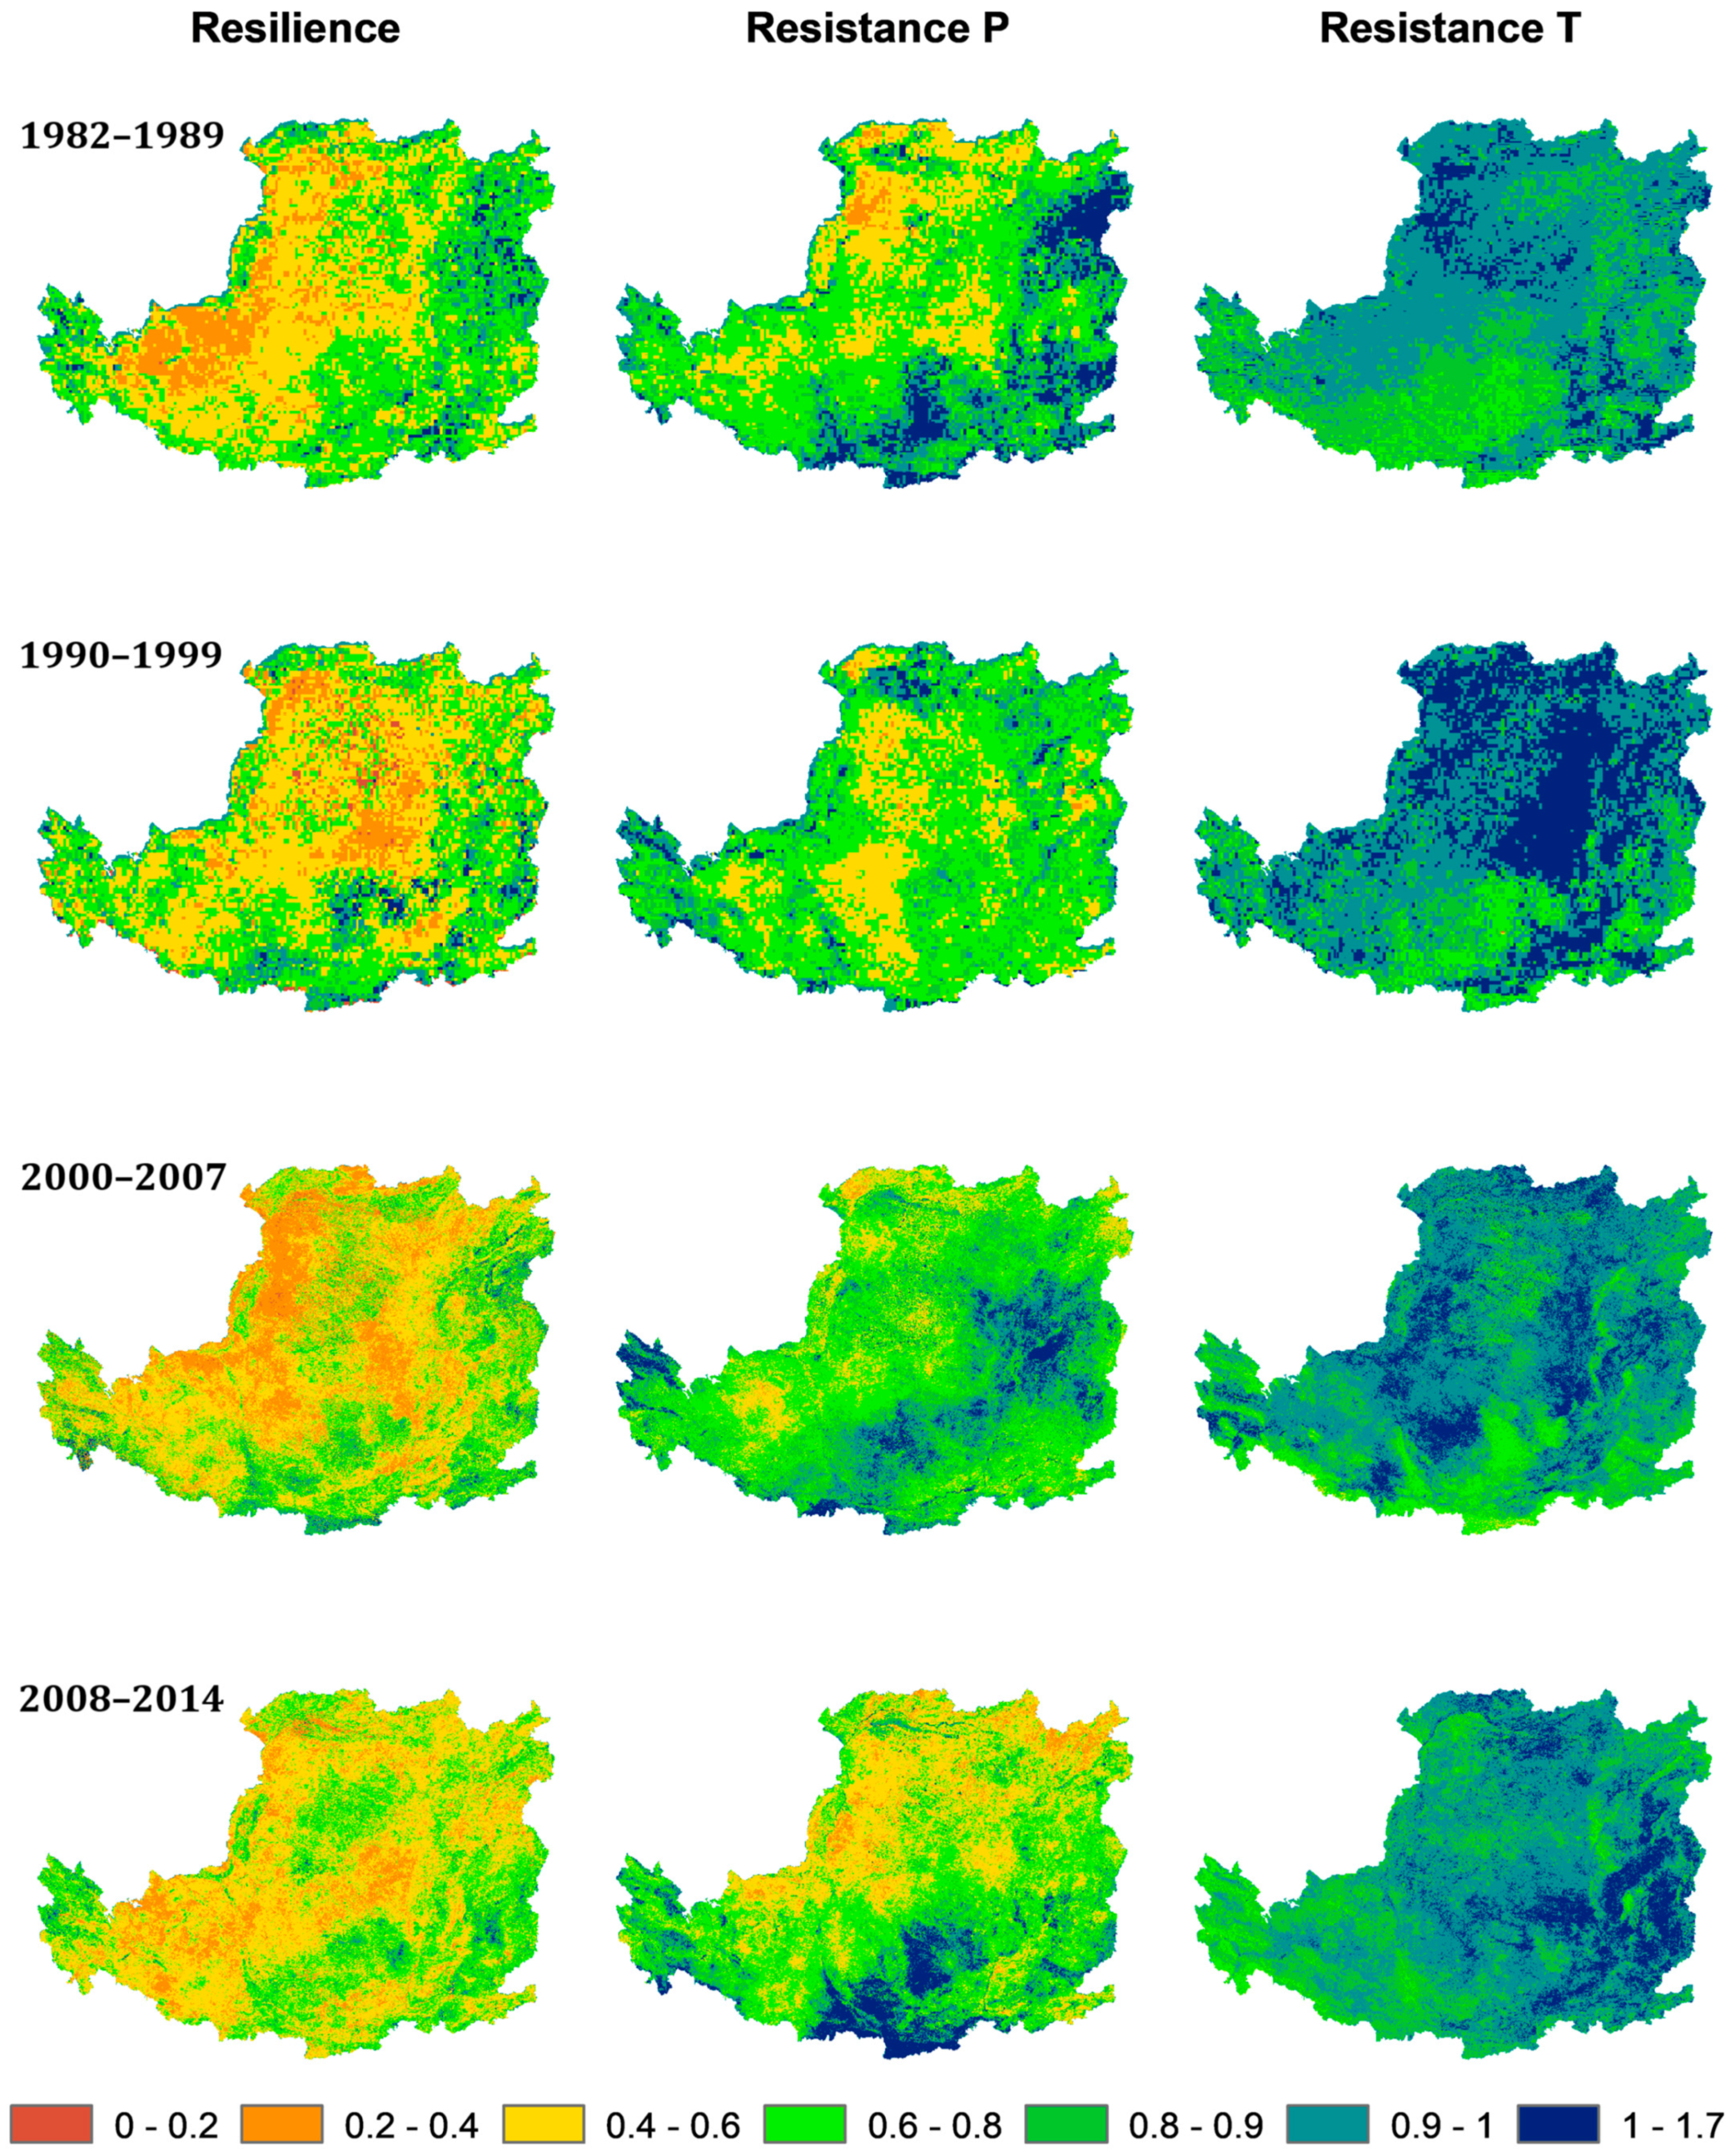
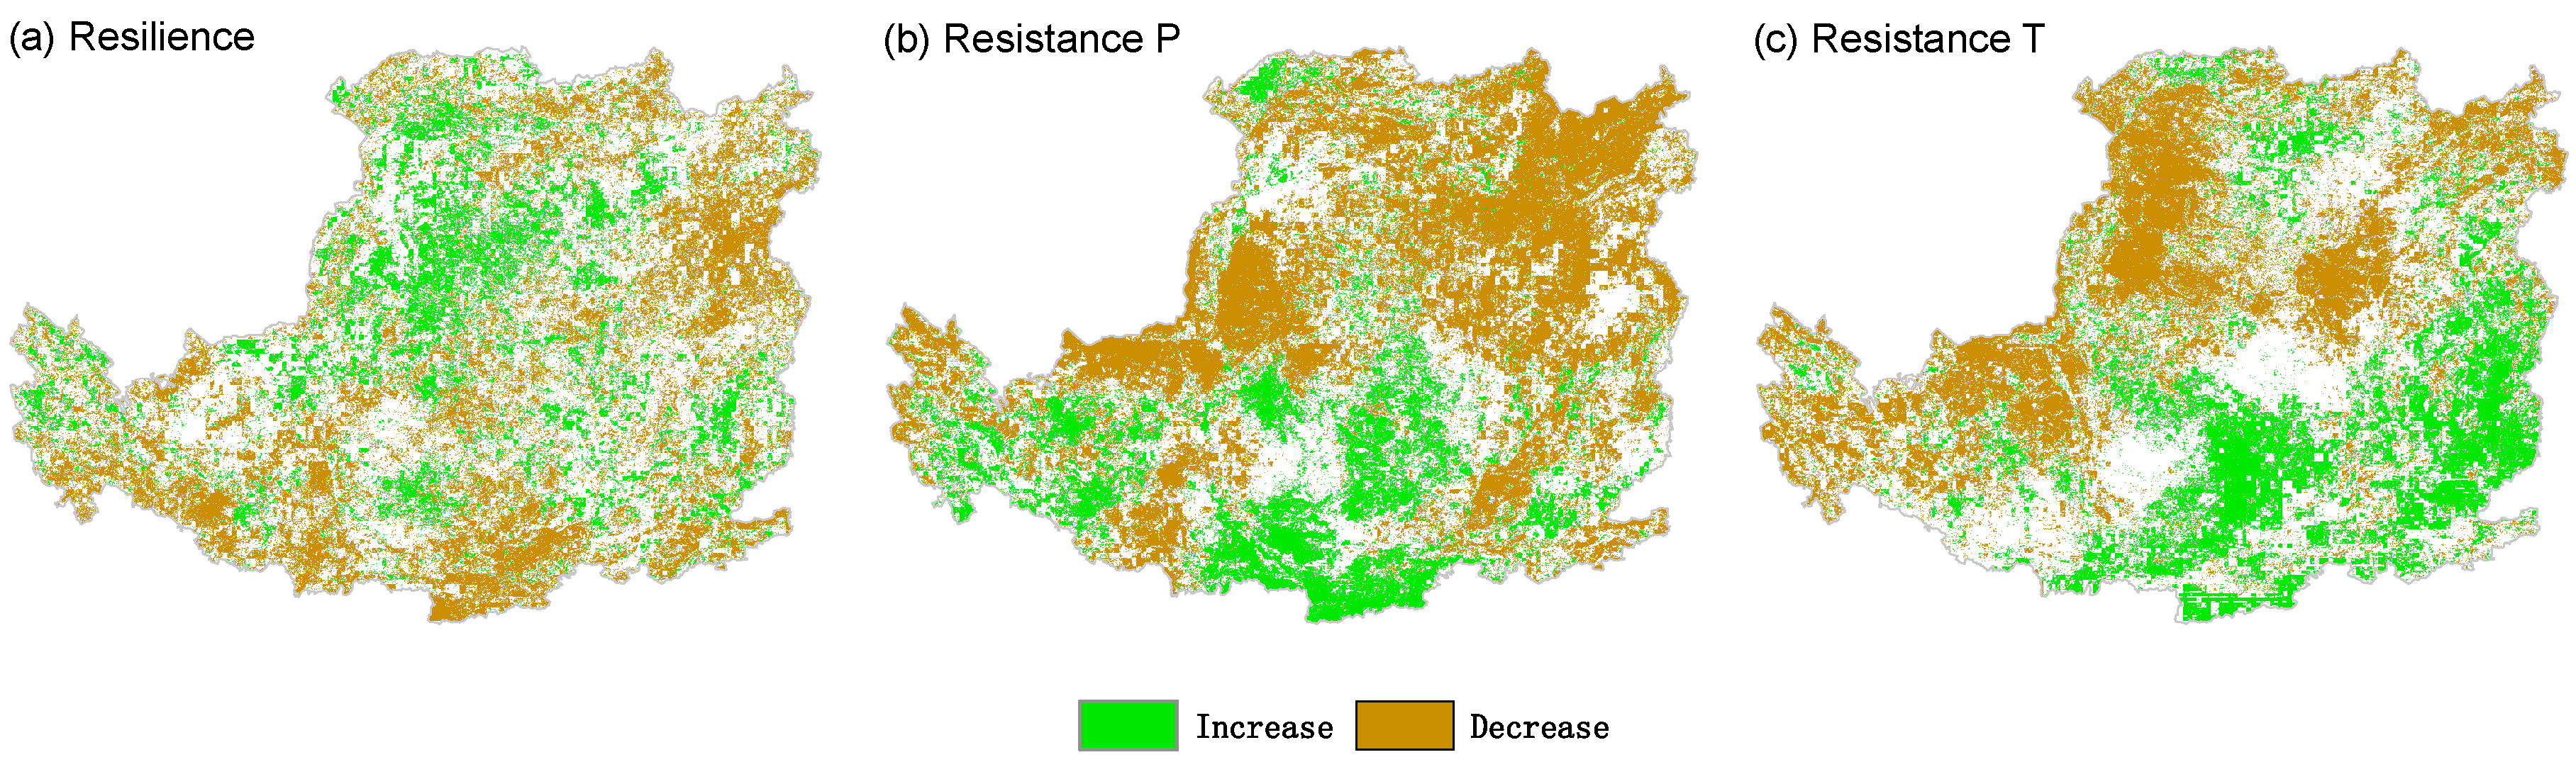
3.3. Stability Indexes

Resilience, resistance P (resP) and resistance T (resT) on the Loess Plateau varied over space in 1982–2014. Resilience was higher in the eastern part of the Plateau and Liangshan forest zone and Qiaoshan forest zone in Shaanxi. The hot spot of high resP has been shifted from northeast to southwest of the Plateau, e.g., northern Shanxi to Qinling, Shaanxi, while the northern part of the Plateau exhibited higher resT (Figure 5).
There was a substantial spatial divergence of stability shifts at coarse scales. Differences were minor for stabilities between nearby artificial and natural forests. Resilience increased in the northwest of the Plateau and along the border of Shaanxi and Shanxi, where the Yellow River went through (Figure 6a). ResP had an increase in the south of the Plateau, mostly in densely vegetated mountains and reserved areas. ResP increased in the WZ but decreased in the EZ (Figure 6b). The resT exhibited an increasing trend in the southeast of the Loess Plateau, with an increasing trend in the WZ and a decreasing trend in the EZ (Figure 6c).

4. Discussion

4.1. Conditions for Tree Cover Increase

The artificial forest is the major driving force of tree cover increase in 2000–2014 in the Loess Plateau, but its effects are restricted by climate variations and land-use history. In this study, most areas with significant tree cover increase in the Plateau experienced massive anthropogenic reforestation and land cover change from farmland to the forest during 2000–2014 (Figure 1b). Correspondingly, NPP in Loess Plateau had a steady fluctuation phase from 1980 to 1999 and a rising stage from 2000–2014. The artificial reforested provinces, including Shaanxi, Shanxi and Ningxia, were reported to afforest an area of over 3.8 × 10⁴ km2 [8]. The limited tree cover increase (LI, slope < 1) in the central Loess Plateau is expanded under the premise of 400 mm MAP and mostly spreads along the middle reach of the Yellow River (from Hekou Town, Inner Mongolia to Taohuayu, Henan), though no significant increasing trend of precipitation was found. Hence the tree cover increase is unlikely to be caused by climate change. In contrast, the rising/ascending tree cover in the northeast of Gansu (WZ) was under the control of a less humid climate and recovered under the circumstances of regional precipitation increase (Figure S1) and the protection of natural reserves and neighborhood areas. Shanxi has tree cover significantly increased along Lvliang mountain reach, which is against the former conclusion of sparse restored patches [59].
The effectiveness of reforestation is determined by MAP in the Plateau. A threshold of MAP at 500 mm is required for HI in the south (slope > 1), which is higher than LI-reforested places (400 mm of MAP for slope < 1). Besides, HI areas (slope > 1) appear only in less anthropogenic-disturbed mountains and longstanding forest zones, e.g., Mt. Lvliang, Mt. Liupan, Mt. Qinling, Huanglong and Huangling forest zones. Although Loess Plateau has been found to shift from a carbon source to a carbon sink in the last decades, the significant increase of ET and decline in water yield and soil water content due to ascending water consumption by revegetation has added potential threat to the water security of reforestation and human withdrawal [18,48,53]. Therefore, it is widely acknowledged that choosing appropriate species that match the local climate is essential to sustainable reforestation [40,48]. In this study, areas receiving precipitation less than 400 mm could only witness a significant increase in tree cover where there was extra water input from large rivers nearby, e.g., Kubuqi Desert and Shapotou. Otherwise, the artificially planted trees would eventually head towards dieback and shrub-like states, namely, little old man tree [48,60]. Many studies have already reported that the commonly used species, e.g., populus, in GFG can exacerbate soil water shortages and threaten the survival of native species [61].

4.2. Factors Influencing NPP, ET and WUE

NPP was mainly supported by precipitation, irrigation, and underground water supply in the northern part of the Loess Plateau, while NPP in the southern part was tightly driven by vegetation cover increase. In this study, the effect of tree cover on NPP is faint in the North Zone (NZ) but prominent in the South Zone (SZ) for the majority of artificial forests (with increasing tree cover) in the east. Similarly, ET in artificial forests is consistently affected by tree cover and diminishing climate effects from north to south (Figure S2). This latitudinal trend of the weight of tree-cover effects on NPP indicates the passive response to climate change and water-intensive reforestation in NZ. Therefore, the intensity of artificial reforestation and vegetation type applied should be treated cautiously, especially in the NZ, because of the remaining risk of soil desiccation by increased vegetation ET, fluctuated precipitation, and unstable carbon sequestration that reforestation program faced in drier conditions [12,38].
The driving factor for NPP and ET of spatially divergent tree cover increase areas under equivalent precipitation varies between natural and artificial forests. In the WZ, precipitation is decisive to NPP and ET of both natural and artificial forests. In terms of ecosystem structure, understory shrubs and grass contribute greater NPP than a tree does in the WZ. However, climate and tree cover are equally and closely related to artificial forest NPP and ET in the EZ while determining ET and NPP of natural forests, respectively. The relatively higher impact of tree cover on NPP over climate in a natural forest of the EZ demonstrated that the dense natural canopy is more efficient in resisting drought and keeping photosynthesis with conserved water in deep soil. Besides, there may be an underestimated lagged effect of precipitation on NPP in the EZ natural forests. However, a concurrent response of ET would offset the stability of NPP and impede the sustainability of natural forests in the EZ because not only would soil evaporation be maximized by closely coupled high temperatures in the east, but also vegetation transpiration would be accelerated as tree cover increases.
Areas with artificially increased tree cover are more efficient in sequestering carbon than regions with natural tree cover increase under similar precipitation. NPP and ET are almost equally important to WUE in the WZ, while NPP has a greater impact on WUE in the EZ. The growing gap in NPP resulted in higher WUE in the artificial forest in the WZ. In contrast, higher ET decreased WUE in a natural forest of the EZ. Divergence in WUE between artificial and natural forests may be attributed to growing soil desiccation as the forest aged in semi-arid areas. It is reported that soil desiccation is more intensive in old forestland than in young forestland in the 200–1000 cm soil profile on the Loess Plateau. It is acknowledged that reforestation can change the local climate via hydrologic cycles and increase water vapor in the atmosphere, eventually promoting tree cover in both artificial forests at the junior stage and mature natural forests. It has been reported that the regrowth of old forests had larger ET in the southern taiga subzone of European [62,63]. However, the contradictory result of greater ET in the artificial forest than in natural forest is found in more humid southern China [59]. One possible explanation is that the precipitation input is sufficient for potential carbon sequestration in southern China but still in great deficit in the north. Further research is still needed on the Loess Plateau because artificial forests are competing against natural forests for limited soil water and offsetting the soil moisture decline by reducing land surface temperature and evaporation via expanded plant canopy shadows [42].
WUE only showed a slight increase in the EZ due to the asynchronous rise of NPP and ET. This study also demonstrated that tree cover increase in the semi-arid west Loess Plateau would not guarantee NPP increase regardless of ET. On the contrary, it can be inferred from the same ET in the artificial and natural forests that water surplus barely existed in the WZ, even though precipitation significantly increased. The residual effect of chemical fertilizer in the farmland-transformed artificial forest could attribute to larger WUE, too. Most artificially reforested areas are transformed from cultivated land that uses water from shallow layers or is located around forest zones away from logging and fire. However, the sustainability of high WUE in an artificial forest is under threat for three reasons. First, the hydraulic stem efficiency might decline, as observed in the artificial forest rather than the natural forest of Northeast China [22]. The decreasing trend of leaf-to-sapwood area ratio with increasing tree size imposed greater risk to tree growth in artificial plantation sites. Secondly, the intensive relation between vegetation cover and ET can amplify soil water scarcity of deep soil in the drier replantation of the NZ. With fast-growing exotic species planted, the forest would be faced with dieback and mortality. Thirdly, an artificial forest requires a longer time (more than 20 years) to fully function as a natural forest and resumes water content of 0–5 m [37,60]. Uncertainty in future climate would interfere with the reforestation process and make it hard to survive drought and extreme climate events. By the time artificial forests fully functioned, aggravated water scarcity of such a large-scale restoration program would already be less appropriate for deep-rooted plants to live. Therefore, maintaining carbon sink and water balance in artificial forest sites remains challenging in Loess Plateau.

4.3. Ecosystem Stability

To estimate the adaptation of vegetation to environmental change in reforested Loess Plateau, our study graphs the periodic stability and found an obvious trend with spatial heterogeneity in Loess Plateau. NPP is less susceptible to climate variations with high resistance and recovers faster with higher resilience. Stability is related to primary climate stress, internal characteristics of different biomes and biodiversity [43,45,64,65]. Artificial reforested areas in NZ are experiencing increasing resilience and decreasing resistance, while the WZ artificial forest has stronger resistance to climate change. Although located next to well-vegetated national reserves of Mt. Xinlong, the western part of areas artificial forest (WZ) has a semi-arid climate and trees under chronic stress of drought that might survive drought much easier than non-chronically stressed trees, as McNulty suggested [64]. Significantly increased precipitation may also greatly alleviate water stress and increase resistance by decoupling the strong correlation between precipitation and NPP in the WZ. In contrast, the NZ used to be shallow-surface cultivated land. Reliance on precipitation, the opposite of resistance, increased as the new plantation fiercely transpired and extracted limited deep soil water.
The trend of stability in the NZ artificial forest has demonstrated sensitive and unstable ecosystem adaptation to climate change, where large-scale reforestation is highly water intensive. Besides, disentangled NPP to climate factors and greater dependence on tree cover led to a growing resistance in the south and limited its recovery once the forest canopy was destroyed. Low resistance is frequent in fast-growing monoculture plantations. At the same time, higher resilience in an artificial forest indicates a flexible ecosystem to disturbance [66]. In fact, disturbances could be chances of establishing more climatically suitable species and compositional changes [44,67]. Although trees in heterogeneous environments adapt themselves to extreme droughts through different eco-physiological responses, these responses are likely to be overridden by geographical changes [68]. The impact of environmental stress on stability deserves further study since the lowest resilience is found in the xeric circumstances in studies, and species’ physiological tolerance could interact with climate to reorganize and shift ecosystem state [67,68,69]. This study also suggests that stability could not be simply predicted from the temporal trend of NDVI and NPP and reforestation. Comprehensive knowledge of ecosystem composition and species traits in relation to external disturbances could facilitate the implementation of reforestation regimes and sustainable development of ecological services.

5. Conclusions

This study provided an overview of the grand challenges and opportunities facing vegetation greening and compared WUE of natural and artificial forest cover increase on the Loess Plateau region of northern China since 2000 using satellite-derived VCF, NPP, ET. Climate change and anthropogenic replantation dramatically changed vegetation coverage and ecosystem stability and functions. These changes in forest cover potentially cause even greater divergences of the carbon and water cycling across the Plateau, yet the balance of carbon sequestration and water loss in the natural and artificial forest has contrasting effects on ecosystem services in both magnitude and direction. The role of revegetation practice in NPP and ET became gradually more dominant than climate factors in artificial forests from the northern to the southern part of the Loess Plateau. For areas experiencing limited forest coverage increase, areas of the artificial forest showed higher WUE than natural forests under similar MAP. The higher dependency of the northern reforested area on climate fluctuation indicates a growing threat of water scarcity to the sustainability of artificial forests in semi-arid regions. We recommend that future ecological restoration programs pay more attention to maintaining the balance between ecosystem restoration and water use efficiency according to different regions to ensure that vegetation restoration is ecologically sustainable.

Supplementary Materials

The following supporting information can be downloaded at: https://www.mdpi.com/article/10.3390/f14010027/s1, Figure S1: Regional precipitation trend during 2000-2014 and four comparative zones; Figure S2: NPP, ET and WUE from 1982–1989, 1990–1999, 2000–2007 and 2008–2014. ET and WUE data only available after 2000.

Author Contributions

Conceptualization, Y.W., G.D. and C.S.; methodology, G.D., F.Z. and Z.W.; software, G.D., F.Z. and Z.W.; formal analysis, Y.W. and F.Z.; investigation, Y.W. and Z.W.; writing—original draft preparation, Y.W. and F.Z.; writing—review and editing, G.D. and C.S.; visualization, G.D. and F.Z.; supervision, L.Q. and C.S.; project administration, G.D. and C.S.; funding acquisition, G.D. and C.S. All authors have read and agreed to the published version of the manuscript.

Funding

This study was funded by the Natural Science Foundation of China (31870466), the Special Foundation for National Science and Technology Basic Research Program of China (2019FY102000).

Data Availability Statement

Data are available from the authors upon reasonable request as the data need further use.

Acknowledgments

We would like to thank Jiquan Chen from LEES lab at Michigan State University for the suggestions, Shicheng Jiang at Northeast Normal University for the data collection and the US China Carbon Consortium (USCCC).

Conflicts of Interest

The authors declare that they have no conflict of interests or personal relationships that could have appeared to influence the work reported in this paper.

References

  1. Mallapaty, S. How China could be carbon neutral by mid-century. Nature 2020, 586, 482–483. [Google Scholar] [CrossRef]
  2. Delang, C.O.; Yuan, Z. China’s Grain for Green Program; Springer: Cham, Switzerland, 2015; p. 230. [Google Scholar]
  3. Wang, Y.; Yu, P.; Feger, K.-H.; Wei, X.; Sun, G.; Bonell, M.; Xiong, W.; Zhang, S.; Xu, L. Annual runoff and evapotranspiration of forestlands and non-forestlands in selected basins of the Loess Plateau of China. Ecohydrology 2011, 4, 277–287. [Google Scholar] [CrossRef]
  4. Zhang, B.; He, C.; Burnham, M.; Zhang, L. Evaluating the coupling effects of climate aridity and vegetation restoration on soil erosion over the Loess Plateau in China. Sci. Total Environ. 2016, 539, 436–449. [Google Scholar] [CrossRef] [PubMed]
  5. He, J.; Shi, X.; Fu, Y.; Yuan, Y. Evaluation and simulation of the impact of land use change on ecosystem services trade-offs in ecological restoration areas, China. Land Use Policy 2020, 99, 105020. [Google Scholar] [CrossRef]
  6. Chen, Y.; Feng, X.; Tian, H.; Wu, X.; Gao, Z.; Feng, Y.; Piao, S.; Lv, N.; Pan, N.; Fu, B. Accelerated increase in vegetation carbon sequestration in China after 2010: A turning point resulting from climate and human interaction. Glob. Chang. Biol. 2021, 27, 5848–5864. [Google Scholar] [CrossRef]
  7. State Forestry Administration of China. China Forestry Statistical Yearbook 2012; China Forestry Publishing House: Beijing, China, 2013; p. 452.
  8. Xiao, J. Satellite evidence for significant biophysical consequences of the “Grain for Green” Program on the Loess Plateau in China. J. Geophys. Res. Biogeosci. 2014, 119, 2261–2275. [Google Scholar] [CrossRef] [Green Version]
  9. Chen, T.; Feng, Z.; Zhao, H.; Wu, K. Identification of ecosystem service bundles and driving factors in Beijing and its surrounding areas. Sci. Total Environ. 2020, 711, 134687. [Google Scholar] [CrossRef]
  10. Ge, W.; Deng, L.; Wang, F.; Han, J. Quantifying the contributions of human activities and climate change to vegetation net primary productivity dynamics in China from 2001 to 2016. Sci. Total Environ. 2021, 773, 145648. [Google Scholar] [CrossRef]
  11. Wang, K.; Bastos, A.; Ciais, P.; Wang, X.; Rödenbeck, C.; Gentine, P.; Chevallier, F.; Humphrey, V.W.; Huntingford, C.; O’Sullivan, M.; et al. Regional and seasonal partitioning of water and temperature controls on global land carbon uptake variability. Nat. Commun. 2022, 13, 3469. [Google Scholar] [CrossRef]
  12. Chen, L.; Wang, J.; Wei, W.; Fu, B.; Wu, D. Effects of landscape restoration on soil water storage and water use in the Loess Plateau Region, China. For. Ecol. Manag. 2010, 259, 1291–1298. [Google Scholar] [CrossRef]
  13. Chen, Y.; Wang, K.; Lin, Y.; Shi, W.; Song, Y.; He, X. Balancing green and grain trade. Nat. Geosci. 2015, 8, 739–741. [Google Scholar] [CrossRef]
  14. Liu, Y.; Lü, Y.; Fu, B.; Harris, P.; Wu, L. Quantifying the spatio-temporal drivers of planned vegetation restoration on ecosystem services at a regional scale. Sci. Total Environ. 2019, 650, 1029–1040. [Google Scholar] [CrossRef] [PubMed]
  15. Yurui, L.; Xuanchang, Z.; Zhi, C.; Zhengjia, L.; Zhi, L.; Yansui, L. Towards the progress of ecological restoration and economic development in China’s Loess Plateau and strategy for more sustainable development. Sci. Total Environ. 2021, 756, 143676. [Google Scholar] [CrossRef] [PubMed]
  16. Lu, Y.; Fu, B.; Feng, X.; Zeng, Y.; Liu, Y.; Chang, R.; Sun, G.; Wu, B. A policy-driven large scale ecological restoration: Quantifying ecosystem services changes in the Loess Plateau of China. PLoS ONE 2012, 7, e31782. [Google Scholar]
  17. Liu, Y.; Xiao, J.; Ju, W.; Xu, K.; Zhou, Y.; Zhao, Y. Recent trends in vegetation greenness in China significantly altered annual evapotranspiration and water yield. Environ. Res. Lett. 2016, 11, 094010. [Google Scholar] [CrossRef]
  18. Jin, Z.; Liang, W.; Yang, Y.; Zhang, W.; Yan, J.; Chen, X.; Li, S.; Mo, X. Separating Vegetation Greening and Climate Change Controls on Evapotranspiration trend over the Loess Plateau. Sci. Rep. 2017, 7, 8191. [Google Scholar] [CrossRef]
  19. Xu, Y.; Xiao, F. Assessing Changes in the Value of Forest Ecosystem Services in Response to Climate Change in China. Sustainability 2022, 14, 4773. [Google Scholar] [CrossRef]
  20. Deng, O.; Li, Y.; Li, R.; Yang, G. Estimation of Forest Ecosystem Climate Regulation Service Based on Actual Evapotranspiration of New Urban Areas in Guanshanhu District, Guiyang, Guizhou Province, China. Sustainability 2022, 14, 22. [Google Scholar] [CrossRef]
  21. Liu, Y.Y.; Wang, A.Y.; An, Y.N.; Lian, P.Y.; Wu, D.D.; Zhu, J.J.; Meinzer, F.C.; Hao, G.Y. Hydraulics play an important role in causing low growth rate and dieback of aging Pinus sylvestris var. mongolica trees in plantations of Northeast China. Plant Cell Environ. 2018, 41, 1500–1511. [Google Scholar] [CrossRef]
  22. Liu, F.; Yan, H.; Gu, F.; Niu, Z.; Huang, M. Net Primary Productivity Increased on the Loess Plateau Following Implementation of the Grain to Green Program. J. Resour. Ecol. 2017, 8, 413–421. [Google Scholar]
  23. Zhang, T.; Peng, J.; Liang, W.; Yang, Y.; Liu, Y. Spatial–temporal patterns of water use efficiency and climate controls in China’s Loess Plateau during 2000–2010. Sci. Total Environ. 2016, 565, 105–122. [Google Scholar] [CrossRef] [PubMed]
  24. Cao, S.; Chen, L.; Yu, X. Impact of China’s Grain for Green Project on the landscape of vulnerable arid and semi-arid agricultural regions: A case study in northern Shaanxi Province. J. Appl. Ecol. 2009, 46, 536–543. [Google Scholar] [CrossRef]
  25. Wessels, K.J.; Prince, S.D.; Malherbe, J.; Small, J.; Frost, P.E.; VanZyl, D. Can human-induced land degradation be distinguished from the effects of rainfall variability? A case study in South Africa. J. Arid Environ. 2007, 68, 271–297. [Google Scholar] [CrossRef]
  26. Zhao, X.; Hu, H.; Shen, H.; Zhou, D.; Zhou, L.; Myneni, R.B.; Fang, J. Satellite-indicated long-term vegetation changes and their drivers on the Mongolian Plateau. Landsc. Ecol. 2014, 30, 1599–1611. [Google Scholar] [CrossRef]
  27. John, R.; Chen, J.; Kim, Y.; Ou-yang, Z.-t.; Xiao, J.; Park, H.; Shao, C.; Zhang, Y.; Amarjargal, A.; Batkhshig, O.; et al. Differentiating anthropogenic modification and precipitation-driven change on vegetation productivity on the Mongolian Plateau. Landsc. Ecol. 2015, 31, 547–566. [Google Scholar] [CrossRef]
  28. Sanjuán, M.E.; Martínez-Valderrama, J.; Ruiz, A.; del Barrio, G. Land use intensification affects the relative importance of climate variation and active land degradation: Convergence of six regions around the world. Land Degrad. Dev. 2022, 33, 2487–2499. [Google Scholar] [CrossRef]
  29. Wang, D.; Yue, D.; Zhou, Y.; Huo, F.; Bao, Q.; Li, K. Drought Resistance of Vegetation and Its Change Characteristics before and after the Implementation of the Grain for Green Program on the Loess Plateau, China. Remote Sens. 2022, 14, 5142. [Google Scholar] [CrossRef]
  30. Gao, X.; Zhao, Q.; Zhao, X.; Wu, P.; Pan, W.; Gao, X.; Sun, M. Temporal and spatial evolution of the standardized precipitation evapotranspiration index (SPEI) in the Loess Plateau under climate change from 2001 to 2050. Sci. Total Environ. 2017, 595, 191–200. [Google Scholar] [CrossRef]
  31. Sun, W.; Song, X.; Mu, X.; Gao, P.; Wang, F.; Zhao, G. Spatiotemporal vegetation cover variations associated with climate change and ecological restoration in the Loess Plateau. Agric. For. Meteorol. 2015, 209–210, 87–99. [Google Scholar] [CrossRef]
  32. Liang, W.; Yang, Y.; Fan, D.; Guan, H.; Zhang, T.; Long, D.; Zhou, Y.; Bai, D. Analysis of spatial and temporal patterns of net primary production and their climate controls in China from 1982 to 2010. Agric. For. Meteorol. 2015, 204, 22–36. [Google Scholar] [CrossRef]
  33. Li, G.; Zhang, F.; Jing, Y.; Liu, Y.; Sun, G. Response of evapotranspiration to changes in land use and land cover and climate in China during 2001–2013. Sci. Total Environ. 2017, 596–597, 256–265. [Google Scholar] [CrossRef]
  34. Li, C.; Wu, P.T.; Li, X.L.; Zhou, T.W.; Sun, S.K.; Wang, Y.B.; Luan, X.B.; Yu, X. Spatial and temporal evolution of climatic factors and its impacts on potential evapotranspiration in Loess Plateau of Northern Shaanxi, China. Sci. Total Environ. 2017, 589, 165–172. [Google Scholar] [CrossRef] [PubMed]
  35. Peng, S.; Ding, Y.; Wen, Z.; Chen, Y.; Cao, Y.; Ren, J. Spatiotemporal change and trend analysis of potential evapotranspiration over the Loess Plateau of China during 2011–2100. Agric. For. Meteorol. 2017, 233, 183–194. [Google Scholar] [CrossRef] [Green Version]
  36. Wei, Z.; Wang, D.; Zhang, C.; Liu, Y. Spatio-temporal variation of vegetation phenology on loess plateau in Shaanxi-Gansu-Ningxia region in recent 12 years. J. Ecol. Rural. Environ. 2014, 30, 423–429. [Google Scholar]
  37. Chen, H.; Shao, M.; Li, Y. The characteristics of soil water cycle and water balance on steep grassland under natural and simulated rainfall conditions in the Loess Plateau of China. J. Hydrol. 2008, 360, 242–251. [Google Scholar] [CrossRef]
  38. Jiao, Q.; Li, R.; Wang, F.; Mu, X.; Li, P.; An, C. Impacts of Re-Vegetation on Surface Soil Moisture over the Chinese Loess Plateau Based on Remote Sensing Datasets. Remote Sens. 2016, 8, 156. [Google Scholar] [CrossRef] [Green Version]
  39. Jia, Z.; Zhu, Y.; Liu, L. Different Water Use Strategies of Juvenile and Adult Caragana intermedia Plantations in the Gonghe Basin, Tibet Plateau. PLoS ONE 2012, 7, e45902. [Google Scholar] [CrossRef] [Green Version]
  40. Chen, J.; John, R.; Sun, G.; Fan, P.; Henebry, G.M.; Fernández-Giménez, M.E.; Zhang, Y.; Park, H.; Tian, L.; Groisman, P.; et al. Prospects for the sustainability of social-ecological systems (SES) on the Mongolian plateau: Five critical issues. Environ. Res. Lett. 2018, 13, 123004. [Google Scholar] [CrossRef]
  41. Jian, S.; Zhao, C.; Fang, S.; Yu, K. Effects of different vegetation restoration on soil water storage and water balance in the Chinese Loess Plateau. Agric. For. Meteorol. 2015, 206, 85–96. [Google Scholar] [CrossRef]
  42. Wang, L.; Wei, S.P.; Wu, F.Q. Soil water environment and vegetation growth in the hilly and gully region of the loess plateau: A case study of Yangou Catchment. Acta Ecol. Sin. 2009, 29, 1543–1553. [Google Scholar]
  43. De Keersmaecker, W.; van Rooijen, N.; Lhermitte, S.; Tits, L.; Schaminée, J.; Coppin, P.; Honnay, O.; Somers, B.; Diamond, S. Species-rich semi-natural grasslands have a higher resistance but a lower resilience than intensively managed agricultural grasslands in response to climate anomalies. J. Appl. Ecol. 2016, 53, 430–439. [Google Scholar] [CrossRef] [Green Version]
  44. Buma, B.; Wessman, C.A. Disturbance interactions can impact resilience mechanisms of forests. Ecosphere 2011, 2, art64. [Google Scholar] [CrossRef]
  45. Gazol, A.; Camarero, J.J.; Vicente-Serrano, S.M.; Sanchez-Salguero, R.; Gutierrez, E.; de Luis, M.; Sanguesa-Barreda, G.; Novak, K.; Rozas, V.; Tiscar, P.A.; et al. Forest resilience to drought varies across biomes. Glob. Chang. Biol. 2018, 24, 2143–2158. [Google Scholar] [CrossRef] [PubMed]
  46. Li, Z.; Liu, W.-z.; Zhang, X.-c.; Zheng, F.-l. Impacts of land use change and climate variability on hydrology in an agricultural catchment on the Loess Plateau of China. J. Hydrol. 2009, 377, 35–42. [Google Scholar] [CrossRef]
  47. Feng, X.M.; Sun, G.; Fu, B.J.; Su, C.H.; Liu, Y.; Lamparski, H. Regional effects of vegetation restoration on water yield across the Loess Plateau, China. Hydrol. Earth Syst. Sci. 2012, 16, 2617–2628. [Google Scholar] [CrossRef] [Green Version]
  48. Feng, X.; Fu, B.; Lu, N.; Zeng, Y.; Wu, B. How ecological restoration alters ecosystem services: An analysis of carbon sequestration in China’s Loess Plateau. Sci. Rep. 2013, 3, 2846. [Google Scholar] [CrossRef] [PubMed] [Green Version]
  49. DiMiceli, C.M.; Carroll, M.L.; Sohlberg, R.; Huang, C.; Hansen, M.C.; Townshend, J.R. Annual Global Automated MODIS Vegetation Continuous Fields (MOD44B) at 250 m Spatial Resolution for Data Years Beginning Day 65, 2000–2010. Available online: https://lpdaac.usgs.gov/products/mod44bv006/ (accessed on 1 July 2019).
  50. Zhu, W.; Pan, Y.; Yang, X.; Song, G. Comprehensive analysis of the impact of climatic changes on Chinese terrestrial net primary productivity. Chin. Sci. Bull. 2007, 52, 3253–3260. [Google Scholar] [CrossRef]
  51. Potter, C.S.; Randerson, J.T.; Field, C.B.; Matson, P.A.; Vitousek, P.M.; Mooney, H.A.; Klooster, S.A. Terrestrial ecosystem production: A process model based on global satellite and surface data. Glob. Biogeochem. Cycles 1993, 7, 811–841. [Google Scholar] [CrossRef]
  52. Piao, S.L.; Fang, J.Y.; He, J.S. Variations in vegetation net primary production in the Qinghai-Xizang Plateau, China, from 1982 to 1999. Clim. Chang. 2006, 74, 253–267. [Google Scholar] [CrossRef]
  53. Feng, X.; Fu, B.; Piao, S.; Wang, S.; Ciais, P.; Zeng, Z.; Lu, Y.; Zeng, Y.; Li, Y.; Jiang, X.; et al. Revegetation in China’s Loess Plateau is approaching sustainable water resource limits. Nat. Clim. Chang. 2016, 6, 1019–1022. [Google Scholar] [CrossRef]
  54. De Keersmaecker, W.; Lhermitte, S.; Tits, L.; Honnay, O.; Somers, B.; Coppin, P. A model quantifying global vegetation resistance and resilience to short-term climate anomalies and their relationship with vegetation cover. Glob. Ecol. Biogeogr. 2015, 24, 539–548. [Google Scholar] [CrossRef]
  55. De Keersmaecker, W.; Lhermitte, S.; Tits, L.; Honnay, O.; Somers, B.; Coppin, P. Resilience and the reliability of spectral entropy to assess ecosystem stability. Glob. Chang. Biol. 2018, 24, e393. [Google Scholar] [CrossRef] [PubMed] [Green Version]
  56. Dakos, V.; Carpenter, S.R.; Brock, W.A.; Ellison, A.M.; Guttal, V.; Ives, A.R.; Kéfi, S.; Livina, V.; Seekell, D.A.; van Nes, E.H.; et al. Methods for Detecting Early Warnings of Critical Transitions in Time Series Illustrated Using Simulated Ecological Data. PLoS ONE 2012, 7, e41010. [Google Scholar] [CrossRef] [PubMed] [Green Version]
  57. Nury, A.H.; Hasan, K.; Alam, M.J.B. Comparative study of wavelet-ARIMA and wavelet-ANN models for temperature time series data in northeastern Bangladesh. J. King Saud Univ.—Sci. 2017, 29, 47–61. [Google Scholar] [CrossRef]
  58. Willmott, C.J.; Robeson, S.M.; Matsuura, K. A refined index of model performance. Int. J. Climatol. 2012, 32, 2088–2094. [Google Scholar] [CrossRef]
  59. Zheng, H.; Wang, Y.; Chen, Y.; Zhao, T. Effects of large-scale afforestation project on the ecosystem water balance in humid areas: An example for southern China. Ecol. Eng. 2016, 89, 103–108. [Google Scholar] [CrossRef]
  60. Hou, Q.; Huang, X.; Han, S. Study on the forming of ‘‘small olded tree” and the transforming way in the loess plateau. J. Soil Water Conserv. 1991, 5, 64–72. [Google Scholar]
  61. Normile, D. Ecology. Getting at the roots of killer dust storms. Science 2007, 317, 314–316. [Google Scholar] [CrossRef]
  62. Reynolds, E.R.C.; Thompson, F.B. Forests, Climate, and Hydrology: Regional Impacts; United Nations University: Tokyo, Japan, 1988; p. 217. [Google Scholar]
  63. Reynolds, J.F.; Smith, D.M.S.; Lambin, E.F.; Turner, B.L.; Mortimore, M.; Batterbury, S.P.J.; Downing, T.E.; Dowlatabadi, H.; Fernandez, R.J.; Herrick, J.E.; et al. Global Desertification: Building a Science for Dryland Development. Science 2007, 316, 847–851. [Google Scholar] [CrossRef] [Green Version]
  64. McNulty, S.G.; Boggs, J.L.; Sun, G. The rise of the mediocre forest: Why chronically stressed trees may better survive extreme episodic climate variability. New For. 2014, 45, 403–415. [Google Scholar] [CrossRef]
  65. Fang, O.; Zhang, Q.B. Tree resilience to drought increases in the Tibetan Plateau. Glob. Chang. Biol. 2018, 25, 245–253. [Google Scholar] [CrossRef] [PubMed]
  66. Dudney, J.; Hobbs, R.J.; Heilmayr, R.; Battles, J.J.; Suding, K.N. Navigating Novelty and Risk in Resilience Management. Trends Ecol. Evol. 2018, 33, 863–873. [Google Scholar] [CrossRef] [PubMed]
  67. Johnstone, J.F.; Chapin, F.S.; Hollingsworth, T.N.; Mack, M.C.; Romanovsky, V.; Turetsky, M. Fire, climate change, and forest resilience in interior AlaskaThis article is one of a selection of papers from The Dynamics of Change in Alaska’s Boreal Forests: Resilience and Vulnerability in Response to Climate Warming. Can. J. For. Res. 2010, 40, 1302–1312. [Google Scholar] [CrossRef]
  68. Gazol, A.; Camarero, J.J. Functional diversity enhances silver fir growth resilience to an extreme drought. J. Ecol. 2016, 104, 1063–1075. [Google Scholar] [CrossRef]
  69. Folke, C.; Carpenter, S.; Walker, B.; Scheffer, M.; Elmqvist, T.; Gunderson, L.; Holling, C.S. Regime Shifts, Resilience, and Biodiversity in Ecosystem Management. Annu. Rev. Ecol. Evol. Syst. 2004, 35, 557–581. [Google Scholar] [CrossRef]
Figure 1. (a) Location of the Loess Plateau with respect to the national boundary of China. (b) Temporal trend of VCF tree cover in 2000–2014 (linear regression function y = 0.297x − 586.912, R2 = 0.727, p < 0.01, Willmott index dr = 0.757). (c) Map for the significance of VCF tree cover trend, INCinsig: tree cover increased insignificantly (p ≥ 0.05); INCsig: tree cover increased significantly (p < 0.05); DECinsig: tree cover decreased insignificantly (p ≥ 0.05); DECsig: tree cover decreased significantly (p < 0.05). (d) Area fraction of tree cover change in Loess Plateau and a fraction of significant increase areas (p < 0.05) caused by artificial forest and natural forest. The blue bar indicates highly increased tree coverage (HI) with a trend slope larger than 1, while the green bar indicates limited increased tree coverage (LI) with a trend slope smaller than 1).
Forests 14 00027 g001
Figure 2. Divergence of artificial and natural significant tree cover increase in Loess Plateau with trend slope larger than 1 (high increase) and smaller than 1 (limited increase) and representative zones including North Zone (NZ), East Zone (EZ), South Zone (SZ) and West Zone (WZ). ALI: Artificial forest with limited tree cover increase, AHI: Artificial forest with high tree cover increase, NLI: natural forest with limited tree cover increase, NHI: Natural forest with high tree cover increase.
Forests 14 00027 g002
Figure 3. Trends of NPP (black circle) and precipitation (P) (grey circle) in artificial and natural tree cover increase areas in 1982–1999 (NPP1 and P1) and in 2000–2014 (NPP2 and P2), respectively. (a) ALI: Artificial forest with a limited increase, (b) AHI: Artificial forest with a high increase, (c) NLI: Natural forest with a limited increase, (d) NHI: Natural forest with a high increase.
Forests 14 00027 g003
Figure 4. Annual mean NPP, ET and WUE in artificial forested (red line) and natural forested (blue line) East Zone (a,c,e) and West zone (b,d,f) in 2001–2014.
Forests 14 00027 g004
Figure 5. Resilience, resistance to P and resistance to T from 1982–1989, 1990–1999, 2000–2007 and 2008–2014.
Forests 14 00027 g005
Figure 6. Temporal changes of resilience (a), resistance to P (b) and resistance to T (c) (green: increase, brown: decrease).
Forests 14 00027 g006
Table 1. Areas (km2) for VCF tree cover increase and decrease in artificial forest and natural forest.
Area with Tree Cover Increase (km2) Area with Tree Cover Decrease (km2)Sum (km2)
Artificial forest44,33424,90269,236
Natural forest284,57147,767332,338
Disclaimer/Publisher’s Note: The statements, opinions and data contained in all publications are solely those of the individual author(s) and contributor(s) and not of MDPI and/or the editor(s). MDPI and/or the editor(s) disclaim responsibility for any injury to people or property resulting from any ideas, methods, instructions or products referred to in the content.

