Article

Growth and Mortality of Hybrid Poplar Short Rotation Culture (AF8 Clone) in Response to Clostera anastomosis L. (Lepidoptera: Notodontidae) Defoliation

by
Daniela Lupaștean
1,
Gabriela Isaia
2,*,
Iulian-Constantin Dănilă
1,
Cosmin Coșofreț
3,
Ramona Elena Scriban
1 and
Mihai-Leonard Duduman
1,*
1
Applied Ecology Laboratory, Forestry Faculty, “Ștefan cel Mare” University of Suceava, Universității Street 13, 720229 Suceava, Romania
2
Faculty of Silviculture and Forest Engineering, “Transilvania” University of Brașov, Sirul Beethoven 1, 500036 Brașov, Romania
3
Geomatics Laboratory, Forestry Faculty, “Ștefan cel Mare” University of Suceava, Universității Street 13, 720229 Suceava, Romania
*
Authors to whom correspondence should be addressed.
Forests 2023, 14(1), 20; https://doi.org/10.3390/f14010020
Submission received: 3 November 2022 / Revised: 13 December 2022 / Accepted: 16 December 2022 / Published: 22 December 2022

Abstract

:
The increasing worldwide interest in renewable energy and carbon storage has led to the development of relatively fast solutions to obtain wood biomass. The cultivation of fast-growing tree species in short-rotation crops, such as hybrid poplar clones, is one such solution, at least in temperate areas. Sometimes these monocultures are affected by disturbing factors, including severe insect defoliation, with strong destructive effects. The impact of defoliation on the growth and productivity of poplar crops is often estimated in the context of artificial defoliation. There have been few studies in which the effect of defoliation was calculated after natural defoliation. Among defoliating insect species, Clostera anastomosis L. is one of the most important defoliators of young poplars. This species developed severe defoliation in a 4-year-old poplar clone AF8 crop, from the northeastern part of Romania, in the spring and summer of 2017. The study aimed to assess the impact of defoliation both on the growth and mortality of defoliated trees and the productivity of the affected crop. To reach this goal, the height and radial growth of 150 trees with different defoliation rates (50 non-defoliated, 50 partially defoliated, and 50 completely defoliated) were measured and the defoliation symptoms and mortality were also evaluated for 4780 poplars (10% of the analyzed population). The defoliation caused a significant decrease in the annual height growth (28.6% of the partially defoliated trees and 38.5% of the completely defoliated trees) and a severe decrease in the radial growth, between 82.2% and 90.4%, respectively, depending on the defoliation rate. These strong decreases led to a significant decline in tree-level biomass accumulation, approximately 74.8% for partially defoliated trees and 83.1% for completely defoliated trees, for the year of defoliation. As a result, the loss in total biomass (for the four years of the rotation) was between 28.1% and 34.6%, respectively, depending on the defoliation rate. Therefore, the total biomass loss was 5 t·ha−1, representing approximately 70% of the forecasted production for 2017 only (approximately 7 t·ha−1).

1. Introduction

The worldwide cultivation of the fast-growing tree species in short rotation woody crops (SRWCs), especially on marginal lands or agricultural fields [1,2,3,4], represents a solution in light of the need to reduce the use of fossil fuels and increase carbon sequestration. Among the tree species suitable for this crop is poplar. Therefore, several poplar hybrids have been developed for cultivation in short rotation cycles (from 2 to 7 years). [5,6,7].
At present, the International Poplar Commission estimates that poplars are cultivated on a global scale on more than 80 million ha [8], of which 8% are SRWCs [9]. In European Union, in 2015, SRWCs exceeded 50,000 ha [10], of which approximately 2600 ha were cultivated in Romania [9]. Out of this, over 800 ha were located in the northeastern region of the country, mainly in the interfluve of the rivers Suceava and Siret, and the most performant clones were AF8 (Populus × generosa), AF2 (Populus × canadensis), and Pannonia (Populus × euroamericana) [11,12].
Most SRWCs use poplar clones with high productivity and consist of monocultures with narrow genetic and structural diversity, resulting in an increased risk of diseases and pest attacks [13,14,15,16]. Only in Europe, the list of poplar pests comprises 525 species of arthropods [17], but only a small number of species can be so harmful to trees to be considered pests [18,19]. Of these, during outbreaks, defoliating species cause severe damage to the trees, mainly in terms of growth reduction [20] as a response to leaf area loss and the subsequent decrease in the photosynthetic capacity of the affected plants [21]. Like many other broadleaved species, poplars can reflush after severe defoliation occurring in early spring, and this can attenuate the negative effect on growth. Multivoltine defoliating species can also damage the second set of leaves, severely impacting tree growth and vitality [22] and reducing biomass accumulation as defoliation rates increase [23,24]. Intense and repetitive defoliation will result in irreversible physiological decline and the mortality of the affected trees [23].
Clostera (Pygaera) anastomosis Linnaeus, 1758 (Lepidoptera: Notodontidae) is a Palearctic moth species that feeds as a larva on the leaves of poplars. The insect has two to three generations per year and hibernates as a larva in small silken nests in bark crevices on the lower trunk of colonised trees. The flight of the overwintering generation occurs from the mid-May to mid-June, the first generation flies in July-August, and, exceptionally, a second generation flight takes place in the second half of September [25,26]. Flight activity is mainly nocturnal, and adults rest on poplar leaves during the day. Females lay their eggs in clusters on the back of the leaves. The larvae in the first two instars feed gregariously, skeletonizing the leaves. From the third instar onwards, they spread into the crown, eating the whole leaf except for the main vein. Late instar larvae pupate in a cocoon woven into a wrapped leaf [27,28]. The insect causes damage to poplar crops through defoliation, which can be reduced by applying mechanical, chemical, or biological control measures. Mechanical control is carried out in early spring by ringing the trunks of trees with glue above the larvae’s hibernation zone, thus blocking the larvae’s return to the canopy. Chemical and biological control is carried out by spraying affected crops with selective chemical or biological insecticides when larvae are active [25,29,30].
This moth is one of the most dangerous defoliating pests in poplar crops, with outbreaks developing in the majority of European and Asian countries which intensively cultivate poplar hybrids [14,18,28,31,32]. The first severe outbreaks were recorded after the year 1950, mainly in Central and South Europe, in intensive hybrid poplars crops installed after World War II [11,25,33,34,35], and continued in Asia after the year 1970, specifically in Pakistan [36], Turkey [37], Japan [38], and China [39]. In Romania, poplar crops were damaged by C. anastomosis in 1955 in forest belts of Populus sp. cv ‘marilandica’ and P. sp. cv ‘harcovensis’ in Bărăgan, then in 1971 in the Prut River floodplain in a young Euroamerican poplar plantation (R18), and in intensive hybrid poplar crops in northeast of the country in the years since 2013 [11,31,40].
The defoliation effect on tree growth and biomass accumulation is often estimated by mathematical models in the context of artificial defoliation [16,24,41]. The mechanical reduction in foliage resulted in height and radial growth losses of 20%–60% [23,42,43,44]. The magnitude of the negative impact depends on the moment of the defoliation episode, with the most damage being done in June and the least in May or August [45]. Regarding the defoliation rate, significant growth losses occurred when at least 75% of the foliage was removed (20% diameter growth loss and 15% height growth loss) [16,41,46,47]. Nevertheless, natural defoliation by Chrysomela scripta F. on hybrid poplars results in a higher negative impact than artificial defoliation [48], explained by the complex reaction of the plants driven by the loss of foliage and the development of defense mechanisms [20,49,50]. Arru [28] found that defoliation by C. anastomosis has a significant impact on the growth of poplars if more than 50% of the foliage is removed, resulting in losses in terms of biomass accumulation of 10%–12%. Furthermore, if the trees are completely defoliated, the biomass yield can decrease by more than 30% and isolated mortality can occur. Lymantria dispar L. defoliation on a 7–9-year-old hybrid poplar crop reduced its height growth by 11%–15% and radial growth by 35% [51]. The defoliation of Populus euphratica plantations by Apocheima cinerarius Ershoff (1874) and Catoloca remissa Staudinger, 1892 decreased the biomass accumulation by up to 44% compared to the year before defoliation [52].
SRWCs in the North-Eastern Romania were affected by intense defoliation caused mainly by C. anastomosis, starting in 2013, with the most severe attacks occurring in the 4–5 year old crops [11,53]. The intense defoliation that occurred in 2017 in SRWCs in the northeastern region of Romania provided the conditions for a new case study. Thus, our aim was to assess the impact of natural spring and summer defoliation by C. anastomosis in short-rotation poplar crops (clone AF8) on the growth and mortality of defoliated trees.

2. Materials and Methods
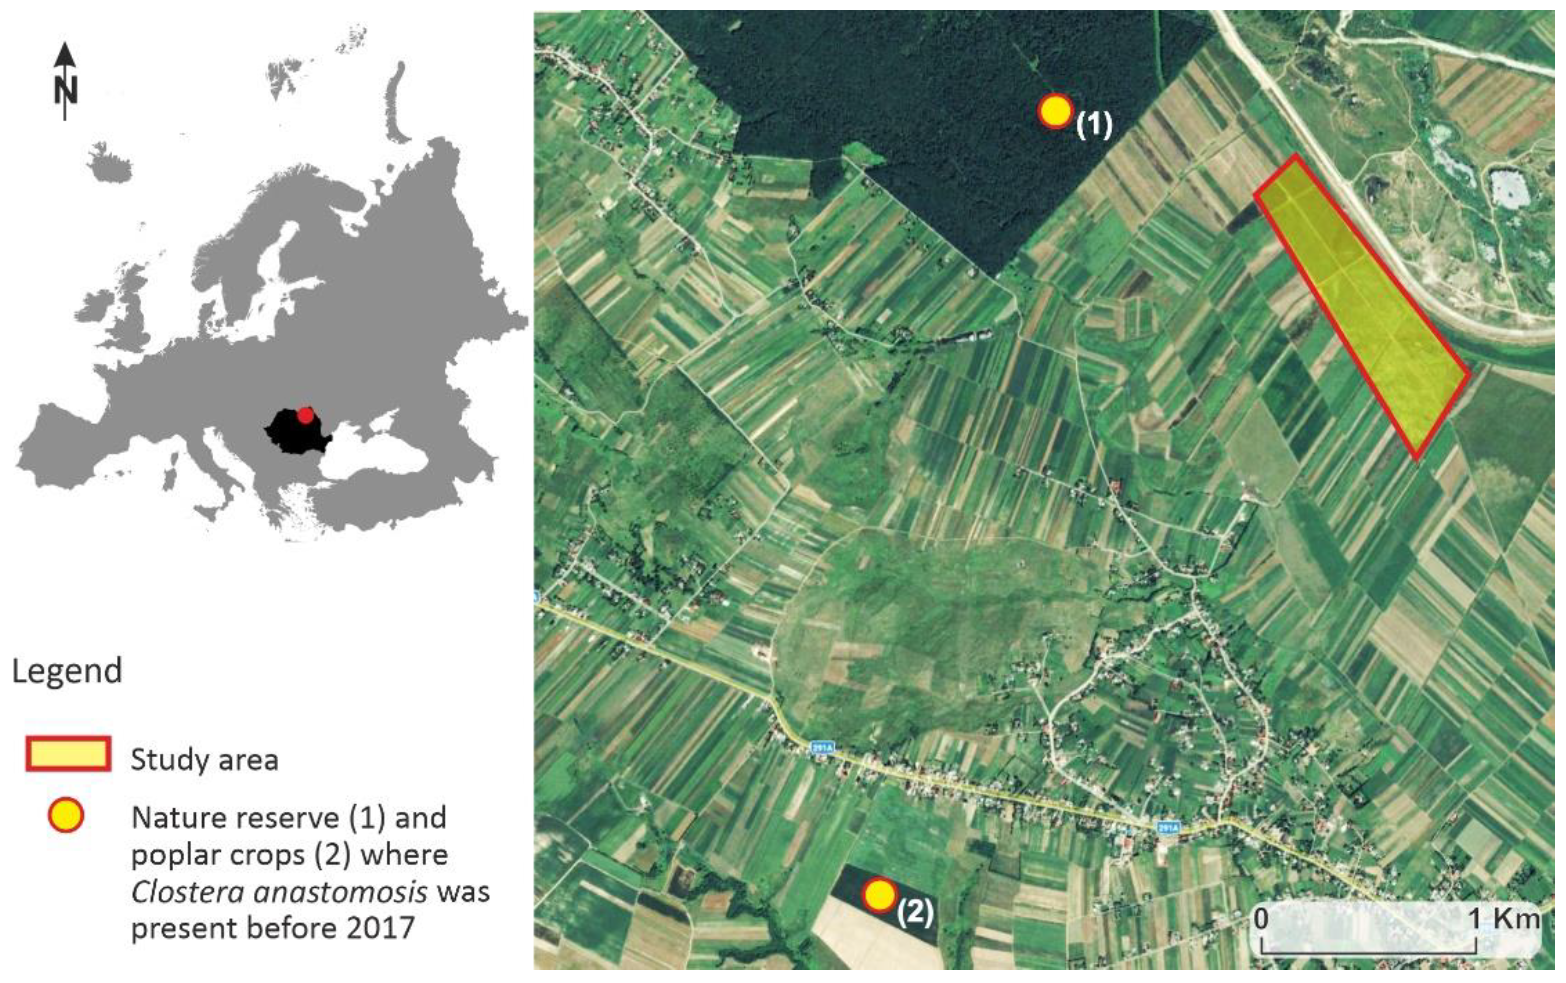
2.1. Study Area

The study area was an SRWC (clone AF8) with an area of 43 ha which was strongly damaged by C. anastomosis defoliation. It is located in the northeastern part of Romania, in the flood plain of the Siret River, within the proximity of Zvoriștea village, Suceava County (47°51′33″ N; 26°16′8″ E), at an altitude of 274 m a.s.l., and is surrounded by agricultural crops (Figure 1). The soil is predominantly alluvial (preluvosoil type), with the water table located at a depth of 1.5–2 m [54]. The climate is temperate continental, with the average annual precipitation not exceeding 600–650 mm, and the multiannual average temperature is 8 °C. The average length of the growing season varies between 160 and 170 days [55].
The intensive crop of hybrid poplar was installed in 2015 by a private investor, with the aim of obtaining energetic woody biomass after a five-year production cycle. In this regard, 2 m rods of AF8 poplar clone provided by Alasia New Clones, Italy [57], were planted at a distance of 2 m per row and 3 m between rows, resulting a density of 1667 trees·ha−1. The planting was performed by a planter carried by a tractor, the rods being thus introduced into the soil at a depth of 0.7 m. Afterward, the crops were maintained by tilling the soil between the poplar rows yearly and applying herbicides in the space between the poplars in a row.

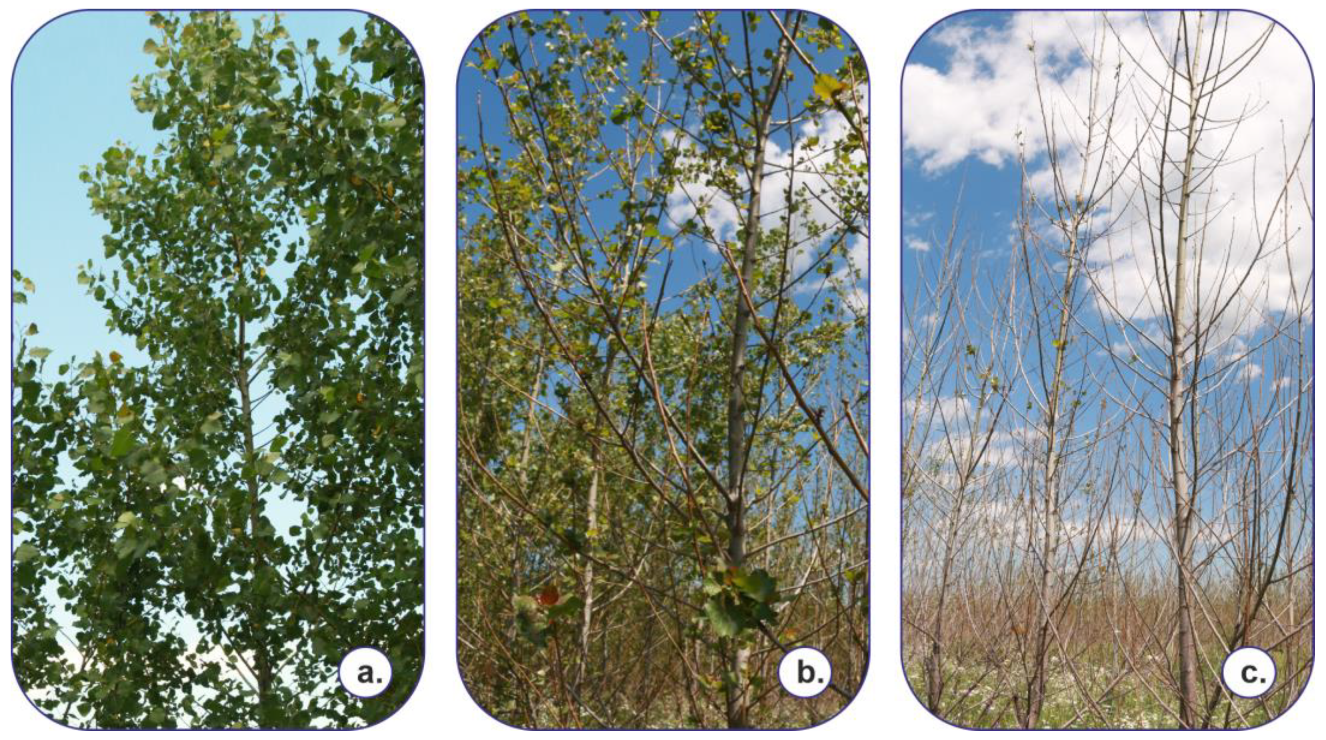
2.2. C. anastomosis Outbreak

C. anastomosis was observed for the first time in the studied area in the summer of 2016 but without significant defoliation. This species may have arrived in the poplar crop but most likely migrated from the nearby forest, 0.7 km away (point 1 in Figure 1), where C. anastomosis is natively present. It is also possible that it migrated from other hybrid poplar crops located 3 km away (point 2 in Figure 1), where severe defoliation was observed from 2014–2016 [11]. The observations performed at the end of April 2017 showed that the defoliating insect was present in the entire poplar crop. In the middle of May, the first severe defoliation produced by the larvae of the hibernating generation were noticed, with this located in groups of trees unevenly distributed throughout the crop. In July, the severe defoliation produced by the larvae of the next generation confirmed the outbreak of this pest, with most of the trees in the crop being partially or totally defoliated.

2.3. Trees Sampling and Growth Measurements

Three classes of canopy defoliation (non-, partially, and completely defoliated trees) were used to visually assess the C. anastomosis defoliation effects on crown foliage. Non-defoliated trees were those with leaves that were not affected or with less than 10% of the crown defoliated (Figure 2a). Partially defoliated trees were those that were defoliated in terms of more than one-third of the crown volume but not exceeding two-thirds (Figure 2b). Completely defoliated trees were those that were fully defoliated (Figure 2c). Therefore, at the end of September 2017, 150 randomly distributed trees were selected throughout the crop (50 trees for each defoliation class).
All selected trees were harvested, and the annual height growth and annual radial growth were measured. The annual height growth was measured in the field using a tape measure with a precision of 1 cm, with the trunk segments for each year being identified based on annual internodes. The annual radial growth was measured on stem discs sectioned at 2 m. The discs were processed in the laboratory by drying and sanding, after which they were scanned at a resolution of 2400 dpi. The annual radial growths were measured on post-scan images using the CooRecorder and CDendro work package, which ensured an accuracy of 0.01 mm [58].

2.4. Aboveground Biomass Assessment

The estimation of the aboveground biomass for the measured trees was carried out using the allometric equation (1), which calculates the individual tree biomass according to the height of the poplar tree and the diameter at a height of 2 m. This is an allometric equation specific to 4–5-year-old trees from the AF8 poplar clone, which was obtained as a result of the research carried out in the period 2012–2016 for similar poplar crops located near the current study area [12,59]. Unlike other similar equations, this one uses the diameter at a height of 2 m (using DBH would have led to inaccurate results because at the age of 4 years, at 1.3 m in height, poplar trees grown from rods exhibit over thickening as a result of the callusing of the rod end).
BM = 25.09821 6.46566   ×   H + 0.67500   ×   D 2 m + 0.37471   ×   H 2 + 0.11027   ×   D 2 m 2 ;   R = 0.9636
where BM is the aboveground biomass (in kg); H is the tree height (in m); and D2m is the diameter of the stem at 2 m above the root collar (in cm).
The tree level aboveground biomass added during 2017 is the difference between the sum of the aboveground biomass from 2014–2017 and the aboveground biomass from 2014–2016 (Equation (2)). The sum of the aboveground biomass from 2014–2016 was calculated using Equation (1), as was each tree’s height (H) and diameter (D2m) for 2016.
BM2017 = BM − BM2014–2016
where BM2017 is the annual aboveground biomass added during 2017 (in kg); BM is total aboveground biomass; and BM2014–2016 is the aboveground biomass for 2014–2016 period.

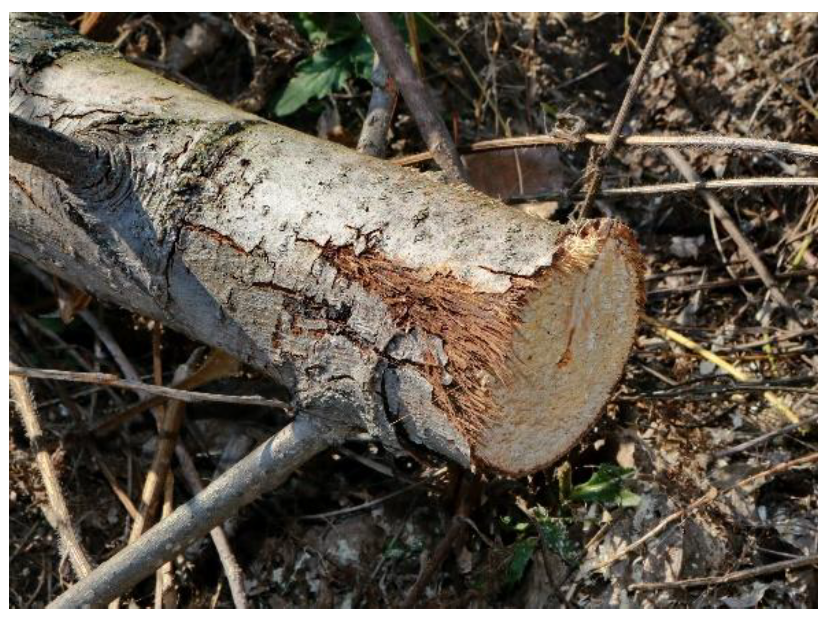
2.5. Assessment of Tree Mortality and Estimate of Biomass Loss

The severe defoliation recorded in 2017 led to the death of certain poplar trees. The proportion of dead trees was determined by the systematic sampling of 10% of the trees. Thus, on every tenth row of the plantation, all trees were inventoried and assigned to one of the three classes described previously (non-defoliated, partially defoliated, and completely defoliated). For completely defoliated ones, the root collars were carefully analyzed, and if the bark was cracked and brittle, with the phloem colored brown (the clear signs of necrosis) (Figure 3), they were considered dead due to defoliation.
Tree-level biomass loss was calculated as the differences between the average biomass accumulated from undefoliated trees and the average biomass accumulated from partially and completely defoliated trees, respectively. Next, the individual tree loss per defoliation class were multiplied by the number of trees that were assigned to a given defoliation class from an inventoried poplar row. Furthermore, defoliation class level data were added together to calculate the losses at row level, which were then extrapolated to the hectare level, taking into account the number of poplars in the row and the number of poplars per hectare.

2.6. Data Analysis

Data analyses were performed by XLSTAT-PRO (Addinsoft, New York, NY, USA) plugged into EXCEL (Microsoft Corp., Redmond, WA, USA). The effects of defoliation, on annual height and radial growth, were tested with repeated measures ANOVA using the defoliation class as the explanatory variable and the annual measurements as dependent variables. The one-way ANOVA was used to assess the defoliation effect on biomass accumulation.
Before ANOVA, data were checked for the normality (Shapiro–Wilk test) and homogeneity (Levene’s test) of the distributions. Furthermore, a post hoc Tukey’s test for multiple comparisons was applied. For ‘individual aboveground biomass’ distributions that were not normal, the data were transformed with the relationship x’ = ln(x + 1) [60] (Table A1, Appendix A).

3. Results

3.1. Defoliation Impact on Tree Growth

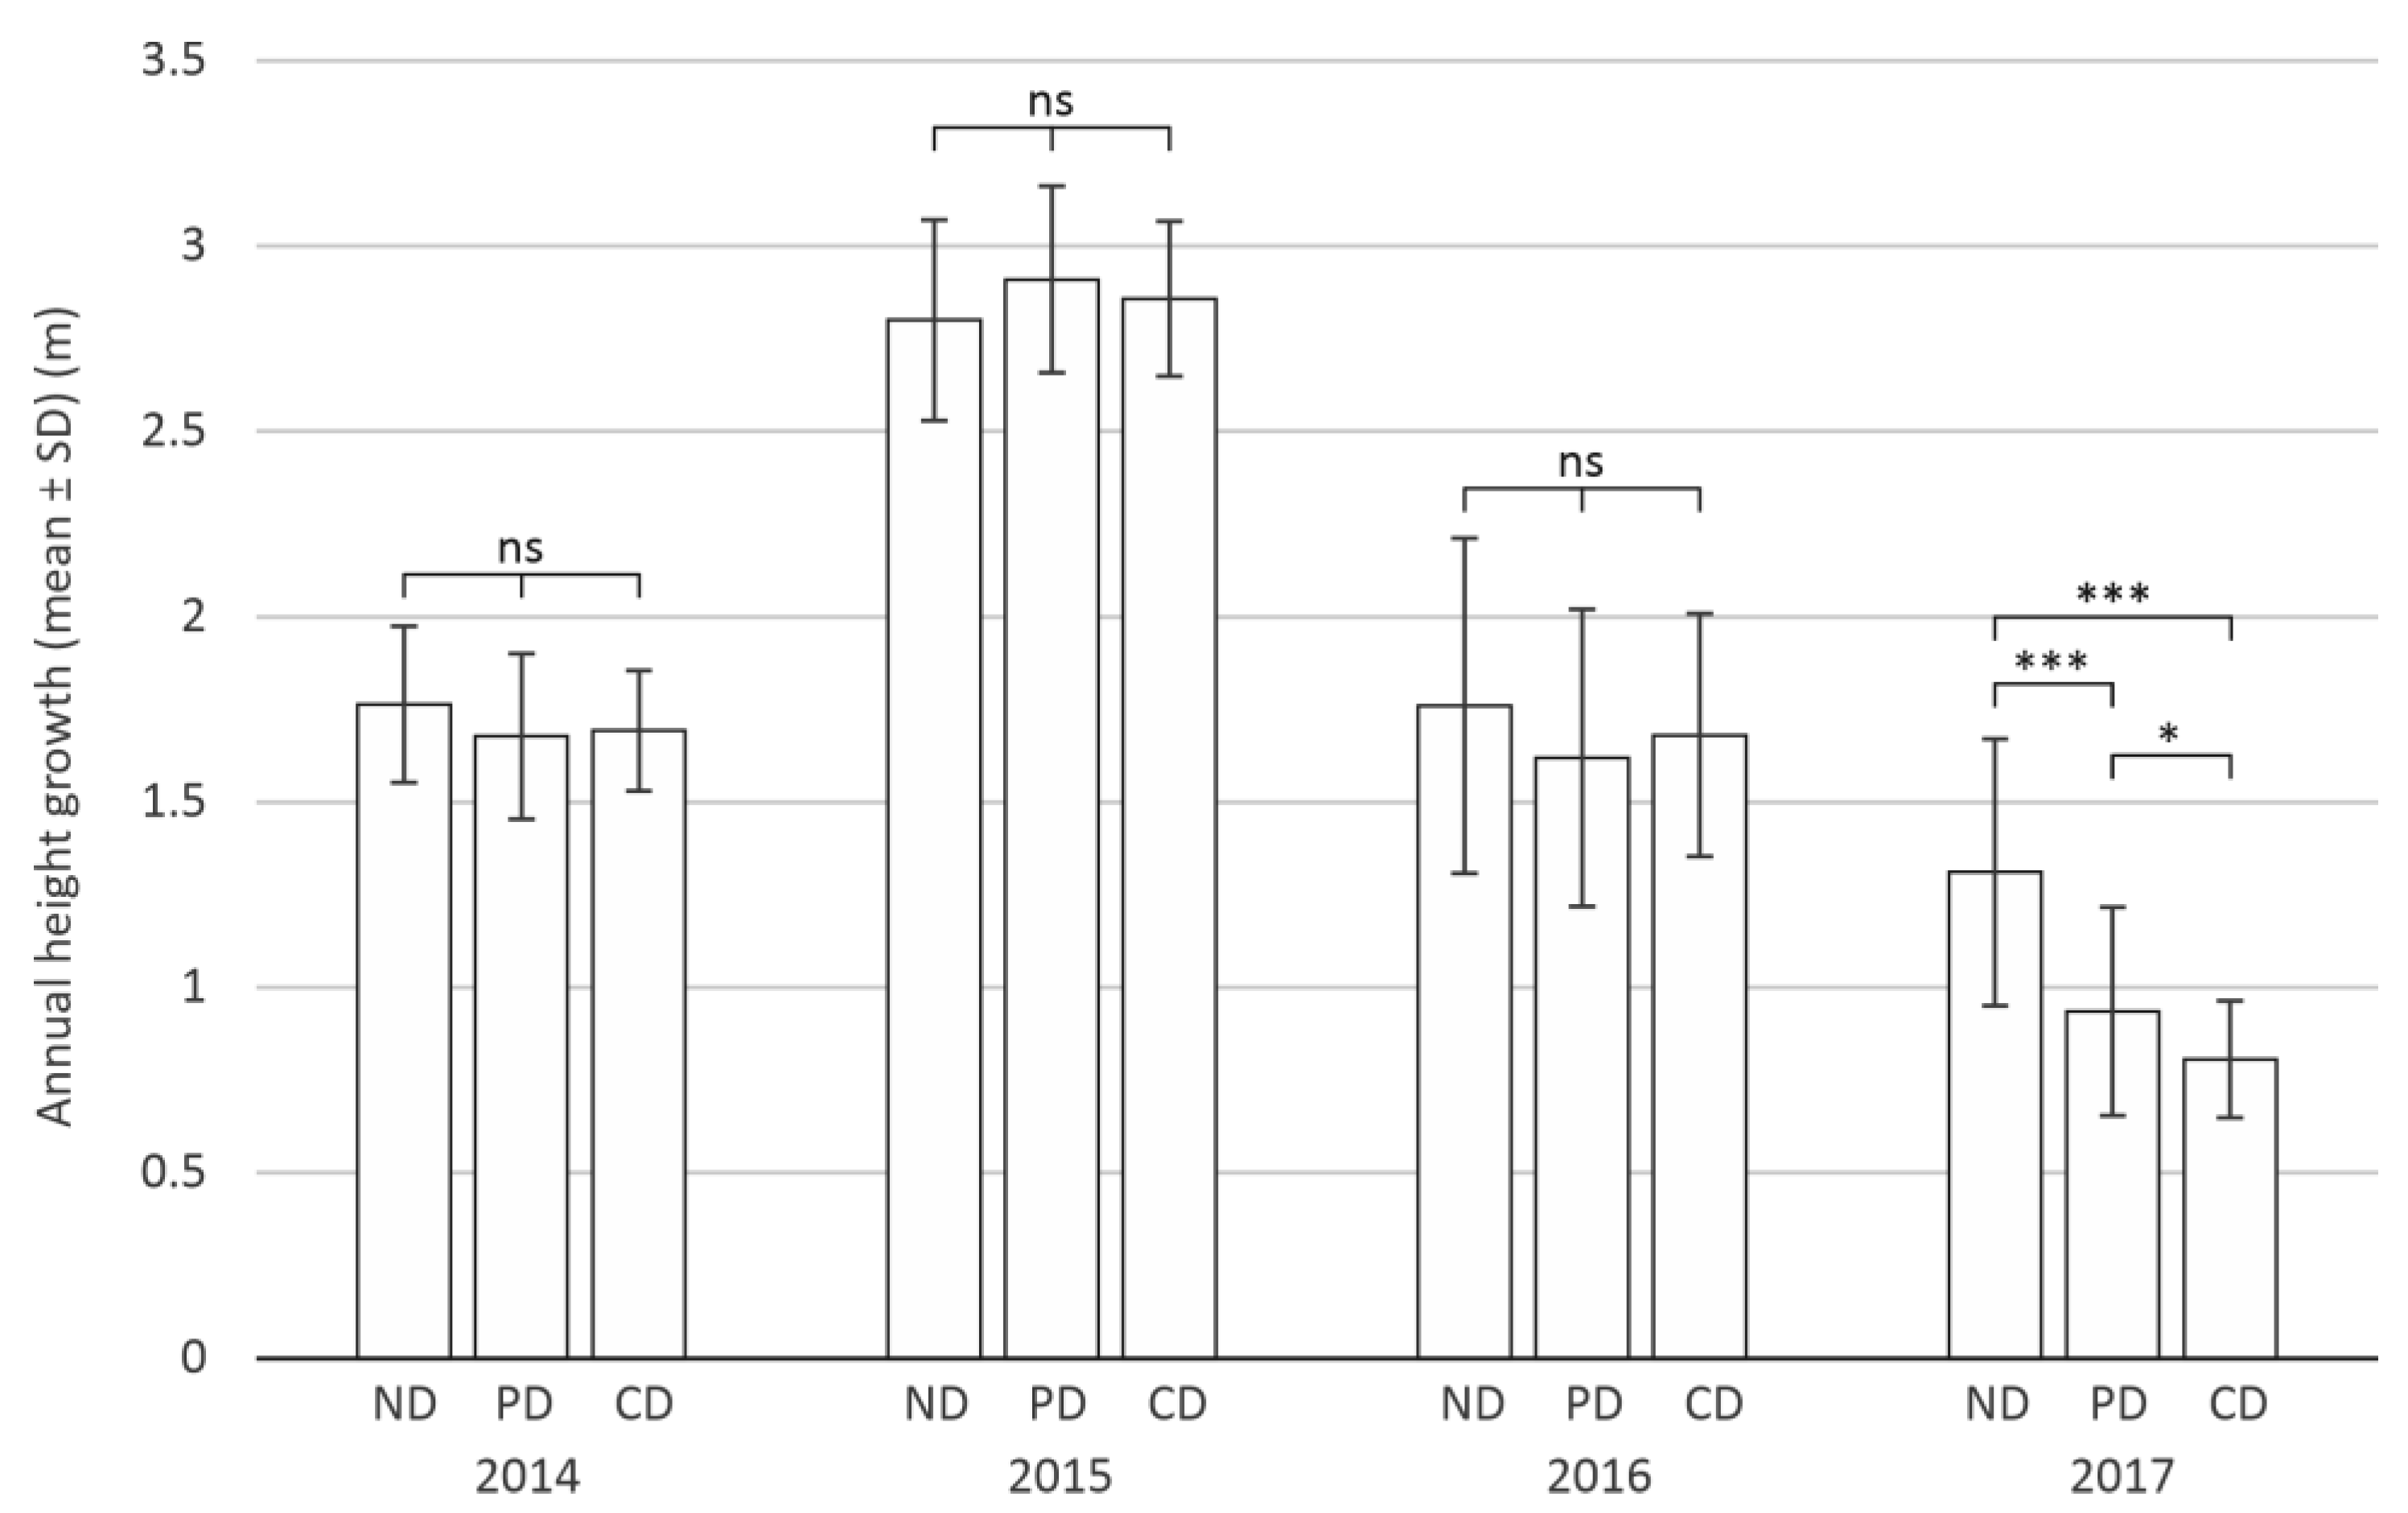
3.1.1. Annual Height Growth of Trees

The defoliation class showed a significant effect on the annual height growth from 2017 only (Table 1).
The most intense height growth was recorded in 2015 (2.8 ± 0.25 m), and in 2014 and 2016, the values were lower by approximately 40% (1.7 ± 0.21 m and 1.7 ± 0.35 m, respectively). The lowest height growth was recorded in 2017, with non-defoliated trees having approximately 54% lower height growth than in 2015. The defoliation produced in 2017 led to a significant reduction in annual height growth, with the reduction being approximately 28.6% in the case of partially defoliated trees and approximately 38.5% in those that were completely defoliated (Figure 4).

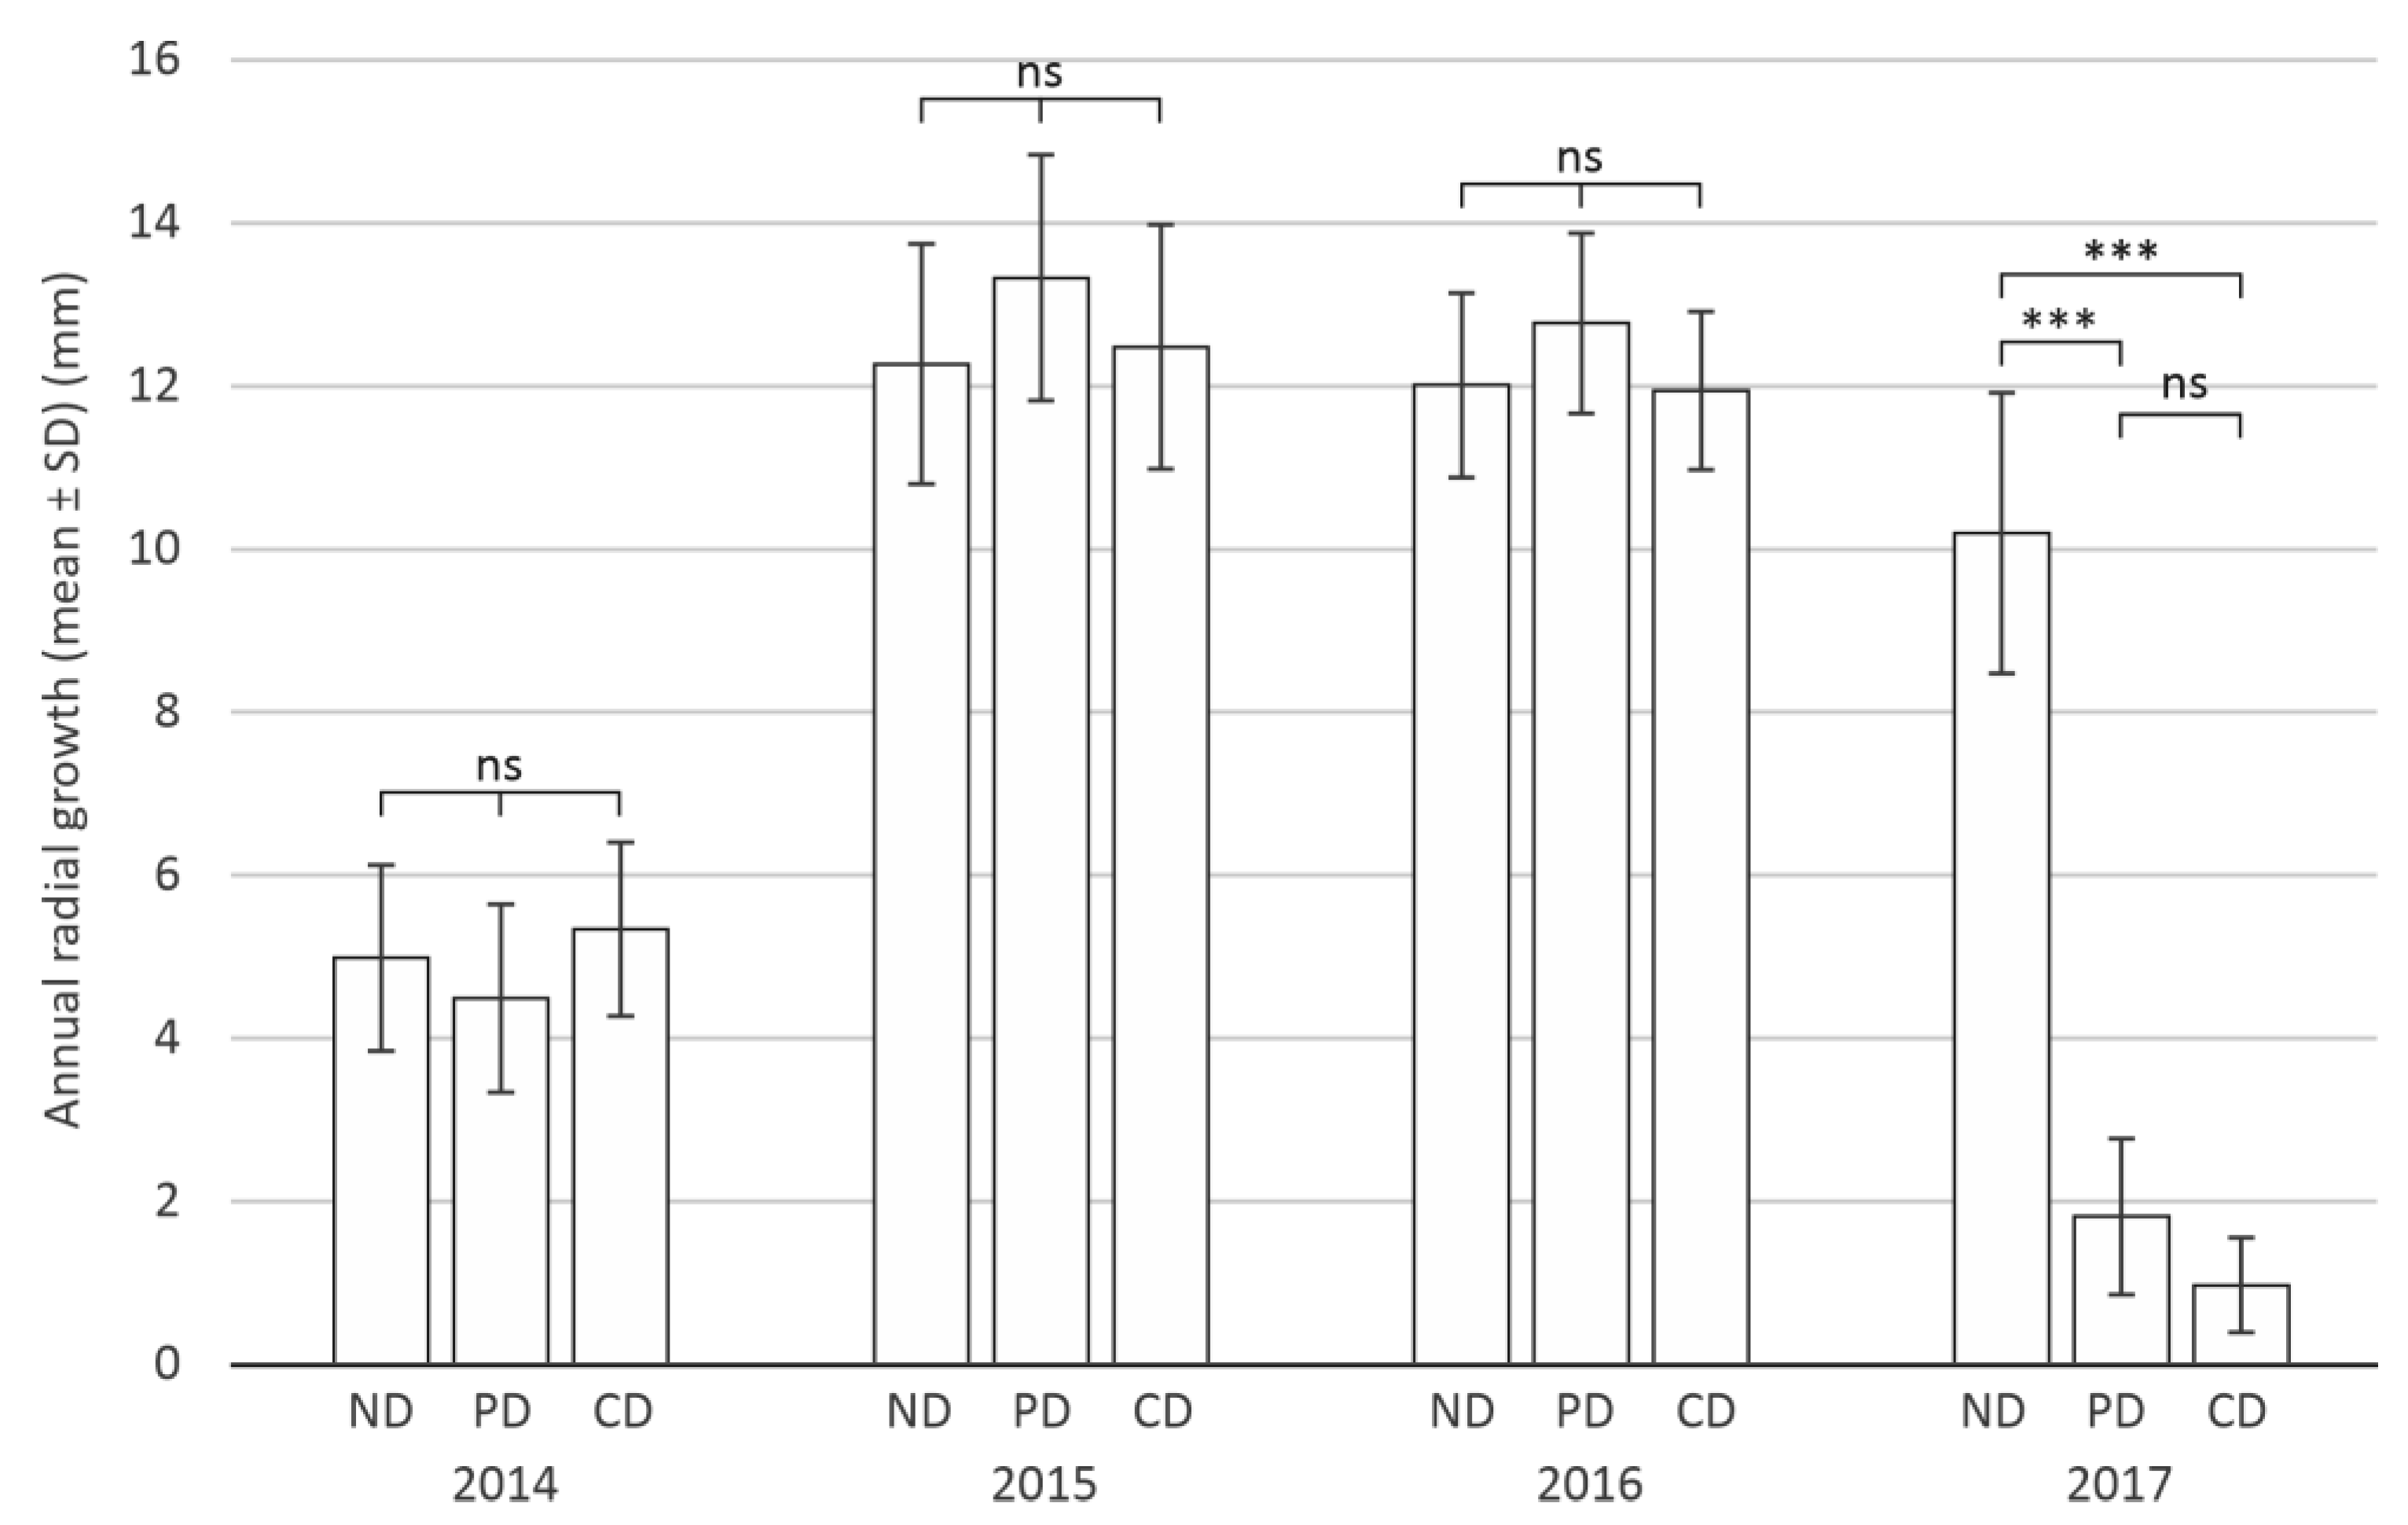
3.1.2. Annual Radial Growth of Trees

An effect of severe defoliation in 2017 was also found in the case of radial growth. As in the case of annual height growth, all three variables had a significant effect on annual radial growth (Table 2).
The highest annual radial growth was recorded in 2015 and 2016 (12.4 ± 1.71 mm and 12.2 ± 1.14 mm, respectively). In 2014, the non-defoliated trees registered the lowest radial growth, 4.9 ± 1.17 mm, with this being approximately 60.5% lower than in 2015. In 2017, the non-defoliated trees registered a radial growth of 10.2 ± 1.71 mm, approximately 17.7% lower than in 2015. The defoliated trees grew significantly less in diameter than the non-defoliated ones, with the partially defoliated trees recording reductions of approximately 82.2% and the completely defoliated ones of approximately 90.4% (Figure 5).

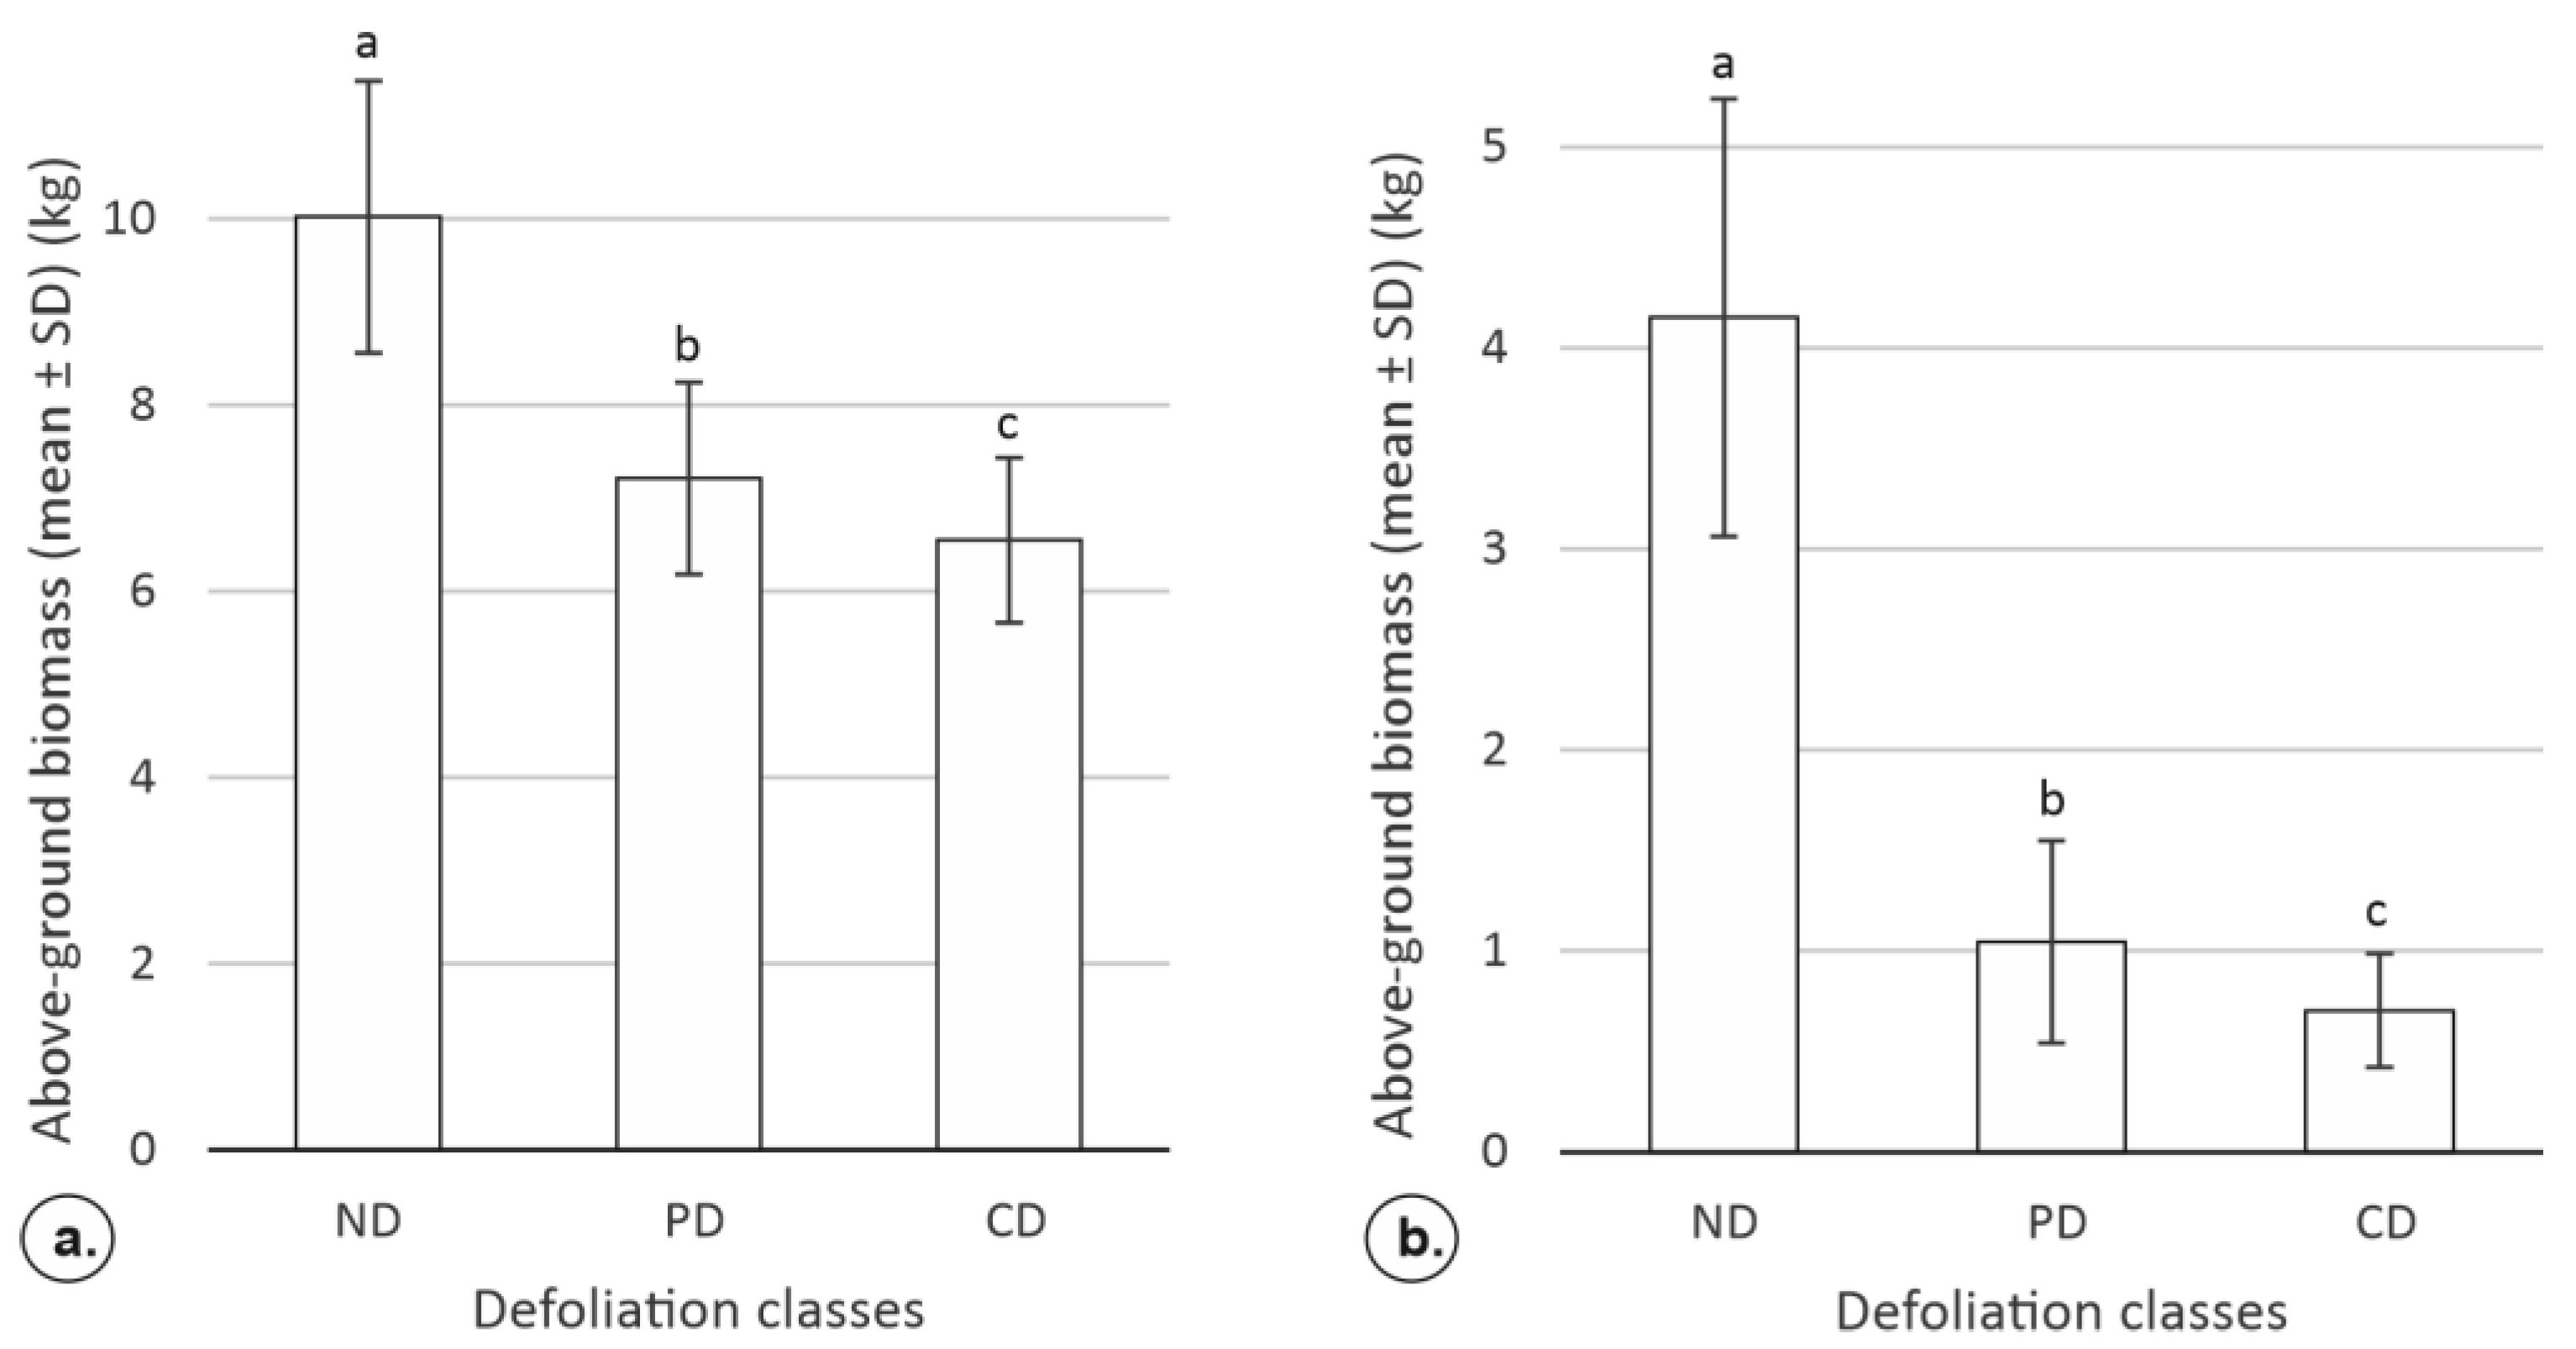
3.1.3. The Impact of Defoliation on the Tree-level Aboveground Biomass

The severe defoliation produced by C. anastomosis in the spring and summer of 2017 led to a significant reduction in aboveground biomass accumulation in the affected trees (Table 3).
The non-defoliated trees accumulated 10.0 ± 1.46 kg, the partially defoliated trees had lower accumulations, approximately 28.1% (7.2 ± 1.03 kg) lower, and the completely defoliated ones had accumulations that were approximately 34.6% (6.6 ± 0.88 kg) lower after four growing seasons (Figure 6a). Regarding aboveground biomass accumulation in 2017, the non-defoliated trees accumulated significantly more biomass than the defoliated ones (Figure 6). Thus, the non-defoliated trees accumulated 4.2 ± 1.09 kg, approximately 74.8% more than the partially defoliated ones (1.0 ± 0.51 kg) and 83.1% more than those that were completely defoliated (0.70 ± 0.28 kg) (Figure 6b).

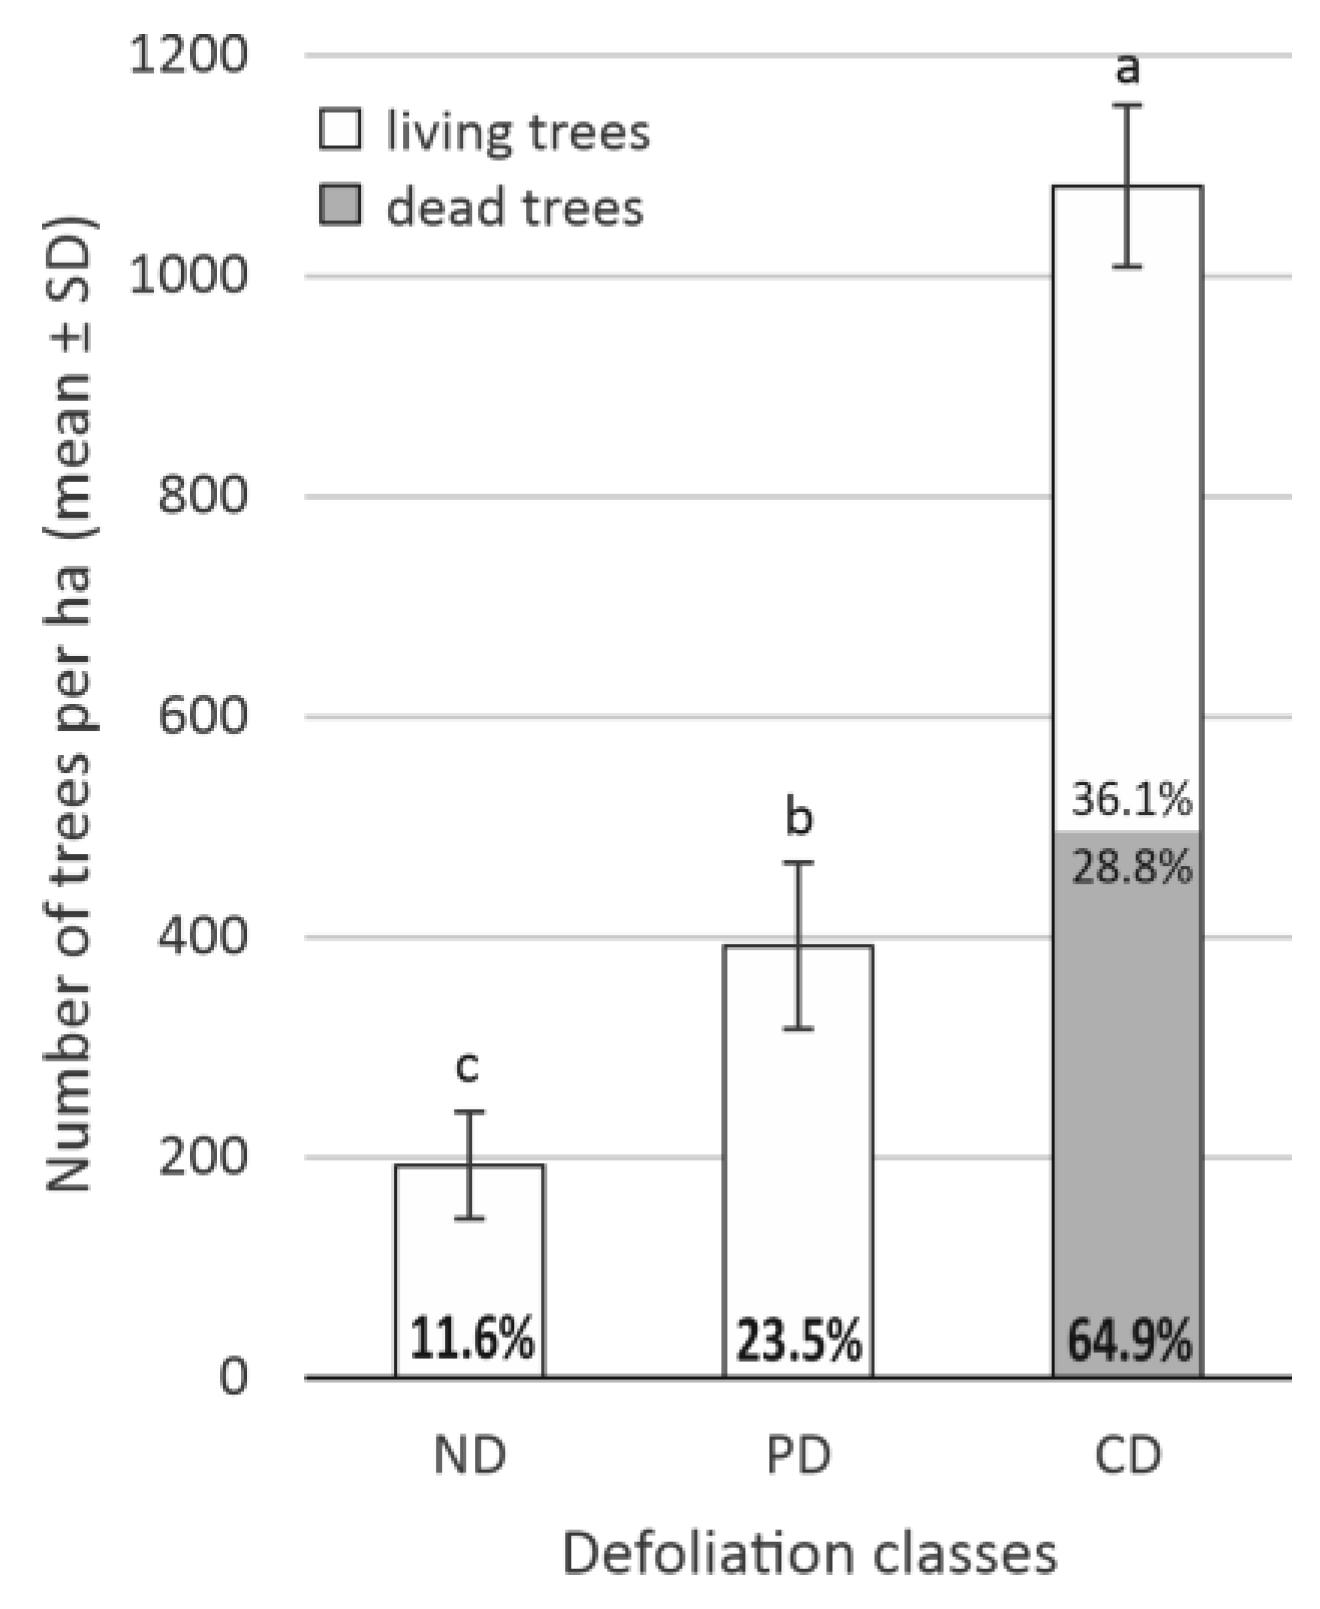
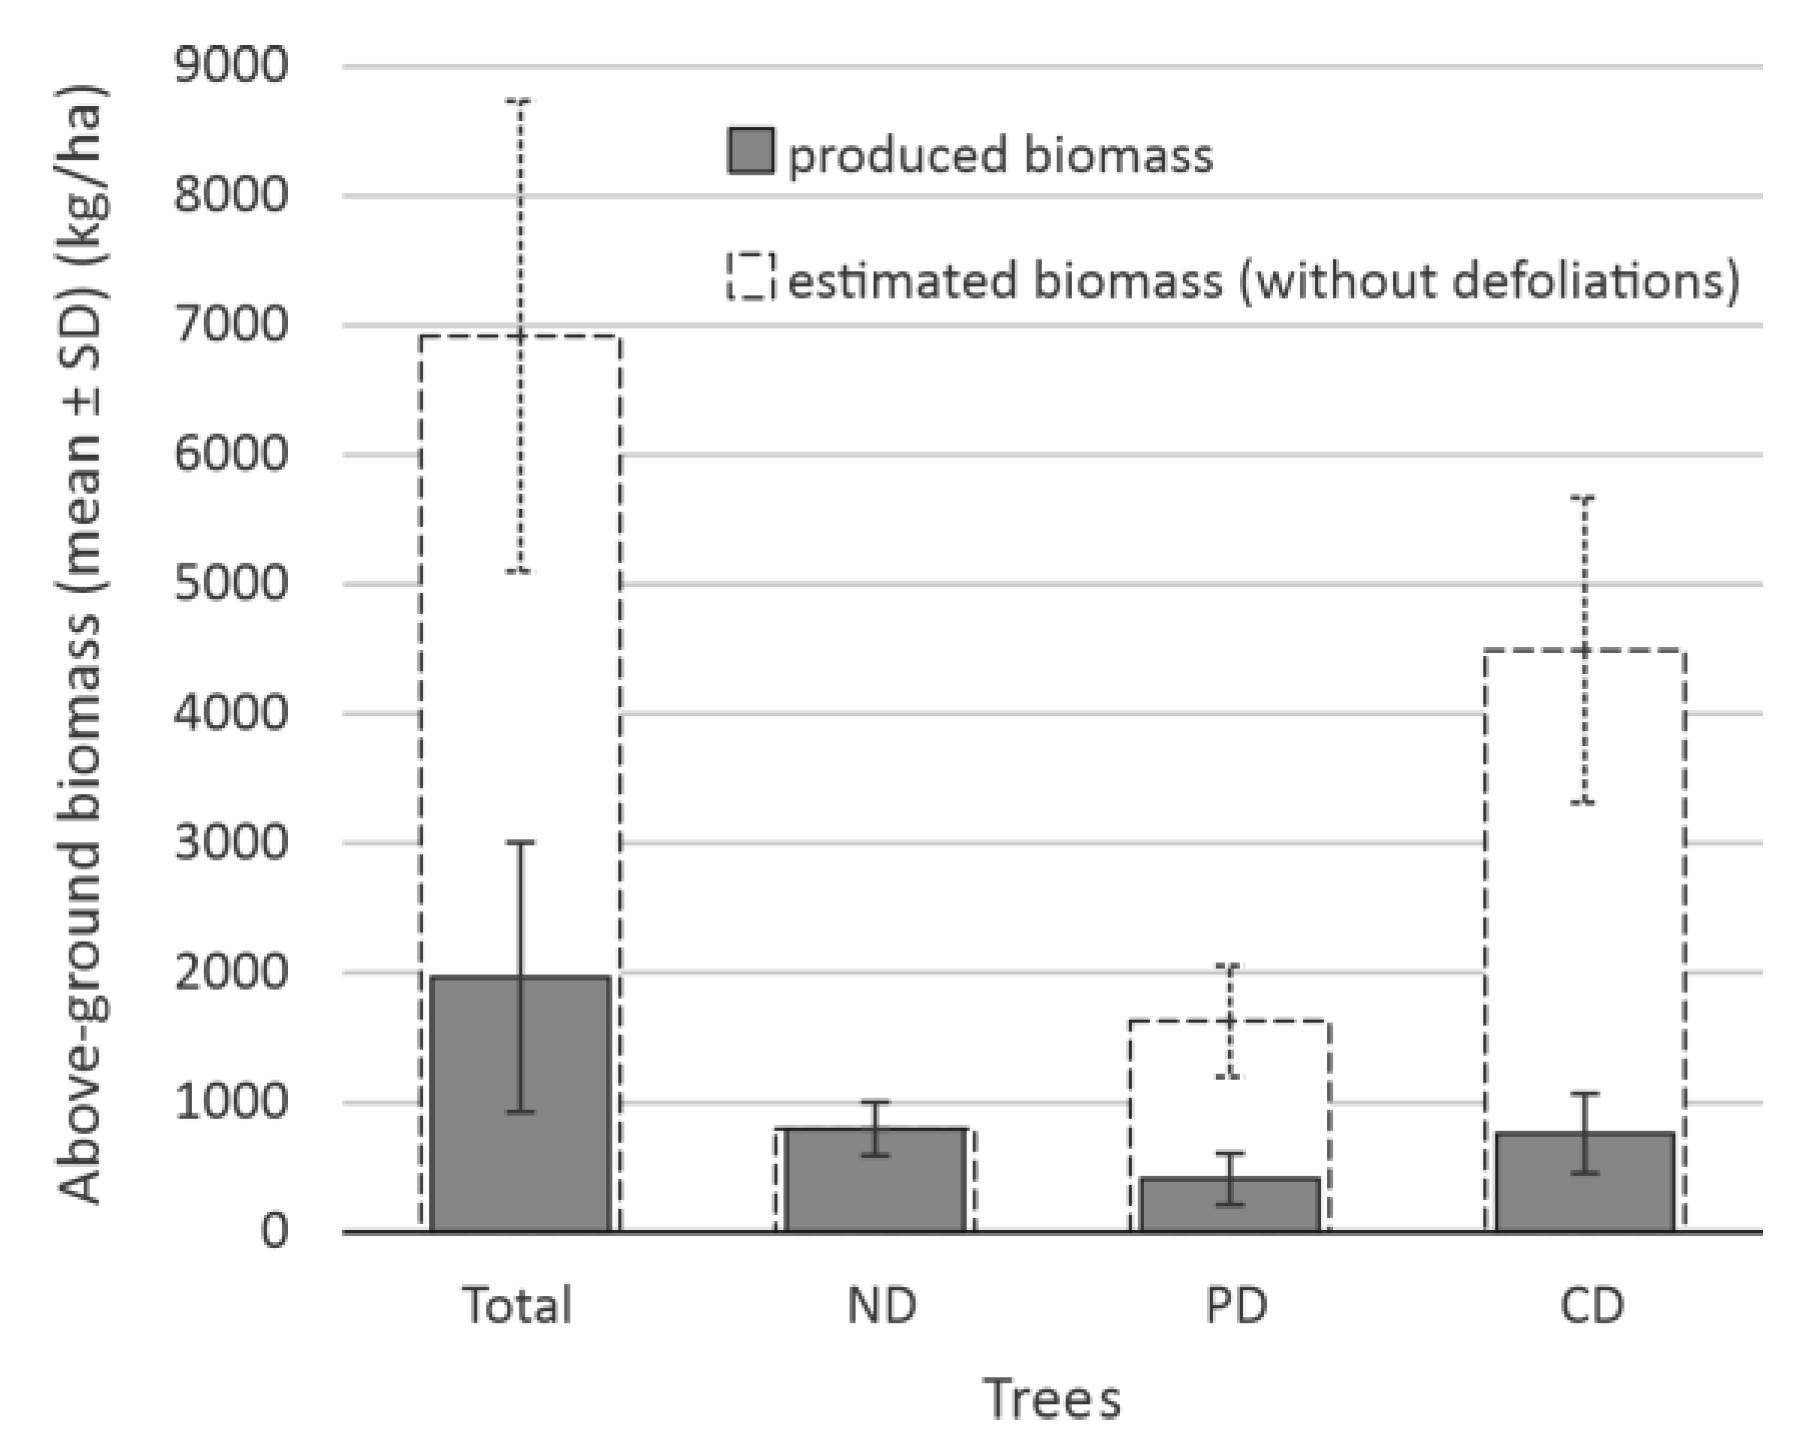
3.2. The Impact of Defoliation on Crop and Aboveground Biomass Losses

Significant differences were found between the number of trees per hectare in each defoliation class (Table 4).
In 2017, 88.4% of the 4780 analyzed poplar trees showed symptoms of C. anastomosis attack. Of these, 3102 trees were completely defoliated (64.9% or 1082 specimens/ha) and 1123 trees (23.5% or 392 specimens/ha) were partially defoliated. Only 555 trees did not show obvious symptoms of defoliation (11.6% or 192 specimens/ha) (Figure 7).
Regarding tree mortality after total defoliation, it was found that of the total trees analysed, 1379 completely defoliated trees were dead. The mortality per inventoried tree row was 137.9 + 38.6, resulting in 480.2 + 131.6 dead trees·ha−1 (28.8% of the planting trees–1667 trees·ha−1) (Figure 7).
The average loss at tree-level recorded after the partial defoliation produced in 2017 was 3.1 ± 0.59 kg, leading to a loss per hectare of approximately 1215 ± 231 kg·ha−1 (depending on the proportion of partially defoliated trees). In the case of completely defoliated trees (which in 2017 reduced their biomass accumulations, with an average of 3.4 ± 0.81 kg), the cumulative losses per hectare were approximately 3731 ± 760 kg·ha−1. The total biomass loss per hectare was approximately 4946 ± 1104 kg·ha−1, thus leading to a 70.2% reduction in production per ha in 2017 (Figure 8).
The analysis of poplar crop productivity during the four years (2014–2017) showed that, if it had not been affected by defoliation, the crop would have accumulated approximately 16709 ± 2438 kg·ha−1. However, the effect of defoliation led to an average accumulation of 11840 ± 1648 kg·ha−1, at a loss of approximately 29%.

4. Discussion

4.1. Defoliation Impact on Individual Poplars’ Growth

This case study confirmed the major negative impact of C. anastomosis on the productivity and stability of short-rotation poplar crops, an aspect stated by previous research both in short-rotation poplar crops [25,61] and in artificial young poplar stands (at least 20 years old) [13,26,28]. Nevertheless, the developed studies addressed the impact of natural defoliation produced by C. anastomosis on annual height growth, radial growth, and biomass accumulation at the individual tree level or on the entire affected crop and only to a small extent [48,51,52,62].
Tree growth is expected to vary from one year to another depending on the precipitation variability and soil water content during the growing season [63,64]. During the first three years, the height and radial growth of trees in this study followed the trend recorded in other poplar crops near to the studied area [59].
In 2017, defoliation significantly affected the height growth of the damaged poplars, with the reduction rate (28.6%–38.5%) reaching higher levels compared to the majority of the studies based on artificial defoliation of poplar trees of a similar age. Total defoliation in 4-year-old Robusta clone poplars led to an 18% reduction in height growth [43], and successive defoliations totalling 75% of the foliage led to 12% reductions [24]. The height growth for the defoliated trees on 75%–100% of the foliage was 42%–76% smaller compared to non-defoliated trees in the case of one-year-old poplars [16,41]. However, to a lesser extent, the height growth for 2017 may have been less affected by defoliation than radial growth as height growth, at the beginning of the season, uses the resources accumulated from previous year. The maximum effect of defoliation was observed in July, despite the fact that the height growth of the poplar starts in May and reaches its maximum in June [65,66].
Additionally, radial growth was significantly affected by C. anastamosis attacks, with the trees with partial or complete defoliation managing to accumulate very little in diameter. This is not surprising, since most of the growth in diameter occurs in the second part of the growing season, increasing towards the end of the height growth period [65,67], when most trees were already defoliated. However, the defoliation produced by L. dispar (spring defoliation) on 7–9-year-old poplars led to a reduction in diameter growth of approximately 35% [51]. This was most likely due to the affected trees managing to regenerate their foliage and continuing their accumulation, which did not happen in the present case, where successive defoliation occured. Artificial defoliation of more than 50% intensity, produced in spring, led to reductions in radial growth of up to 44% [43,46]. In contrast, the defoliation produced in July led to reductions in radial growth of 60% [23,44] and even 88% in one-year-old poplars [41].
As expected, the reduction in the height and radial growth of poplar trees affected by defoliation led to a significantly lower accumulation in aboveground biomass. The losses found in this study (28.1–34.6%) were similar to those reported by Arru [28] for similar attacks (30%) but lower than for complete artificial defoliation carried out for several consecutive years, when losses reached 60% of the total volume of trees [23,44].
However, it would appear that in certain cases, the effect of natural defoliation (produced by Crysomela scripta) is stronger than that of artificial defoliation [48], and sometimes, in the case of late defoliation, the affected trees strongly disrupt the process of lignification, with serious consequences during the winter [23,44].

4.2. The Impact of Defoliation on Poplar Crop and Aboveground Biomass Losses

The defoliation recorded in the studied poplar crop was of high intensity according to the provision of technical norms in Romania [68]. In the last ten years, in Romania, the area of crops and stands with an intensification in the severity of attacks produced by C. anastamosis increased to over 50% of the total infested areas (over 2000 ha of poplar crops and stands in 2012) [11]. The reasons for this phenomenon are diverse, starting with the restriction of the use of pesticides and continuing with the increase in the proportion of 3–7 year crops.
On the other hand, the loss caused by C. anastomosis defoliation in the poplar crops were similar to those produced by severe droughts [69,70] or by the lack of soil maintenance works [71]. In the present study, the loss reached approximately 5 t·ha−1 dry biomass in 2017, representing approximately 70% of the potential yield, estimated at approximately 7 t·ha−1. The estimated biomass production [72] for poplar crops with a 5-year rotation cycle and a density of 1667 trees ha−1 [63] is approximately 10 t·ha−1·year−1 for our study area. However, in the last 10 years in various crops in northeastern Romania, biomass production varied between 5–7.5 t·ha−1·year−1 [12,72]. In this context, defoliation with an intensity similar to that in the present study leads to losses comparable to the average production for one year, in our case even more (as the average of the four growing seasons (unaffected by defoliation) is approximately 4.2 t·ha−1·year−1).
In the case of this study, the poplar crop affected by defoliation was harvested in the cold season after the defoliation. As a result, it was not possible to assess the impact of the attack on the growth of poplars which remained alive in the next year. However, it is known that the effects of defoliation, at least of an artificial nature, on trees grown in short-rotation poplar crops are felt mainly in the following two seasons, after the occurrence of the defoliation, when their productivity is lower than that of non-defoliated trees [73]. The defoliated trees become more sensitive to the effect of extreme climatic factors (drought, floods, early frosts) because they have less developed root systems [24,74], and sometimes they do not complete the lignification of young shoots, resulting in a significant risk of frost injury during the winter [23,44].

5. Conclusions

This study has shown the effects of Clostera anastomosis defoliation on the growth of hybrid poplar trees in a short rotation culture. Defoliated trees had significantly less high and radial growth than those that were non-defoliated. The height growth loss was between 28.6% and 38.5% and the radial growth loss was 82.2%–90.4%.
The insect attack led to a significant reduction in individual aboveground biomass, 74.8%–83.1%, in 2017. The yield loss per hectare was between 28.1%–34.6% for 2014–2017 and approximately 70% for 2017, while the mortality exceeded one-quarter of the poplar trees.
The impact of defoliators can lead to severe economic losses for poplar growers. In order to avoid situations similar to those described in the present study, it is recommended to monitor the presence and activity of defoliating insects in intensive poplar crops. If potential outbreaks are identified, quick intervention through control measures is recommended to limit the growth of the defoliator population and avoid potential damage.

Author Contributions

Conceptualization, M.-L.D., D.L. and G.I.; methodology, M.-L.D.; investigation, I.-C.D., C.C. and R.E.S.; resources, M.-L.D. and I.-C.D.; data curation, M.-L.D.; writing—original draft preparation, D.L. and G.I.; writing—review and editing, M.-L.D., C.C. and I.-C.D.; visualization, M.-L.D. and R.E.S.; funding acquisition, I.-C.D. All authors have read and agreed to the published version of the manuscript.

Funding

This research was funded by the Romanian Ministry of Research, Innovation and Digitization, through the projects: PN-III-P2-2.1-BG-2016-0376 Tehno-Crops, contract no. 30BG/2016 (M.L.D., I.C.D., C.V.C., R.E.S.) and Program 1—Development of national research and development system, Subprogram 1.2—Institutional Performance—RDI excellence funding projects, under contract no. 10PFE/2021 (M.L.D., I.C.D., C.V.C.).

Data Availability Statement

On reasonable request, derived data supporting the findings of this study are available from the corresponding authors.

Acknowledgments

The authors thank the three anonymous reviwers for their valuable and constructive recommendations, which contributed to the improvement of the paper, and Tudor Stăncioiu for his help in improving the English language.

Conflicts of Interest

The authors declare no conflict of interest.

Appendix A

Table A1. Results of normality (Shapiro–Wilk test) and homogeneity (Levene’s test) tests for the growth parameters analyzed.
ParameterYearShapiro–Wilk TestLevene’s Test
UndefoliatedPartially DefoliatedTotal Defoliated
WpWpWpFp
Height Growth20140.98090.59010.98000.55400.99150.97421.13020.3258
20150.95650.06360.97020.23590.98870.91151.75190.1770
20160.96940.21830.96280.11600.91510.05160.61700.5410
20170.96920.21370.96750.18220.96160.10400.70320.4096
Radial growth20140.96400.13110.95090.05710.97560.38420.57440.5643
20150.95740.06900.96870.20460.98170.62370.18980.8373
20160.97360.32340.98280.67390.98470.75970.70570.4954
20170.65740.05040.94170.02570.97540.37673.04490.0592
Individual aboveground biomass20170.96540.14930.96870.20400.97940.527919.3594<0.0001
2017 *0.96870.20400.97240.28970.97940.52790.64490.0592
Total period0.94440.11030.96900.21030.98100.59511.94020.1473
Number of trees per hectare0.96880.87950.94560.61630.92690.41830.93730.4041
Note: * test values after data transformation (x’ = ln(x + 1)); W—statistic value for Shapiro–Wilk test; F—statistic value for Levene’s test.

References

  1. Long, H.; Li, X.; Wang, H.; Jia, J. Biomass resources and their bioenergy potential estimation: A review. Renew. Sustain. Energy Rev. 2013, 26, 344–352. [Google Scholar] [CrossRef]
  2. Verma, A.K.; Chettri, D.; Verma, A.K. Biomass, Bioenergy, and Biofuels. In Industrial Microbiology and Biotechnology; Verma, P., Ed.; Springer: Singapore, 2022; pp. 463–485. [Google Scholar]
  3. Banaś, J.; Utnik-Banaś, K. Using Timber as a Renewable Resource for Energy Production in Sustainable Forest Management. Energies 2022, 15, 2264. [Google Scholar] [CrossRef]
  4. Jukka, L.; Miika, M.; Lauri, L.; Mirja, M.; Ville, U.; Lassi, L. A financial and environmental sustainability of circular bioeconomy: A case study of short rotation coppice, biochar and greenhouse production in southern Finland. Biomass Bioenergy 2022, 163, 106524. [Google Scholar] [CrossRef]
  5. Landgraf, D.; Carl, C.; Neupert, M. Biomass Yield of 37 Different SRC Poplar Varieties Grown on a Typical Site in North Eastern Germany. Forests 2020, 11, 1048. [Google Scholar] [CrossRef]
  6. Bouriaud, L.; Duduman, M.L.; Danila, I.-C.; Olenici, N.; Biris, I.-A.; Ciornei, I.; Barnoaiea, I.; Maciuca, A.; Savin, A.; Grosu, L. How to evaluate the sustainability of short-term cultures for biomass production? An application from NE Romania. Poljopr. I Sumar. 2015, 61, 7. [Google Scholar] [CrossRef]
  7. F.A.O. Poplars and Other Fast-Growing Trees—Renewable Resources for Future Green Economies. Synthesis of Country Progress Reports. In Proceedings of the 25th Session of the International Poplar Commission, Berlin/Heidelberg, Germany, 13–16 September 2016; Working Paper IPC/15. Forestry Policy and Resources Division; FAO: Rome, Italy, 2016; Available online: http://www.fao.org/forestry/ipc2016/en/ (accessed on 12 September 2022).
  8. IPC. The Contribution of Poplars and Willows to Sustainable Forestry and Rural Development. Synthesis of Country Progress Reports; Working Paper IPC/3; IPC: Bonn, Germany, 2004. [Google Scholar]
  9. FAO. Improving lives with poplars and willows. Synthesis of country progress reports. In Proceedings of the 24th Session of the International Poplar Commission, Dehradun, India, 29 October–2 November 2012; Working Paper IPC/12. FAO: Rome, Italy, 2012. Available online: www.fao.org/forestry/ipc2012/en (accessed on 12 September 2022).
  10. Lindegaard, K.N.; Adams, P.W.R.; Holley, M.; Lamley, A.; Henriksson, A.; Larsson, S.; von Engelbrechten, H.-G.; Esteban Lopez, G.; Pisarek, M. Short rotation plantations policy history in Europe: Lessons from the past and recommendations for the future. Food Energy Secur. 2016, 5, 125–152. [Google Scholar] [CrossRef] [Green Version]
  11. Duduman, M.-L.; Lupaștean, D.; Nețoiu, C.; Tomescu, R. Research carried out in Romania on ecology and management of the poplar defoliator Clostera (Pygaera) anastomosis L. (Lepidoptera: Notodontidae). In Proceedings of the Biennial International Symposium Forest and Sustainable Development Brasov, Brașov, Romania, 25–27 October 2018; pp. 13–24. [Google Scholar]
  12. Dănilă, I.C. Cercetări Biometrice Privind Productivitatea Clonelor de Plop Hibrid în Culturi cu Ciclu Scurt de Producție din Nord-Estul României; Editura Universității „Ștefan cel Mare”: Suceava, România, 2019; p. 224. [Google Scholar]
  13. Tomescu, R.; Nef, L. Leaf eating insect damage on different poplar clones and sites. Ann. For. Sci. 2007, 64, 99–108. [Google Scholar] [CrossRef] [Green Version]
  14. Tomescu, R.; Nețoiu, C. Insecte care Produc Vătămări Plopului și Salciei; Sivică, E., Ed.; Editura Silvică: București, Romania, 2009; p. 217. [Google Scholar]
  15. Lapietra, G.; Allegro, G. Insects damaging poplars in Italy during 198-89, control strategies and future perspectives. In Proceedings of the Working Party on Insects and Other Animal Pests, Buenos Aires, Argentina, 19–23 March 1990; p. 6. [Google Scholar]
  16. Helbig, C.E.; Müller, M.G.; Landgraf, D. Effects of Leaf Loss by Artificial Defoliation on the Growth of Different Poplar and Willow Varieties. Forests 2021, 12, 1224. [Google Scholar] [CrossRef]
  17. Delplanque, A. Les Insectes Associés aux Peupliers; Editions Memor: Bruxelles, Belgium, 1998; 421p. [Google Scholar]
  18. De Tillesse, V.; Nef, L.; Charles, J.; Hopkin, A.; Augustin, S. Damaging poplar Insects—Internationally Important Species; FAO: Rome, Italy, 2007. [Google Scholar]
  19. Pötzelsberger, E.; Gossner, M.M.; Beenken, L.; Gazda, A.; Petr, M.; Ylioja, T.; La Porta, N.; Avtzis, D.N.; Bay, E.; De Groot, M.; et al. Biotic threats for 23 major non-native tree species in Europe. Sci. Data 2021, 8, 210. [Google Scholar] [CrossRef]
  20. Stevens, M.; Kruger, E.; Lindroth, R. Variation in tolerance to herbivory is mediated by differences in biomass allocation in aspen. Funct. Ecol. 2008, 22, 40–47. [Google Scholar] [CrossRef]
  21. Christersson, L.; Ramstedt, M.; Forsberg, J. Pests, diseases and injuries in intensive short-rotation forestry. In Ecophysiology of Short Rotation-Forest Crops; Mitchell, C.P., Ed.; Elsevier Science Publisher: London, UK, 1992; pp. 185–216. [Google Scholar]
  22. Ciesla, W. Forest Entomology: A Global Perspective; Wiley: New York, NY, USA, 2011; p. 416. [Google Scholar]
  23. Kulman, H.M. Effects of Insect Defoliation on Growth and Mortality of Trees. Annu. Rev. Entomol. 1971, 16, 289–324. [Google Scholar] [CrossRef]
  24. Reichenbacker, R.R.; Schultz, R.C.; Hart, E.R. Artificial Defoliation Effect on Populus Growth, Biomass Production, and Total Nonstructural Carbohydrate Concentration. Environ. Entomol. 1996, 25, 632–642. [Google Scholar] [CrossRef]
  25. Duduman, M.L.; Lupaștean, D.; Pînzanu, Ș.I.; Ilașcă, A.; Dănilă, I. Treatment efficacy of Clostera anastomosis L. caterpillars control in postdormancy phase. Bucov. For. 2015, 15, 167–176. [Google Scholar]
  26. Tomescu, R.; Nețoiu, C. Pyagera (Clostera) anastomosis Linnaeus, 1758 (Lepidoptera, Notodontidae)—an insect with an increased damaging potential of poplars and willows. In Proceedings of the Biennial International Symposium, Forest and Sustainable Development, Braşov, Romania, 15–16 October 2010; pp. 217–228. [Google Scholar]
  27. Pașcovici, V.; Nemeș, I. Studii privind sistematica, bioecologia și răspândirea geografică a speciei Clostera (=Pygaera) anastomosis L. (Lep. Notodontidae), din R.S. România. Stud. Și Comunicări De Ocrotirea Nat. 1973, III, 451–462. [Google Scholar]
  28. Arru, G.M. Pygaera anastomosis (L.) (Lepidoptera Notodontidae)—Studio morfologico ed etologico. Boll. Di Zool. Agrar. E Di Bachic. 1965, 2, 207–272. [Google Scholar]
  29. Tang, F.; Wang, Y.-y.; Gao, X.-w. In vitro inhibition of carboxylesterases by insecticides and allelochemicals in Micromelalopha troglodyta (Graeser)(Lepidoptera: Notodontidae) and Clostera anastomosis (L.)(Lepidoptera: Notodontidae). J. Agric. Urban Entomol. 2008, 25, 193–203. [Google Scholar] [CrossRef]
  30. Lacey, L.A.; Grzywacz, D.; Shapiro-Ilan, D.I.; Frutos, R.; Brownbridge, M.; Goettel, M.S. Insect pathogens as biological control agents: Back to the future. J. Invertebr. Pathol. 2015, 132, 1–41. [Google Scholar] [CrossRef] [Green Version]
  31. Pașcovici, V. Clostera (Pygaera) anastomosis L., un defoliator periculos al monoculturilor de plop cu vegetația slăbită. Rev. Pădurilor 1973, 88, 308–311. [Google Scholar]
  32. Singh, A.P. Poplar leaf defoliators, Clostera spp. (Lepidoptera: Notodontidae). In Poplars and Willows Trees for Society and the Environment; Isebrands, J.G., Richardson, J., Eds.; CABI; FAO: Rome, Italy, 2014; pp. 488–490. [Google Scholar]
  33. Mikloš, I. Kvaliteta hrane kao jedan od uzroka masovnih pojava topolina čupavog prelca (Pygaera anastomosis L.) u nasadima euroameričkih topola. Šumarski List 1971, 95, 53–83. [Google Scholar]
  34. Mikloš, I. Pygaera anastomosis L.—Novi štetnik na topolama. Šumarski List 1960, 84, 368–370. [Google Scholar]
  35. Kailidis, D.S. Das Pappelinsektenproblem in Griechenland. Anz. Für Schädlingskunde 1969, 42, 167–171. [Google Scholar] [CrossRef]
  36. Chaudhry, M.I.; Admad, I. Biology of Ichthyura anastomosis Steph., a common hairy defliator of poplars in Pakistan. Pak. J. For. 1974, 24, 55–68. [Google Scholar]
  37. Özay, F.Ș.; Güler, N.; Uluer, K.; Selek, F. Investigation on Pygaera (Clostera) anastomosis L. which is harmfull on poplars. Teknġk Bülten 2000, 191, 1–19. [Google Scholar]
  38. Kamata, N. Outbreaks of forest defoliating insects in Japan, 1950–2000. Bull. Entomol. Res. 2002, 92, 109–117. [Google Scholar] [CrossRef]
  39. Li, H.-X.; Wang, Z.-Y.; Guo, S.-P.; Xie, S.-P. Bioassay of Clostera anastomosis granulosis virus. J. For. Res. 2006, 17, 50–52. [Google Scholar] [CrossRef]
  40. Ștefănescu, M.; Nițescu, C.; Simionescu, A.; Iliescu, G. Starea Fitosanitară a Pădurilor și Culturilor Forestiere din R.S. România; Editura Ceres-București: Bucharest, Romania, 1980; p. 527. [Google Scholar]
  41. Rubio, A.; Loetti, V.; Bellocq, I. Effect of defoliation intensity and timing on the growth of Populus alba and Salix babylonica × Salix alba. Bosque 2013, 34, 353–358. [Google Scholar] [CrossRef] [Green Version]
  42. Fransen, J.J.; Houtzagers, G. Loss of increment as a result of defoliation, and the seasonal growth of Poplars. Ned. Boschb. Tijdschr. 1946, 18, 36–39. [Google Scholar]
  43. Joly, R. Influence des défoliateurs forestiers sur l’accroissement. Rev. For. Française 1959, 1959, 775–784. [Google Scholar] [CrossRef] [Green Version]
  44. Kamilovski, M. Determining the best time to destroy defoliators of poplar. God. Zborn. Zemi. Sum. Fak. Univ. Skopje 1966, 19, 157–186. [Google Scholar]
  45. Hodson, A. The response of aspen (Populus tremuloides) to artificial defoliation! Mich. Entomol. Soc. 1981, 14, 167–169. [Google Scholar]
  46. Bassman, J.; Myers, W.; Dickmann, D.; Wilson, L. Effects of simulated insect damage on early growth of nursery-grown hybrid poplars in northern Wisconsin. Can. J. For. Res. 1982, 12, 1–9. [Google Scholar] [CrossRef]
  47. Moulinier, J.; Lorenzetti, F.; Bergeron, Y. Growth and mortality of trembling aspen (Populus tremuloides) in response to artificial defoliation. Acta Oecologica 2014, 55, 104–112. [Google Scholar] [CrossRef]
  48. Coyle, D.R.; McMillin, J.D.; Hall, R.B.; Hart, E.R. Cottonwood leaf beetle (Coleoptera: Chrysomelidae) defoliation impact on Populus growth and above-ground volume in a short-rotation woody crop plantation. Agric. For. Entomol. 2002, 4, 293–300. [Google Scholar] [CrossRef] [Green Version]
  49. Krause, S.C.; Raffa, K.F. Defoliation tolerance affects the spatial and temporal distributions of larch sawfly and natural enemy populations. Ecol. Entomol. 1996, 21, 259–269. [Google Scholar] [CrossRef]
  50. Hartley, S.E.; Lawton, J.H. Effects of Different Types of Damage on the Chemistry of Birch Foliage, and the Responses of Birch Feeding Insects. Oecologia 1987, 74, 432–437. [Google Scholar] [CrossRef]
  51. Kosola, K.; Dickmann, D.; Paul, E.; Parry, D. Repeated insect defoliation effects on growth, nitrogen acquisition, carbohydrates, and root demography of poplars. Oecologia 2001, 129, 65–74. [Google Scholar] [CrossRef]
  52. Schäfer, P.; Saleh, M.; Yu, R.; Zhang, X.; Thomas, F.M. Decrease in growth increment of Populus euphratica upon defoliation by Lepidopteran larvae in a Central-Asian floodplain forest. J. Arid. Environ. 2017, 146, 99–102. [Google Scholar] [CrossRef]
  53. Duduman, M.-L.; Lupaștean, D. Cercetări Privind Monitorizarea și Controlul Populațiilor de Insecte ce Produc Vătămări Culturilor de Plop cu Ciclu Scurt de Producție—Raport de Cercetare, Beneficiar F.E. AGRAR Dornești; Universitatea ”Ștefan cel Mare”: Suceava, Romania, 2015; p. 15. [Google Scholar]
  54. Clinovschi, F.; Palaghianu, C. Studiu asupra structurii vegetatiei lemnoase din Rezervatia Zamostea-Lunca. An. Univ. Stefan Cel Mare Suceava-Sect. Silvic. 2007, 9, 19–28. [Google Scholar]
  55. Popovici, O.G.; Cenușă, R.L.; Savin, A. Vegetation conditions of "Zamostea-Luncă" Reserve. Rev. De Silvic. Și Cinegetică 2014, 19, 142–147. [Google Scholar]
  56. Google Maps. Zvoriștea Village, Suceava County, Romania. Available online: https://earth.google.com/web/@47.85737964,26.26597711,273.94124377a,3225.27234918d,35y,0h,0t,0r (accessed on 10 October 2022).
  57. Alasia. AF8—Populus × Generosa; Alasia Green Forest: Cavallermaggiore, Italy, 1993. [Google Scholar]
  58. Larsson, L. CooRecorder and Cdendro Programs of the Coorecorder/Cdendropackage Version 7.6. Available online: http://www.cybis.se/forfun/dendro (accessed on 2 February 2018).
  59. Dănilă, I.-C.; Duduman, M.-L.; Palaghianu, C.; Bouriaud, L.; Bouriaud, O.; Coșofret, C.; Savin, A.; Scriban, R. PN III Tehno-Crops—Optimization of Short-Cycle Hybrid Poplar Technology for Superior Biomass Production; ”Ștefan cel Mare” University of Suceava, Forestry Faculty: Suceava, Romania, 2017; p. 27. [Google Scholar]
  60. Zar, J.H. Biostatistical Analysis, 5th ed.; Pearson Prentice Hall: Hoboken, NJ, USA, 2010. [Google Scholar]
  61. Nordman, E.E.; Robison, D.J.; Abrahamson, L.P.; Volk, T.A. Relative resistance of willow and poplar biomass production clones across a continuum of herbivorous insect specialization: Univariate and multivariate approaches. For. Ecol. Manag. 2005, 217, 307–318. [Google Scholar] [CrossRef]
  62. Nebeker, T.E.; Stone, W.D.; Beatty, T.L. Impact of herbivory by cottonwood leaf beetle on three selected cottonwood clones: Year 2 results. In Proceedings of the 13th Biennial Southern Silvicultural Research Conference, Memphis, TN, USA, 28 February–4 March 2005; Connor, K.F., Ed.; Gen. Tech. Rep. SRS–92. U.S. Department of Agriculture, Forest Service, Southern Research Station: Asheville, NC, USA, 2006; pp. 420–423. [Google Scholar]
  63. Dănilă, I.-C.; Mititelu, C.; Palaghianu, C. Productivity of Short-Rotation Poplar Crops: A Case Study in the NE of Romania. Forests 2022, 13, 1089. [Google Scholar] [CrossRef]
  64. Dănilă, I.C.; Avăcăriței, D.; Savin, A.; Roibu, C.C.; Bouriaud, O.; Duduman, M.-L.; Bouriaud, L. Dinamica şi caracteristicile creşterii a şase clone de plop hibrid pe parcursul unui ciclu de producţie într-o plantație comparativă din Depresiunea Rădăuţi. Bucov. For. 2015, 15, 19–30. [Google Scholar]
  65. Schulze, E.D.; Beck, E.; Buchmann, N.; Clemens, S.; Müller-Hohenstein, K.; Scherer-Lorenzen, M.; Arneth, A.; Zähle, S.; Sierra, C.; Schäfer, M. Plant Ecology; Springer: Berlin/Heidelberg, Germany, 2019; p. 700. [Google Scholar]
  66. Ceulemans, R.; Deraedt, W. Production physiology and growth potential of poplars under short-rotation forestry culture. For. Ecol. Manag. 1999, 121, 9–23. [Google Scholar] [CrossRef]
  67. Niez, B.; Dlouha, J.; Moulia, B.; Badel, E. Water-stressed or not, the mechanical acclimation is a priority requirement for trees. Trees 2019, 33, 279–291. [Google Scholar] [CrossRef]
  68. M.A.P.A.M. Technical Rules for the Forest Protection; Technical rule No 6; Monitorul Oficial: Bucharest, Romania, 2003; p. 454. [Google Scholar]
  69. Krabel, D.; Meyer, M.; Solger, A.; Müller, R.; Carvalho, P.; Foulkes, J. Early root and aboveground biomass development of hybrid poplars (Populus spp.) under drought conditions. Can. J. For. Res. 2015, 45, 1289–1298. [Google Scholar] [CrossRef]
  70. Jing, D.W.; Xing, S.J.; Du, Z.Y.; Liu, F.C. Effects of drought stress on the growth, photosynthetic characteristics, and active oxygen metabolism of poplar seedlings. Ying Yong Sheng Tai Xue Bao 2013, 24, 1809–1816. [Google Scholar]
  71. Avăcăriței, D.; Savin, A.; Palaghianu, C.; Dănilă, I.-C. The effect of harrowing and weed control on biomass yields of hybrid poplar crops. Bucov. For. 2016, 16, 175–185. [Google Scholar] [CrossRef] [Green Version]
  72. Werner, C.; Haas, E.; Grote, R.; Gauder, M.; Graeff-Hönninger, S.; Claupein, W.; Butterbach-Bahl, K. Biomass production potential from Populus short rotation systems in Romania. GCB Bioenergy 2012, 4, 642–653. [Google Scholar] [CrossRef]
  73. Bell, A.C.; Clawson, S.; Watson, S. The long-term effect of partial defoliation on the yield of short-rotation coppice willow. Ann. Appl. Biol. 2006, 148, 97–103. [Google Scholar] [CrossRef]
  74. Bach, C.E. Effects of herbivory and genotype on growth and survivorship of sand-dune willow (Salix cordata). Ecol. Entomol. 1994, 19, 303–309. [Google Scholar] [CrossRef]
Figure 1. Location of defoliated poplar crop and potential sources (yellow dots, 1 and 2) of Clostera anastomosis (Satellite image source: Google Earth, July 2017 [56]).
Forests 14 00020 g001
Figure 2. Poplar trees affected by different degrees of defoliation ((a)—non-defoliated; (b)—partially defoliated; (c)—completely defoliated).
Forests 14 00020 g002
Figure 3. The root collar of a completely defoliated and dry poplar tree.
Forests 14 00020 g003
Figure 4. Annual height growth of trees for the period 2014–2017. ND—non-defoliated trees; PD—partially defoliated trees; CD—completely defoliated trees. The symbols above the error bars indicate the significance of the differences between the means of annual height growth depending on defoliation classes according to Tukey’s multiple comparison test (p < 0.05) (ns—not statistically significant (p > 0.05); * significant (p < 0.05); *** very highly significant (p < 0.001)).
Forests 14 00020 g004
Figure 5. Annual radial growth of poplar trees for the period 2014–2017. ND—non-defoliated trees; PD—partially defoliated trees; CD—completely defoliated trees The symbols above the error bars indicate the significance of the differences between the means of radial height growth depending on defoliation classes according to Tukey’s multiple comparison test (p < 0.05) (ns—not statistically significant (p > 0.05); *** very highly significant (p < 0.001)).
Forests 14 00020 g005
Figure 6. Aboveground biomass of poplar trees for the period 2014–2017 (a) and in 2017 (b). ND—non-defoliated trees; PD—partially defoliated trees; CD—completely defoliated trees. Bars with different lowercase letters indicate significant differences according to Tukey’s multiple comparison test (p < 0.05).
Forests 14 00020 g006
Figure 7. Distribution of the average number of trees per ha according to defoliation classes. ND—non-defoliated trees; PD—partially defoliated trees; CD—completely defoliated trees. Bars with different lowercase letters indicate significant differences according to Tukey’s multiple comparison test (p < 0.05).
Forests 14 00020 g007
Figure 8. The aboveground biomass per hectare in 2017 and the estimated aboveground biomass in the absence of defoliation. ND—non-defoliated trees; PD—partially defoliated trees; CD—completely defoliated trees.
Forests 14 00020 g008
Table 1. Summary statistics for differences between annual height growths depending on the defoliation class (repeated measures ANOVA).
Explanatory
Variable
Dependent Variabled.f.Sum of SquaresMean
Squares
Fp
Defoliation class Ih 201420.21140.10572.58290.0790
Ih 201520.29970.14982.44380.0904
Ih 201620.49090.24541.52860.2203
Ih 201726.87233.436143.2759<0.0001
Note: Ih—the annual height growth; d.f.—degrees of freedom; F—statistic value for ANOVA test.
Table 2. Summary statistics for differences between annual radial growths depending on the defoliation class (repeated measures ANOVA).
Explanatory
Variable
Dependent Variabled.f.Sum of SquaresMean
Squares
Fp
Defoliation class Ir 201420.21380.10692.47530.0678
Ir 201520.14870.07382.14260.1203
Ir 201620.52080.26041.62790.2348
Ir 201722598.11891299.0594907.1418<0.0001
Note: Ir—the annual radial growth; d.f.—degrees of freedom; F—statistic value for ANOVA test.
Table 3. Summary statistics for differences between total biomass accumulation and previous year biomass accumulation, depending on the defoliation class (ANOVA one way).
Aboveground Biomass Acumulated in:Explanatory
Variable
DFSum of SquaresMean SquaresFp
2014–2017 periodDefoliation class2347.8928173.9464126.8460<0.0001
2017Defoliation class2364.6105182.3052339.4080<0.0001
Note: d.f.—degrees of freedom; F—statistic value for ANOVA test.
Table 4. Summary statistics for differences between number of trees per hectare depending on the defoliation class (ANOVA one way).
Explanatory VariableDFSum of SquaresMean SquaresFp
Defoliation class24,346,683.46002,173,341.7300436.1694<0.0001
Note: d.f.—degrees of freedom; F—statistic value for ANOVA test.
Disclaimer/Publisher’s Note: The statements, opinions and data contained in all publications are solely those of the individual author(s) and contributor(s) and not of MDPI and/or the editor(s). MDPI and/or the editor(s) disclaim responsibility for any injury to people or property resulting from any ideas, methods, instructions or products referred to in the content.

