Article

Soil Nutrient Dynamics under Silviculture, Silvipasture and Hortipasture as Alternate Land-Use Systems in Semi-Arid Environment

by
Hansa Baradwal
1,
Avijit Ghosh
2,*,
Amit K. Singh
2,
Raimundo Jiménez-Ballesta
3,*,
Rajendra Kumar Yadav
4,
Sukanya Misra
5,
Manjanagouda Siddanagouda Sannagoudar
2,
Sunil Kumar
2,
Ram Vinod Kumar
2,
Sanjay K. Singh
2,
Dinesh K. Yadav
6 and
Deep Mohan Mahala
7
1
Agriculture Department, Bundelkhand University, Jhansi 284003, India
2
ICAR-Indian Grassland and Fodder Research Institute, Jhansi 284003, India
3
Department of Geology and Geochemistry, Autónoma University of Madrid, 28049 Madrid, Spain
4
Department of Soil Science, Agriculture University, Kota 324001, Rajasthan, India
5
Department of Fruit Science, Rani Lakshmi Bai Central Agricultural University, Jhansi 284003, India
6
ICAR-Indian Institute of Soil Science, Bhopal 462038, India
7
ICAR-Indian Institute of Maize Research, Ludhiana 141004, Panjab, India
*
Authors to whom correspondence should be addressed.
Forests 2023, 14(1), 125; https://doi.org/10.3390/f14010125
Submission received: 29 October 2022 / Revised: 17 December 2022 / Accepted: 5 January 2023 / Published: 10 January 2023
(This article belongs to the Section Forest Soil)

Abstract

:
In order to support livelihoods, enhance food security, restore ecosystem services, and reduce pressure on forests, degraded land can be restored by utilising alternative land-use systems (ALUS), such as silviculture, silvipasture, and hortipasture techniques. ALUS significantly modify the dynamics of soil nutrients in both the surface and subsurface layers. Soils from the 0–15, 15–30, and 30–45 cm layers of Leucaena leucocephala (S)-, Hardwickia binata (H)-, Emblica officinalis (A)-, and Azadiracta indica (N)-based silviculture systems, Acacia nilotica-based silvipasture systems (SPS), natural grassland (NT), and fallow land (F) were sampled in order to better understand the nutrient dynamics of ALUS. Soils under S, H, and SPS had ~203%, 195%, and 129% higher organic carbon (SOC), respectively, than fallow land in the 0–15 cm soil layer. In the subsequent soil layer, those land-use systems had ~199%, 82%, and 110% higher SOC, respectively, than fallow land. Similarly, in the deeper layer, those land uses had ~232%, 23%, and 105% higher SOC, respectively, than fallow land. SPS and NT also improved the SOC concentration significantly over fallow land. Plots under S, H, and SPS had ~198%, 190%, and 125% higher available N, respectively, than fallow land in 0–15 cm soil layer. In the 15–30 cm soil layer, those land-use systems had ~19%9, 82%, and 110% higher available N, respectively, than fallow land. These systems also improved the P and K contents in subsurface soil. Micronutrient concentrations were also improved in soils under S, H, and SPS. Hence, ALUS’ adoption in degraded areas with trees provides a chance for C storage and improves the nutrient dynamics on degraded land.

1. Introduction

In general, agricultural production serves as the foundation of the economy in the majority of developing nations [1]. Alternate land-use systems (ALUS) including silviculture, silvipasture, and hortipasture techniques can be used to repair degraded land in order to sustain livelihoods, increase food security, restore ecosystem services, and reduce pressure on forests [2]. However, obtaining these benefits is not simple [3,4]. By utilising both concrete and intangible advantages, silviculture plays a considerable role in the Indian economy. In reality, it allows for the simultaneous achievement of three important objectives, namely, safeguarding and stabilising ecosystems, producing an excess level of financial commodities, and increasing income and access to essentials for rural people. Additionally, silviculture plays a key role in maintaining the resource base and generally increasing basic production in rainfed regions and particularly in arid and semi-arid regions.
In the near future, silviculture will play a crucial role in environmental services such as carbon sequestration for local weather-change mitigation, phytoremediation for watershed safety, and biodiversity preservation. Now that woody elements such as trees, shrubs, bamboos, canes, and pasture/animals are being simultaneously or sequentially introduced and/or retained on the same unit of land to meet both the ecological and socioeconomic needs of people, silviculture is being recognised as a science that involves planning and developing integrated self-sustainable land management structures [5]. Silviculture is essential for lowering vulnerability, boosting agricultural structural resilience, and shielding households from weather-related threats. Additionally, it offers natural benefits including access to water, healthy soil, and biodiversity [6].
Agroforestry also provides nutritional protection due to numerous manufacturing systems that include food plants grown by farmers as well as oilseed crops, fruits, vegetables, legumes, and aromatic medicinal plants. Silviculture structures allow farmers to diversify their income sources and increase farm output. In silviculture, enhanced productivity is most likely caused by the size of more growth factors, such as light or water, or by increased soil fertility. A huge degraded area (96 m ha), remarkable natural habitat degradation, and extreme weather events are all leading Indian environmental concerns [7]. Silviculture structures have been effective in preventing droughts, reclaiming waterlogged places, controlling floods, reclaiming wastelands, reclaiming ravines, stopping sea erosion, managing desertification, reclaiming mine scrap, and treating saline and alkaline lands. ALUS have been identified as an economically effective solution for degraded soil to address these problems [8].
Prior research has mostly concentrated on ALUS’ potential for productivity [9] or carbon sequestration [10], and little effort has been made to understand the nutrient cycles and dynamics associated with ALUS. The main goal of this particular experiment was to assess the nutrient dynamics in order to determine how various silvopasture and silvicultural systems affected such dynamics of the nutrients in the topsoil and subsurface soil layers. However, based on the suitability of land-use systems in this particular climatic condition, a Leucaena leucocephala-, Hardwickia binata-, Emblica officinalis-, Azadiracta indica-, and Acacia nilotica-based land-use system and natural grassland (NT) were tested for their efficiency.

2. Materials and Methods

2.1. Study Site Description

Our research was conducted in the Jhansi District of Indian state of Uttar Pradesh. The area is part of the Bundelkhand region geologically. The experiment site’s soil type is sandy loamy and of the inceptisol order (Table 1). Physical appearance of the soil was dark brown to reddish red, shallow, and well-drained. Six ALUS were chosen for the study, including silviculture based on Leucaena leucocephala (Lam), also known as subabul (S), Hardwickia binata (Roxb.) Emblica officinalis (Gaertn.), also known as aonla, and Azadiractha indica (A.Juss), also known as neem; silvipasture systems (SPS) based on Acacia nilotica (L.); and natural grassland (NT). Location, area covered, grazing frequency, and establishment year are mentioned in Table 1. The values were compared with fallow land because these systems were built throughout a variety of time periods. In 2000, a 3.0 ha subabul-based system was established, and grass species such as Heteropogon contortus, Brachiaria decumbens, Panicum maximum, and Cenchrus ciliaris dominated it. In 1980, the Hardwickia-based system was established, and Syda acuta, Syda cordifoilia, Achyranthes aspera, and Alternanthera sessilis dominated it. Chrysopogon fulvus and Panicum maximum are two common grass species found in the Acacia-based SPS established in 2010. Panicum maximum, Cenchrus ciliaris, Cenchrus setigerus, Pennisetum pedicellatum, and Brachiaria decumbens dominated the 1.2-hectare aonla-based HPS. Celosia argentea, Cenchrus ciliaris, Acanthospermum hispidum, Hyptis suaveolens, and Eragrostis cilianensis dominated the natural grassland region. Cenchrus ciliaris, Cynodondactylon, and Alternanthera sessilis were dominant in neem-based SPS. The ALUS were developed for restoration purposes. The seedlings were native in nature and planted manually by hand, after digging hole in soil. The systems were not close to one another. They were established in different areas of the farm. The ALUS were developed on degraded land. Geologically, the area belongs to the part of the Bundelkhand region, which is characterised by devastating drought, barren soil, and extreme climate. The altitude of the site is ~326 msl. Rocks such as gneisses and granites with highly ferruginous beds and basic igneous intrusions are observed in this tract. The major drivers for land degradation are wind erosion and poor soil fertility. The soil of the experimental site belongs to the hypothermic family of Typic Haplustepts with sandy loam texture. They are shallow and dark brown to yellowish red. The soil is low in SOC (0.35%), mineral N (183 kg ha−1), and plant-available P (9 kg ha−1) and K (250 kg ha−1). The water-holding capacity and nutrient-retention capacity of these soils are medium. Saturation water-holding capacity of soil was 32.5% (v/v). During May to July, the mean wind velocity is >8 km hr−1, causing soil erosion ranging between 37 and 53 t ha−1 year−1. Hence, cultivation of commercial crops, such as, rice, wheat, maize, and pulses is not possible in this region. To support livelihoods of common people, tree-based alternate land-use systems were chosen.
The normal environment in our study location includes dry air, hot summer, and a cold, foggy winter (late November to middle of March). The district receives 840 mm of precipitation on average every year, with 90% of that coming during the southwest monsoon and the other 10% falling throughout the rest of the year. In the Bundelkhand region, the pattern of rainfall is frequently irregular, leading to periodic droughts. In January (the coldest month), the average daily high and low temperatures were 21.34 °C and 6.84 °C, respectively. The hottest month from 2015 to 2020 was May, with a mean daily maximum temperature of 41.48 °C. The hottest temperature occasionally exceeded 48 °C in May and June. June had the highest mean daily evaporation (12.80 mm d−1).

2.2. Soil Sampling and Processing

Soil samples were collected from three layers (i.e., 0–15, 15–30, and 30–45 cm depths) of all ALUS in October 2020. In three replicates, dual units of clean samples (500 g) were randomly selected from all ALUS. Thus, a total of 21 soil samples from all soil depths were collected in each batch. In a nutshell, a core sampler comprises a galvanised iron cylinder of 5.5 cm diameter and 15 cm top used to press into the soil. Soil samples were accumulated from 3 factors in every plot. Thereafter, they were merged to create a unified sample for one plot. For measuring soil bulk density, one set was utilised. Once, there were two sub-samples taken from the other set. One sub-sample set was air dried, ground in a wooden pestle and mortar, and then sieved to skip via a 2.0 mm sieve (bulk soils). A <2.0 mm sieve was also employed to separate combinations from the second sub-sample. Soil chemical analysis was determined using processed soil samples.

2.3. Soil Analysis

With a pH meter, deionised water was used to measure the pH of the soil (1:2.5 soil:water). The salinity of the soil was assessed with a conductivity meter using the electrical conductivity of an aqueous soil extract in deionised water. Soil bulk density was measured using a soil core sampler method. Nitrogen, phosphorous, and potassium were expected to be accessible to plants [10,11]. They were estimated by extracting soil with potassium chloride, sodium bicarbonate, and ammonium acetate, respectively. Nitogen was estimated using Kjeldahl method. Phosphorus was measured colourimetrically. Potassium was quantified using a flame photometer. The Walkley–Black technique was used to calculate SOC [12]. Soil micronutrients were determined through the use of DTPA (Diethylen triamine Penta acetic acid) extract (1:2 Soil:DTPA). Fe, Mn, Zn, and Cu were determined per the method outlined by Lindsay and Norvell using an atomic absorption spectrophotometer [13].

2.4. Statistical Analysis

The generated data were dealt with for evaluation of variance (ANOVA)—as applicable to one-way ANOVA—to check differences among the land-use systems as described by [14]. Tukey’s honest significant difference test was used as mean separation test (p < 0.05).

3. Results

3.1. Impact of Alternate Land-Use Systems on Soil pH and EC

The pHs of the soil appraised at the surface soil layers in all land-use systems were acidic in reaction (Table 2). Significant differences in pH were observed between the systems of different LUS. Overall, pH values in were significantly higher in S, A, NT, and F than H, SPS, and N systems. This finding is in line with that of Muche et al. [15]: the pH of cultivated land was more acidic than the pH of other land-use types.
The electrical conductivity (EC) of soil was estimated at surface soil layers in all LUS. Significant differences in EC were observed between the systems of different LUS (Table 2). Overall, the maximum EC value was observed in the SPS system at 0.034 dSm−1, and the minimum EC value was observed in fallow land at 0.019 dSm−1. The EC values were significantly greater in S, H, SPS, A, NT, and N compared to fallow land (Table 2).

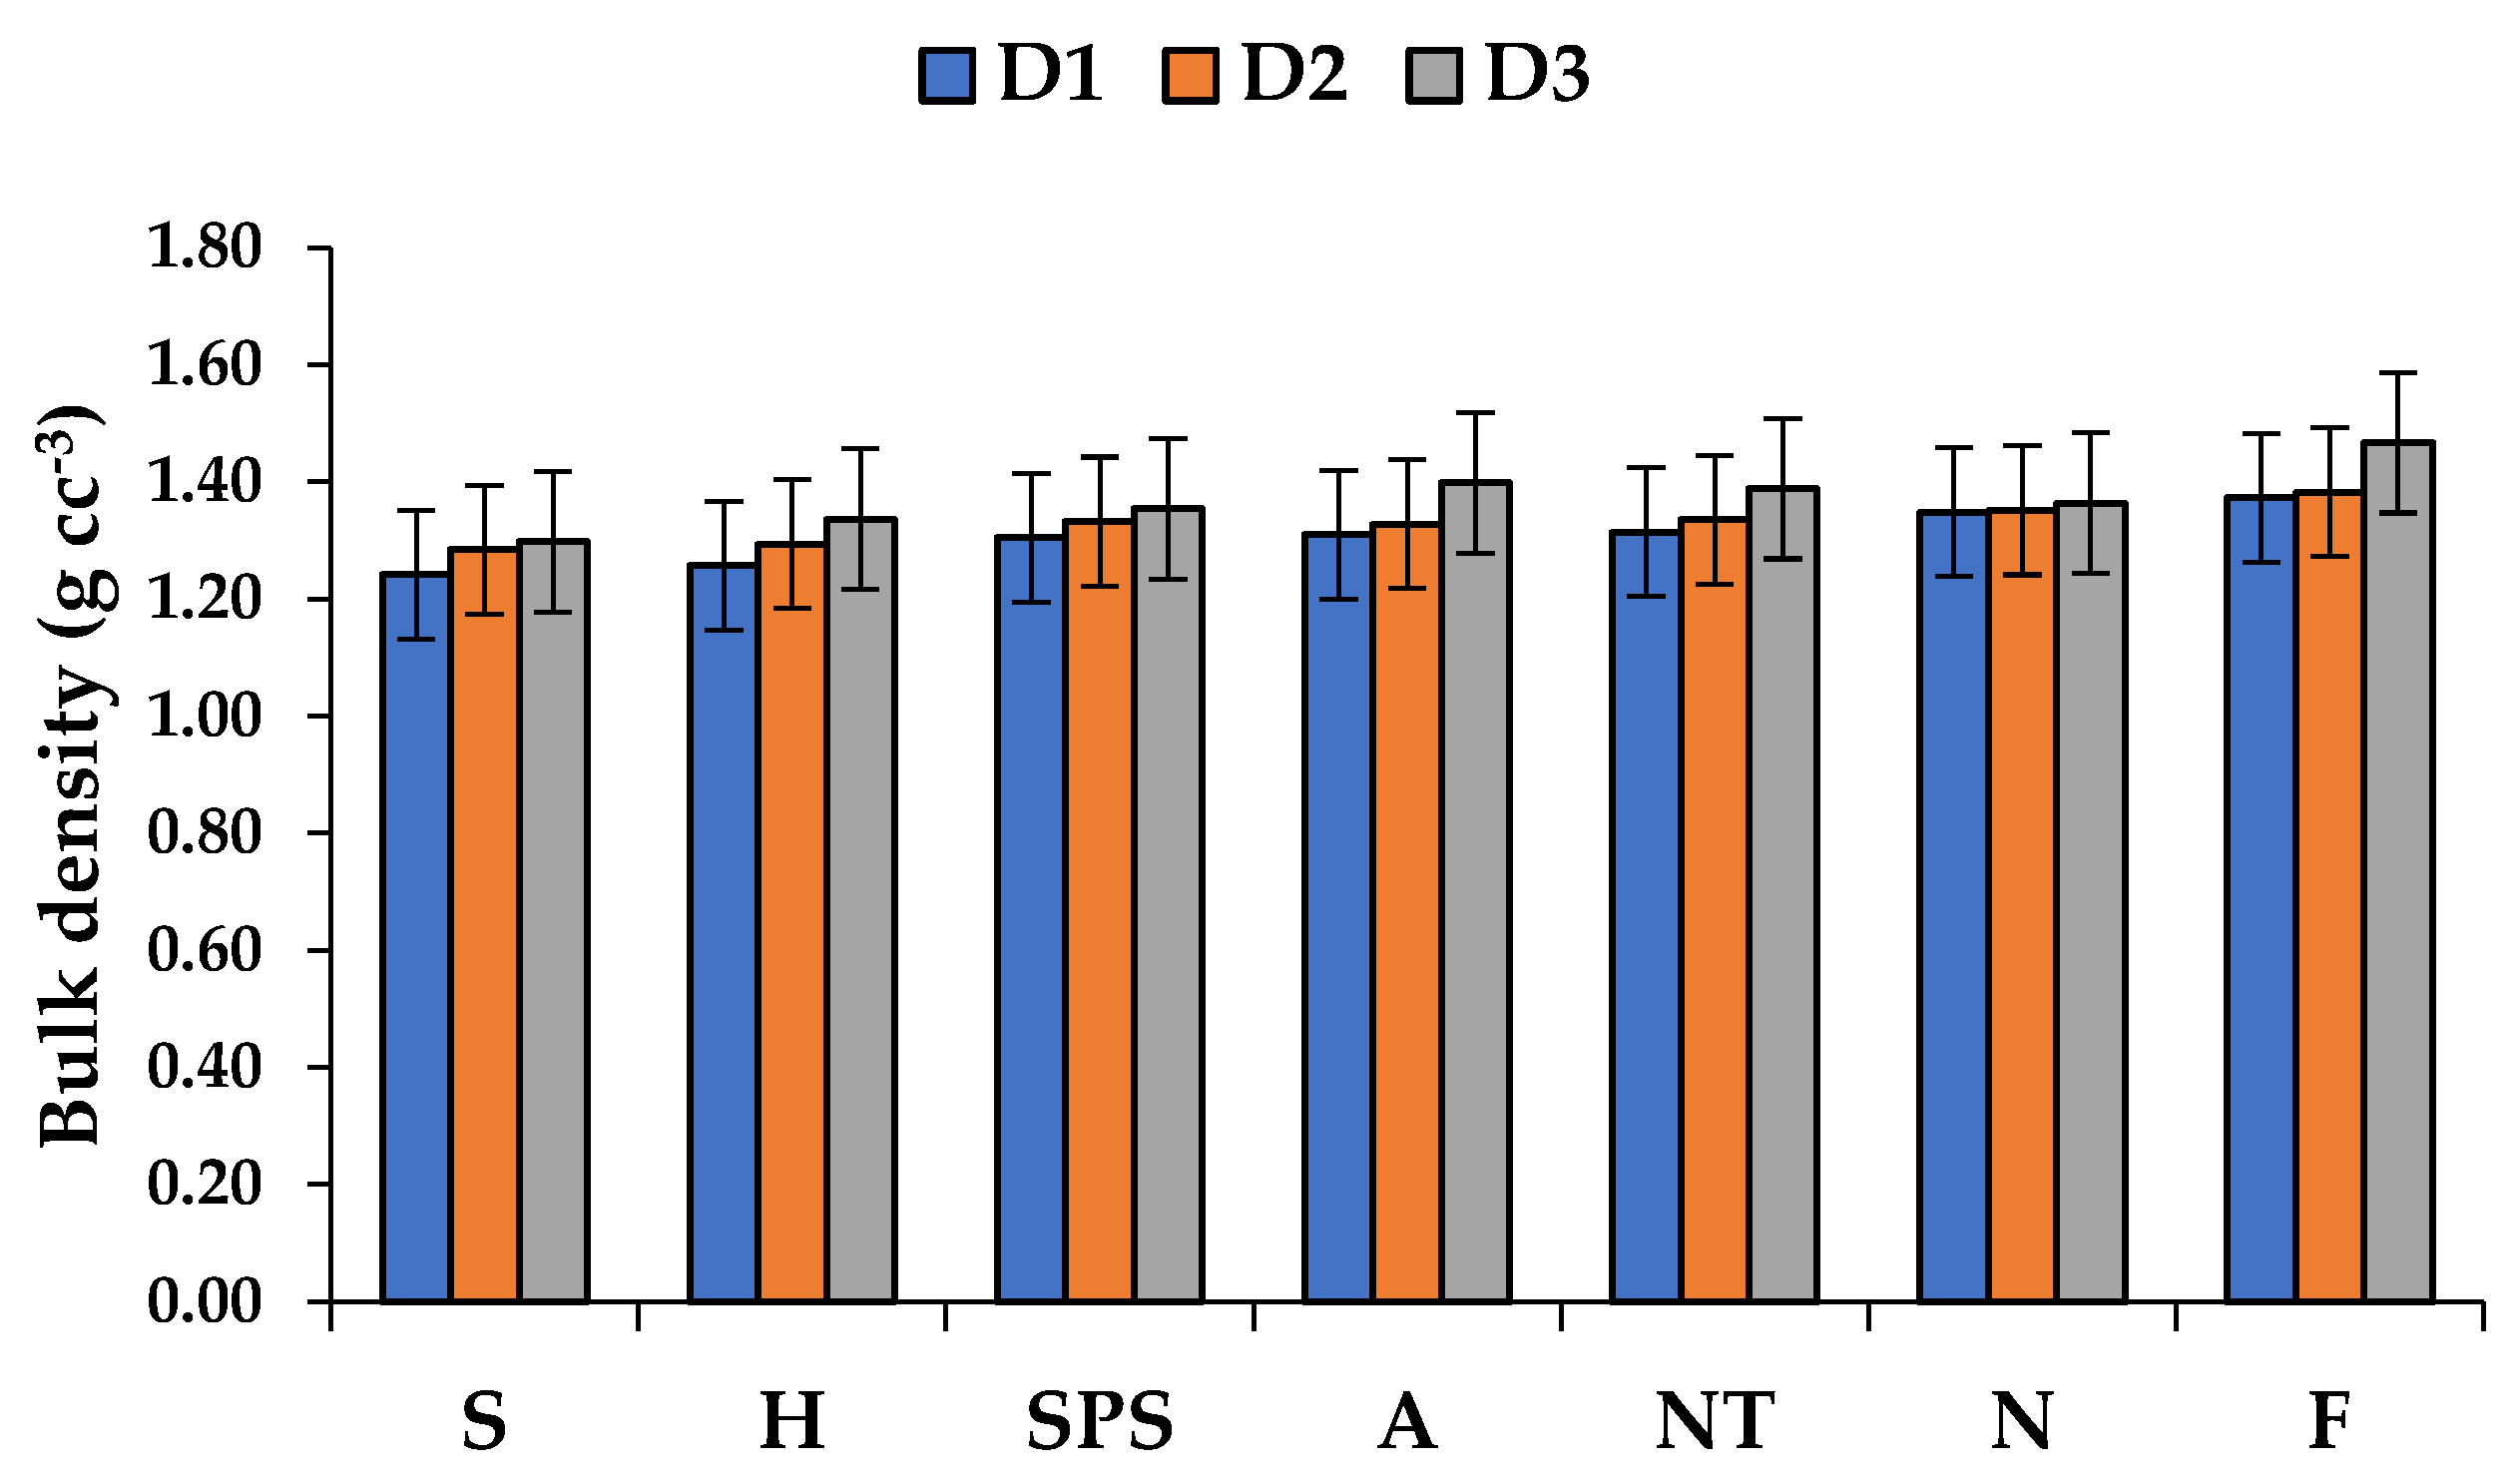
3.2. Impact of Alternate Land-Use Systems on Bulk Density (BD)

The soils under S, H, and SPS had ~9%, 8%, and 4% less BD, respectively, than fallow land in the 0–15 cm soil layer. In the 15–30 cm soil layer, these land-use systems had ~6%, 6%, and 3% decreased BD than fallow land (Figure 1). Similar to this, in the deeper soil layer, i.e., 30–45 cm, these land uses had ~11%, 9%, and 7% less BD, respectively, than fallow land and a significantly higher bulk density in S than H and SPS, respectively. The Acacia-based ALUS had ~4%, 3%, and 3% less BD, respectively, than fallow land, a higher BD than S and H, and a significantly similar concentration to SPS and NT; they had a similar BD to NT in the 30–45 cm soil layer. Interestingly, neem-based ALUS and fallow land had significantly less BD in all soil layers (Figure 1).

3.3. Impact of Alternate Land-Use Systems on Total Organic Carbon in Soil (TOC)

Under the 0–15 cm soil depth, S, H, and SPS had ~204%, 195%, and 129% greater TOC, respectively, than fallow land. These land-use systems showed TOC values that were ~199%, 83%, and 110% greater than fallow land, respectively, in the 15–30 cm soil layer (Table 3). Similarly, in the deeper soil layer i.e., 30–45 cm, those land uses had ~232%, 24%, and 105% higher TOC, respectively, than fallow land. Acacia-based ALUS and NT also improved the TOC concentration significantly over fallow land. Nevertheless, they had less TOC content than S, H, and SPS. Interestingly, neem-based LUS and fallow land had a similar TOC in all soil layers (Table 3).

3.4. Impact of Alternate Land-Use Systems on Available Nitrogen (N)

In the 0–15 cm soil layer, plots under S, H, and SPS had ~198%, 190%, and 125% higher available N, respectively, than fallow land. In the case of the 15–30 cm soil layer, those land-use systems had ~200%, 110%, and 210% higher available N, respectively, than fallow land. Similar to this, for the deeper soil layer, i.e., 30–45 cm, those land uses had ~233%, 39%, and 205% greater available N, respectively, than fallow land (Table 3). The Acacia-based plot had ~103% greater available N than fallow land and a significantly lower concentration than S, H, and SPS. NT-based ALUS had 70%, 180%, and 194% higher concentrations in the 0–15, 15–30 and 30–45 cm depths of soil, respectively, in comparison to fallow land. Neem-based LUS and fallow land had similar available N content in the 0–15 cm and 30–45 cm depths of soil, but in the case of the 15–30 cm soil depth, there was an 83% higher concentration in comparison to fallow land (Table 3).

3.5. Impact of Alternate Land-Use Systems on Available Phosphorus (P)

In the 0–15 cm soil layer, the soils under S, H, and SPS had ~113%, 77%, and 54% more available phosphorus, respectively, than fallow land. The available phosphorus in those land-use systems was ~107%, 76%, and 73% higher, respectively, than it was in fallow land in the 15–30 cm soil layer (Table 3). Similar to this, those areas of land usage had approximately 52%, 35%, and 15% more available phosphorus in the deeper soil layer, i.e., 30–45 cm, respectively, than fallow land. Compared to fallow land, Acacia-based ALUS significantly increased the available phosphorus level. However, compared to S, H, and NT, they had a lower available phosphorus amount, and they had a similar concentration to SPS in the surface soil, with a similar concentration to NT in the 15–30 cm depth, a higher concentration than NT, and a lower concentration than S, H, and SPS. In neem-based ALUS, the available phosphorus concentration had ~23% and 17% rise in the deeper soil layer (Table 3).

3.6. Impact of Alternate Land-Use Systems on Available Potassium (K)

The soil under Acacia had ~14%, 8%, and 13% greater concentrations of K in all three layers, respectively; however, soil under H, SPS, NT, and N had ~4%, 5%, 9%, and 19% lower concentrations of K, respectively, in comparison to fallow land at the 0–15 cm soil depth. In the case of the lower soil depth, i.e., 15–30 cm, S, H, and SPS had ~7%, 5%, and 5% greater concentrations for available potassium, respectively, than fallow land. Soil under NT and N had ~1% and 5% lower concentrations of K, respectively, than fallow land. Likewise, in the deeper soil depth, i.e., 30–45 cm, soil under H, SPS, NT, and N had ~11%, 24%, 27%, and 12% lower concentrations of available potassium, respectively, than fallow land. Interestingly, only Acacia had a higher concentration of available potassium (Table 3).

3.7. Impact of Alternate Land-Use Systems on Iron (Fe)

In the 0–15 cm soil layer, soils under S, H, and SPS had ~172%, 66%, and 33% higher iron, respectively, than fallow land. In the 15–30 cm soil layer, those land-use systems had ~66%, 46%, and 26% higher iron, respectively, than fallow land. Likewise, in the deeper soil layer, i.e., 30–45 cm, those land uses had ~53%, 41%, and 35% higher iron, respectively, than fallow land (Table 4). Acacia-based ALUS also had ~27%, 26%, and 23% improved iron concentrations, respectively, above fallow land; however, they had lower iron concentrations than S, H, and SPS. The NT-based system had ~22%, 6%, and 17% improved iron concentration in the three soil layers, respectively. Neem-based LUS had ~5% improved iron concentration in the 0–15 and 30–45 cm soil depths, in comparison to fallow land (Table 4).

3.8. Impact of Alternate Land-Use Systems on Manganese (Mn)

Soils beneath S, H, and SPS had ~80%, 61%, and 53% greater manganese, respectively, than fallow land in the 0–15 cm soil layer. Under the 15–30 cm depth, these land-use systems had ~52%, 45%, and 45% greater manganese, respectively, than fallow land. Similar to this, in the deeper soil layer, i.e., 30–45 cm, these land uses had ~96%, 84%, and 56% greater manganese, respectively, than fallow land (Table 4). Acacia-based ALUS accelerated manganese concentration by ~33%, 41%, and 32% for the three years, respectively, all considerably more than fallow land. A similar trend was also observed in the NT-based system. Neem-based LUS had a relatively lower level of increase, ~20%, 7%, and 13% than fallow land for the three layers, respectively (Table 4).

3.9. Impact of Alternate Land-Use Systems on Copper (Cu)

The soils in the 0–15 cm soil layer underneath S, H, and SPS had ~44%, 34%, and 31% greater copper, respectively, than fallow land. Their land-use systems comprised 49%, 46%, and 28% more copper, respectively, than fallow land in the 15–30 cm layer of soil (Table 4). Additionally, these land uses had copper concentrations that were 46%, 25%, and 12% greater, respectively, than fallow land in the deeper soil layer, i.e., 30–45 cm (Table 4). Acacia-based LUS had ~8%, 20%, and 12% copper concentrations, respectively, than fallow land; however, they had a much lower Cu concentration than S, H, and SPS in all three soil layers. The NT-based ALUS had ~16%, 8%, and 10% increased copper concentrations than fallow land. Interestingly, neem-based ALUS and the fallow system had similar copper concentrations in all three soil layers (Table 4).

3.10. Impact of Alternate Land-Use Systems on Zinc (Zn)

The S, H, and SPS soils in the 0–15 cm layer of soil had 397%, 394%, and 115% more zinc, respectively, than fallow land. Under the 15–30 cm soil depth, their land-use systems had ~57%, 33%, and 27% higher copper concentrations, respectively, than fallow land (Table 4). Likewise, in the deeper soil layer, i.e., 30–45 cm, these land uses had ~383%, 67%, and 49% higher zinc concentrations, respectively, than fallow land (Table 4). Acacia-based ALUS had ~33%, 15%, and 37% higher copper concentrations than fallow land; however, they had much lower concentrations than S, H, and SPS in all soil layers. The NT-based ALUS had ~14%, 15%, and 30% increased Zn concentrations, respectively, than fallow land. Interestingly, neem-based ALUS and the fallow system had similar Zn concentrations at both depths (0–15 and 15–30 cm) (Table 4).

4. Discussion

It is estimated that at different spatial scales, soil properties are controlled mainly by land use, soil type, land management, and vegetation type [16,17,18,19,20,21]. The available nitrogen, phosphorous, and potassium significantly (p < 0.001) varied along soil depths for all land uses. Further, the interaction between the soil depth and land use for the available nutrients was significant (p < 0.05).
The greater amount of micronutrient availability in S-, H-, and SPS-based ALUS is probably due to higher decomposition and nutrient mineralisation. Available Zn and Mn (DTPA-extracted) were highly significant (p < 0.001) for land use and soil depth. In addition, DTPA-extractable Cu was significant (p < 0.001) for all land uses and soil depth. Leaf litters and their decomposition under perennial vegetation of S, H, and SPS favour nutrient enrichment compared to regular crop removal. For all land uses, the amount of available N, P, and K varied considerably (p < 0.001) with the soil depth. Additionally, the interaction between soil depth and land use for the available micronutrients was significant (p < 0.05). The increased breakdown and nutrient mineralisation in S, H, and SPS are likely the causes of the larger micronutrient availability.
Along with NPK, calcium (Ca), magnesium (Mg), and sulphur (S) are considered as essential macronutrients. Micronutrients such as copper (Cu), iron (Fe), manganese (Mn), and zinc (Zn) are also considered essential for plant nutrition. These micronutrients act as a co-factor for the various enzymes associated with the metabolism of various organic molecules such as carbohydrates, nucleic acids, proteins, and lipids. Micronutrients’ deficiency became a restriction for the productivity, stability, and sustainability of soils. Hence, studying their availability is extremely important [22].
The relationship between soil depth and available Zn (DTPA-extracted) was significant (p < 0.001). The relationship between soil depth and DTPA-extractable Mn was highly significant (p < 0.001). This indicates that upon using tree leaves as fodder, animal products will be rich in micronutrients, thus avoiding nutrient deficiency in the local people. In addition, for all land uses and soil depths, DTPA-extractable Cu was significant (p < 0.001). In comparison to routine crop removal, the decomposition of leaf litters under perennial S, H, and SPS plants favours nitrogen enrichment. The concentration of accessible micronutrients may rise as a result of increased decomposition due to litter accumulation and favourable environmental conditions [23]. Additionally, as organic matter breaks down, it creates organic molecules that turn into chelates of micronutrients, increasing the availability of those nutrients in soils.
Although no nutrients were applied externally, soil-nutrient availability increased in all systems (possibly by foliage litter fall, remineralisation, reduced leaching, etc.), compared to the initial status. N, P, and K availability increased by at least ~14%, 6%, and 9.5%, respectively, over the initial status. In silvopasture systems, the method of litter decomposition and mineralisation provides an abundant nutrient stock, which increases crop yield. While litter decomposition is the primary source of nutrients, it might be augmented by nutrient deposition from leaves and rainfall. The observed increase might be due to a decline in the nutrient loss out of the systems, owing to restricted leaching in tree rows due to a sheltering effect [24,25]. Hence, deep-rooted trees in silvopasture systems could improve the nutrient status of degraded soil by redistributing nutrients from the deeper soil layer to the upper layer.
In some ecosystems, the litter layer is essential for retaining nutrients, and litter fall is a significant factor in the transfer of nutrients from plants to soil. The amount of available N, P, and K generally decreased with the soil depth across all land uses. The soil’s top layer (0–15 cm) offered more N, P, and K than at other depths. Increased uptake, scavenging from deeper soil layers, and return to the soil top through litter fall were ascribed for the notable rise in the concentrations of these nutrients in the surface layer.
The level of organic matter has a clear correlation with the sharp rise in accessible N, P, and K concentrations. This was further supported by the association between SOC and the available N, P, and K (r = 0.71 **, 0.84 **, and 0.73 *, p < 0.01), respectively. The rise in the concentration of K that is readily available could be the result of K being released from K-bearing minerals. Additionally, by lowering the metal ions that bind phosphates through chelation and by competing for exchange sites, the organic acids released during the breakdown of residues and organic debris increased P release [26].
However, different land-use strategies result in different nutrient releases during decomposition. In contrast, the current study’s findings showed that soil depth decreased across all land uses. Positive factors, such as high temperatures and soil wetness, that hasten the breakdown of sugarcane garbage and litter, may be to blame for the rise in these nutrients under S, H, and SPS. Additionally, organic molecules increase the availability of micronutrients in soils by forming chelates of their cations. Authors such as [27,28] point out that tree-based land uses offer more sustainable alternatives to practices such as cattle ranching and shifting cultivation, in which nutrient cycles are completely disrupted. Further studies need to be conducted on the deterioration rate of soil chemical properties, soil microbial activity, and plant nutrition, in relation to sustainable land management. In addition, further study is necessary before determining if soil nutrient contents are really more protected under tree-based land uses.
Aside from assessing soils’ capacities and current conditions in terms of various functions, one of the most pressing issues in soil science today is determining the consistency and durability of soil functions as well as how they adjust in reaction to external forces (e.g., through agriculture or climate change). Soil functions, such as nutrient cycling, carbon dynamics, productivity, decomposition, etc., are closely linked to the ecosystem services (like erosion control, soil fertility, nutrient retention, carbon sequestration, and nutrient dynamics) provided by soil. Degraded soils have lower diversity, and their soil functions deteriorate, affecting the delivery of ecosystem offerings. Hence, ALUS adoption in degraded areas with trees provides a chance for improving ecosystem functioning.

5. Conclusions

Given that the effects of widespread land-use change on nutrient contents and cycles in soil and vegetation are not well understood, adopting ALUS in regions with trees that are degraded offers nutritional and fodder security, as well as C storage in the soil and vegetation. According to this paper, ALUS are essential for restoring nutrients to damaged areas. Trees have an impact on how well rehabilitation techniques work. Additionally, ALUS enhance the capability for nutrient supply and carbon buildup. Thus, compared to other systems and fallow, legume tree-based ALUS such as S, H, and SPS significantly enhance soil physicochemical characteristics and biological quality. Greater micronutrient availability in soils under ALUS assures the supply of micronutrients to humans through animal products. ALUS could also support livelihoods, enhance food security, restore ecosystem services, and reduce pressure on forests. After all, revived ALUS will help with the prompt execution of helpful strategies to fulfil the promises of the Paris Agreement. Under the Paris Agreement, India had committed to creating a cumulative carbon sink of 2.5–3 billion tonnes of carbon dioxide equivalent by 2030. Currently, India’s forest and tree cover is about 24% of its geographical area, according to the India State of Forest Report 2017, and India has repeatedly highlighted that it wants to bring at least 33% of its total area under green cover, to achieve the national goal for ecological security. Therefore, India is in the process of making significant contributions to REDD-plus (reducing emissions from deforestation and forest degradation in developing countries), through its ecological restoration projects and sustainable forest managements. Thus, the annual ecosystem C sink in eco-restored lands could offset India’s annual emissions. Notably, most of the expansion of ecorestored land shows significant potential to contribute to C sequestration. Additionally, the storage of massive amounts of C in mature trees will also contribute to the global C balance, although the C sink may gradually decrease and reach a C saturation state as the trees grow. However, this considerable C sequestration potential could also be regarded as an approach for gaining C credits. Finally, our study indicates that the implementation of ecological restoration strategies could be a quantitatively important component of national climate change mitigation strategies in India and, thus, should be continually paid great attention.

Author Contributions

Conceptualisation, H.B., A.G. and A.K.S.; methodology, H.B., A.G., S.M. and M.S.S.; software, A.G., R.J.-B. and R.K.Y.; validation, A.G., S.K. and R.V.K.; formal analysis, A.G. and S.K.S.; investigation, H.B. and A.G.; resources, R.V.K.; data curation, A.K.S. and S.M.; writing—original draft preparation, A.G.; writing—review and editing, R.K.Y., R.J.-B., D.K.Y. and D.M.M.; visualisation, H.B. and A.G.; supervision, A.G.; project administration, A.G.; funding acquisition, A.G. and R.J.-B. All authors have read and agreed to the published version of the manuscript.

Funding

This research received no external funding.

Data Availability Statement

The data and materials will be made available from the corresponding author(s) upon reasonable request.

Acknowledgments

All the authors acknowledge the Director of the ICAR-Indian Grassland and Fodder Research Institute, Jhansi 284003, Uttar Pradesh, India for their support to conduct this study.

Conflicts of Interest

The authors declare no conflict of interest.

References

  1. International Food Policy Research Institute. Fertilizer and Soil Fertility Potential in Ethiopia: Constraints and Opportunities for Enhancing the System; International Food Policy Research Institute: Washington, DC, USA, 2010; p. 42. [Google Scholar]
  2. Harris, J.A.; Hobbs, R.J.; Higgs, E.; Aronson, J. Ecological restoration and global climate change. Restor. Ecol. 2006, 14, 170–176. [Google Scholar] [CrossRef]
  3. Kumar, S.; Singh, A.K.; Singh, R.; Ghosh, A.; Chaudhary, M.; Shukla, A.K.; Kumar, S.; Singh, H.V.; Ahmed, A.; Kumar, R.V. Degraded landrestoration ecological way through horti-pasture systems and soil moisture conservation to sustain productive economic viability. Land Degrad. Dev. 2019, 30, 1516–1529. [Google Scholar] [CrossRef]
  4. Ghosh, A.; Kumar, R.V.; Manna, M.C.; Singh, A.K.; Parihar, C.M.; Kumar, S.; Roy, A.K.; Koli, P. Eco-restoration of degraded lands through trees and grasses improves soil carbon sequestration and biological activity in tropical climates. Ecol. Eng. 2021, 162, 106176. [Google Scholar] [CrossRef]
  5. Dhyani, S.K.; Ram, N.; Sharma, A.R. Agroforestry: Its relation with agronomy, challenges and opportunities. Indian J. Agron. 2009, 54, 249–266. [Google Scholar]
  6. NRCAF. NRCAF Vision 2050; National Research Centre for Agroforestry: Jhansi, India, 2013; p. 26. [Google Scholar]
  7. Singh, N.; Price, C.; Downs, C.T. Aspects of the ecology and behaviour of a potential urban exploiter, the southern tree agama, Acanthocercus atricollis. Urban Ecosyst. 2021, 24, 905–914. [Google Scholar] [CrossRef]
  8. Adhikari, H.; Valbuena, R.; Pellikka, P.K.; Heiskanen, J. Mapping forest structural heterogeneity of tropical montane forest remnants from air borne laser scanning and Landsat time series. Ecol. Indic. 2020, 108, 105739. [Google Scholar] [CrossRef]
  9. Singh, M.; Marchis, A.; Capri, E. Greening, new frontiers for research and employment in the agro-food sector. Sci. Total Environ. 2014, 472, 437–443. [Google Scholar] [CrossRef]
  10. Murthy, I.K.; Gupta, M.; Tomar, S.; Munsi, M.; Tiwari, R.; Hegde, G.T.; Ravindranath, N.H. Carbon sequestration potential of agroforestry systems in India. J. Earth Sci. Clim. Chang. 2013, 4, 1000131. [Google Scholar] [CrossRef]
  11. Jackson, M.L. Soil Chemical Analysis; Prentice Hall of India Private Limited: New Delhi, India, 1973. [Google Scholar]
  12. Walkley, A.; Black, I.A. An examination of the Degtjareff method for determining soil organic matter, and a proposed modification of the chromic acid titration method. Soil Sci. 1934, 37, 29–38. [Google Scholar] [CrossRef]
  13. Lindsay, W.L.; Norvell, W.A. Development of a DTPA soil test for zinc, iron, manganese, and copper. Soil Sci. Soc. Am. J. 1978, 42, 421–428. [Google Scholar] [CrossRef]
  14. Gomez, K.A.; Gomez, A.A. Statistical Procedures for Agricultural Research; John Wiley and Sons: New York, NY, USA, 1984; p. 680. [Google Scholar]
  15. Muche, M.; Kokeb, A.; Molla, E. Assessing the physicochemical properties of soil under different land use types. J. Environ. Anal. Toxicol. 2015, 5, 309. [Google Scholar] [CrossRef]
  16. Ajami, M.; Heidari, A.; Khormali, F.; Gorji, M.; Ayoubi, S. Environmental factors controlling soil organic carbon storage in loess soils of a subhumid region, northern Iran. Geoderma 2016, 281, 1–10. [Google Scholar] [CrossRef]
  17. Alidoust, E.; Afyuni, M.; Hajabbasi, M.A.; Mosaddeghi, M.R. Soil carbon sequestration potential as affected by soil physical and climatic factors under different land uses in a semiarid region. Catena 2018, 171, 62–71. [Google Scholar] [CrossRef]
  18. Song, Q.; Gao, X.; Du, H.; Lei, J.; Li, S.; Li, S. Cultivation impacts on soil texture during oasis expansion in Xinjiang, Northwest China: Wind erosion effects. Aeolian Res. 2021, 50, 100646. [Google Scholar] [CrossRef]
  19. Zeraatpisheh, M.; Bakhshandeh, E.; Hosseini, M.; Alavi, S. Assessing the effects of deforestation and intensive agriculture on the soil quality through digital soil mapping. Geoderma 2020, 363, 114139. [Google Scholar] [CrossRef]
  20. Adams, A.M.; Gillespie, A.W.; Dhillon, G.S.; Kar, G.; Minielly, C.; Koala, S.; Ouattara, B.; Kimaro, A.A.; Bationo, A.; Schoenau, J.J.; et al. Long-term effects of integrated soil fertility management practices on soil chemical properties in the Sahel. Geoderma 2020, 366, 114207. [Google Scholar] [CrossRef]
  21. Fathizad, H.; Hakimzadeh Ardakani, M.A.; Sodaiezadeh, H.; Kerry, R.; Taghizadeh-Mehrjardi, R. Investigation of the spatial and temporal variation of soil salinity using random forests in the central desert of Iran. Geoderma 2020, 365, 114233. [Google Scholar] [CrossRef]
  22. Ghosh, A.; Singh, A.K.; Das, B.; Modak, K.; Kumar, R.V.; Kumar, S.; Gautam, K.; Biswas, D.R.; Roy, A.K. Resiliencies of soil phosphorus fractions after natural summer fire are governed by microbial activity and cation availability in a semi-arid Inceptisol. Environ. Res. 2023, 216, 114583. [Google Scholar] [CrossRef]
  23. Baradwal, H.; Ghosh, A.; Kumar, A.; Singh, P.D.; Sannagoudar, M.S.; Ahamad, S.; Jha, P.; Singh, A.K.; Bhattacharyya, R.; Manna, M.C.; et al. Ecological restoration of degraded lands with alternate land use systems improves soil functionality in semiarid tropical India. Land Degrad. Dev. 2022, 33, 1076–1087. [Google Scholar] [CrossRef]
  24. Ghosh, A.; Singh, A.K.; Kumar, S.; Manna, M.C.; Bhattacharyya, R.; Agnihortri, R.; Singh Gahlaud, S.K.; Sannagoudar, M.S.; Gautam, K.; Kumar, R.V.; et al. Differentiating biological and chemical factors of top and deep soil carbon sequestration in semi-arid tropical Inceptisol: An outcome of structural equation modeling. Carbon Manag. 2020, 11, 441–453. [Google Scholar] [CrossRef]
  25. Ghosh, A.; Kumar, S.; Manna, M.C.; Singh, A.K.; Sharma, P.; Sarkar, A.; Saha, M.; Bhattacharyya, R.; Misra, S.; Biswas, S.S.; et al. Long-term in situ moisture conservation in horti-pasture system improves biological health of degraded land. J. Environ. Manag. 2019, 248, 109339. [Google Scholar] [CrossRef] [PubMed]
  26. Ghosh, A.; Biswas, D.R.; Das, S.; Das, T.K.; Bhattacharyya, R.; Alam, K.; Rahman, M.M. Rice straw incorporation mobilizes inorganic soil phosphorus by reorienting hysteresis effect under varying hydrothermal regimes in a humid tropical Inceptisol. Soil Till. Res. 2023, 225, 105531. [Google Scholar] [CrossRef]
  27. Ewel, J. Designing agricultural systems for the humid tropics. Annu. Rev. Ecol. Syst. 1986, 17, 245–271. [Google Scholar] [CrossRef]
  28. Smith, N.; Dubois, J.; Current, D.; Lutz, E.; Clement, C. Agroforestry Experiences in the Brazilian Amazon: Constraints and Opportunities; Pilot Program to Conserve the Brazilian Rainforest: Brasilia, Brazil, 1997. [Google Scholar]
Figure 1. Bulk density (g cc−3) in surface (0–15 cm) and subsurface (15–30 cm and 30–45 cm) soil layers, as influenced by different LUS in semi-arid environment. Error bars indicate LSD at p < 0.05. See Materials and Methods for detailed information on LUS. D1: 0–15 cm, D2: 15–30 cm, and D3: 30–45 cm soil layers.
Forests 14 00125 g001
Table 1. The details of experimental site.
Land-Use SystemsArea (ha)Soil TypeGrazing Type
Leucaena leucocephala (S)3Sandy LoamOccasional grazing
Hardwickia binata (H)2Sandy LoamOccasional grazing
Acacia nilotica (SPS)1.1Sandy LoamOccasional grazing
Emblica officinalis (A)1.2 Sandy LoamOccasional grazing
Natural grassland (NT)2 Sandy LoamFrequent grazing
Azadiracta indica (N)2Sandy LoamOccasional grazing
Fallow (F)2 Sandy Loam
Table 2. The pH and electrical conductivity (EC) in surface (0–15 cm) soil layer, as influenced by different LUS in semi-arid environment. Means with similar lowercase letters within a column are not significantly different at p < 0.05 according to LSD test. See Materials and Methods for detailed information on LUS.
LUSpH (H2O)EC
0–15 cm0–15 cm
S6.5a0.031
H5.5a0.026
SPS6.0a0.034
A6.5a0.033
NT6.5a0.029
N6.0a0.027
F6.5a0.019
SE (m)0.39
Table 3. Total soil organic carbon (SOC; g kg−1), available nitrogen (N; g kg−1), phosphorus (P; kg ha−1), and potassium (K; kg ha−1) in surface (0–15 cm) and subsurface (15–30 cm and 30–45 cm) soil layers, as influenced by different LUS in semi-arid environment. Means with similar lowercase letters within a column are not significantly different at p < 0.05 according to LSD test. See Materials and Methods for detailed information on LUS.
SOC
0–15 cm15–30 cm30–45 cm
S1.46a1.44a1.36a
H1.42a0.88c0.51d
SPS1.10b1.01b0.84bc
A0.99c1.01b0.89b
NT0.83d0.86c0.79c
N0.54e0.40d0.38e
F0.48e0.48d0.41e
SE (m)0.390.350.35
N
0–15 cm15–30 cm30–45 cm
S1.82a1.80a1.70a
H1.77a1.10c0.63d
SPS1.38b1.26b1.05bc
A1.24b1.26b1.12b
NT1.04c1.08d0.99c
N0.67d0.50f0.48e
F0.61d0.60e0.51de
SE (m)0.480.440.43
P
0–15 cm15–30 cm30–45 cm
S38.53a32.38a31.97a
H31.97b27.46b28.28b
SPS27.87c27.05b24.19c
A27.05c22.96c22.55de
NT25.01d22.96c21.32d
N20.50e19.27d24.60c
F18.04e15.58e20.91d
SE (m)6.895.584.01
K
0–15 cm15–30 cm30–45 cm
S268.8b262.08a257.60b
H239.68c257.60ab230.72c
SPS238.56c256.48ab196.00d
A286.72a264.32a294.56a
NT228.48c240.80bc189.28d
N202.72d229.60c228.48c
F252bc244.16bc259.84b
SE (m)27.3412.7937.26
Table 4. Iron (Fe; ppm), manganese (Mn; ppm), copper (Cu; ppm), and zinc (Zn; ppm) in surface (0–15 cm) and subsurface (15–30 cm and 30–45 cm) soil layers, as influenced by different LUS in semi-arid environment. Means with similar lowercase letters within a column are not significantly different at p < 0.05 according to LSD test. See Materials and Methods for detailed information on LUS.
Fe (ppm)
0–15 cm15–30 cm30–45 cm
S17.59a8.97a9.33a
H10.77b7.90b8.62b
SPS8.62c6.82c8.26b
A8.26c6.82c7.54c
NT7.90d5.74d7.18d
N6.82e5.38e6.46e
F6.46f5.38e6.10f
SE (m)3.841.351.17
Mn (ppm)
0–15 cm15–30 cm30–45 cm
S51.32a43.96a49.24a
H46.04b41.88ab46.22a
SPS43.66b41.82ab39.16b
A37.96c40.70b32.04c
NT37.56c38.50b31.80c
N34.40d30.96c28.48d
F28.48e28.84c25.04d
SE (m)7.665.869.13
Cu (ppm)
0–15 cm15–30 cm30–45 cm
S2.17a2.01a2.25a
H2.01b1.97a1.93b
SPS1.97b1.74b1.74c
A1.78c1.62b1.74c
NT1.74cd1.46c1.70c
N1.62d1.39c1.62cd
F1.50d1.35c1.54d
SE (m)0.240.270.24
Zn (ppm)
0–15 cm15–30 cm30–45 cm
S4.78a1.35a3.77a
H4.75a1.14ab1.30b
SPS2.07b1.09b1.16c
A1.28c0.99c1.07cd
NT1.09c0.99c1.02d
N0.97d0.93cd1.00d
F0.96d0.86d0.78e
SE (m)1.740.161.04
Disclaimer/Publisher’s Note: The statements, opinions and data contained in all publications are solely those of the individual author(s) and contributor(s) and not of MDPI and/or the editor(s). MDPI and/or the editor(s) disclaim responsibility for any injury to people or property resulting from any ideas, methods, instructions or products referred to in the content.

