Review

Growth-Season Precipitation Variations in the Joint Area between the Asian Westerly Jet Area and the Climate Transition Zone over the Past Two Centuries

College of Water Conservancy and Civil Engineering, Inner Mongolia Agricultural University, Hohhot 010018, China
*
Author to whom correspondence should be addressed.
Forests 2023, 14(1), 111; https://doi.org/10.3390/f14010111
Submission received: 22 November 2022 / Revised: 3 January 2023 / Accepted: 4 January 2023 / Published: 6 January 2023
(This article belongs to the Section Forest Meteorology and Climate Change)

Abstract

:
The uneven water resource distribution between different areas across the globe has been worsening. The area where the eastern margin of the Asian westerly jet area meets the low-altitude area of the transition zone (which has a temperate continental monsoon climate) is delicate and sensitive to climate change. An urgent issue is to determine the climate change pattern of this area in the past. On the basis of core samples of four tree species in four typical regions of this joint area, we built a standardized chronological table according to tree-ring width and reconstructed the cumulative precipitation from March to August series in the above area in the past 203–343 years. Since the reconstructed results corresponded well to climate events and drought and flooding periods in historical records, the reconstructed model was stable and reliable. The results were as follows: The precipitation in the study area from east to the west in the growth season has changed dramatically, and the period has gradually shortened. In the 19th century, there was a wet period in the high-latitude area. From the 19th century to the 1950s, the entire study area experienced a significant dry period that lasted for 20–45 years; the starting time of the dry period was gradually delayed from the west to the middle, and the wet period gradually grew shorter at an increasing rate. In the past half-century, this area experienced a significant drought period, and the drying rate was higher in the west and east regions than in the central region. In the past two centuries, the precipitation varied significantly in the study area, and the wet period played a dominant role, growing gradually shorter. The middle and west regions of the Asian westerly jet area and the high-latitude regions of the transition zone all experienced significant wetting or drying processes in the first half of the 19th century, and since then, all areas experienced significant drying processes under the influence of global warming, which may be intensified by the westerly circulation.

1. Introduction

Global climate change has a far-reaching impact on the living environments of human beings and all other species [1,2]. The uneven spatial distribution of water resources in different areas across the globe has become more severe. It would be helpful to analyze climate change over the last several hundred years by utilizing climate proxies.
The part of Asia that is controlled by middle-altitude westerly circulation in the northern hemisphere is known as the Asian westerly jet area. The southeast margin of the Asian westerly jet area is a transition zone with a temperate monsoon–continental climate, and this is one of the areas most sensitive to global climate change [3]. The historical climate change characteristics and patterns in the area where the margin of the Asian westerly jet area meets the climate transition zone are unclear.
In the 1920s, Dr. Andrew E. Douglass, an astronomer at the University of Arizona, established the field of dendrochronology, and since then, climate factors have been reconstructed for different historical periods in different areas across the globe on the basis of the close relationships between tree growth and climate signals [4,5]. In many countries and areas on every continent but Antarctica, scholars have conducted dendrochronologic studies on coniferous tree species, such as Pinus sylvestris L. [6,7], Pinus tabulaeformis Carr. [8], and Picea schrenkiana Fisch. [9]. The findings have shown that a rapid cooling event occurred in the past 600 years in the northern hemisphere, closely related to volcanic eruptions [10,11]; Asian monsoons and the Pacific Decadal Oscillation are always interrelated and interact with significant, sudden climate change events, such as El Niño, in the past 400 years [12]; and under the influence of global warming, droughts have significantly intensified in North America [13].
In 1939, the Swedish meteorologist Rossby first proposed the concept of a westerly circulation [14], which forms due to the convergence of hot air above the equator with cold air above the polar regions. Since Central Asia is significantly affected by the westerly circulation in the northern hemisphere, it is known as the Asian westerly jet area. This area, located deep within the Eurasian continent, has a dry climate and a sensitive ecological environment. There are diverse climate types across Eurasia. At the boundary region between the temperate continental climate and the temperate monsoon climate, a unique and sensitive transition zone exists with a temperate continental monsoon climate. The climate in this transition zone is especially sensitive and venerable due to the interactive effect of numerous geographic and hydroclimatic factors. Studies on the Asian westerly jet area and the transition zone with its temperate continent–monsoon climate have mainly focused on south Tajikistan in the Asian westerly jet area [15], the central part of the inland river basins of northwest China [16], the transition zone in northeast China [17], and high-latitude regions such as Russian Far East [18]. These studies have mainly utilized coniferous species such as larch [17] and spruce [16,18], precipitation data [18], average minimum temperatures, and the Palmer drought severity index (PDSI) [15] to conduct single-point dendroclimatological studies over the past two decades. They have found that climate changes in the Asian westerly jet area and the transition zone are both significantly affected by global climate change [19,20,21]. The southeast margin of the Asian westerly jet area connects with the low-altitude area of the aforementioned transition zone in the western part of Inner Mongolia, China, forming a special area with a mix of different climates. Under the long-term interaction of a fragile and changeable climate environment and a complex and diverse geographical environment, the temperature in this area is extremely variable, and the distribution of water resources is extremely uneven, which has a great impact on the ecological environment and socioeconomic development.
There have been few studies on the long-term historic variations of climate factors, e.g., precipitation, runoff, and relative humidity, in the east margin of the Asian westerly jet area and the low-altitude region of the transition zone, especially in the joint area between the two. As a result, the historical climate change characteristics and patterns in the joint area are unclear. It is necessary to sample multiple points in the joint area and reconstruct the long-term historical climate on a large spatial scale in order to better understand the long-term variation of climate factors in this area.
In conclusion, the main objectives of this study were as follows: (1) to establish the tree-ring width chronology of four typical species in four typical regions within the Joint Area between the Asian Westerly Jet Area and the Climate Transition Zone; (2) reconstruct the historical sequence of precipitation in the intersection area for more than three centuries; (3) on the basis of fully revealing the spatio-temporal variation characteristics and rules of precipitation in the intersection area, making a comparative analysis with previous studies in the westerly region of Asia and the temperate continent–monsoon transition zone.

2. Data and Methodology
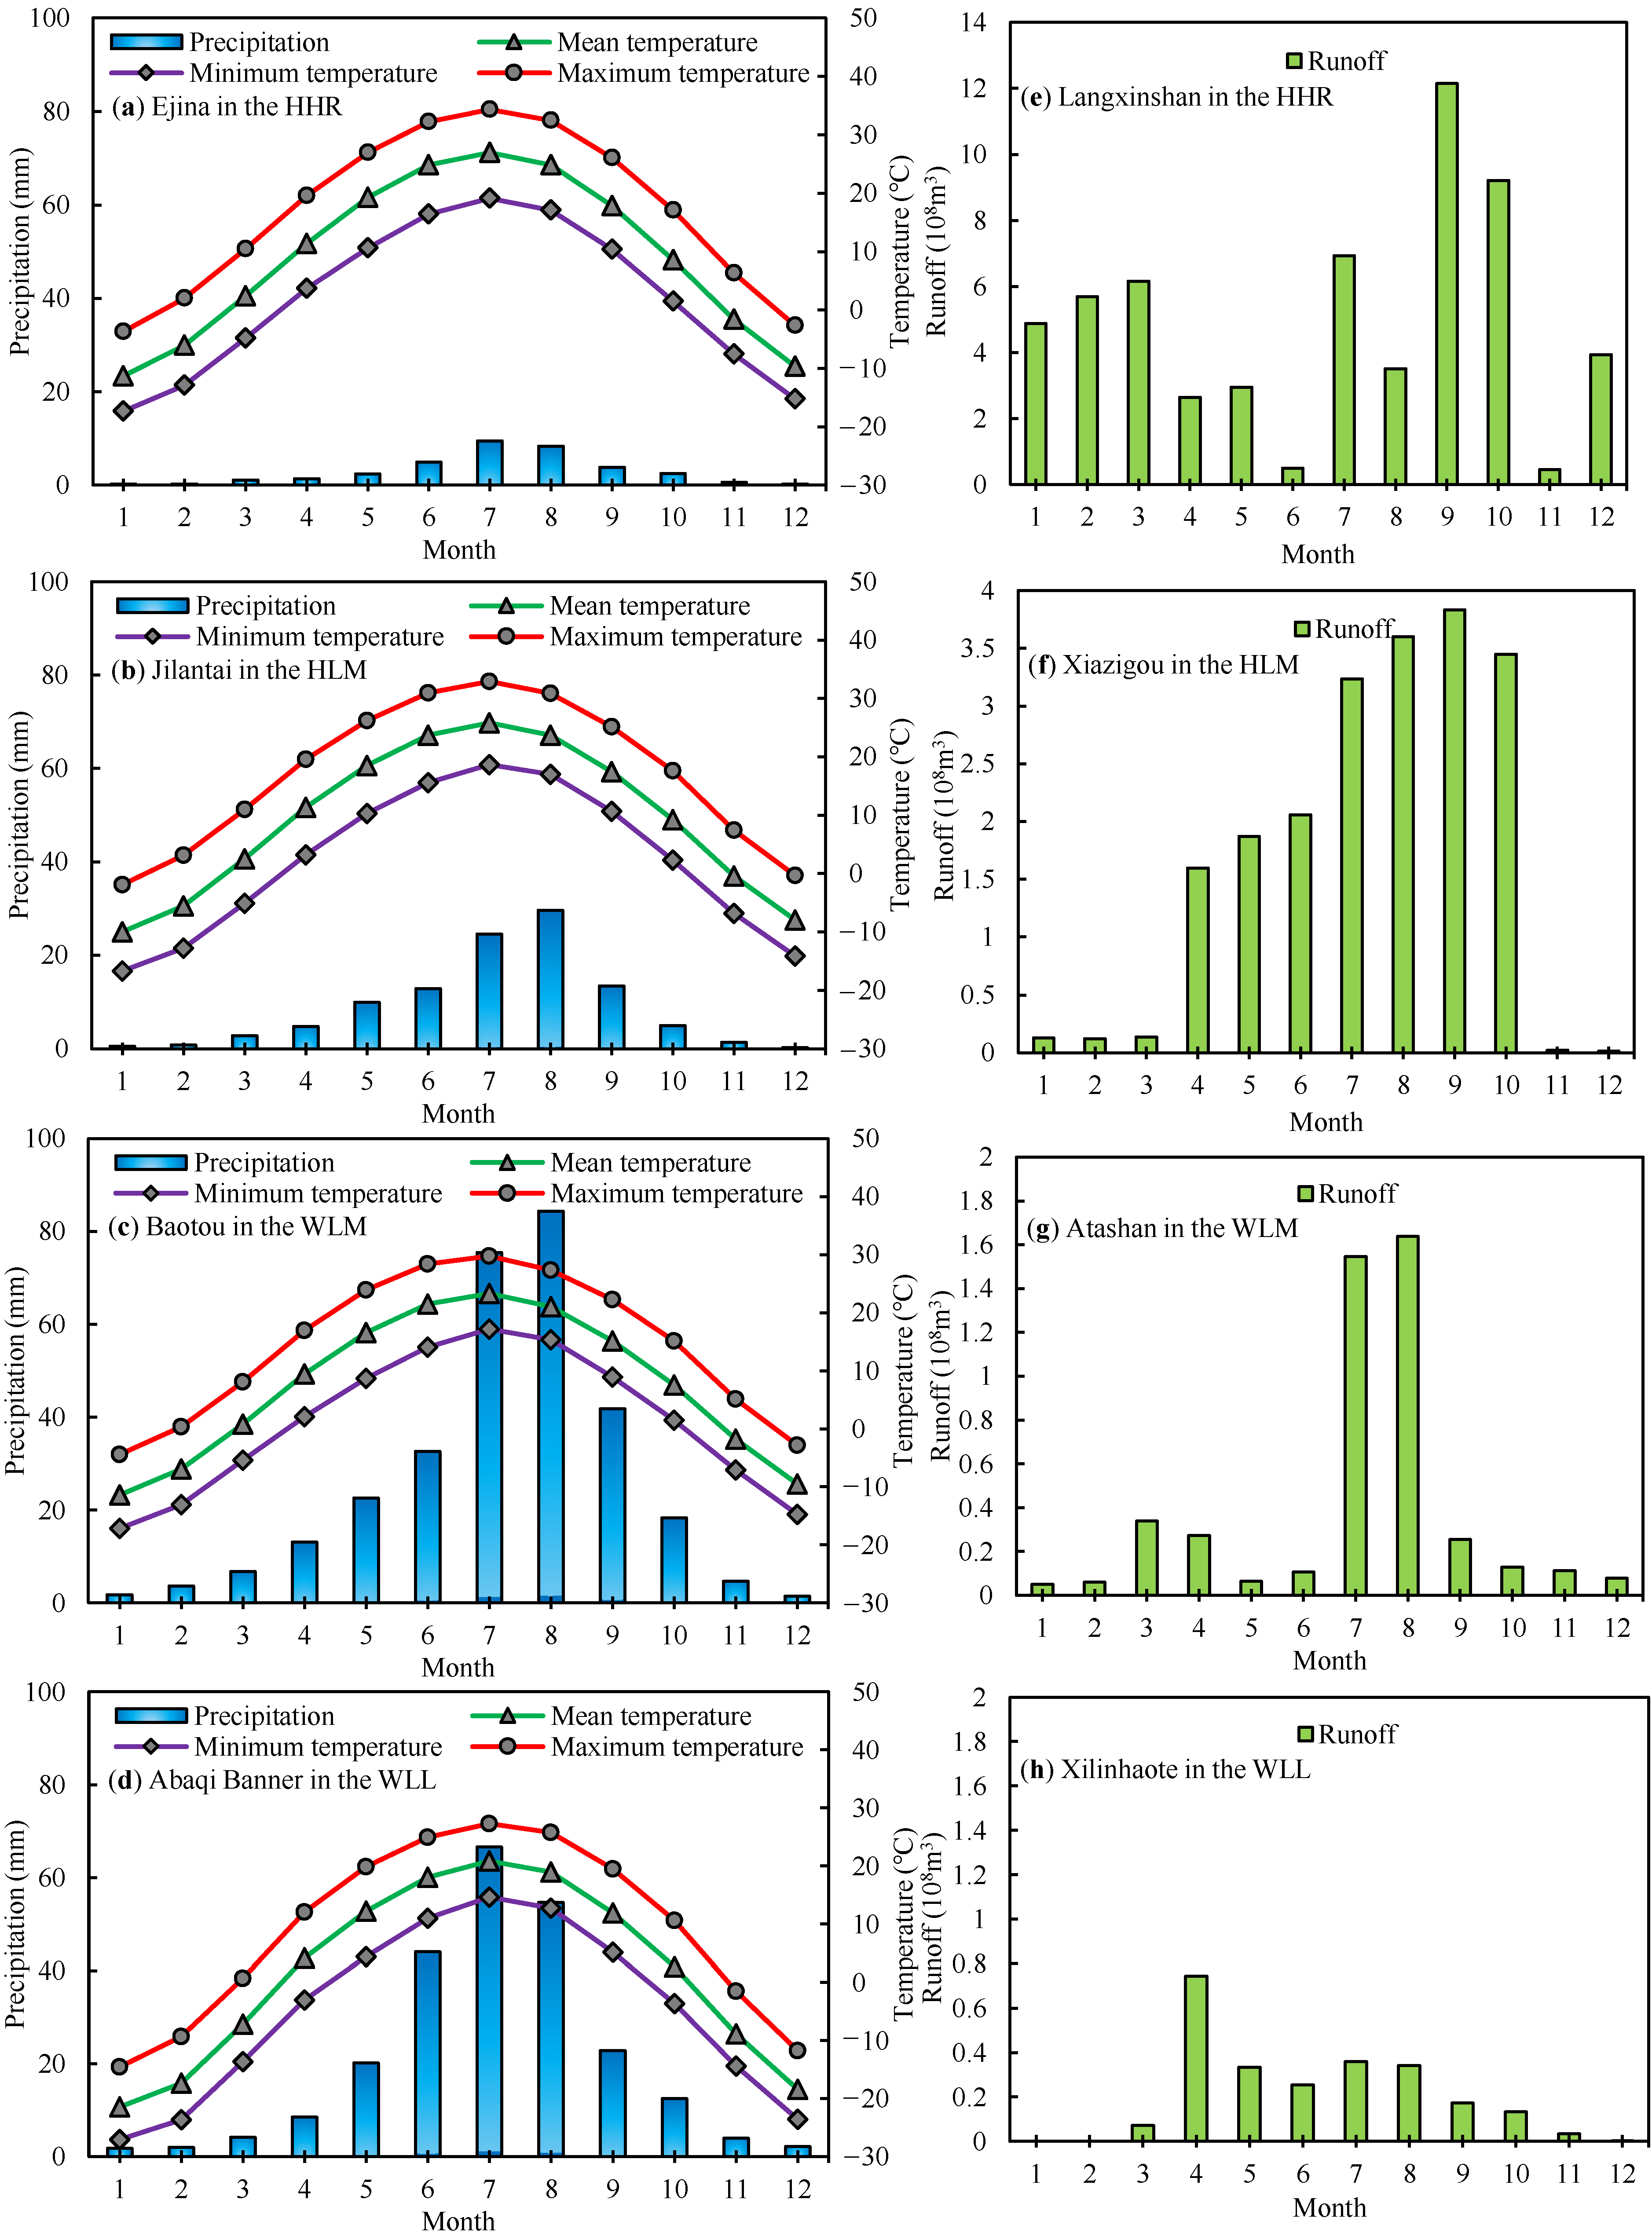
2.1. Research Area

The sampling area is in the overlap region between the southeast fringe of the Asian westerly region and the low-latitude part of the transition zone (Figure 1). Specifically, it is the middle and west part of Inner Mongolia, and it has a large east–west span. This area has annual precipitation of 50 mm in its westernmost part and approximately 400 mm in the easternmost part. There are significant temperature variations throughout the area (Figure 2). The climate types in this area are complex and diverse because of the joint influences of the westerly circulation in the Northern Hemisphere and the temperate continental climate and temperate monsoon climate. It is a typical cold and semi-arid to arid area, with a sensitive and fragile climatic environment. In this study, tree-ring samples for dendroclimatological study were collected from four sites in the overlap region: the lower reaches of the Heihe River, Helan Mountains, Yinshan Mountains, and the northern piedmont of the Daxinganling Mountains.
The lower reaches of Heihe River is one of the only three Populus euphratica forests in the world. It is a huge fan-shaped alluvial and lacustrine plain with flat terrain. The soil type is mainly non-zonal soil forest irrigated meadow soil. The Helan Mountain mountain region is dominated by mountainous terrain, which is an important geographical boundary in northwest China. The forest vegetation cover types include alpine shrub meadow, deciduous broad-leaved forest, mixed coniferous and broad-leaved forest, Qinghai spruce forest, pinus tabulaeformis forest, mountain grassland, etc. The soil type is mainly mountain meadow soil. The southern foothills of Yinshan Mountain Range are mountainous terrain, being an east–west mountain range and an important geographical demarcation line in northern China. The mountain landscape is gentle, the vegetation type is mainly coniferous forest, and the soil type is mostly chestnut soil and ash brown soil. The northern foot of the Greater Hinggan Mountains is a dune highland plain landform, belonging to the Baiyin Abao National Nature Reserve of Inner Mongolia. The forest vegetation cover type is mainly spruce forest of moss and moss sandy land, as well as spruce forest of grass and grass hybrid sandy land, and most of the soil types are sandy soil.

2.2. Proxy Data for Reconstruction and Tree-Ring Data

The summary of specific sampling conditions is shown in Table 1. The sampling standard of the International Tree-Ring Data Bank was adopted to obtain 342 sample cores from 169 trees, with at least two cores from each tree (Figure 3). After drying indoors naturally, the obtained samples were gradually polished using a series of dry abrasive papers (from coarse to fine grid) until the surface of each sampled core was flat and smooth, so that the tree-rings could be seen clearly. The polished core samples were examined using a high-resolution scanner (resolution: 10,200 × 14,039), and WinDENDRO software (0.001 mm resolution) was used for cross-dating to precisely determine the corresponding year for each growth ring. The quality of cross-dating was assessed using the COFECHA [22] program, which is commonly adopted internationally, and any missing rings, false rings, or dating mistakes were checked. The ARSTAN program [23] was used to remove the effects of the tree growth trend and non–climate change factors. To maximally preserve low-frequency signals, the negative exponential curve-fitting method was adopted during the detrending process, and the spline function was used for some samples. Finally, the double-weight average method was used to further process the detrended series to obtain a common, standardized chronological table (Figure 3). The subsample signal strength (SSS) was adopted to determine the minimum duplicate quantity of a reliable chronological table [24]. To ensure the reconstructed series was as long and reliable as possible, we required SSS > 0.85. The mean correlation between trees (Rbt), mean sensitivity (MS), and signal-to-noise ratio (SNR) were calculated to assess the quality of the standard chronological table (Table 2).

2.3. Climate Data Collection

The annual and monthly data of average temperature, average minimum temperature, average maximum temperature, and precipitation from 1951 to 2016 at the four meteorological stations that were the closest to the sampling regions were collected. The selected meteorological stations were Ejina station, which is the closest station to the HHR sampling site (Figure 2a; 101°3′57″ E, 41°57′4″ N); Jilantai station, which is the closest station to the HLM sampling site (Figure 2b; 105°48′46″ E, 39°44′6″ N); Baotou station, which is the closest station to the WLM sampling site (Figure 2c; 109°53′34″ E, 40°40′34″ N); and Abaga Banner station, which is the closest station to the WLL sampling site (Figure 2d; 115°1′34″ E, 44°1′5″ N). The data were obtained from National Meteorological Information Center at http://data.cma.cn/ (accessed on 25 October 2022).
We adopted 1955–2016 annual and monthly runoff data obtained by the closest station to the sampling area, and the data were from a hydrological yearbook published by the local Hydrological Survey Bureau. The selected hydrological stations were Langxinshan station, which is the closest station to the HHR sampling site; Xiazigou station, which is the closest station to the HLM sampling site; Atshan station, which is the closest station to the WLM sampling site; and Xilinhaote station, which is the closest station to the WLL sampling site.

2.4. Data Analytical Methods

Corresponding data from adjacent stations were used for missing data, and correlation analysis and regression analysis were used for interpolation and expansion. The response relationship between tree growth and climatic factors is the basis for the reconstruction of historical precipitation and climatic factors. The strength of their correlation reflects whether the response relationship is close or not, and a good correlation is the guarantee for reliable reconstruction. Therefore, the Pearson correlation function was adopted to analyze the correlation between the tree-ring index and climatic data; the calculation formula is as follows:
r ( x ,   y ) = i = 1 n x i x ¯ y i y ¯ i = 1 n x i x ¯ 2 i = 1 n y i y ¯ 2 ;   x ¯ = 1 N i = 1 n x i ,   y ¯ = 1 N i = 1 n y i
The reconstruction of historical precipitation is one of the core works of this paper. It is based on the significant correlation between annual ring index and climatic data and constructs a linear regression equation through regression analysis. The expression is as follows:
Y = a × X + b
in which Y is the reconstructed precipitation elements, X is the ring index, a is the tendency rate, and b is the equation intercept. The least squares method was used to estimate the parameters of the linear regression equation. When the sum of squares between the values obtained by the equation and the measured values reached the minimum, two unknowns, a and b , were determined to complete the construction of the reconstruction equation.
The integrity and reliability of the reconstructed model were tested using the split-sample method, which is widely used in dendrochronological studies [24]. The statistical parameters used in this study were Pearson’s correlation coefficient (r), R-squared (R2), the sign test (ST) value, reduction of error (RE), coefficient of efficiency (CE), and the product means test (t) value. RE and CE can be used to accurately test the reliability of reconstructed values. Positive RE and CE values indicate that the reconstructed model has a certain predictive ability, and the closer the two values are to 1, the stronger is the predictive ability of the reconstructed model. ST can be used to test the similarity between the between the low-frequency signals of the reconstructed values and those of the measured values by calculating the number of times when the anomalies of the reconstructed and measured values have the same or opposite sign. t evaluates the signs and magnitudes of the anomalies of the reconstructed and measured values and thus can intuitively reflect the hydroclimatological information in the reconstructed values.
RE is calculated by the following formula:
RE = 1.0 ( x i x i ) 2 ( x i x c ) 2
The CE calculation formula is as follows:
RE = 1.0 ( x i x c ) 2 ( x i x v ) 2
where x i , x i are the measured and reconstructed values of the climatic data in the i -th year of the inspection period, respectively, and x c ,     x v are the measured mean values of climatic data in the calibration period and the inspection period, respectively.
The calculation method of ST1 is as follows: first, the measured value and reconstructed value of the climatic data in the inspection period were made a first-order difference, and then the first-order difference sequence was carried out for a sign test. If the significance test of the corresponding level was passed, this indicated that the reconstructed value was consistent with the measured value in the high-frequency variation.
The Z-score method was used for the standardization of the reconstructed historical precipitation series using the following calculation formula:
Z - score = R MN / SD
In the formula, R is the reconstructed precipitation, mm;   MN is the mean of the precipitation series, mm; and SD is the standard deviation of the reconstructed precipitation series, mm.
The covariance coefficient of variation ( CV ) was used to represent the strength of variability of the reconstructed historical precipitation series. CV was calculated by the following formula:
CV = SD / MN
where SD is the standard deviation of the reconstructed historical precipitation series, mm, and MN is the mean value of the reconstructed historical precipitation series, mm. The tendency rate was used for the analysis of precipitation trends.
The periodic variability of the reconstructed historical precipitation series was analyzed using the Morlet wavelet [25], which is defined as follows:
ψ t = C e t 2 / 2 cos 5 t
The scale factor (a) of Morlet wavelet and periodicity (T) have the following relationship:
T = 4 π ω 0 2 + ω 0 2 ×
where ω 0 is usually an empirical value close to 6.2.
The Mann–Kendall nonparametric statistical method was used to detect any abrupt changes in the reconstructed precipitation series [26], which is defined as follows:
d k = j = 1 k r j   ,   k = 2 ,   3 , n   ,   r j = + 1 ,   if   x i   >   x j 0 ,   if   x i   x j   j = 1 ,   2 ,   ,   i  
E ( d k ) = k ( k   -   1 ) / 4 var d k = k ( k   -   1 )   ( 2 k + 5 ) / 72
  UF K = [ d k   - E d k ] var ( d k )   ,   k = 1 ,   2   ,   n
where UF k is approximately subject to the standard normal distribution;   d k is the cumulative count of the number of values at time i greater than that at time j; E ( dk ) is the mean value of cumulative count d k ; and var ( d k ) is the variance of the cumulative count d k . The above calculation was implemented by MATLAB programming. When the intersection of UF and UB was within the reliability line and there was only one intersection point, the intersection point was the mutation year. When the intersection of two lines was outside the reliability line or multiple mutation points were detected, the mutation points were further checked by the Pettitt test.

3. Results and Discussion

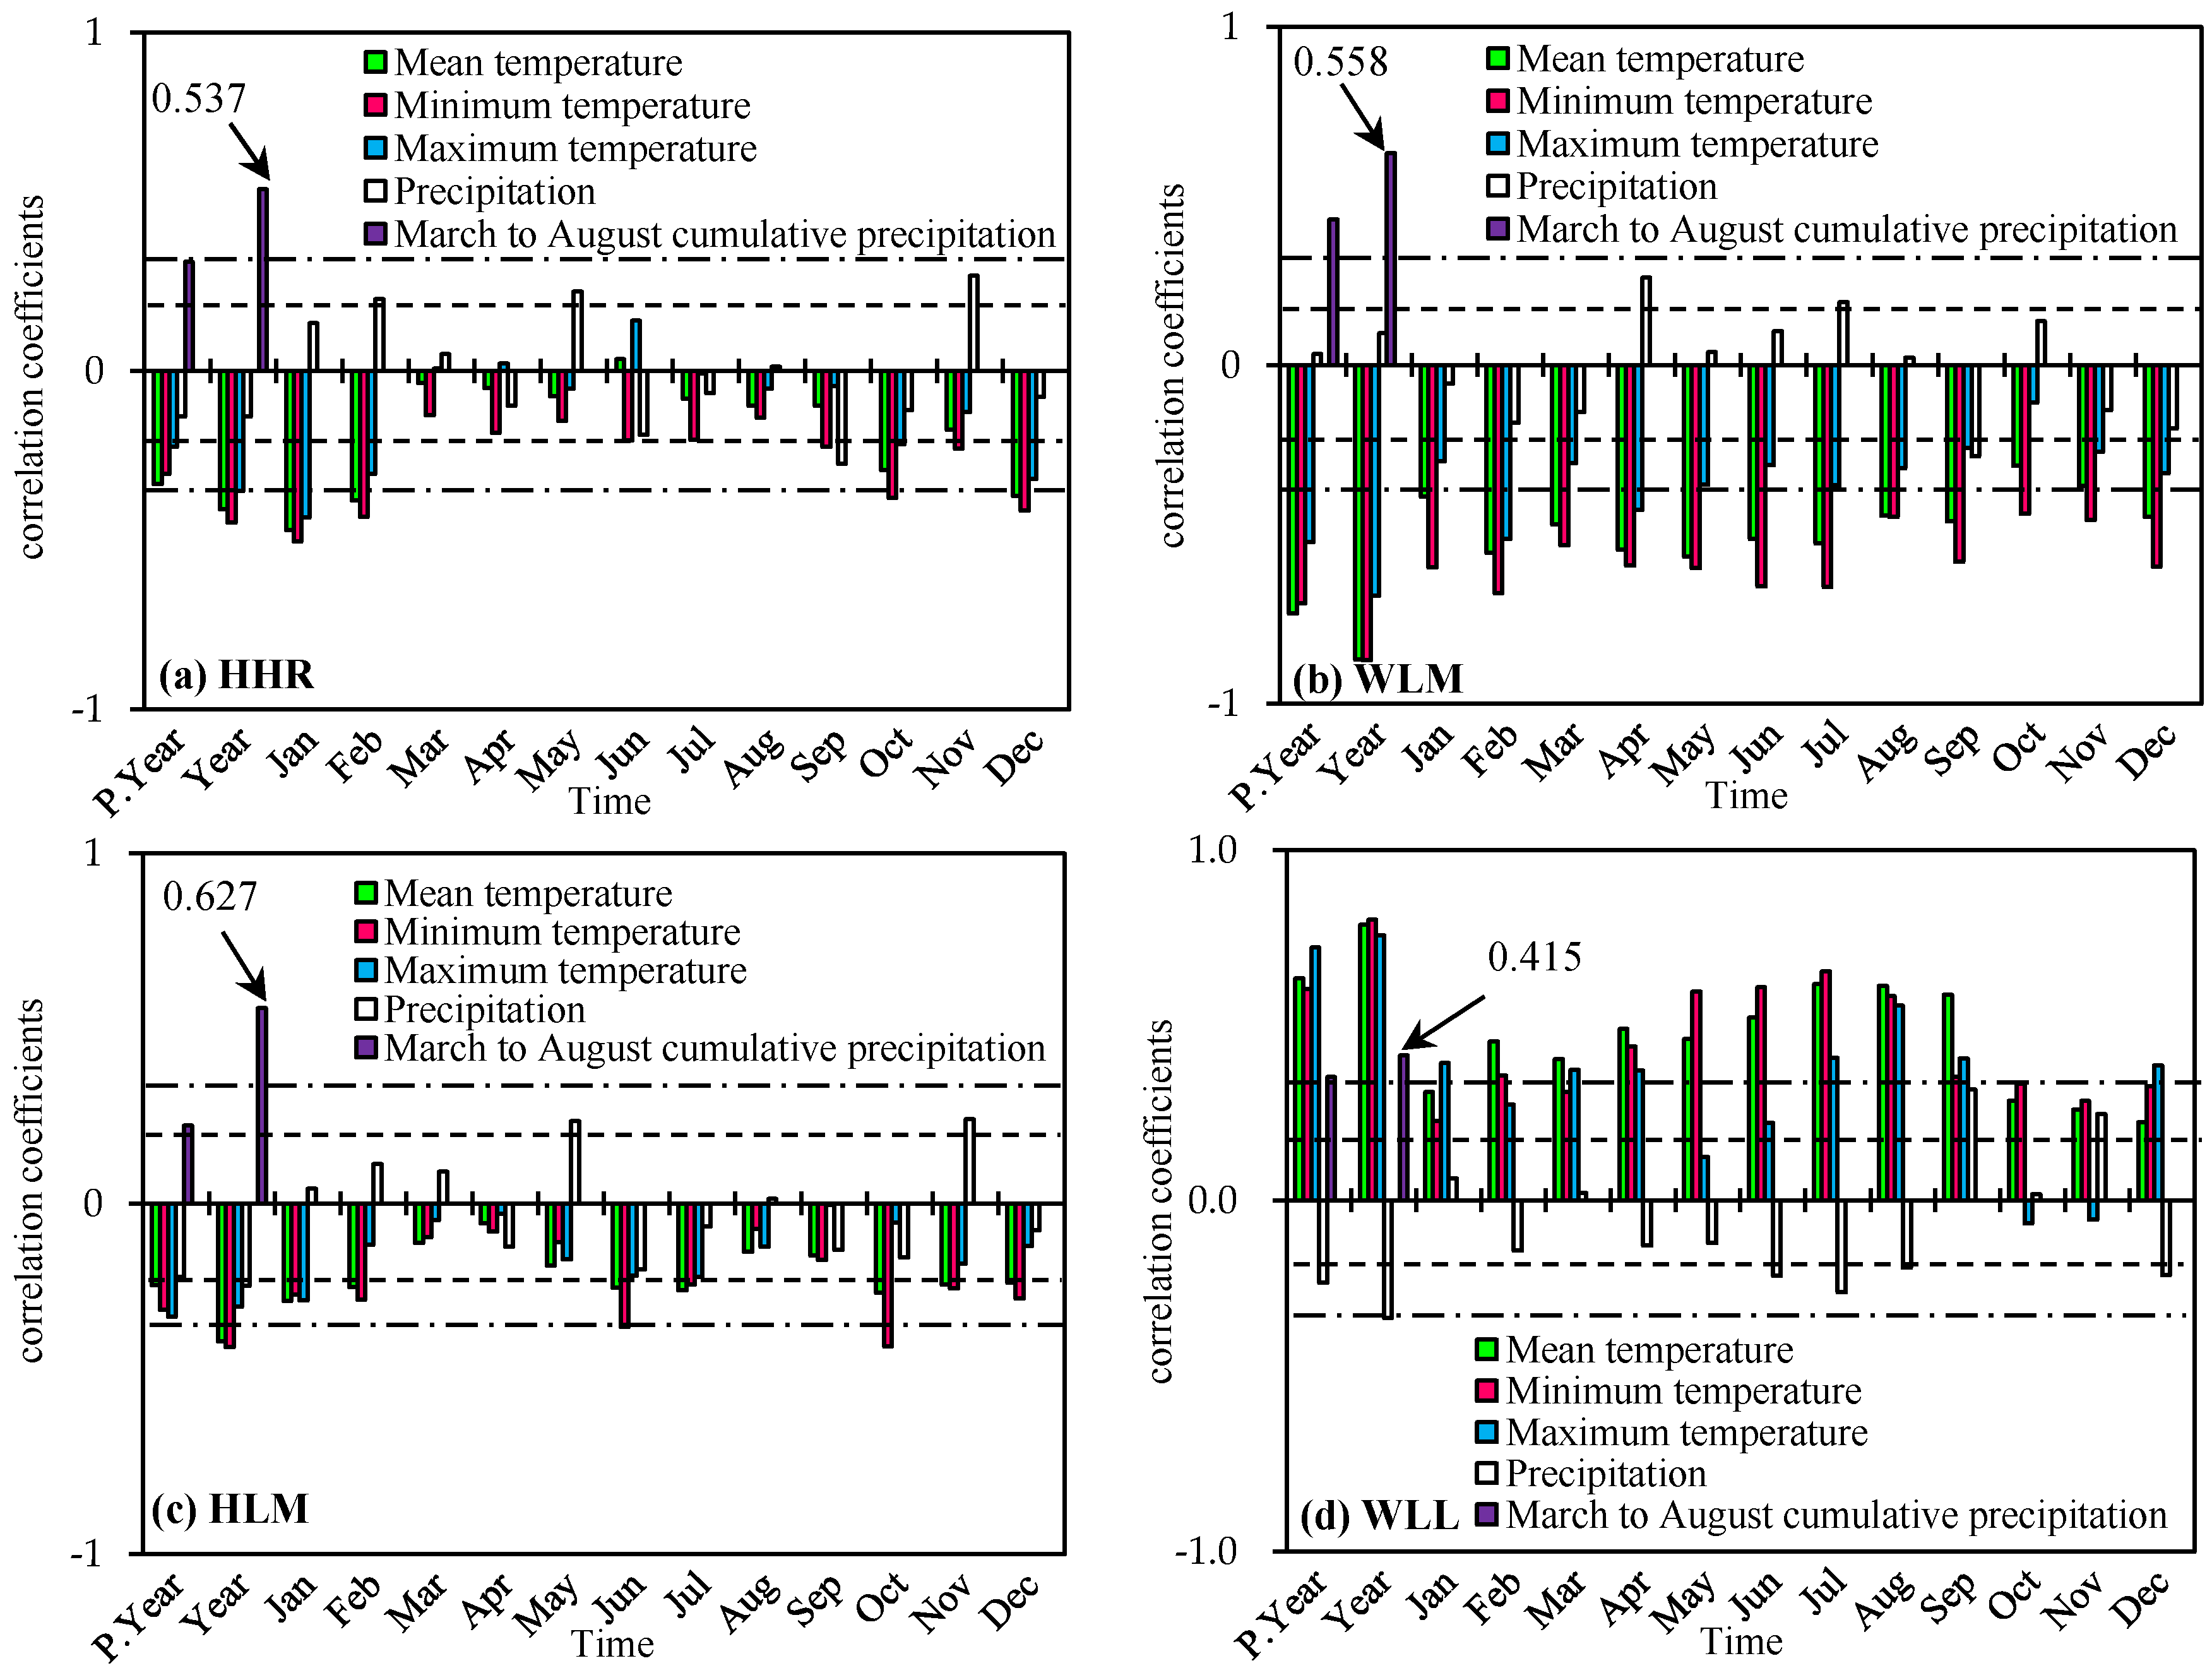
3.1. Response of Tree Growth to Hydroclimatic Factors in Sampling Regions

Figure 4 summarizes the correlation coefficients between the tree-ring indices of different tree species and hydroclimatic factors in different areas. The figure illustrates that the tree-ring index was closely correlated with the local temperature and cumulative precipitation from March to August. Except for March, April, and June in WLL and Ejin Banner, the tree-ring index was negatively correlated with all three types of annual and monthly temperature (average temperature, average maximum temperature, and average minimum temperature). The central and western parts are typical arid and semiarid areas, in which temperature can affect the growth of trees through the water-bearing condition in soils and the respiratory efficiency and transpiration rate of trees [27,28].
The response relationship between the change of climatic factors in the previous year and the tree growth in the current year was poor, indicating that the change of climatic factors in the study area in the previous year had slightly less influence on the tree diameter growth in all regions than that in the current year, so the subsequent analysis was mainly in the current year. As also shown in Figure 4, the radial growth of trees showed significant positive or negative correlations with the three types of temperature in different areas. Its correlation coefficients for the annual temperatures (all three types) were all higher than those of monthly temperatures. Its correlation coefficients followed the order of annual average minimum temperature > annual average temperature > annual average maximum temperature (with values of −0.448, −0.41, −0.87, and 0.801, all significant at the 99% level).
Considering the monthly data specifically, the radial growth was overall highly correlated with the average minimum temperature for the different tree species, moderately correlated with the average temperature, and weakly correlated with the average maximum temperature. Specifically, the radial growth of Populus euphratica, Oliv in Ejin Banner responded more strongly to the three types of temperature in January and February (average correlation coefficients were −0.435 and −0.383, respectively) than it did in other months, and the three types of temperature during March–September weakly affected the radial growth of Populus euphratica, Oliv. Picea asperata Mast. in HLM was the most sensitive to the average minimum temperature in June (−0.353) and October (−0.408) and the least sensitive to the three types of temperature in March and April. The three types of monthly temperature played dominant roles in the growth of Platycladus orientalis (L.) Franco in WLM. The above effects were all significant at the 95% level, indicating that the three types of temperature all significantly controlled the radial growth of Platycladus orientalis (L.) Franco. In contrast, the radial growth of Ulmus pumila L. in WLL was positively correlated with the three types of temperature (except for the average maximum temperature in October and November), and the contribution of all three types of temperature during May–August to the growth of Ulmus pumila L. was clearly higher than that during other months.
The study area is a typical arid to semiarid area, with radial growth of trees and the climate factors, wherein there exists a complex relationship among the growing season precipitation for local trees with a vital role in the growth of the year. Due to the large differences in geographical location and landform of the four sampling points in the study area, the dependence of annual ring tables in various regions on the combined monthly precipitation and monthly precipitation in the growth period is different. In general, HHR, WLM, and HLM regions had a large dependence on precipitation in individual months such as the initial growth period (April, May) or peak period (July) [29], passing the 95% significance test, However, the relationship between tree-ring annual table and precipitation in March–August combination months in all regions was generally good (Figure 4), and both passed the 99% significance test (Figure 5). This may have been because the tree-ring width annual table reflected the overall situation of the annual radial growth of trees, which cannot be divided into single month growth, and the main radial growth of trees comes from the contribution of the growing season. The precipitation during this period accounts for a large proportion of the annual precipitation, and thus the combined monthly precipitation from March to August has a greater impact on the radial growth of trees than the single monthly precipitation, showing that the correlation between the tree-ring width chronology and the combined monthly precipitation from March to August was better than that between the combined monthly precipitation and the single month in terms of the significance test.
The situation in the WLL region was quite different from that in other three regions. It can be seen that the WLL region was generally negatively correlated with the precipitation in a single month, while it was positively correlated with the combined precipitation in March–August. We believe that the main reason for this unusual phenomenon is that the WLL region is located at the edge of Horqin sandy land, where the vegetation is sparse and the soil desertification is serious, leading to the obvious weakening of the soil water holding capacity compared with the other three regions, wherein March to August is the period when the runoff in the study area increases sharply. At this time, under the catalysis of a large amount of precipitation, it is easy for flooding disasters to occur in the area. The high temperature in the growing season enhances the respiration of tree roots, and the flooding disasters lead to oxygen deficiency in the soil, thus adversely affecting the growth of trees [30]. Therefore, in the significance test, it shows that there is a generally negative correlation between tree-ring chronology and monthly precipitation. Moreover, the months with more precipitation (July–August) had a more significant negative correlation. As we all know, water is the most important condition for the growth of trees. As the only way to supplement water in the study area, precipitation not only directly affects the growth of trees in this area but also uses indirect influences to promote the radial growth of trees, such as supplementing runoff, increasing soil moisture, or affecting air humidity. Therefore, even though high precipitation in a single month is likely to adversely affect the growth of trees, the promotion of precipitation in a growing season on tree growth is still very important. In the significance test, there was a positive correlation between the annual table of tree-ring width and the precipitation from March to August. However, on the basis of the above reasons, the correlation coefficient was lower than the other three regions.
To sum up, we connected the radial growth of trees with the accumulated precipitation from March to August (Figure 5) and found that the cumulative precipitation from March to August had a good correlation with the radial growth of trees. The correlation coefficients were 0.537 (p < 0.01) in HHR, 0.558 (p < 0.01) in WLM, 0.627 (p < 0.01) in HLM, and 0.415 (p < 0.01) in WLM (Figure 4). After entering autumn and winter, under the restriction of lower temperature, very little precipitation had little significance for the radial growth of trees. Therefore, in order to compare the reconstruction results with each other and with other studies, this study unified the time scale of reconstruction and used the combined monthly precipitation consistent with the physiological significance of tree growth for reconstruction, that is, the main growth seasons of trees in the study area were spring and summer (cumulative precipitation from March to August), so as to facilitate the subsequent climate reconstruction and comparative analysis [31].

3.2. Reconstruction of Precipitation during the Growth Season

The correlation analyses above reveal that the tree indices in different areas were strongly correlated with cumulative precipitation from March to August. On the basis of linear regression, the growth-season precipitation series in the different areas were reconstructed. The reconstruction functions and the associated parameters are given in Table 3, in which T i is the growth-season precipitation in the ith year and It is the tree-ring index in the tth year.
When we compare the reconstructed values (Figure 6) with measured values given in the literature, the results show that there were temporally synchronized variations in the two datasets. The reconstructed series was divided into two periods, 1951–1983 and 1984–2016, which were the calibration period and test period for each other. In the test period, the reduced error (RE) and effective coefficient (CE) were both positive in the different areas [24,32]. In detail, RE was close to 1, implying that the regression model can yield reliable predictions [24,32]. For the sign test (ST) and the first-order difference of ST (ST1), the values were both significant (>95% confidence level), suggesting that the reconstructed series were quite consistent with the measured series regarding both high- and low-frequency variations. For the calibration period, the correlation coefficient (r) and the product average (t) between the measured series and reconstructed series for the two periods both passed the 95% significance level, indicating that the reconstructed values contain abundant information about hydrological factors. In conclusion, the reconstructed functions for the four areas were stable and reliable, and thus they can be utilized to accurately reconstruct the growth-season precipitation series in the past in the study area.
Although the correlation analysis can show the direct degree of correlation through the correlation coefficient, when the correlation coefficient was the same, there may be huge performance differences between variables that cannot truly reflect the actual relationship. Scatter plots can intuitively observe the independence, normality, and aggregation of data, thus helping to further determine the trend of correlation between variables. The aggregation feature of the scatter chart indicates the degree of correlation significance, that is, the more concentrated the point distribution, the higher the degree of correlation significance. The axial slope of the scatter map was proportional to the size of the correlation between the data. The relative position relationship of the points can reflect the statistical nature of the data itself. As shown in Figure 6, the aggregation degree of cumulative precipitation from March to August in each region was generally high, indicating that there was a good linear relationship between them, and the correlation coefficient reached a 99% significance level.

3.3. Temporal and Spatial Variabilities of Growth-Season Precipitation

The reconstructed precipitation series during March–August in the different areas during 1800–2016 were analyzed. Overall (Figure 7), in the past 200 years, the precipitation in the different areas alternated between dry and wet periods. In terms of the sliding trend, precipitation in the different areas all experienced a trend of decrease–increase–decrease–increase–decrease, i.e., the variations in precipitation were synchronized in the study area, although the drying and wetting events occurred at slightly different times in the different areas.
Regarding the stages, in the early 19th century, except at HHR, the precipitation series all pointed to a significant rising trend, and HLM and WLL experienced a 30-year wet period, after which precipitation started to dry. In contrast, HHR exhibited a different trend of switching from a rapid increase to a rapid decrease with the occurrence of a 30-year wet period, and the precipitation displayed a dry to wet trend from the eastern and western parts to the central area. From the mid-19th century to the 1940s, the reconstructed series for all the areas show sudden changes, with precipitation continuously rising. HLM experienced an approximately 60-year drought, WLM experienced a 13-year drought, and HHR and WLL first experienced an approximately 45-year wetting period followed by lower precipitation. After the 1960s, all the areas experienced 25–50-year drought periods, and from west to east, the drought period gradually shortened. During this period, the series show that the nearly 100-year rising trend for precipitation ended; precipitation showed a gradually decreasing trend in HLM and a rapidly decreasing trend in other areas, while there was an increasing trend starting in 1992 in HHR and WLM, which was closely related to the sudden change in precipitation in the 20th century.
In summary, the variations in the drought and wet periods in the reconstructed series across the study area gradually decreased from the eastern and western parts to the central part, and these periods gradually shortened from 35–60 years to <25 years. From the 1820s to the 1950s, under the influence of global climate warming, the study area experienced a significant 60–90-year rising period, and the increasing precipitation trend lasted longer in the western part than in the eastern part, which may have been because the western part of the study area is closer to the core Asian westerly jet area.

3.4. Comparison of the Reconstruction Results for Other Regions in the Asian Westerly Jet Area and Transition Zone with Historical Climate Events

A comparison of our reconstruction with meteorological events recorded in the ancient literature in this area and its surroundings shows that the reconstructed growth-season precipitation series for the four typical regions in the joint area corresponds well to most literature records of droughts and floods [27,33,34]. For instance, in 1897 in HLM, Leping and Baodezhou (in the area of Xinzhou city, Shanxi Province) experienced severe droughts in July, resulting in mass crop deaths. A flood occurred in the central and western parts of Inner Mongolia from 1935 to 1951, which overlaps with the last wetting period according to the reconstruction results for WLM (1937–1951). From 1947 to 1750, Baotou experienced a severe drought, and the reconstructed series for WLM during this period showed significantly lower precipitation than in the previous period. During 1908–1909 and 1926–1928, Inner Mongolia often experienced heavy winds in spring and summer, extreme droughts in spring, poor harvests, shortages of crop seeds in spring, and abandoned farmlands, and these periods generally correspond to the second drought period (1908–1926) captured by the reconstructed series at WLM. In 1912, China entered the era of the Republic of China, and at the call to undertake the large-scale development of Northwest China, water conservancy projects and afforestation activities started in the downstream area of Heihe River, and these human interventions protected the ecosystem to some degree to increase vegetation, which caused the temperature to continuously fall. In summary, the drought and flood periods recorded in the literature were all captured in the reconstructed series, revealing that the reconstruction results for the growth-season precipitation in this study can accurately represent precipitation variations in the study area, and thus the reconstruction results are reliable and useful.
To illustrate the spatial and temporal variations directly and fully in the growth-season precipitation in the joint area studied here, the reconstructed results were further compared with the existing temperature reconstruction results for four areas in the central and western parts of the Asian westerly jet area and the middle- and high-latitude areas of the transition zone (Figure 8). Figure 9a shows the exploratory precipitation in North-Central China during 1600~2000 [35]. Figure 9b shows the reconstructed annual precipitation (SSA) [18] during 1602~2014 in the Russian Far East (high-altitude area in the transition zone). Figure 9c shows the annual precipitation (CSA) [18] during 1804~2009 in the Russian Far East. Figure 9d shows the reconstructed annual precipitation (XSM) [17] during 1829~2013 in the Hulunbuir area in Northeast China (middle-altitude area in the transition zone). Finally, Figure 9e shows the reconstructed summer precipitation series (KR) [15] during 1650~2015 in Tajikistan (located in the west of the central Asian westerly).
It can be seen from Figure 9 that there is a certain dry–wet synchronous change in the precipitation change trend of each region. Most regions experienced a continuous upward trend in precipitation in the 18th century, while almost all regions (except WLL region) had a significant downward trend in precipitation in the past century. A comparison between periods in the last 200 years shows that wet periods accounted for 18~27% of the time in the joint area, 22% in the western Asian westerly jet area, and approximately 50% in the middle- and high-altitude transition zone. The duration of the periodic variation was <60 years in the joint area, shorter than those in the other areas. Regarding the different stages, from the 1750s to the 1850s, all the areas experienced a significant precipitation trend of decreasing (except for the WLL), and the wet period lasted for a long time in the western joint area, as well as in the middle- and high-altitude transition zone. In the second half of the 19th century, i.e., after the second industrial revolution, precipitation experienced a transition from rapid drying to slow wetting in the joint area and central Asian westerly jet area, and kept dropping in other areas; moreover, the higher the altitude, the longer the drying trend lasted (Figure 9). Under the influence of global warming, precipitation in the joint area and central Asian westerly jet area returned to a rising trend at the beginning of the 21st century.

4. Conclusions

(1)
On the basis of the chronological table constructed from the tree-ring widths of four tree species in four typical regions located within the joint area of the Asian westerly jet area and the transition zone with a temperate continental monsoon climate, the growth-season precipitation series in the past 203–343 years in the joint area was reconstructed. The results show that the reconstruction functions are stable and reliable, and the results derived from them are reliable and useful. The reconstruction results in this study enrich the dendrochronological knowledge on these two special climate regions and fill the gap in knowledge on growth-season precipitation over the past four centuries in the joint area.
(2)
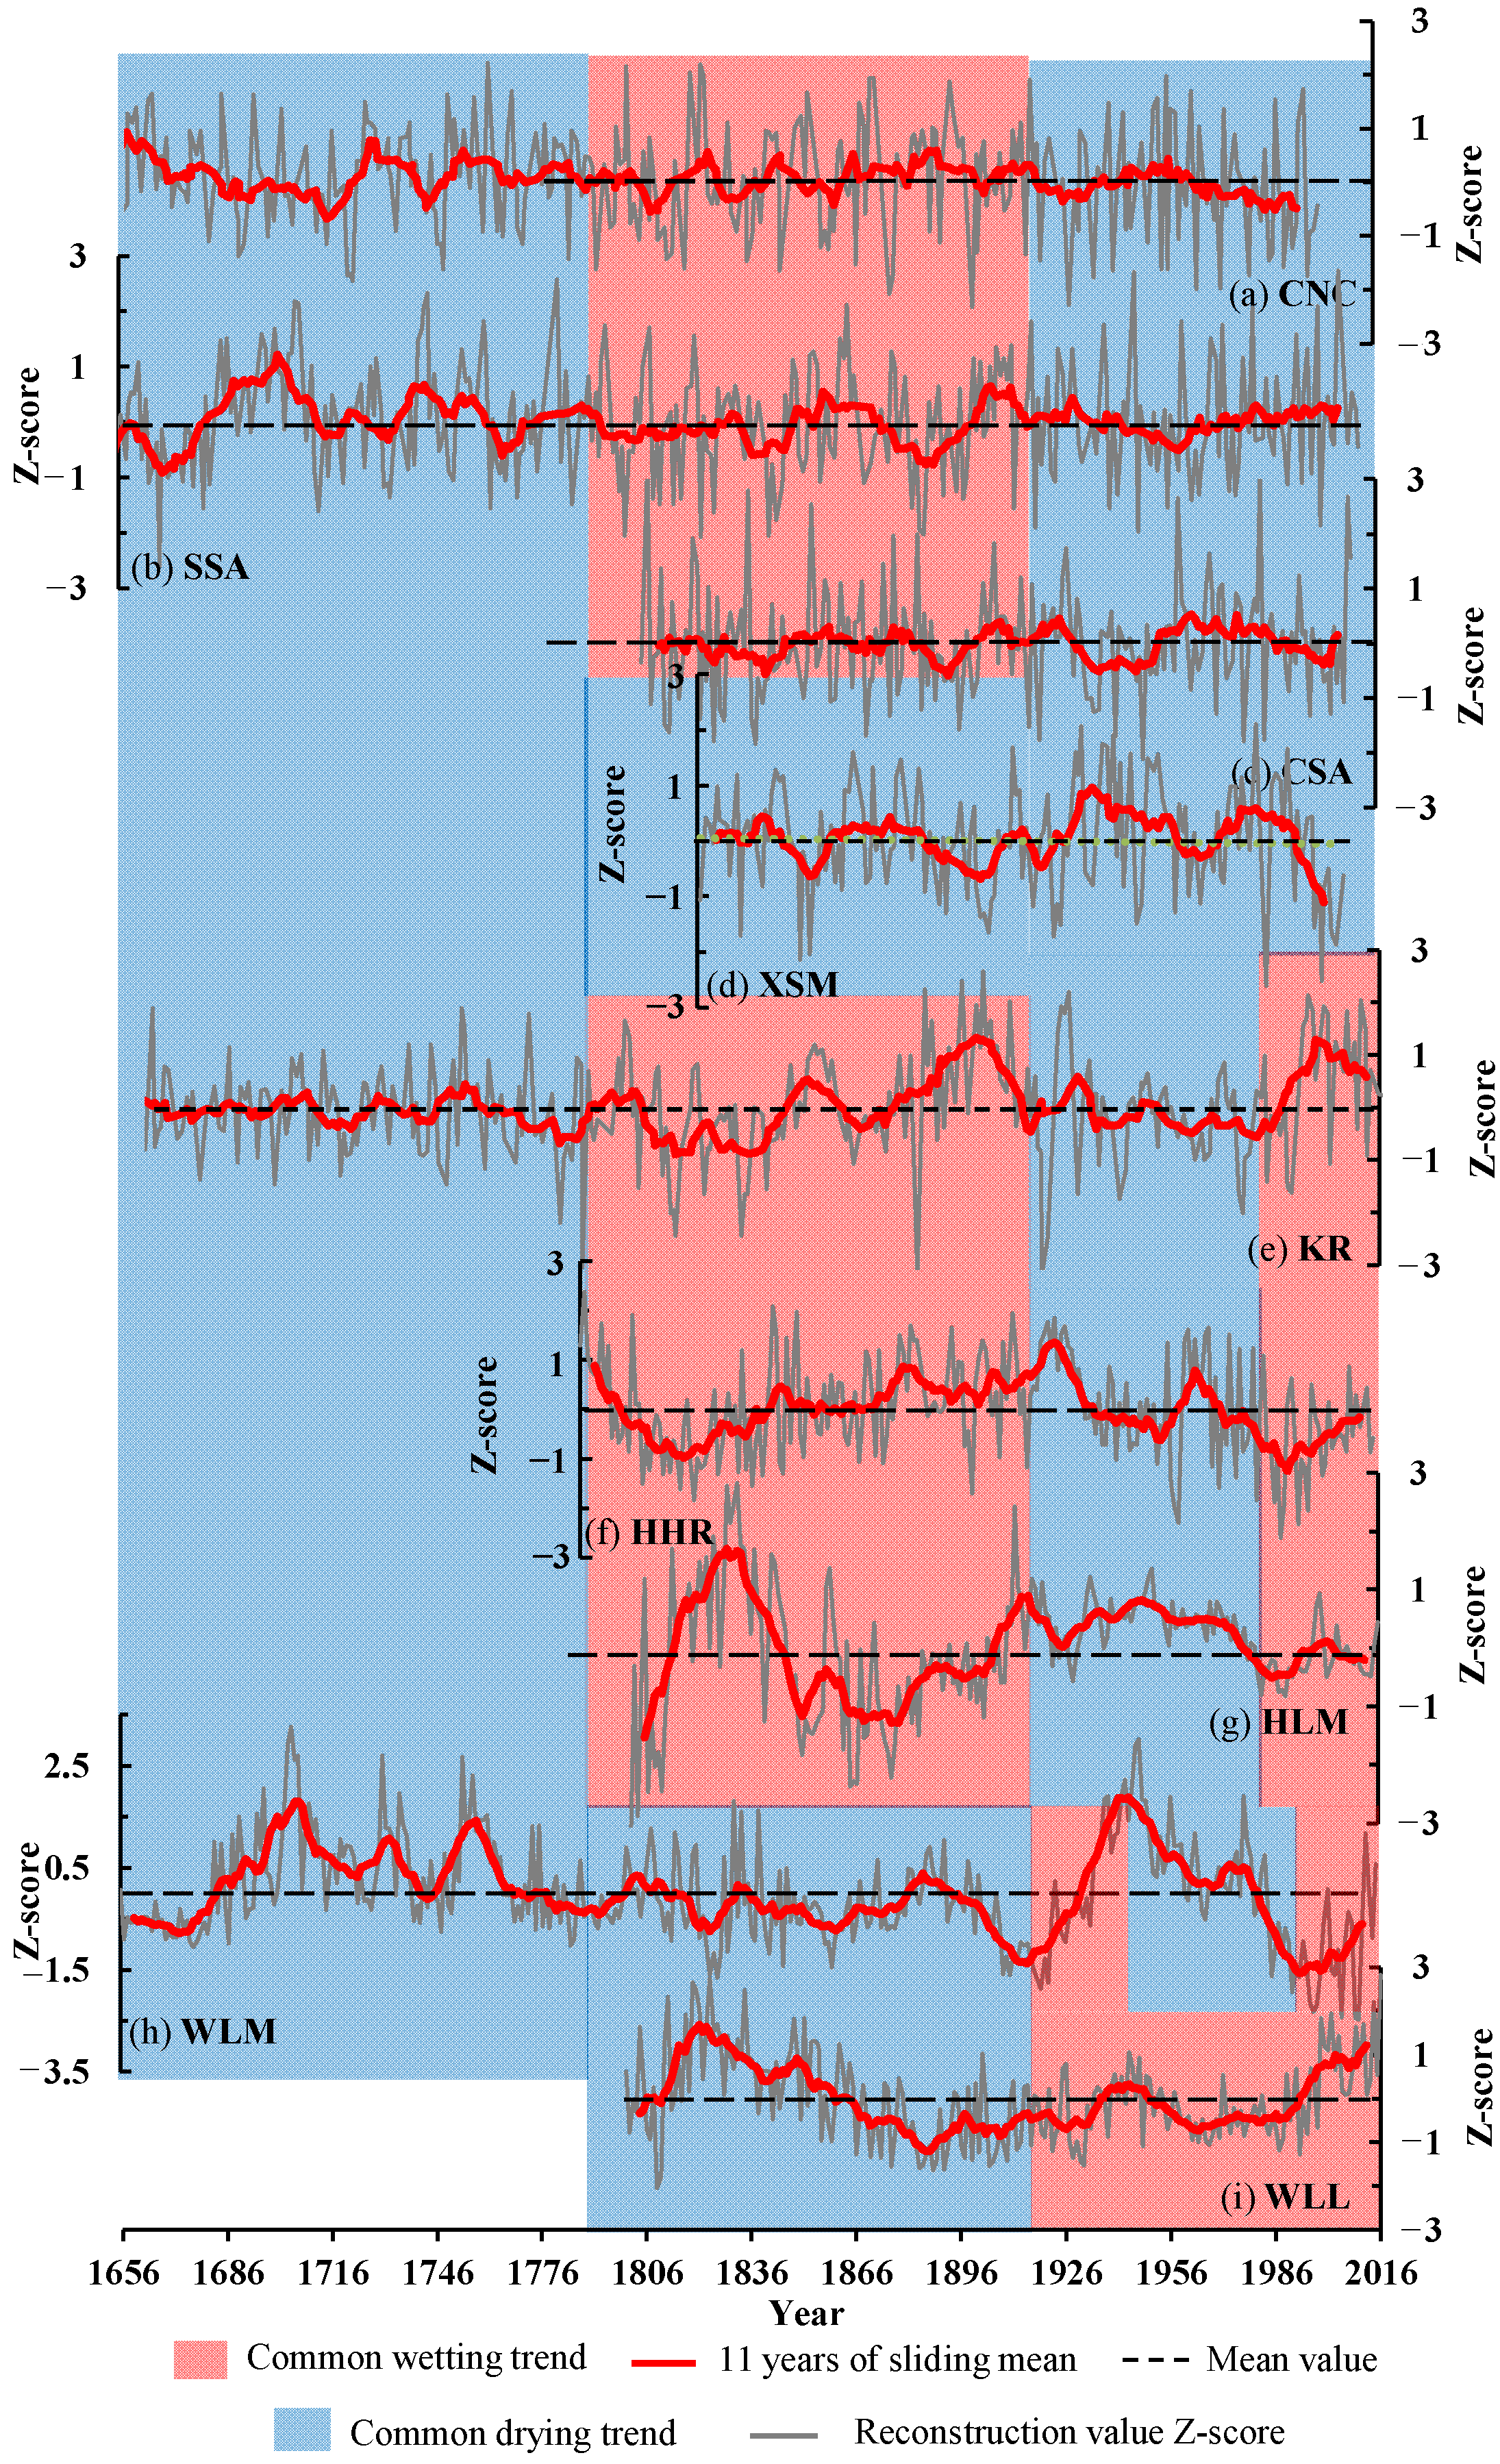
In the past 200 years in the joint area, the growth-season precipitation exhibited gradually intensifying variations that grew shorter from east to west. In the 19th century, the high-altitude area in the joint area experienced a wet followed by a trend of transitioning from wet to dry. After this period and before the 1950s, the entire joint area experienced a significant dry period that lasted for 20~45 years. During this period, the starting time of the dry period became gradually delayed from west to center, and the wetting periods grew gradually shorter but came with greater frequency. In the last half-century, the joint area experienced a significant drying period, with the drying rate higher in the western and eastern parts than in the central part.
(3)
The reconstruction results from this study correspond well to the drought and flood periods recorded in the local records, demonstrating that the reconstruction results are reliable and useful. The growth-season precipitation variations in the last two centuries show that in the joint area, precipitation has shown more intensified variations, and wet periods accounted for a large percentage of the whole series, even though they are short. In the first half of the 19th century, the central and western parts of the Asian westerly jet area, the high-altitude area of the transition zone all experienced significant wet periods or wetting trends. After that, under the influence of global warming, all areas experienced drying trends, and the drying times lasted longer in the Asian westerly jet area, with increased drying rates in some areas, implying that the westerly circulation may intensify droughts.

Author Contributions

B.S. carried out the analysis and compiled the proxy datasets. T.L. helped in the experimental design. X.H. provided the climate model data. B.S. and L.M. provided guidance in the interpretation and compilation of proxy data. B.S. wrote the paper, with contributions from all authors. All authors have read and agreed to the published version of the manuscript.

Funding

This research was supported by the Natural Science Foundation of China (grant nos. 52069019 and 51669016). We are grateful for their support.

Data Availability Statement

The data involved in this paper are also used in the ongoing research, so the data in this paper cannot be disclosed for the time being.

Conflicts of Interest

The authors declare that they have no conflict of interest.

References

  1. IPCC. Mitigation of Climate Change: Contribution of Working Group III to the Fifth Assessment Report of the Intergovernmental Panel on Climate Change; Climate Change; Cambridge University Press: Cambridge, UK, 2014. [Google Scholar]
  2. Wada, Y.; Bierkens, M.F. Sustainability of global water use: Past reconstruction and future projections. Environ. Res. Lett. 2014, 9, 104003. [Google Scholar] [CrossRef]
  3. Feng, S.; Hu, Q.; Huang, W.; Ho, C.H.; Li, R.; Tang, Z. Projected climate regime shift under future global warming from multi-model, multi-scenario CMIP5 simulations. Glob. Planet. Chang. 2014, 112, 41–52. [Google Scholar] [CrossRef]
  4. Liu, Y.; Sun, J.; Song, H.; Cai, Q.; Bao, G.; Li, X. Tree-ring hydrologic reconstructions for the Heihe River watershed, western China since AD 1430. Water Res. 2010, 44, 2781–2792. [Google Scholar] [CrossRef] [PubMed]
  5. Kamenos, N.A.; Hoey, T.B.; Nienow, P.; Fallick, A.E.; Claverie, T. Reconstructing Greenland ice sheet runoff using coralline algae. Geology 2012, 40, 1095–1098. [Google Scholar] [CrossRef]
  6. Kirchhefer, A.J. Dendroclimatology on Scots Pine (Pinus sylvestris L.) in Northern Norway; University of Tromsø: Tromsø, Norway, 2000. [Google Scholar]
  7. Gutiérrez, M.E. Dendroclimatological study of Pinus sylvestris L. in southern Catalonia (Spain). Tree-Ring Bull. 1989, 49, 1–9. [Google Scholar]
  8. Zhang, X.; Liu, Y.; Song, H.; Cai, Q.; Li, Q.; Zhao, B.; Mei, R. Interannual variability of PDSI from tree-ring widths for the past 278 years in Baotou, China. Trees 2017, 31, 1531–1541. [Google Scholar] [CrossRef]
  9. Zhang, R.; Yuan, Y.; Yu, S.; Chen, F.; Zhang, T. Past changes of spring drought in the inner Tianshan Mountains, China, as recorded by tree rings. Boreas 2017, 46, 688–696. [Google Scholar] [CrossRef]
  10. Mann, M.E.; Bradley, R.S.; Hughes, M.K. Global-scale temperature patterns and climate forcing over the past six centuries. Nature 1998, 392, 779–787. [Google Scholar] [CrossRef]
  11. Mann, M.E.; Bradley, R.S.; Hughes, M.K. Northern hemisphere temperatures during the past millennium: Inferences, uncertainties, and limitations. Geophys. Res. Lett. 1999, 26, 759–762. [Google Scholar] [CrossRef] [Green Version]
  12. D’Arrigo, R.; Wilson, R.; Deser, C.; Wiles, G.; Cook, E.; Villalba, R.; Linsley, B. Tropical–North Pacific climate linkages over the past four centuries. J. Clim. 2005, 18, 5253–5265. [Google Scholar] [CrossRef] [Green Version]
  13. Cook, E.R.; Anchukaitis, K.J.; Buckley, B.M.; D’Arrigo, R.D.; Jacoby, G.C.; Wright, W.E. Asian monsoon failure and megadrought during the last millennium. Science 2010, 328, 486–489. [Google Scholar] [CrossRef]
  14. Rossby, C.G. Relation between variations in the intensity of the zonal circulation of the atmosphere and the displacements of the semi-permanent centers of action. J. Mar. Res. 1939, 2, 38–55. [Google Scholar] [CrossRef]
  15. Chen, F.; Zhang, T.; Seim, A.; Yu, S.; Zhang, R.; Linderholm, H.W.; Kobuliev, Z.V.; Ahmadov, A.; Kodirov, A. Juniper tree-ring data from the Kuramin Range (Northern Tajikistan) reveals changing summer drought signals in western Central Asia. Forests 2019, 10, 505. [Google Scholar] [CrossRef] [Green Version]
  16. Peng, Z.; Qin, L.; Li, X.; Zhang, H.; Chen, Y.; Liu, R.; Zhang, R. Tree-ring-based temperature reconstruction since 1766 CE in the eastern Tianshan Mountains, arid Central Asia. Theor. Appl. Climatol. 2020, 142, 687–699. [Google Scholar] [CrossRef]
  17. Gao, J.; Shi, Z.; Xu, L.; Yang, X.; Jia, Z.; Lü, S.; Feng, C.; Shang, J. Precipitation variability in Hulunbuir, northeastern China since 1829 AD reconstructed from tree-rings and its linkage with remote oceans. J. Arid. Environ. 2013, 95, 14–21. [Google Scholar] [CrossRef]
  18. Ukhvatkina, O.; Omelko, A.; Kislov, D.; Zhmerenetsky, A.; Epifanova, T.; Altman, J. Tree-ring-based spring precipitation reconstruction in the Sikhote-Alin’Mountain range. Clim. Past 2021, 17, 951–967. [Google Scholar] [CrossRef]
  19. Liu, Y.; Zhang, X.; Song, H.; Cai, Q.; Li, Q.; Zhao, B.; Mei, R. Tree-ring-width-based PDSI reconstruction for central Inner Mongolia, China over the past 333 years. Clim. Dyn. 2017, 48, 867–879. [Google Scholar] [CrossRef]
  20. Liang, L.T.; Ma, L.; Liu, T.X.; Sun, B.L.; Zhou, Y. Spatiotemporal variation of the temperature mutation and warming hiatus over northern China during 1951~2014. China Environ. Sci. 2018, 38, 1601–1615. (In Chinese) [Google Scholar]
  21. Sun, B.L.; Ma, L.; Feng, Q.; Liu, T.X.; Liang, L.T.; Li, H.Y.; Zhou, Y.; Liu, Y. Response of the warming hiatus to changing influences over the Inner Mongolia Autonomous Region. China Environ. Sci. 2019, 39, 2131–2142. [Google Scholar]
  22. Holmes, R.L. Computer-assisted quality control in tree-ring dating and measurement. Tree-Ring Bull. 1983, 43, 69–78. [Google Scholar]
  23. Cook, E.R. A Time Series Analysis Approach to Tree-Ring Standardization; University of Arizona Press: Tucson, AZ, USA, 1985. [Google Scholar]
  24. Fritts, H.C. Tree Rings and Climate; Academic Press Inc. Ltd.: London, UK, 1976. [Google Scholar]
  25. Venugopal, V.; Foufoula-Georgiou, E. Energy decomposition of rainfall in the time-frequency-scale domain using wavelet packets. J. Hydrol. 1996, 187, 3–27. [Google Scholar] [CrossRef]
  26. Fu, C. The definition and detection of the abrupt climatic change. Sci. Atmos. Sin. 1992, 16, 482–493. [Google Scholar]
  27. Li, J. Study on the Historical Evolution of Ecological Environment in Heihe River Basin. Ph.D. Dissertation, Zhejiang Normal University, Jinhua, China, 2010. [Google Scholar]
  28. Yu, D.; Wang, Q.; Wang, Y.; Zhou, W.; Ding, H.; Fang, X.; Jiang, S.; Dai, L. Climatic effects on radial growth of major tree species on Changbai Mountain. Ann. For. Sci. 2011, 68, 921–933. [Google Scholar] [CrossRef] [Green Version]
  29. Cai, Q.; Liu, Y.; Fang, C.; Xie, M.; Zhang, H.; Li, Q.; Song, H.; Sun, C.; Liu, R.; Di, T.; et al. Insight into spatial-temporal patterns of hydroclimate change on the Chinese Loess Plateau over the past 250 years, using new evidence from tree rings. Sci. Total Environ. 2022, 850, 157960. [Google Scholar] [CrossRef] [PubMed]
  30. Shang, J.; Shi, Z.; Gao, J.; Xu, L.; Lu, S.; Feng, C.; Wang, L. Response of tree-ring width of Pinus sylvestris var. mongolica to climate change in Hulunbuir sand land, China. Acta Ecol. Sin. 2012, 32, 1077–1084. [Google Scholar] [CrossRef]
  31. Chen, X.; Tan, Z.; Schwartz, M.D.; Xu, C. Determining the growing season of land vegetation on the basis of plant phenology and satellite data in Northern China. Int. J. Biometeorol. 2000, 44, 97–101. [Google Scholar] [CrossRef]
  32. Fritts, H.C. Rconstuction Large-Scale Climate Patterns from Tree-Ring Data; The University of Arizona Press: Tucson, AZ, USA, 1991. [Google Scholar]
  33. Li, S. Records of Ejin Banner; Local Records Publishing House: Beijing, China, 1998. [Google Scholar]
  34. Wen, K. The Compilation of China Meteorological Disaster Canon; China Meteorological Press: Beijing, China, 2008. (In Chinese) [Google Scholar]
  35. Yi, L.; Yu, H.; Xu, X.; Yao, J.; Su, Q.; Ge, J. Exploratory precipitation in North-Central China during the past four centuries. Acta Geol. Sin. 2010, 84, 223–229. [Google Scholar] [CrossRef]
Figure 1. Climate and the distribution of sampling points in the study area.
Forests 14 00111 g001
Figure 2. Distribution of monthly hydroclimatic data for each sampling area in the study region from 1951 to 2016. (a) Ejina meteorological station; (b) Jilantai meteorological station; (c) Baotou meteorological station; (d) Abaga Banner meteorological station; (e) Langxinshan hydrological station; (f) Xiazigou hydrological station; (g) Atashan hydrological station; (h) Xilinhaote hydrological station.
Forests 14 00111 g002
Figure 3. Standard chronological table, sampling size, and SSS for different tree species.
Forests 14 00111 g003
Figure 4. Correlation between annual and monthly climate factors and annual ring index in each region.
Forests 14 00111 g004
Figure 5. Comparison of tree-ring chronology and local cumulative precipitation from March to August.
Forests 14 00111 g005
Figure 6. Comparison of reconstructed and measured values for growth-season precipitation and dispersion graphs of tree-ring chronology and accumulated precipitation from March to August in different areas.
Forests 14 00111 g006
Figure 7. (a,c,e,g) Variations in the reconstructed precipitation series during the growth season (March to August). (b,d,f,h) Wavelet analysis time-frequency distribution of the reconstructed series.
Forests 14 00111 g007
Figure 8. Distribution of the reconstruction locations in this study and other reconstruction locations in the Asian westerly jet area and the transition zone.
Forests 14 00111 g008
Figure 9. Comparison of the reconstruction results in this study and other reconstruction results for the joint area and the transition zone; (a) shows the exploratory precipitation in North-Central China during 1600~2000; (b) shows the reconstructed annual precipitation (SSA) during 1602~2014 in the Russian Far East (high-altitude area in the transition zone); (c) shows the annual precipitation (CSA) during 1804~2009 in the Russian Far East; (d) shows the reconstructed annual precipitation (XSM) during 1829~2013 in the Hulunbuir area in Northeast China (middle-altitude area in the transition zone); (e) shows the reconstructed summer precipitation series (KR) during 1650~2015 in Tajikistan (located in the west of the central Asian westerly); (f~i) are the reconstruction results of this study.
Forests 14 00111 g009
Table 1. Summary of sampling in each sampling area.
Short for Sampling PlaceSample Tree SpeciesLongitude and LatitudeMean ElevationTime of SamplingSample Plant (Tree)Sample Core (Root)Average Tree Diameter (cm)Average Tree Height (m)Canopy Closure (%)Slope
HHRPopulus euphratica, Oliv101°09′33″ E
41°59′09″ N
10118, 2017316291.214.56010°~15°
HLMPicea asperata Mast.105°47′47″ E
38°39′42″ N
23347, 2017387645.56.45825°~35°
WLMPlatycladus orientalis (L.) Franco109°24′11″ E
40°42′12″ N
17807, 20174910528.93.95835°~38°
WLLUlmus pumila L.116°26′28″ E
42°19′15″ N
9888, 2017418752.613.76515°~20°
Combined 159330
Table 2. Standard chronological table and statistical indices for different regions.
Statistical IndicatorsStatistic
HHRHLMWLMWLL
Average value1.0001.0001.0001.000
Median0.8320.7450.9410.843
Skewness0.9390.3630.9870.746
Kurtosis1.9741.1591.9741.832
Mean sensitivity0.3630.4260.1930.326
Standard deviation0.3320.1530.3120.388
The first-order autocorrelation coefficient0.504 (p < 0.01)0.651 (p < 0.01)0.604 (p < 0.01)0.560 (p < 0.01)
The average correlation coefficient between each sequence and the main sequence0.5610.6570.6610.671
Mean correlation coefficient between trees0.4380.4340.3590.539
SNR (signal to noise ratio)13.12216.15815.12214.133
Overall representativeness of samples0.7240.9460.9250.691
The first principal component explains the variance %41.67220.35140.38453.424
First year of subsample with signal strength > 0.851796178816661813
Table 3. Functions and associated parameters for reconstructing growth-season precipitation in different areas.
Serial NumberThe Reconstruction EquationrNR2adjFSignificance LevelRECE
HHR T i = 3.0671 I t + 1.8503 0.537660.33425.94p < 0.0010.8320.663
HLM T i = 40.944 I t 24.904 0.5580.42327.640.7330.423
WLM T i = 29.662 I t + 10.918 0.6270.60141.520.8030.337
WLL T i = 70.587 I t 36.171 0.4150.42413.320.7150.334
Disclaimer/Publisher’s Note: The statements, opinions and data contained in all publications are solely those of the individual author(s) and contributor(s) and not of MDPI and/or the editor(s). MDPI and/or the editor(s) disclaim responsibility for any injury to people or property resulting from any ideas, methods, instructions or products referred to in the content.

