
Forest Dynamics and Agroforestry History since AD 200 in the Highland of Sumatra, Indonesia

Abstract
:1. Introduction
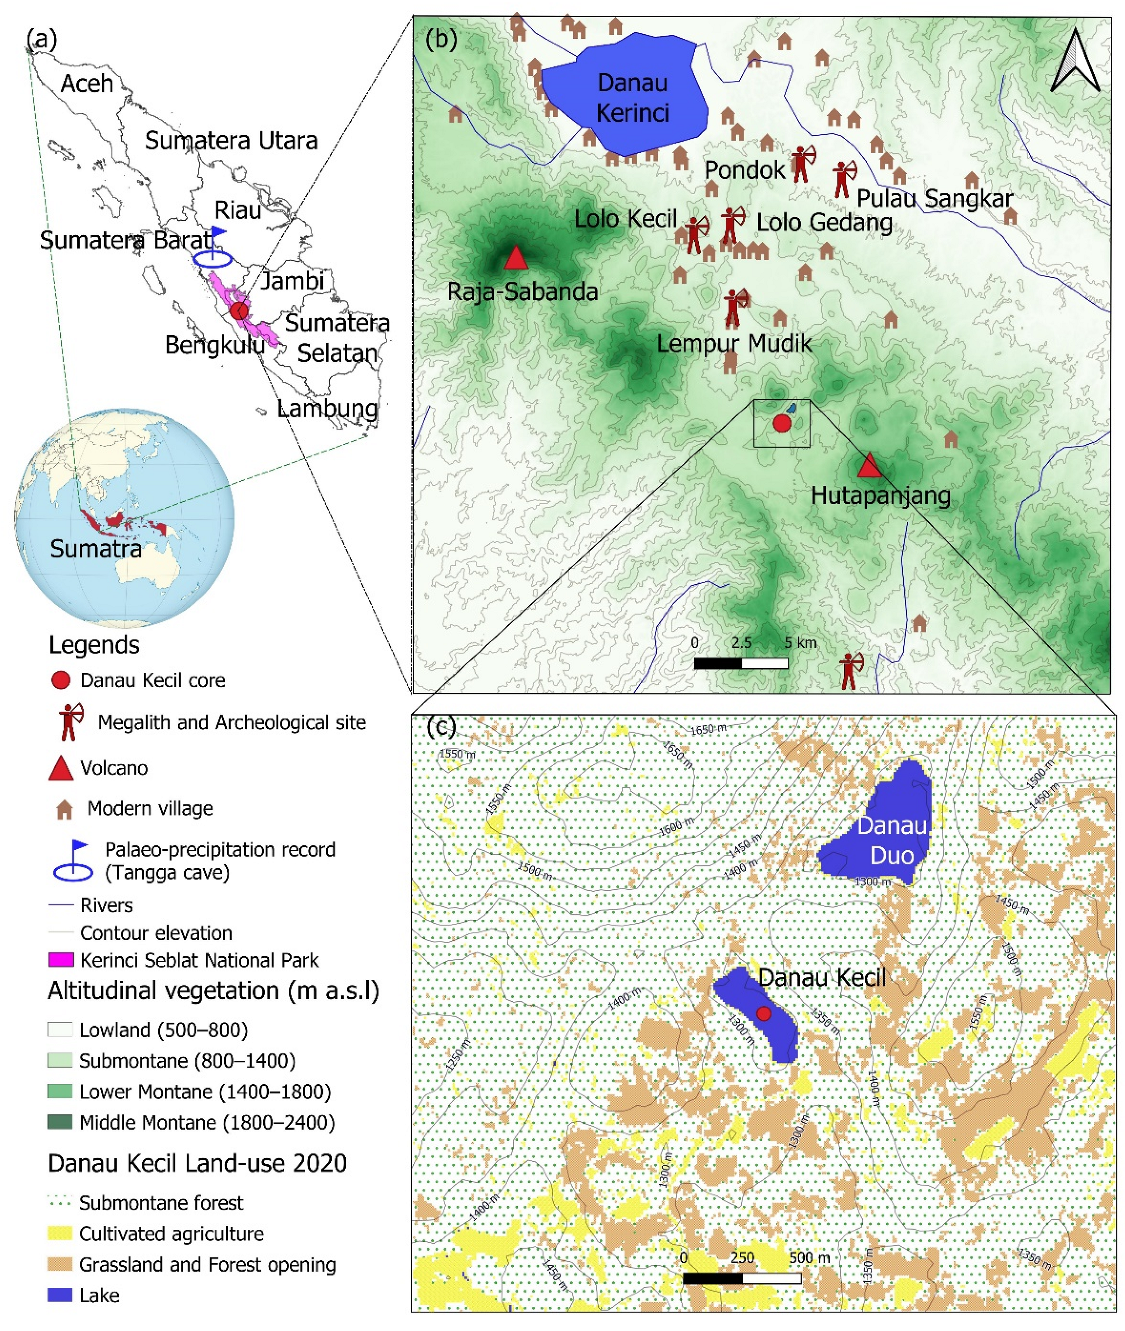
2. Study Area
2.1. Geography Setting
2.2. Climate
2.3. History of Agriculture and Land-Use System
3. Materials and Methods
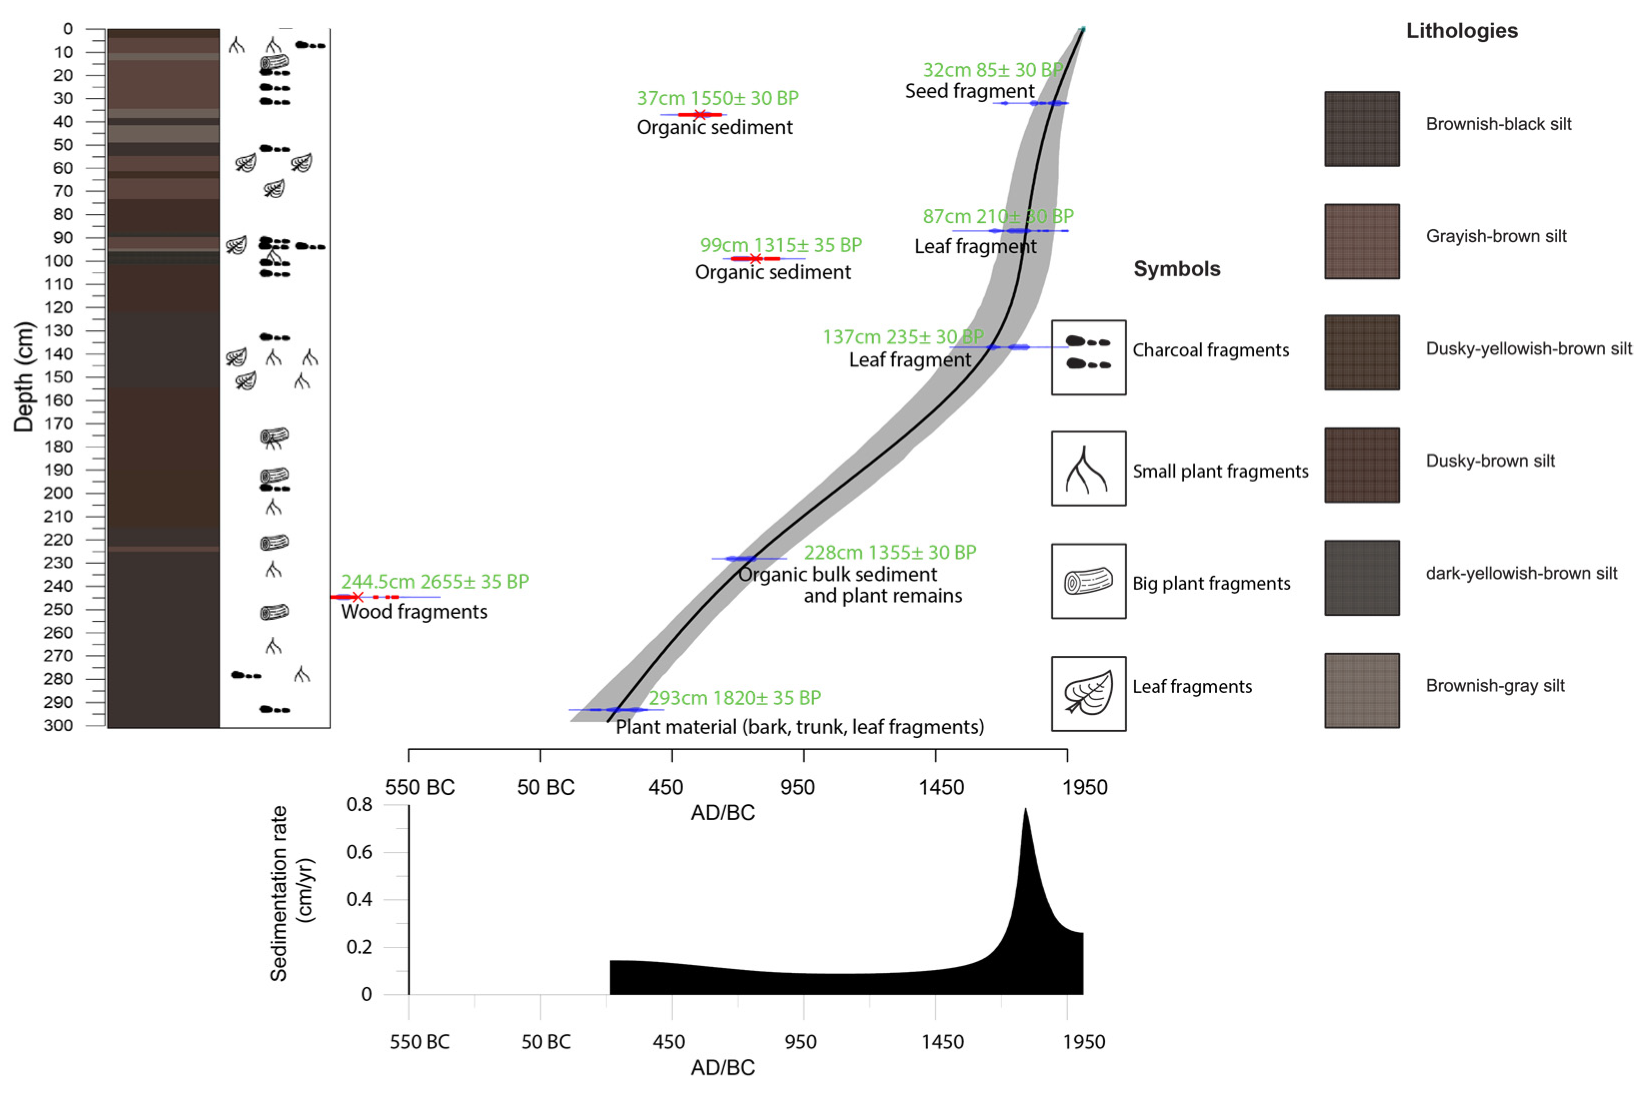
3.1. Fieldwork, Sediment Description and Dating
3.2. Palynological Analysis
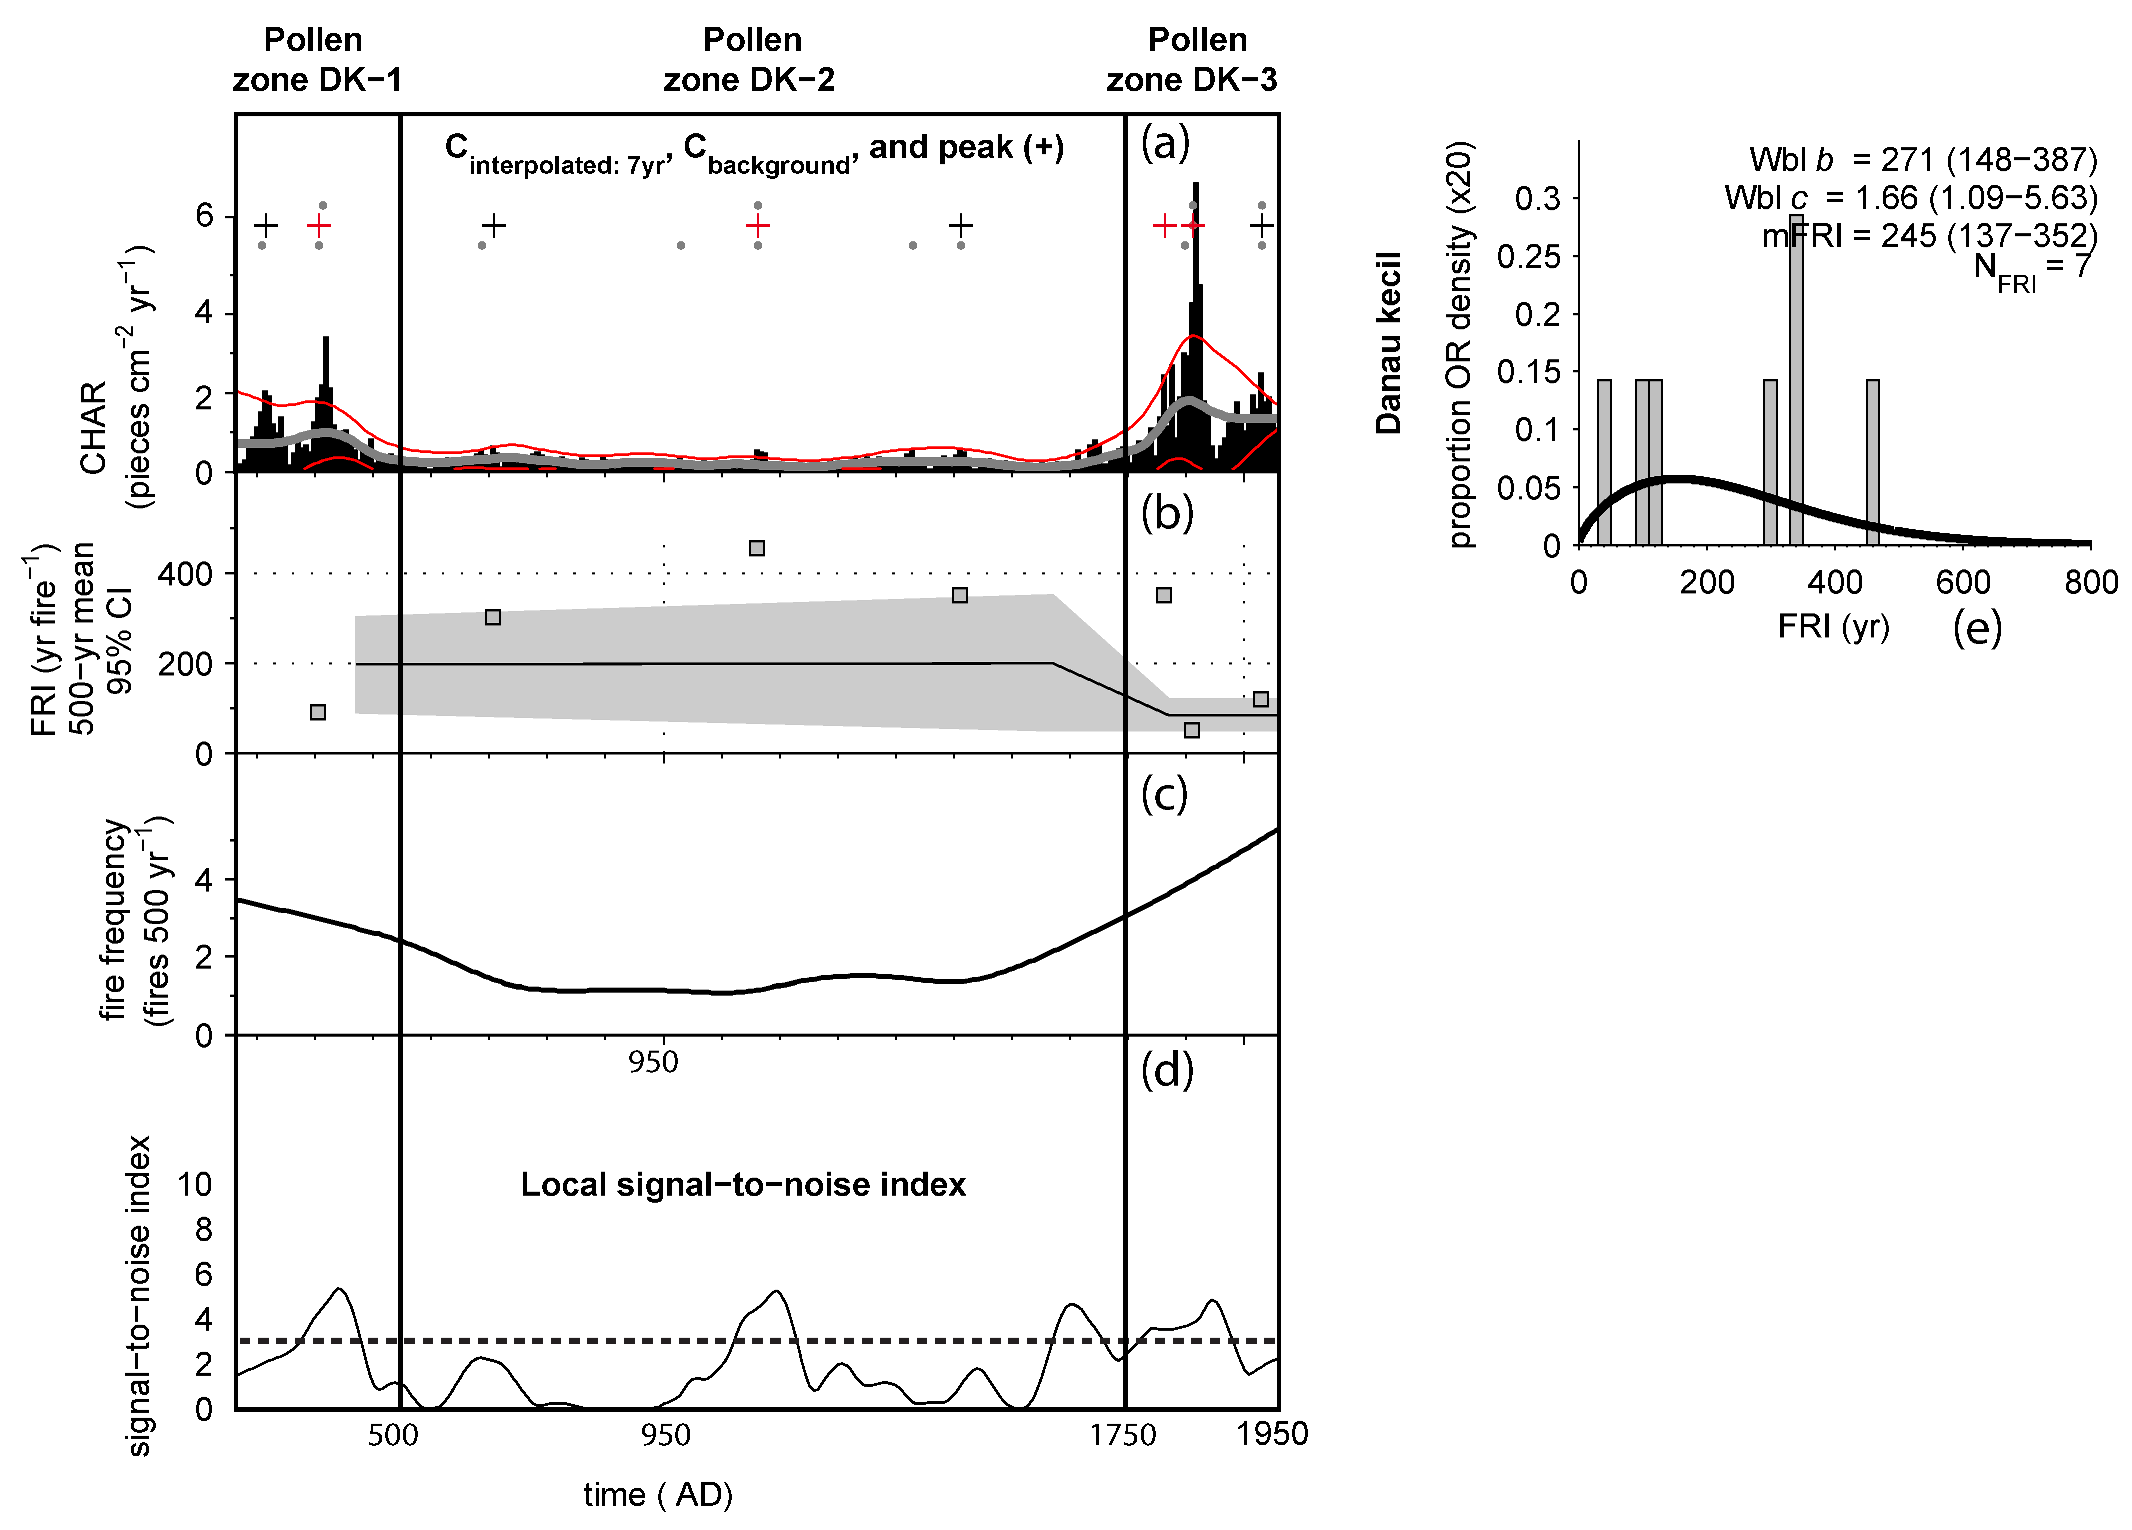
3.3. Macro-Charcoal Analysis
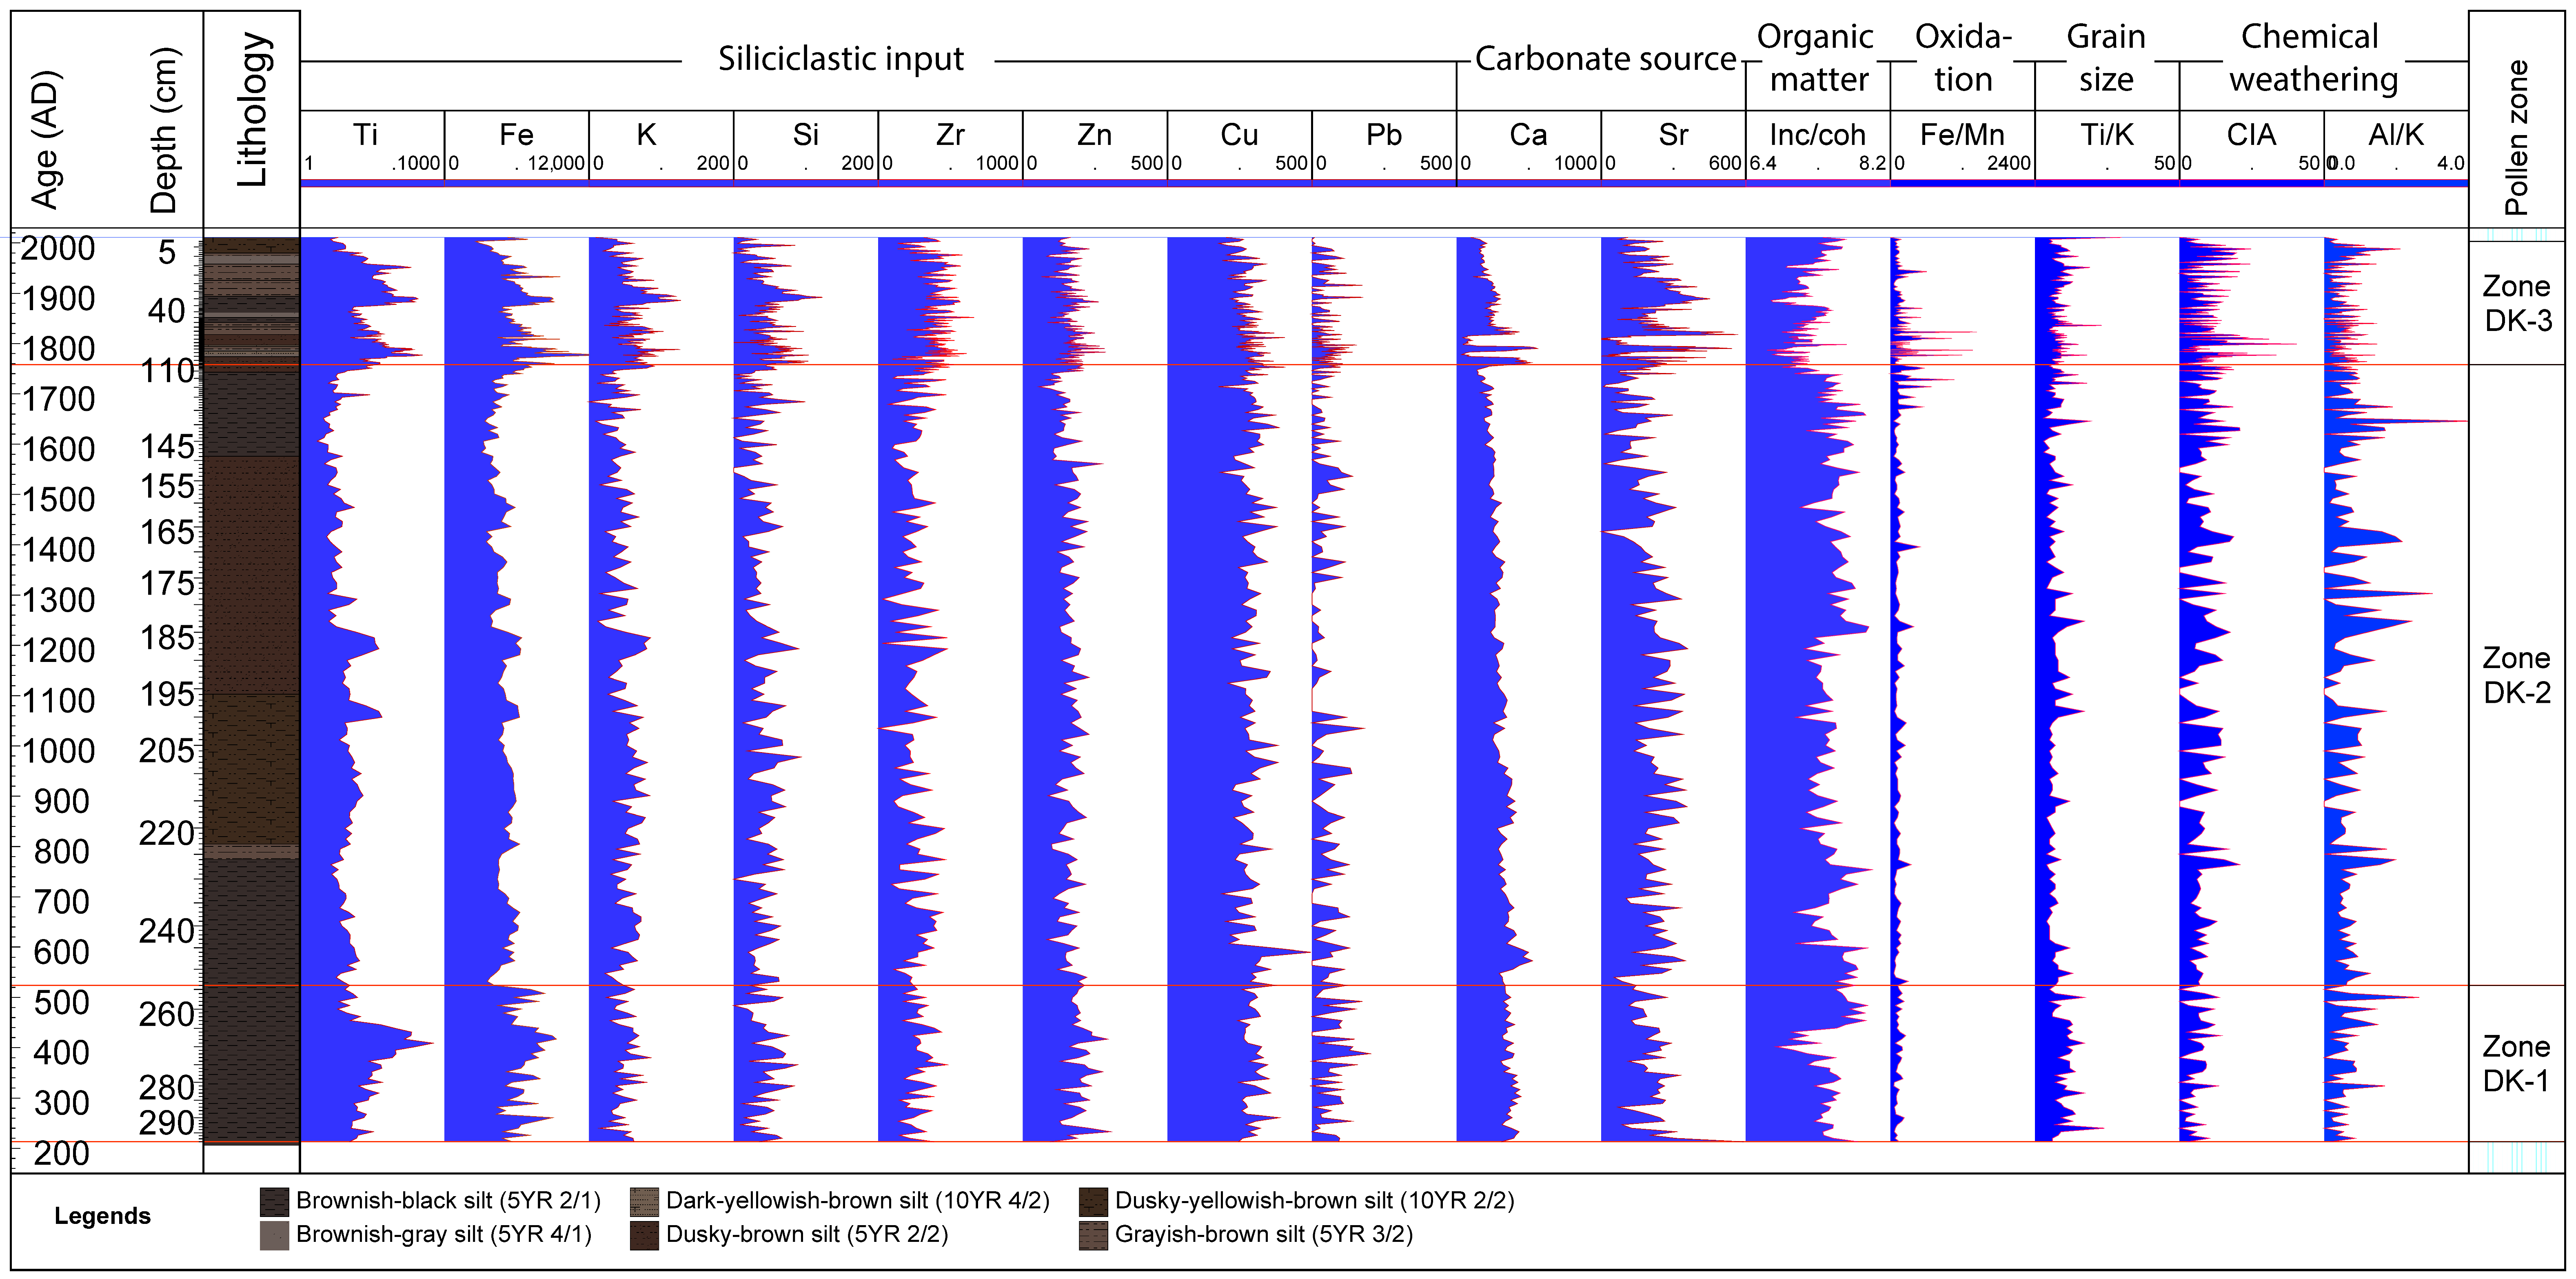
3.4. X-ray Fluorescence (XRF) Analysis
3.5. Multivariate Statistical Analysis
4. Results
4.1. Age-Depth Model
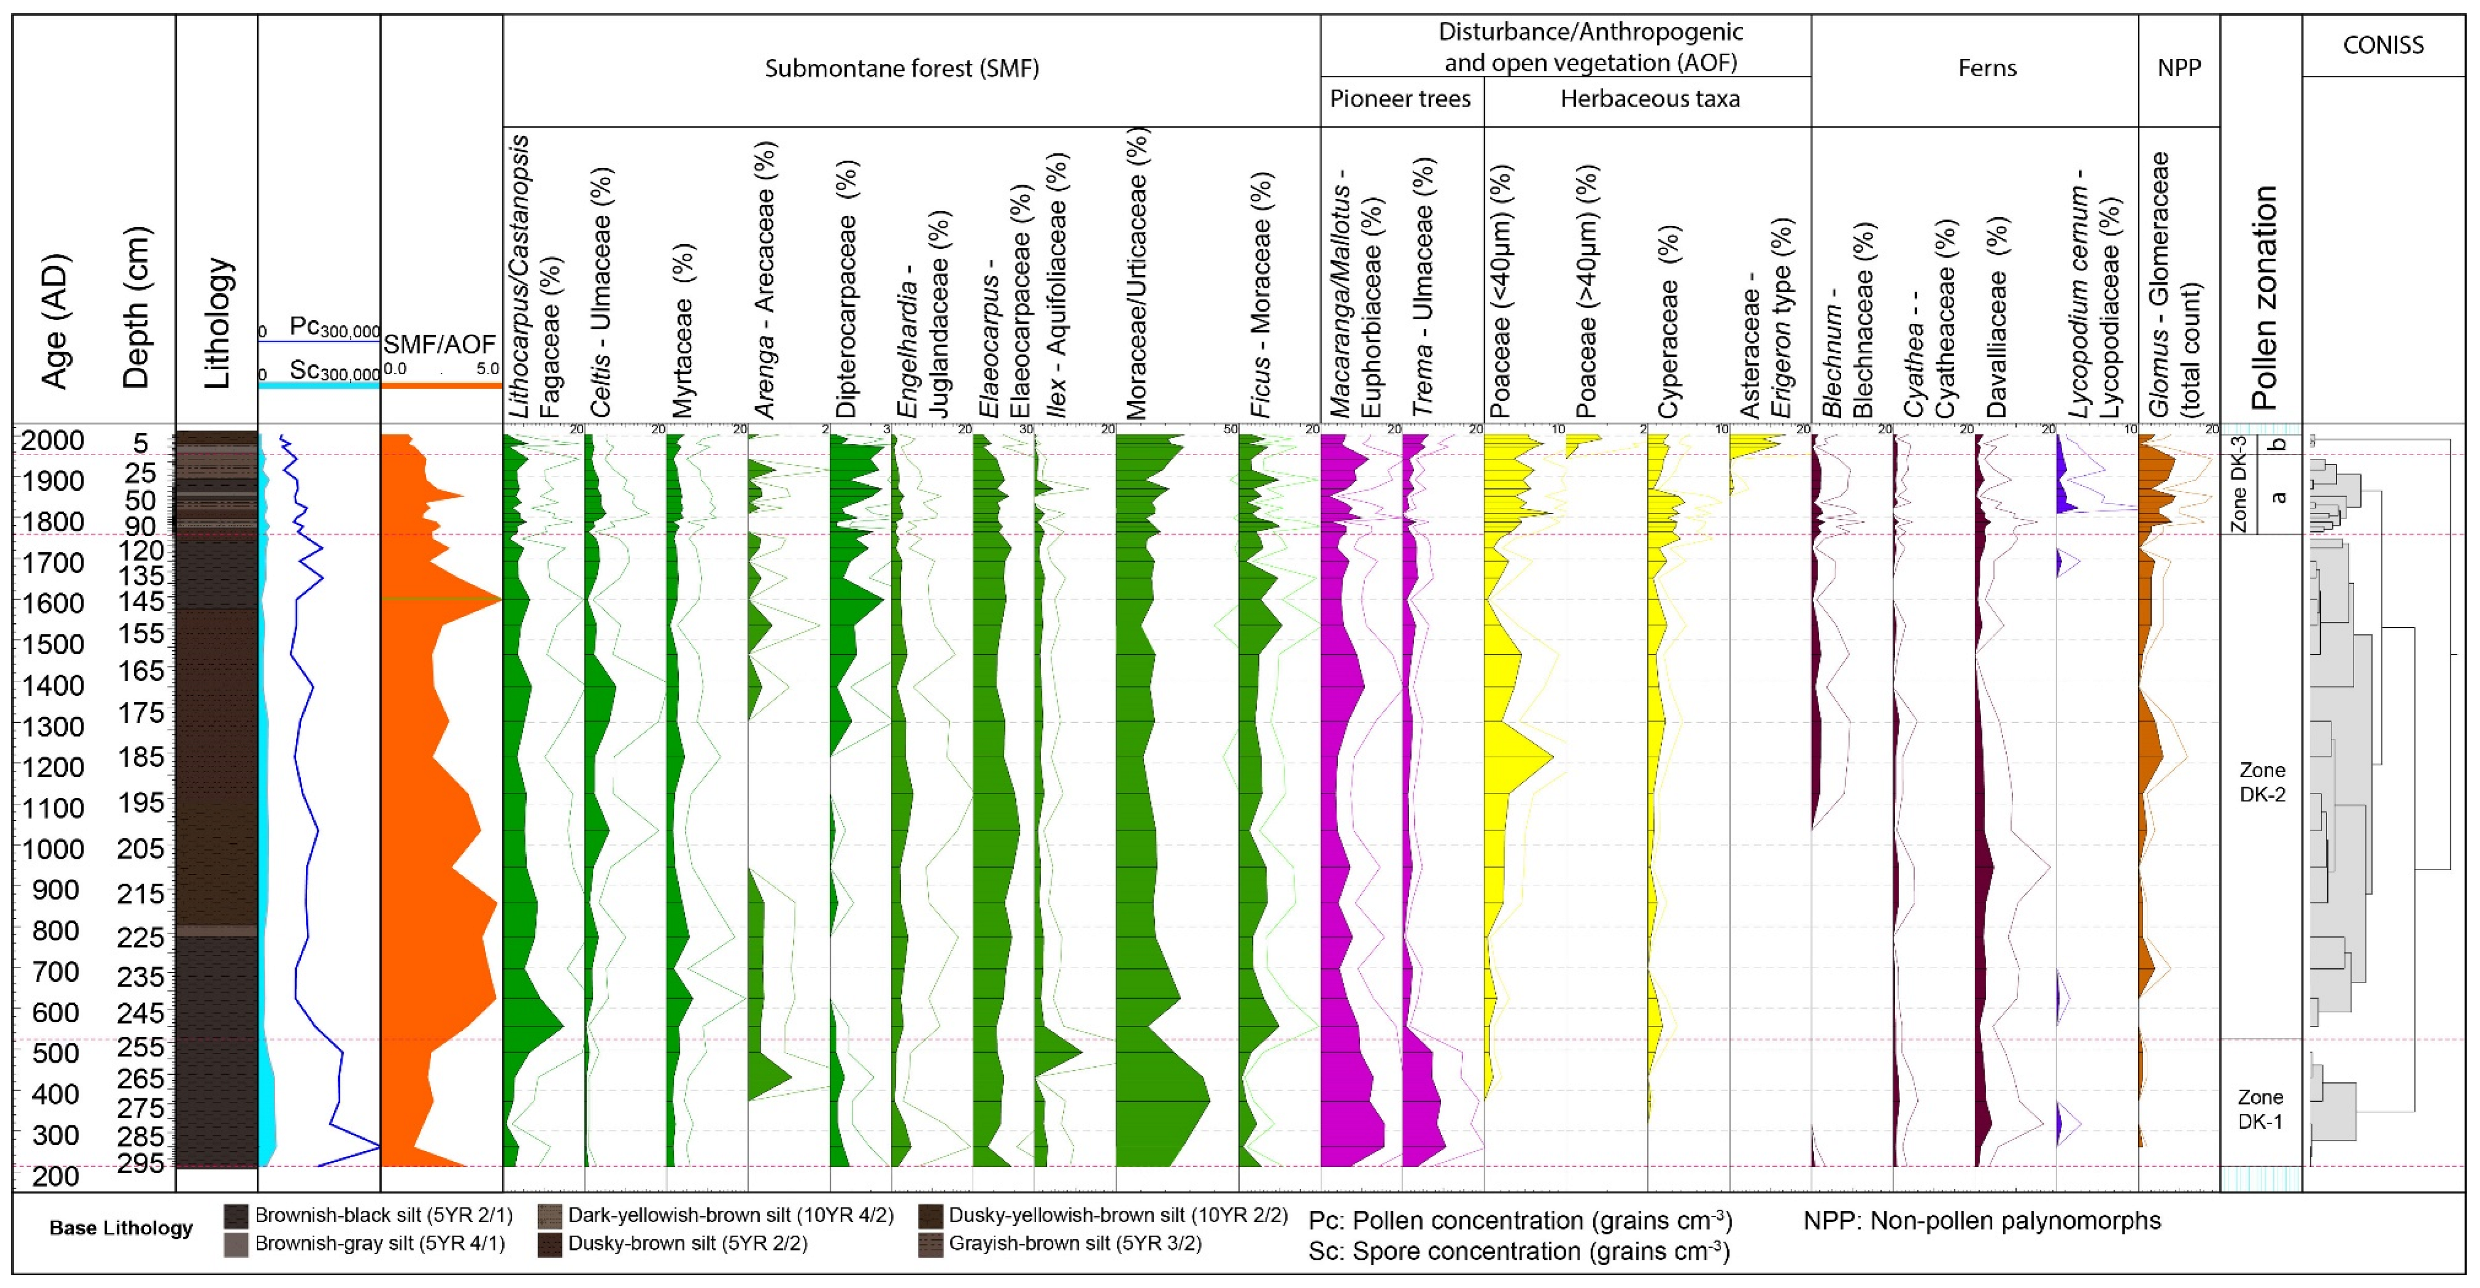
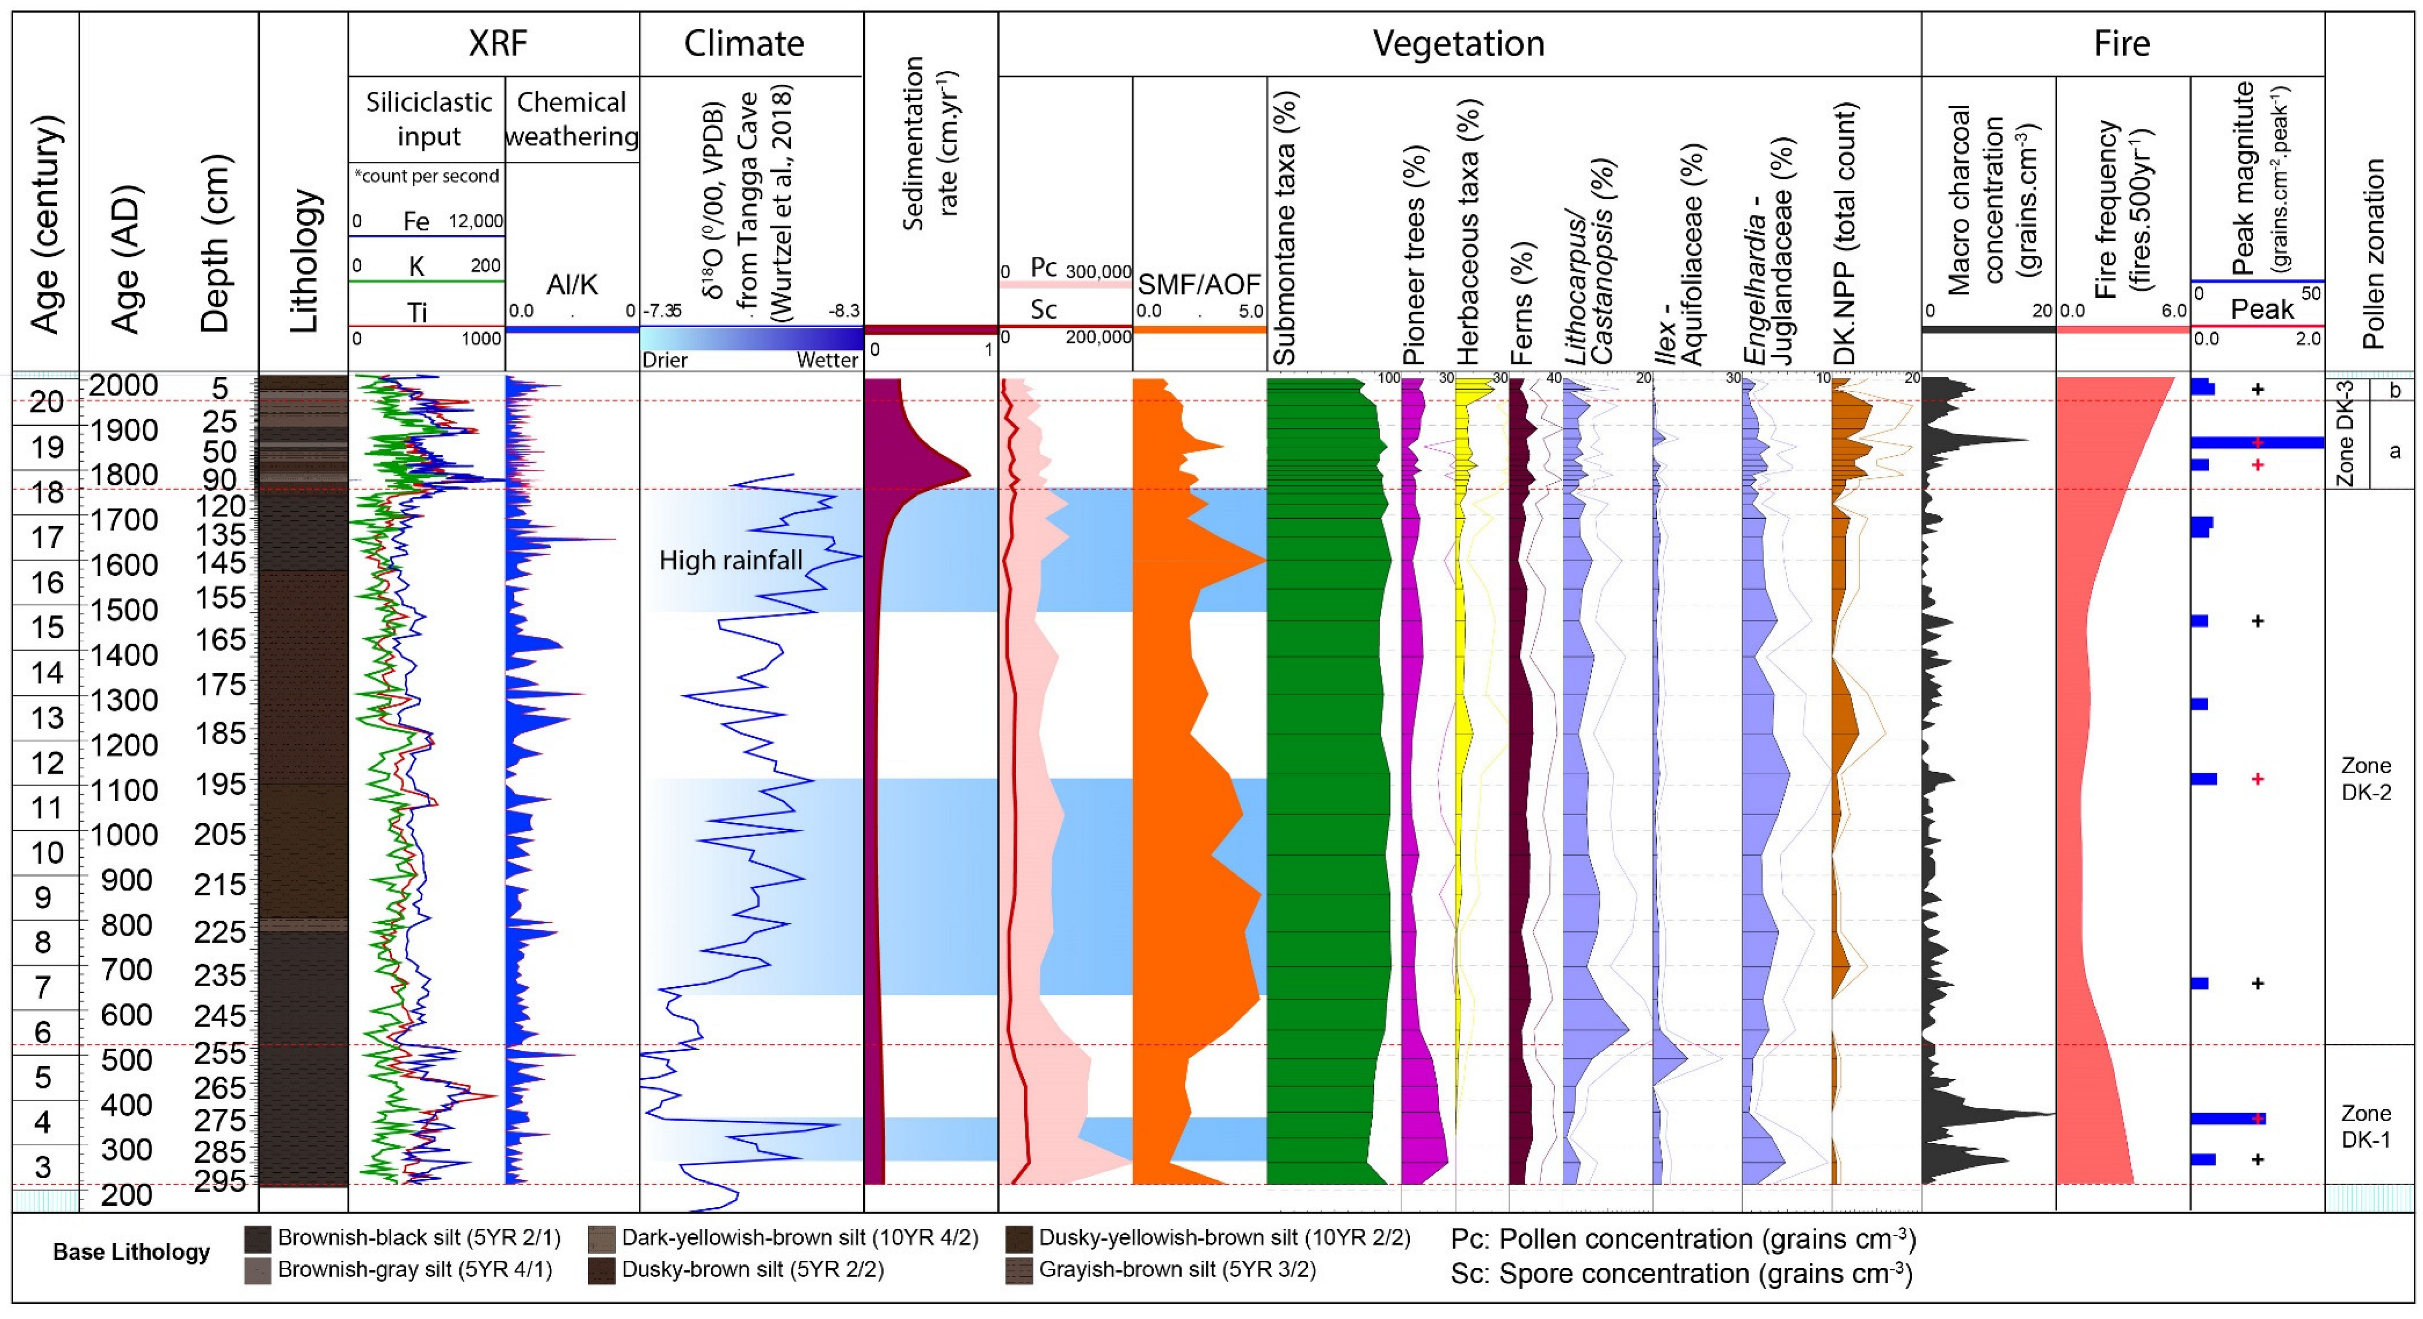
4.2. Palynological Results
4.2.1. Zone DK-1 (298–254 cm; Ca. AD 200–AD 500; 6 Samples)
4.2.2. Zone DK-2 (254–110 cm, Ca. AD 500–AD 1760; 18 Samples)
4.2.3. Zone DK-3 (110–0 cm, AD 1760–Present; 16 Samples)
4.3. X-ray Fluorescence–Scanning Results
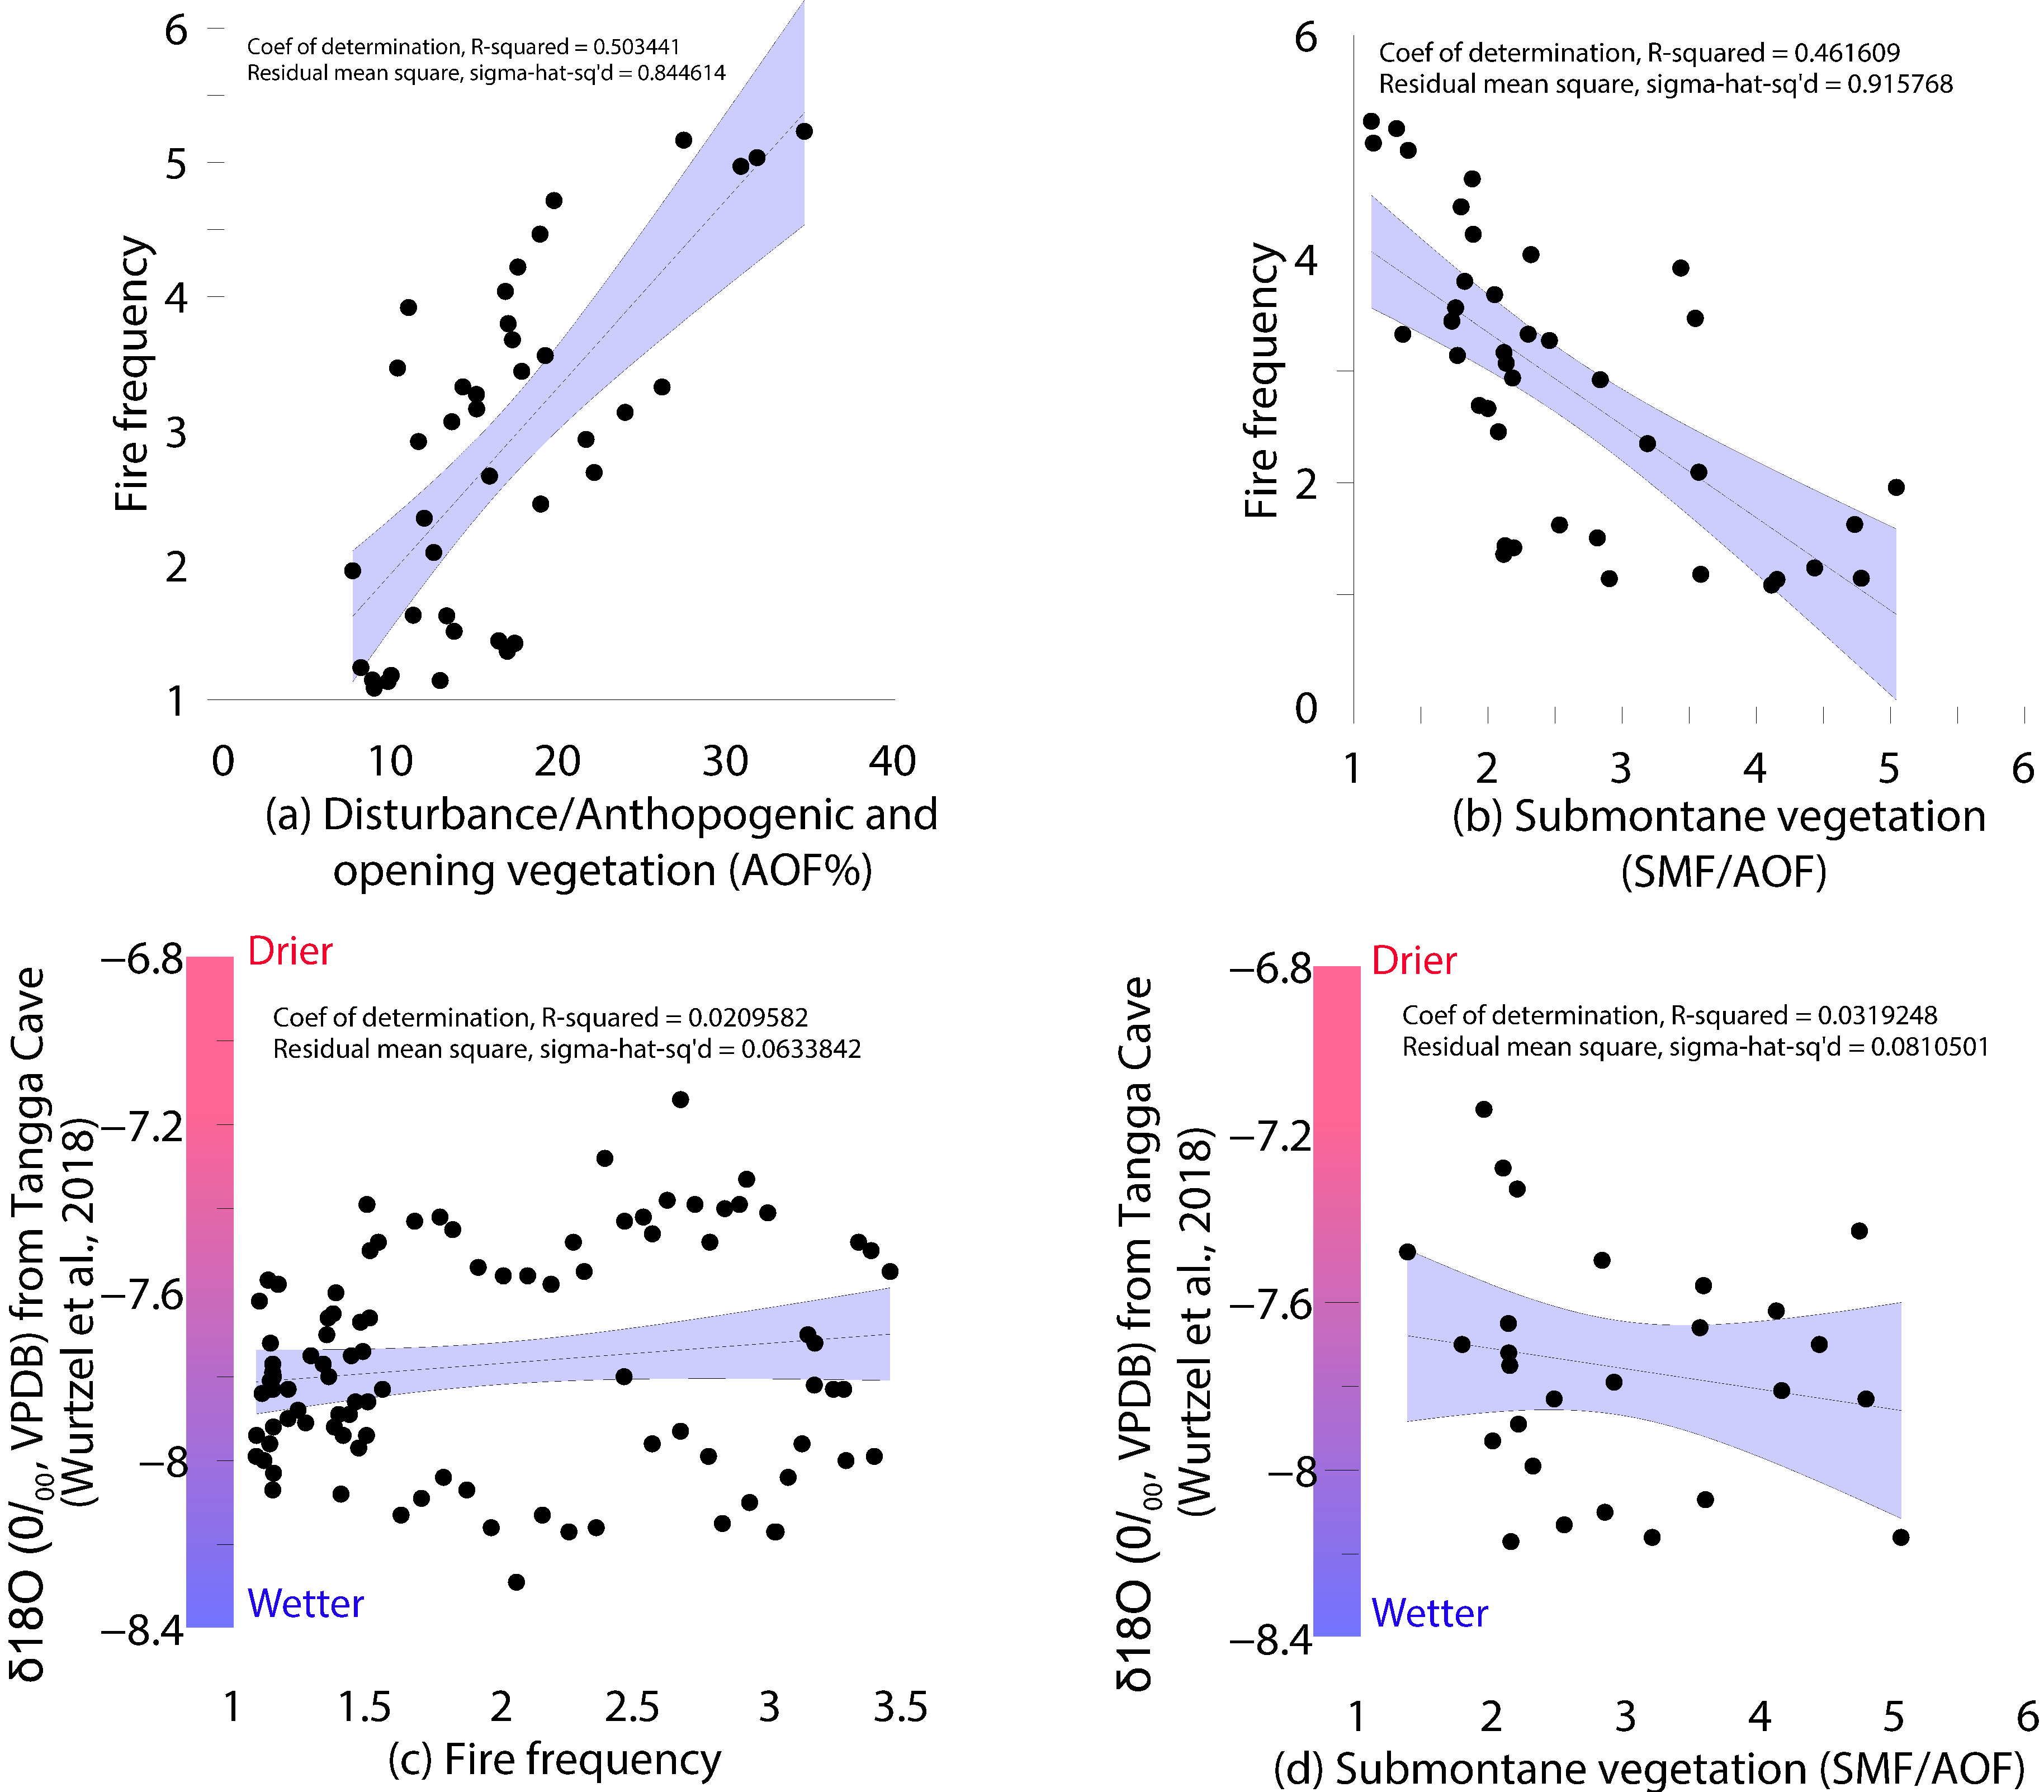
4.4. Macro-Charcoal and Fire Regime
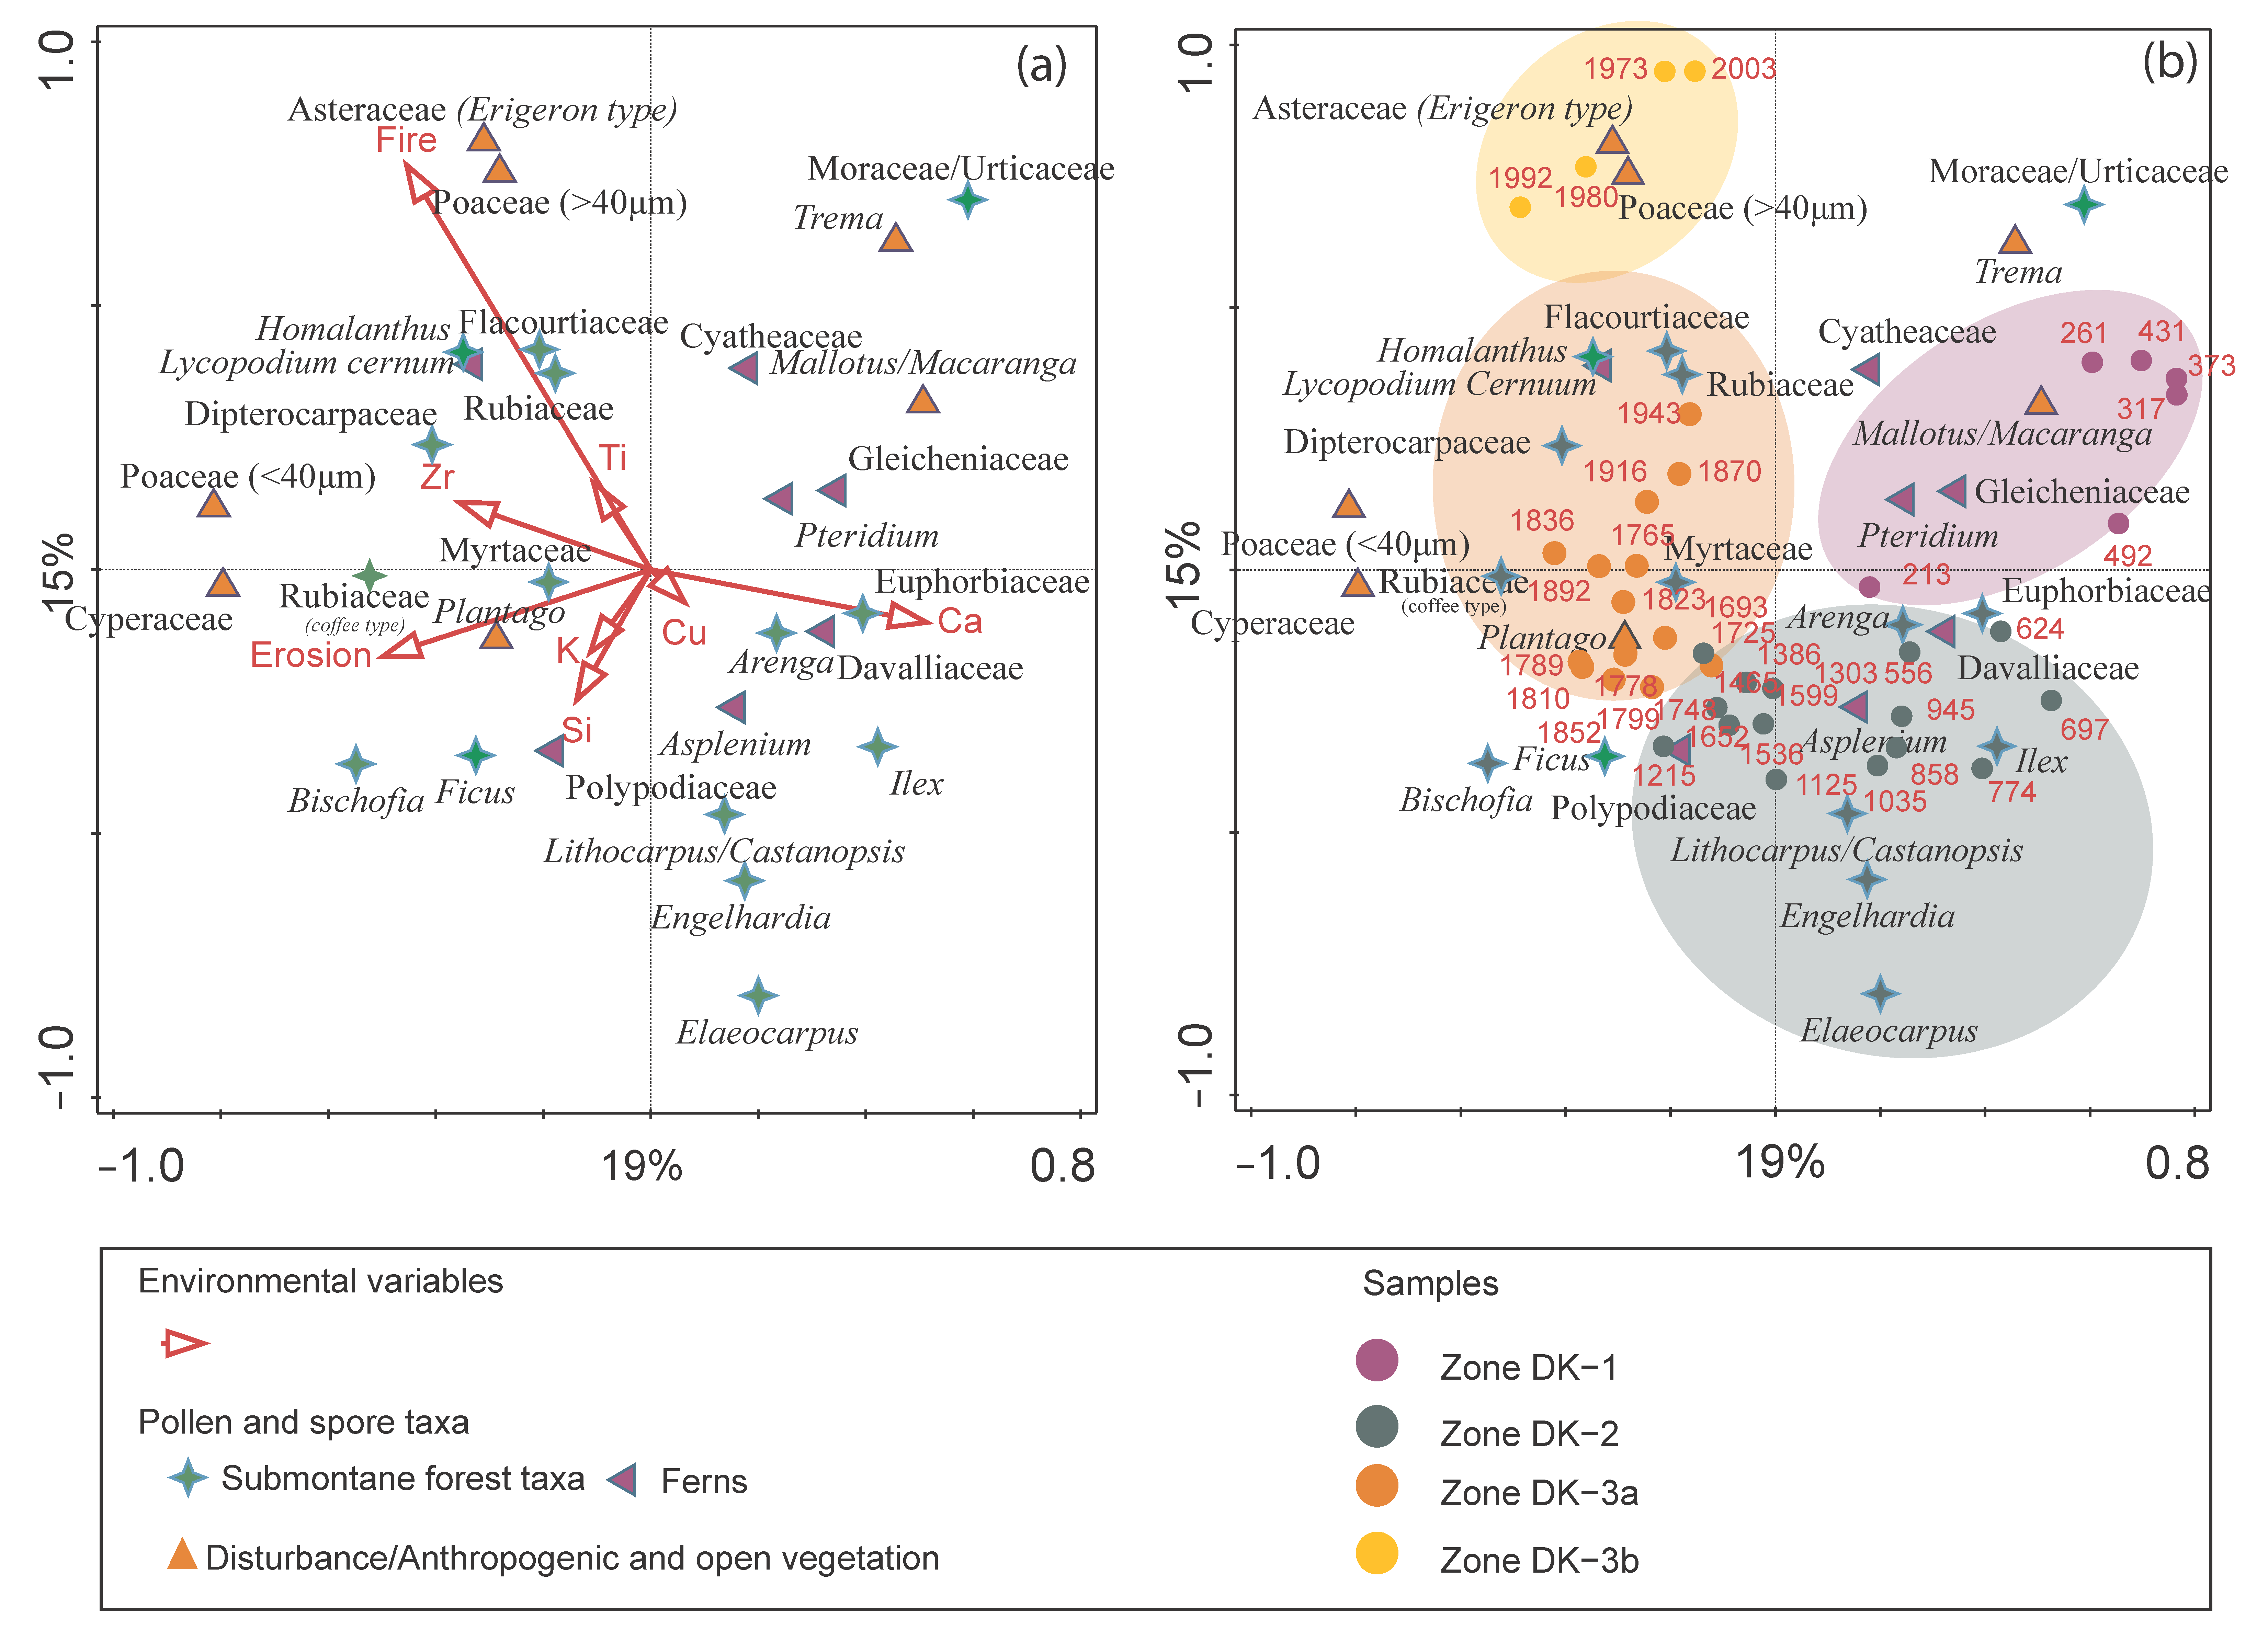
4.5. Multivariate Statistical Results
5. Discussion
5.1. Forest Disturbance and Anthropogenic History
5.1.1. Period 1–Forest Opening and Initial Cultivation (AD 200–500, Pollen Zone DK-1)
5.1.2. Period 2–Submontane Forest Regeneration and Initial Agroforestry (AD 500–1760, Pollen Zone DK-2)
5.1.3. Period 3–Intensification and Permanent Agroforestry System (AD 1760 to Present, Pollen Zone DK-3)
5.2. Role of Climate on the Vegetation Dynamics
6. Summary and Conclusions
Supplementary Materials
Author Contributions
Funding
Data Availability Statement
Acknowledgments
Conflicts of Interest
References
- Ministry of Agriculture. Agricultural Development in Indonesia 1996–2000; Ministry of Agriculture, Republic of Indonesia: Jakarta, Indonesia, 2001.
- Maloney, B.K. Possilble Early Dry-land and Wet-land Rice Cultivation in Highland North Sumatra. Asian Perspect. 1996, 35, 165–192. [Google Scholar]
- Bellwood, P. Prehistory of the Indo-Malaysian Archipelago (Revised Edition); ANU Press: Canberra, Australia, 2007. [Google Scholar]
- Setyaningsih, C.; Behling, H.; Saad, A.; Shumilovskikh, L.; Sabiham, S.; Biagioni, S. First palaeoecological evidence of buffalo husbandry and rice cultivation in the Kerinci Seblat National Park in Sumatra, Indonesia. Veg. Hist. Archaeobotany 2019, 28, 591–606. [Google Scholar] [CrossRef]
- Bonatz, D. A Highland Perspective on the Archaeology and Settlement History of Sumatra. Archipel 2012, 84, 35–81. [Google Scholar] [CrossRef]
- Dudgeon, D. Multiple threats imperil freshwater biodiversity in the Anthropocene. Curr. Biol. 2019, 29, R960–R967. [Google Scholar] [CrossRef]
- Hlásny, T.; Krokene, P.; Liebhold, A.; Montagné-Huck, C.; Müller, J.; Qin, H.; Raffa, K.; Schelhaas, M.-J.; Seidl, R.; Svoboda, M.; et al. Living with bark beetles: Impacts, outlook and management options. Sci. Policy 2019, 8, 1–50. [Google Scholar] [CrossRef]
- Nikonovas, T.; Spessa, A.; Doerr, S.H.; Clay, G.D.; Mezbahuddin, S. Near-complete loss of fire-resistant primary tropical forest cover in Sumatra and Kalimantan. Commun. Earth Environ. 2020, 1, 65. [Google Scholar] [CrossRef]
- Tacconi, L. Fire in Indonesia; CIFOR Occasional Paper; Center for International Forestry Research: Bogor, Indonesia, 2003; Volume 38. [Google Scholar]
- Vetrita, Y.; Cochrane, M.A. Fire Frequency and Related Land-Use and Land-Cover Changes in Indonesia’s Peatlands. Remote Sens. 2019, 12, 5. [Google Scholar] [CrossRef]
- Anderson, I.P.; Imanda, I.D.; Muhnandar. Vegetation Fires in Sumatra, Indonesia: A first Look at Vegetation Indices and Soil Dryness in Relation to Fire Occurrence; European Union Ministry of Forestry and Estate Crops, Forest Fire Prevention and Control Project: Palembang, Indonesia, 1999. [Google Scholar]
- Nicolas, M.V.J.; Beebe, G.S. Fire Management in the Logging Concessions and Plantation Forests of Indonesia; European Union German Agency for Techical Cooperation, Ministry of Forestry and Estate Crops: Palembang, Indonesia, 1999. [Google Scholar]
- Bowen, M.R.; Bompard, J.M.; Anderson, I.P.; Guizol, P.; Gouyon, A. Anthropogenic Fires in Indonesia: A View from Sumatra, Preprint from Forest Fires and Regional Haze in South East Asia; Nova Science: New York, NY, USA, 2001. [Google Scholar]
- Fernandes, K.; Verchot, L.; Baethgen, W.; Gutierrenz-Velez, V.; Pinedo-Vasquez, M.; Maritus, C. Heightened fire probability in Indonesia in non-drought conditions: The effect of increasing temperatures. Environ. Res. Lett. 2017, 12, 054002. [Google Scholar] [CrossRef]
- Laumonier, Y. The Vegetation and Physiography of Sumatra; Kluwer Academic: London, UK, 1997; Volume 12, p. 233. [Google Scholar]
- Whitten, T.; Damanik, S.J. The Ecology of Sumatra; Periplus Editions (HK) Limited: Singapore, 2000. [Google Scholar]
- Bramley, G.; Pennington, R.; Zakaria, R.; Tjitrosoedirdjo, S.R.I.; Cronk, Q. Assembly of tropical plant diversity on a local scale: Cyrtandra (Gesneriaceae) on Mount Kerinci, Sumatra. Biol. J. Linn. Soc. Biol. J. Linn. Soc. Blackwell Sci. 2004, 81, 49–62. [Google Scholar] [CrossRef]
- Morley, R.J. A Palaeoecological Interpretation of a 10,000 Year Pollen Record from Danau Padang, Central Sumatra, Indonesia. J. Biogeogr. 1982, 9, 151–190. [Google Scholar] [CrossRef]
- Wurtzel, J.B.; Abram, N.J.; Lewis, S.C.; Bajo, P.; Hellstrom, J.C.; Troitzsch, U.; Heslop, D. Tropical Indo-Pacific hydroclimate response to North Atlantic forcing during the last deglaciation as recorded by a speleothem from Sumatra, Indonesia. Earth Planet. Sci. Lett. 2018, 492, 264–278. [Google Scholar] [CrossRef]
- Aziz, F.A. The Jar burial site of Lolo Gedang, Southwest of Kerinci Lake, Jambi. Amerta J. Penelit. Dan Pengemb. Arkeol. 2011, 29, 63–73. [Google Scholar]
- Global Volcanism Program. Volcanoes of the World (VOTW) Database Information 2013, v. 4.10.2. Available online: https://volcano.si.edu/volcanolist_holocene.cfm (accessed on 24 August 2021).
- Köppen, W. Versuch einer Klassifikation der Klimate, vorzugsweise nach ihren Beziehungen zur Pflanzenwelt. Geogr. Z. 1900, 6, 593–611. [Google Scholar]
- Kottek, M.; Grieser, J.; Beck, C.; Rudolf, B.; Rubel, F. World Map of the Köppen-Geiger Climate Classification Updated. Meteorol. Z. 2006, 15, 259–263. [Google Scholar] [CrossRef]
- Philander, S.G.H. El Niño, La Niña, and the Southern Oscillation. In International Geophysics Series; Holton, J., Dmowska, R., Eds.; Academic Press: New York, NY, USA, 1990; p. 289. [Google Scholar]
- Cane, M.A. The evolution of El Niño, past and future. Earth Planet. Sci. Lett. 2005, 230, 227–240. [Google Scholar] [CrossRef]
- Webster, P.J.; Moore, A.M.; Loschnigg, J.P.; Leben, R.R. Coupled ocean–atmosphere dynamics in the Indian Ocean during 1997–98. Nature 1999, 401, 356–360. [Google Scholar] [CrossRef]
- Fick, S.E.; Hijmans, R.J. WorldClim 2: New 1-km spatial resolution climate surfaces for global land areas. Int. J. Climatol. 2017, 37, 4302–4315. [Google Scholar] [CrossRef]
- Flenley, J.R.; Butler, K. Evidence for continued disturbance of upland rain forest in Sumatra for the last 7000 years of an 11,000 year record. Palaeogeogr. Palaeoclimatol. Palaeoecol. 2001, 171, 289–305. [Google Scholar] [CrossRef]
- Klamer, M. The dispersal of Austronesian languages in Island South East Asia: Current findings and debates. Lang. Linguist. Compass 2019, 13, e12325. [Google Scholar] [CrossRef]
- Simanjuntak, T. The Western Route Migration: A Second Probable Neolithic Diffusion to Indonesia. In New Perspectives in Southeast Asian and Pacific Prehistory; Piper, P.J., Matsumura, H., Bulbeck, D., Eds.; ANU Press: Canberra, Australia, 2017; pp. 201–211. [Google Scholar]
- Harrison, T. A history of prehistory. SMJ Sarawk Mus. J. 1958, 8, 549–595. [Google Scholar]
- Widianto, H. The Dawn of Humanity in Sumatra: Arrival and Dispersal from the Human Remains Perspective. In From Distant Tales: Archaeology and Ethnohistory in the Highlands of Sumatra; Bonatz, D., Miksic, J., Neidel, J.D., Tjoa-Bonatz, M.L., Eds.; Cambridge Scholar Publishing: Newcastle upon Tyne, UK, 2009. [Google Scholar]
- Bonatz, D.; Neidel, J.D.; Tjoa-Bonatz, M.L. The megalithic complex of highland Jambi: An archaeological perspective. Bijdr. tot taal-, land- Volkenkd./J. Humanit. Soc. Sci. Southeast Asia 2008, 162, 490–522. [Google Scholar] [CrossRef]
- Zervas, D.; Nichols, G.J.; Hall, R.; Smyth, H.R.; Lüthje, C.; Murtagh, F. SedLog: A shareware program for drawing graphic logs and log data manipulation. Comput. Geosci. 2009, 35, 2151–2159. [Google Scholar] [CrossRef]
- Hogg, A.G.; Hua, Q.; Blackwell, P.G.; Niu, M.; Buck, C.E.; Guilderson, T.P.; Heaton, T.J.; Palmer, J.G.; Reimer, P.J.; Reimer, R.W.; et al. SHCal13 Southern Hemisphere Calibration, 0–50,000 Years cal BP. Radiocarbon 2013, 55, 1889–1903. [Google Scholar] [CrossRef]
- Livingstone, D.A. A lightweight piston sampler for lake deposits. Ecology 1955, 36, 137–139. [Google Scholar] [CrossRef]
- Blaauw, M. Methods and code for ‘classical’ age-modelling of radiocarbon sequences. Quat. Geochronol. 2010, 5, 512–518. [Google Scholar] [CrossRef]
- R Core Team. R: A Language and Environment for Statistical Computing; R Foundation for Statistical Computing: Vienna, Austria, 2018. [Google Scholar]
- Faegri, K.; Iversen, J. Textbook of Pollen Analysis, 4th ed.; Faegri, K., Kaland, P.E., Krzywinski, K., Eds.; John Wiley & Sons: London, UK, 1989. [Google Scholar]
- Stockmarr, J. Tablets with Spores used in Absolute Pollen Analysis. Pollen Et Spores 1971, 13, 615–621. [Google Scholar]
- Stratabugs Biostratigraphic Data Management Software; Stratadata: Pluckley, UK, 2014; Available online: https://www.stratadata.co.uk/ (accessed on 24 August 2021).
- Grimm, E. CONISS: A FORTRAN 77 program for stratigraphically constrained cluster analysis by the method of incremental sum of squares. Comput. Geosci. 1987, 13, 13–35. [Google Scholar] [CrossRef]
- Stevenson, J.; Haberle, S. Macro Charcoal Analysis: A Modified Technique Used by the Department of Archaeology and Natural History; Australian National University (ANU): Canberra, Australia, 2005. [Google Scholar]
- Clark, J.S.; Lynch, J.; Stocks, B.J.; Goldammer, J.G. Relationships between charcoal particles in air and sediments in west-central Siberia. Holocene 1998, 8, 19–29. [Google Scholar] [CrossRef]
- Carcaillet, C.; Bouvier, M.; Fréchette, B.; Larouche, A.C.; Richard, P.J.H. Comparison of pollen-slide and sieving methods in lacustrine charcoal analyses for local and regional fire history. Holocene 2001, 11, 467–476. [Google Scholar] [CrossRef]
- Higuera, P.E.; Brubaker, L.B.; Anderson, P.M.; Hu, F.S.; Brown, T.A. Vegetation mediated the impacts of postglacial climate change on fire regimes in the south-central Brooks Range, Alaska. Ecol. Monogr. 2009, 79, 201–219. [Google Scholar] [CrossRef]
- Lo, F.-L.; Chen, H.-F.; Fang, J.-N. Discussion of Suitable Chemical Weathering Proxies in Sediments by Comparing the Dissolution Rates of Minerals in Different Rocks. J. Geol. 2016, 125, 83–99. [Google Scholar] [CrossRef]
- Profe, J. X-ray Fluorescence Scanning of Discrete Samples—A New Tool for the Geochemical Characterization of Loess-Paleosol Sequences; University of Bremen: Bremen, Germany, 2018. [Google Scholar]
- Huang, C.; Kong, D.; Chen, F.; Hu, J.; Wang, P.; Lin, J. Multi—Proxy Reconstructions of Climate Change and Human Impacts Over the Past 7000 Years From an Archive of Continental Shelf Sediments off Eastern Hainan Island, China. Front. Earth Sci. 2021, 9, 478. [Google Scholar] [CrossRef]
- Nesbitt, H.W.; Young, G.M. Early Proterozoic climates and plate motions inferred from major element chemistry of lutites. Nature 1982, 299, 715–717. [Google Scholar] [CrossRef]
- Simpson, G.; Birks, H. Statistical Learning in Palaeolimnology; Springer: Berlin/Heidelberg, Germany, 2012; Volume 5, pp. 249–327. [Google Scholar]
- Šmilauer, P.; Lepš, J. Multivariate Analysis of Ecological Data Using CANOCO 5, 2nd ed.; Cambridge University Press: Cambridge, UK, 2014. [Google Scholar]
- Kylander, M.E.; Ampel, L.; Wohlfarth, B.; Veres, D. High-resolution X-ray fluorescence core scanning analysis of Les Echets (France) sedimentary sequence: New insights from chemical proxies. J. Quat. Sci. 2011, 26, 109–117. [Google Scholar] [CrossRef]
- Davies, S.J.; Lamb, H.F.; Roberts, S.J. Micro-XRF Core Scanning in Palaeolimnology: Recent Developments. In Micro-XRF Studies of Sediment Cores: Applications of a Non-Destructive Tool for the Environmental Sciences; Croudace, I.W., Rothwell, R.G., Eds.; Springer: Dordrecht, The Netherlands, 2015; pp. 189–226. [Google Scholar]
- Pakkad, G.; Elliott, S.; Anusarnsumthorn, V.; James, C.; Blakesley, D. Forest Restoration Planting in Northern Thailand. In Proceedings of the Southeast Asian Moving Workshop on Conservation, Management and Utilization of Forest Genetic Resources No. 31/2002; Food and Agriculture Organization of the United Nations: Bangkok, Thailand, 2002. [Google Scholar]
- Natascha, W.; Setyaningsih, C.A.; Saad, A.; Sabiham, S.; Sauer, D.; Behling, H. Late Holocene volcanic and human impacts on the mountain vegetation in central Sumatra, Indonesia. Quat. Int. 2022, 622, 77–88. [Google Scholar] [CrossRef]
- Erin, L.T.; André Luiz, G.; Sergio, R.-N.; Santiago, M.; George, D.W. Phylogeny of the Cecropieae (Urticaceae) and the Evolution of an Ant-Plant Mutualism. Syst. Bot. 2016, 41, 56–66. [Google Scholar] [CrossRef]
- Michon, G.; Foresta, H.D. Agro-Forests: Incorporaing a Forest Vision in Agroforestry. In Agroforestry in Sustainable Agricultural Systems; Buck, L.E., Lassoie, J.P., Fernandes, E.C.M., Eds.; CRC Press: Boca Raton, FL, USA, 1999. [Google Scholar]
- Berkes, F.; Folke, C.; Gadgil, M. Traditional Ecological Knowledge, Biodiversity, Resilience and Sustainability. In Biodiversity Conservation: Problems and Policies; Perrings, C.A., Mäler, K.G., Folke, C., Holling, C.S., Jansson, B.O., Eds.; Springer: Dordrecht, The Netherlands, 1995; pp. 281–299. [Google Scholar]
- Michon, G.; Mary, F.; Bompard, J. Multistoried agroforestry garden system in West Sumatra, Indonesia. Agrofor. Syst. 1986, 4, 315–338. [Google Scholar] [CrossRef]
- Flenley, J.R. Palynological Evidence for Land Use Changes in South-East Asia. Journal of Biogeography 1988, 15, 185–197. [Google Scholar] [CrossRef]
- Elberson, W.; Oyen, L. Sugar Palm (Arenga Pinnata); Wageningen University: Wageningen, The Netherlands, 2010. [Google Scholar]
- Conedera, M.; Tinner, W.; Neff, C.; Meurer, M.; Dickens, A.F.; Krebs, P. Reconstructing past fire regimes: Methods, applications, and relevance to fire management and conservation. Quat. Sci. Rev. 2009, 28, 555–576. [Google Scholar] [CrossRef]
- Torquebiau, E. Man-made dipterocarp forest in Sumatra. Agrofor. Syst. 1984, 2, 103–127. [Google Scholar] [CrossRef]
- Meinwald, J.; Messer, A. Anti-Insectan Compounds from the Tropical Tree Family Dipterocarpaceae; United States Agency for International Development, Program in Science and Technology Cooperation, Cornell University: Ithaca, NY, USA, 1990. [Google Scholar]
- Foresta, H.D.; Michon, G.; Kusworo, A.; Levang, P. Damar agroforests in Sumatra, Indonesia: Domestication of a forest ecosystem through domestication of dipterocarps for resin production. In Forest Products, Livelioods and Coversation; Kusters, K., Belcher, B., Eds.; Center for International Forestry Research: Jakarta, Indonesia, 2004; Volume 1—Asia. [Google Scholar]
- Michon, G.; Foresta, H.D.; Levang, P. New face for traditional commons: Forest conversion and the redefinition of common property and individual rights through agroforest development in Sumatra, Indonesia. In Proceedings of the Fifth Common Property Conference, Bodø, Norway, 24–28 May 1995. [Google Scholar]
- Watson, C.W. Kerinci, Two Historical Studies. Center of S.E.A Studies, University of Kent: Canterbury, UK, 1984; Volume 3. [Google Scholar]
- van der Kaars, S.; Bassinot, F.; De Deckker, P.; Guichard, F. Changes in monsoon and ocean circulation and the vegetation cover of southwest Sumatra through the last 83,000years: The record from marine core BAR94-42. Palaeogeogr. Palaeoclimatol. Palaeoecol. 2010, 296, 52–78. [Google Scholar] [CrossRef]
- Poffenberger, M. Communities and Forest Management in Southeast Asia; International Union for Conservation of Nature (IUCN): Gland, Switzerland, 1999. [Google Scholar]
- Marsden, W. The History of Sumatra: Containing an Account of the Government, Laws, Customs, and Manners of the Native Inhabitants; Cambridge University Press: Cambridge, UK, 2012. [Google Scholar]
- Foresta, H.D.; Michon, G. Damar resin: Indonesia case. In Riches of the Forest: Food, Spices, Crafts and Resins of Asia; López, C., Shanley, P., Eds.; Center for International Forestry Research: Bogor Regency, Indonesia, 2004. [Google Scholar]
- Pino, J.; Arnan, X.; Rodrigo, A.; Retana, J. Post-fire invasion and subsequent extinction of Conyza spp. in Mediterranean forests is mostly explained by local factors. Weed Res. 2013, 53, 470–478. [Google Scholar] [CrossRef]
- Kołaczek, P.; Zubek, S.; Błaszkowski, J.; Mleczko, P.; Margielewski, W. Erosion or plant succession—How to interpret the presence of arbuscular mycorrhizal fungi (Glomeromycota) spores in pollen profiles collected from mires. Rev. Palaeobot. Palynol. 2013, 189, 29–37. [Google Scholar] [CrossRef]
- Biagioni, S.; Krashevska, V.; Achnopha, Y.; Saad, A.; Sabiham, S.; Behling, H. 8000 years of vegetation dynamics and environmental changes of a unique inland peat ecosystem of the Jambi Province in Central Sumatra, Indonesia. Palaeogeogr. Palaeoclimatol. Palaeoecol. 2015, 440, 813–829. [Google Scholar] [CrossRef]
- Chen, S.; Hoffmann, S.S.; Lund, D.C.; Cobb, K.M.; Emile-Geay, J.; Adkins, J.F. A high-resolution speleothem record of western equatorial Pacific rainfall: Implications for Holocene ENSO evolution. Earth Planet. Sci. Lett. 2016, 442, 61–71. [Google Scholar] [CrossRef] [Green Version]
- Koutavas, A.; Joanides, S. El Niño–Southern Oscillation extrema in the Holocene and Last Glacial Maximum. Paleoceanography 2012, 27, 1–15. [Google Scholar] [CrossRef]
- Zeist, W.v.; Polhaupessy, N.A.; Stuijts, I.M. Two pollen diagrams from west Java, a preliminary report. Mod. Quat. Res. S.E. Asia 1979, 5, 43–56. [Google Scholar]
- Shen, X.; Liu, B.; Henderson, M.; Wang, L.; Jiang, M.; Lu, X. Vegetation Greening, Extended Growing Seasons, and Temperature Feedbacks in Warming Temperate Grasslands of China. J. Clim. 2022, 35, 5103–5117. [Google Scholar] [CrossRef]
- Shen, X.; Liu, Y.; Liu, B.; Zhang, J.; Wang, L.; Lu, X.; Jiang, M. Effect of shrub encroachment on land surface temperature in semi-arid areas of temperate regions of the Northern Hemisphere. Agric. For. Meteorol. 2022, 320, 108943. [Google Scholar] [CrossRef]


| No. | Lab Code | Depth | Material | 14C yr BP | cal. yr BP | Calendar Age (AD) |
|---|---|---|---|---|---|---|
| 1 | Poz-140430 | 32 cm | Plant remains (seed fragment) | 85 ± 30 | 53 | 1897 |
| 2 | Poz-132660 | 37 cm | Organic bulk sediment | 1550 ± 30 | ||
| 3 | Poz-141013 | 87 cm | Plant remains (leaf fragment) | 210 ± 30 | 157 | 1793 |
| 4 | Poz-132661 | 99 cm | Organic bulk sediment | 1315 ± 30 | ||
| 5 | Poz-140493 | 137 cm | Plant remains (leaf fragment) | 235 ± 30 | 292 | 1658 |
| 6 | Poz-132645 | 228 cm | Organic bulk sediment and plant remains | 1355 ± 30 | 1196 | 754 |
| 7 | Poz-140517 | 244.5 cm | Plant remains (wood fragment) | 2655 ± 35 | ||
| 8 | Poz-101166 | 293 cm | Plant material (bark, trunk, leaf fragments) | 1820 ± 35 | 1710 | 240 |
| (a) RDA-Simple Term Effects | (b) RDA-Conditional Term Effects | ||||||
|---|---|---|---|---|---|---|---|
| Name | Explains (%) | Pseudo-F | p | Name | Explains (%) | Pseudo-F | p |
| Fire | 13.5 | 5.9 | 0.002 | Fire | 13.5 | 5.9 | 0.002 |
| Erosion | 6.9 | 2.8 | 0.004 | Erosion | 7.0 | 3.2 | 0.002 |
| Ca | 6.1 | 2.5 | 0.006 | Ca | 3.8 | 1.8 | 0.016 |
| Zr | 4.6 | 1.8 | 0.018 | Cu | 3.0 | 1.4 | 0.032 |
| Ti | 3.4 | 1.3 | 0.164 | Ti | 2.6 | 1.2 | 0.158 |
| Cu | 3.1 | 1.2 | 0.23 | K | 2.7 | 1.3 | 0.128 |
| Si | 2.8 | 1.1 | 0.292 | Si | 2.0 | 1.0 | 0.494 |
| K | 2.2 | 0.8 | 0.642 | Zr | 1.8 | 0.9 | 0.718 |
Publisher’s Note: MDPI stays neutral with regard to jurisdictional claims in published maps and institutional affiliations. |
© 2022 by the authors. Licensee MDPI, Basel, Switzerland. This article is an open access article distributed under the terms and conditions of the Creative Commons Attribution (CC BY) license (https://creativecommons.org/licenses/by/4.0/).
Share and Cite
Nguyen, C.H.; Setyaningsih, C.A.; Jahnk, S.L.; Saad, A.; Sabiham, S.; Behling, H. Forest Dynamics and Agroforestry History since AD 200 in the Highland of Sumatra, Indonesia. Forests 2022, 13, 1473. https://doi.org/10.3390/f13091473
Nguyen CH, Setyaningsih CA, Jahnk SL, Saad A, Sabiham S, Behling H. Forest Dynamics and Agroforestry History since AD 200 in the Highland of Sumatra, Indonesia. Forests. 2022; 13(9):1473. https://doi.org/10.3390/f13091473
Chicago/Turabian StyleNguyen, Chung Hoai, Christina Ani Setyaningsih, Svea Lina Jahnk, Asmadi Saad, Supiandi Sabiham, and Hermann Behling. 2022. "Forest Dynamics and Agroforestry History since AD 200 in the Highland of Sumatra, Indonesia" Forests 13, no. 9: 1473. https://doi.org/10.3390/f13091473
APA StyleNguyen, C. H., Setyaningsih, C. A., Jahnk, S. L., Saad, A., Sabiham, S., & Behling, H. (2022). Forest Dynamics and Agroforestry History since AD 200 in the Highland of Sumatra, Indonesia. Forests, 13(9), 1473. https://doi.org/10.3390/f13091473