Article

Genetic Evaluation in Natural Populations of the Threatened Conifer Amentotaxus argotaenia (Hance) Pilg. (Taxaceae) Using Microsatellites

1
Faculty of Biology, VNU University of Science, 334 Nguyen Trai, Thanh Xuan, Hanoi 100000, Vietnam
2
Institute of Ecology and Biological Resources, Vietnam Academy of Science and Technology, 18 Hoang Quoc Viet, Cau Giay, Hanoi 100000, Vietnam
3
Institute of Genome Research, Vietnam Academy of Science and Technology, 18 Hoang Quoc Viet, Cau Giay, Hanoi 100000, Vietnam
4
Faculty of Biotechnology, Vietnam Academy of Science and Technology, Graduate University of Science and Technology, 18 Hoang Quoc Viet, Cau Giay, Hanoi 100000, Vietnam
5
Department of Botany, Karnatak University, Dharwad 580003, India
6
Department of Experimental Taxonomy and Genetic Diversity, Vietnam National Museum of Nature, Vietnam Academy of Science and Technology, 18 Hoang Quoc Viet, Cau Giay, Hanoi 100000, Vietnam
*
Authors to whom correspondence should be addressed.
Forests 2022, 13(9), 1452; https://doi.org/10.3390/f13091452
Submission received: 15 August 2022 / Revised: 7 September 2022 / Accepted: 7 September 2022 / Published: 9 September 2022
(This article belongs to the Special Issue Genetic Variation and Phenotypic Plasticity in Trees)

Abstract

:
Amentotaxus argotaenia (Hance) Pilg. is a threatened conifer with a wide distribution range from North to Central Vietnam due to habitat loss and over-exploitation. To provide information for its conservation and sustainable management, in the present study, genetic diversity and population genetic structure for 200 trees from eight populations, representing the natural distribution range of this species were estimated using nuclear microsatellites. The results showed a moderate genetic diversity of A. argotaenia (HO = 0.331, HE = 0.358). Significant heterozygosity deficits were detected in three populations in the Northeast area. Genetic differentiation was low in the same distribution area and high in different areas. However, the gene flow among the studied populations was relatively high (Nm = 1.17). Habitat fragmentation, geographical distance and high mountain range can be the major factors that reduce gene exchange between different areas. Various clustering analyses distinguished three major genetic groups related to the three distribution areas of this species in Vietnam. Based on the study results, we propose that some populations could be prioritized for in situ conservation due to their high genetic diversity with high allelic richness or private alleles, meanwhile other populations should be collected for ex situ conservation as genetic resources in the future.

1. Introduction

Amentotaxus argotaenia (Hance) Pilg. (Taxaceae) is a large dioecious conifer tree that can reach up to 35–40 m in height and 100–120 cm in diameter at breast height [1]. It is found in evergreen submontane forests on limestone as well as sandstone, shale and granite at an altitude of 950–1500 m asl. Its timber is used for tool making, furniture and handicrafts. Furthermore, this species is grown as a bonsai tree in Vietnam. It is also considered a potential source of anti-cancer treatments [2]. Although, A. argotaenia has a wide distribution range across Laos, northern Vietnam, and southern China, it is in danger of extinction due to habitat loss and degradation in recent decades. Moreover, illegal logging has detrimentally affected and declined rapidly its population. As a result, A. argotaenia has thus been classified as near threatened under the IUCN Red List of Threatened Species [3] and Vulnerable in the Vietnam Plant Red Data Book [4].
Genetic variability affects the adaptation and resilient maintenance of a species to environmental changes [5]. It is evaluated through gene flow, mutation, and natural selection [6], and involves many factors as such species distribution range, population sizes, life cycle, demographical history, and mating system [7]. In recent decades, due to anthropogenic activities, the habitats for many plants have been fragmented and isolated, influencing genetic variability within and between populations. The reduction in genetic variation can be a consequence of drift, inbreeding and bottleneck. This declines the evolutionary and adaptive potentials and species viability [8,9]. Therefore, the investigation of genetic variability is of great significance to understanding the genetic processes, and contributing to the protection and management of a species [10].
Over the last several decades, various genetic markers have been developed to study the genetic variability of plants and have revealed evolutionary history and assisted species conservation, breeding management, and restoration in the future [11,12]. In this respect, microsatellites have been widely used in the analysis of genetic diversity within populations and differentiation among populations and have contributed to the conservation and management of threatened plant species [13,14,15]. Among microsatellites, nuclear microsatellites (nSSRs) are mainly associated with non-coding regions and are more polymorphic than the expressed sequence tag-microsatellites (EST-SSRs) and evolve faster than the chloroplast microsatellites (cpSSRs) [16,17,18]. The EST-SSRs are derived from expressed regions of the genome [19]. In previous studies, cpSSRs were used to investigate genetic diversity of three conifers Glyptostrobus pensilis, Taxus chinensis and T. wallichina in Vietnam [13,20]. Low genetic diversity of three Amentotaxus conifers A. argotaenia, A. formosana and A. yunnanensis in China [21] and that of Fokienia hodginsii in Vietnam [22] were revealed using ISSRs (Inter simgle sequence repeats). The set of SSRs was developed from expressed sequence tags (EST) to analyze genetic diversity and structure in conifers, such as four Amentotatus conifers in China [23], Picea abies in Europe [24]. The set of nSSRs and mtDNA haplotypes was also used to assess genetic diversity and structure for three Amentotaxus conifers A. argotaenia, A. formosana, A. yunnanensis in China and A. poilanei in Vietnam [25]. So far, there is a need to investigate the genetic variability and population genetic structure of A. argotaenia in Vietnam, which is one of the prerequisites for establishing effective conservation activities. In this study, the genetic diversity and population genetic structure of A. argotaenia in evergreen submontane forests were investigated using nSSRs developed from Amentotaxus formosana [26] with the aim of the effectiveness of conservation and management of this species in Vietnam.

2. Materials and Methods

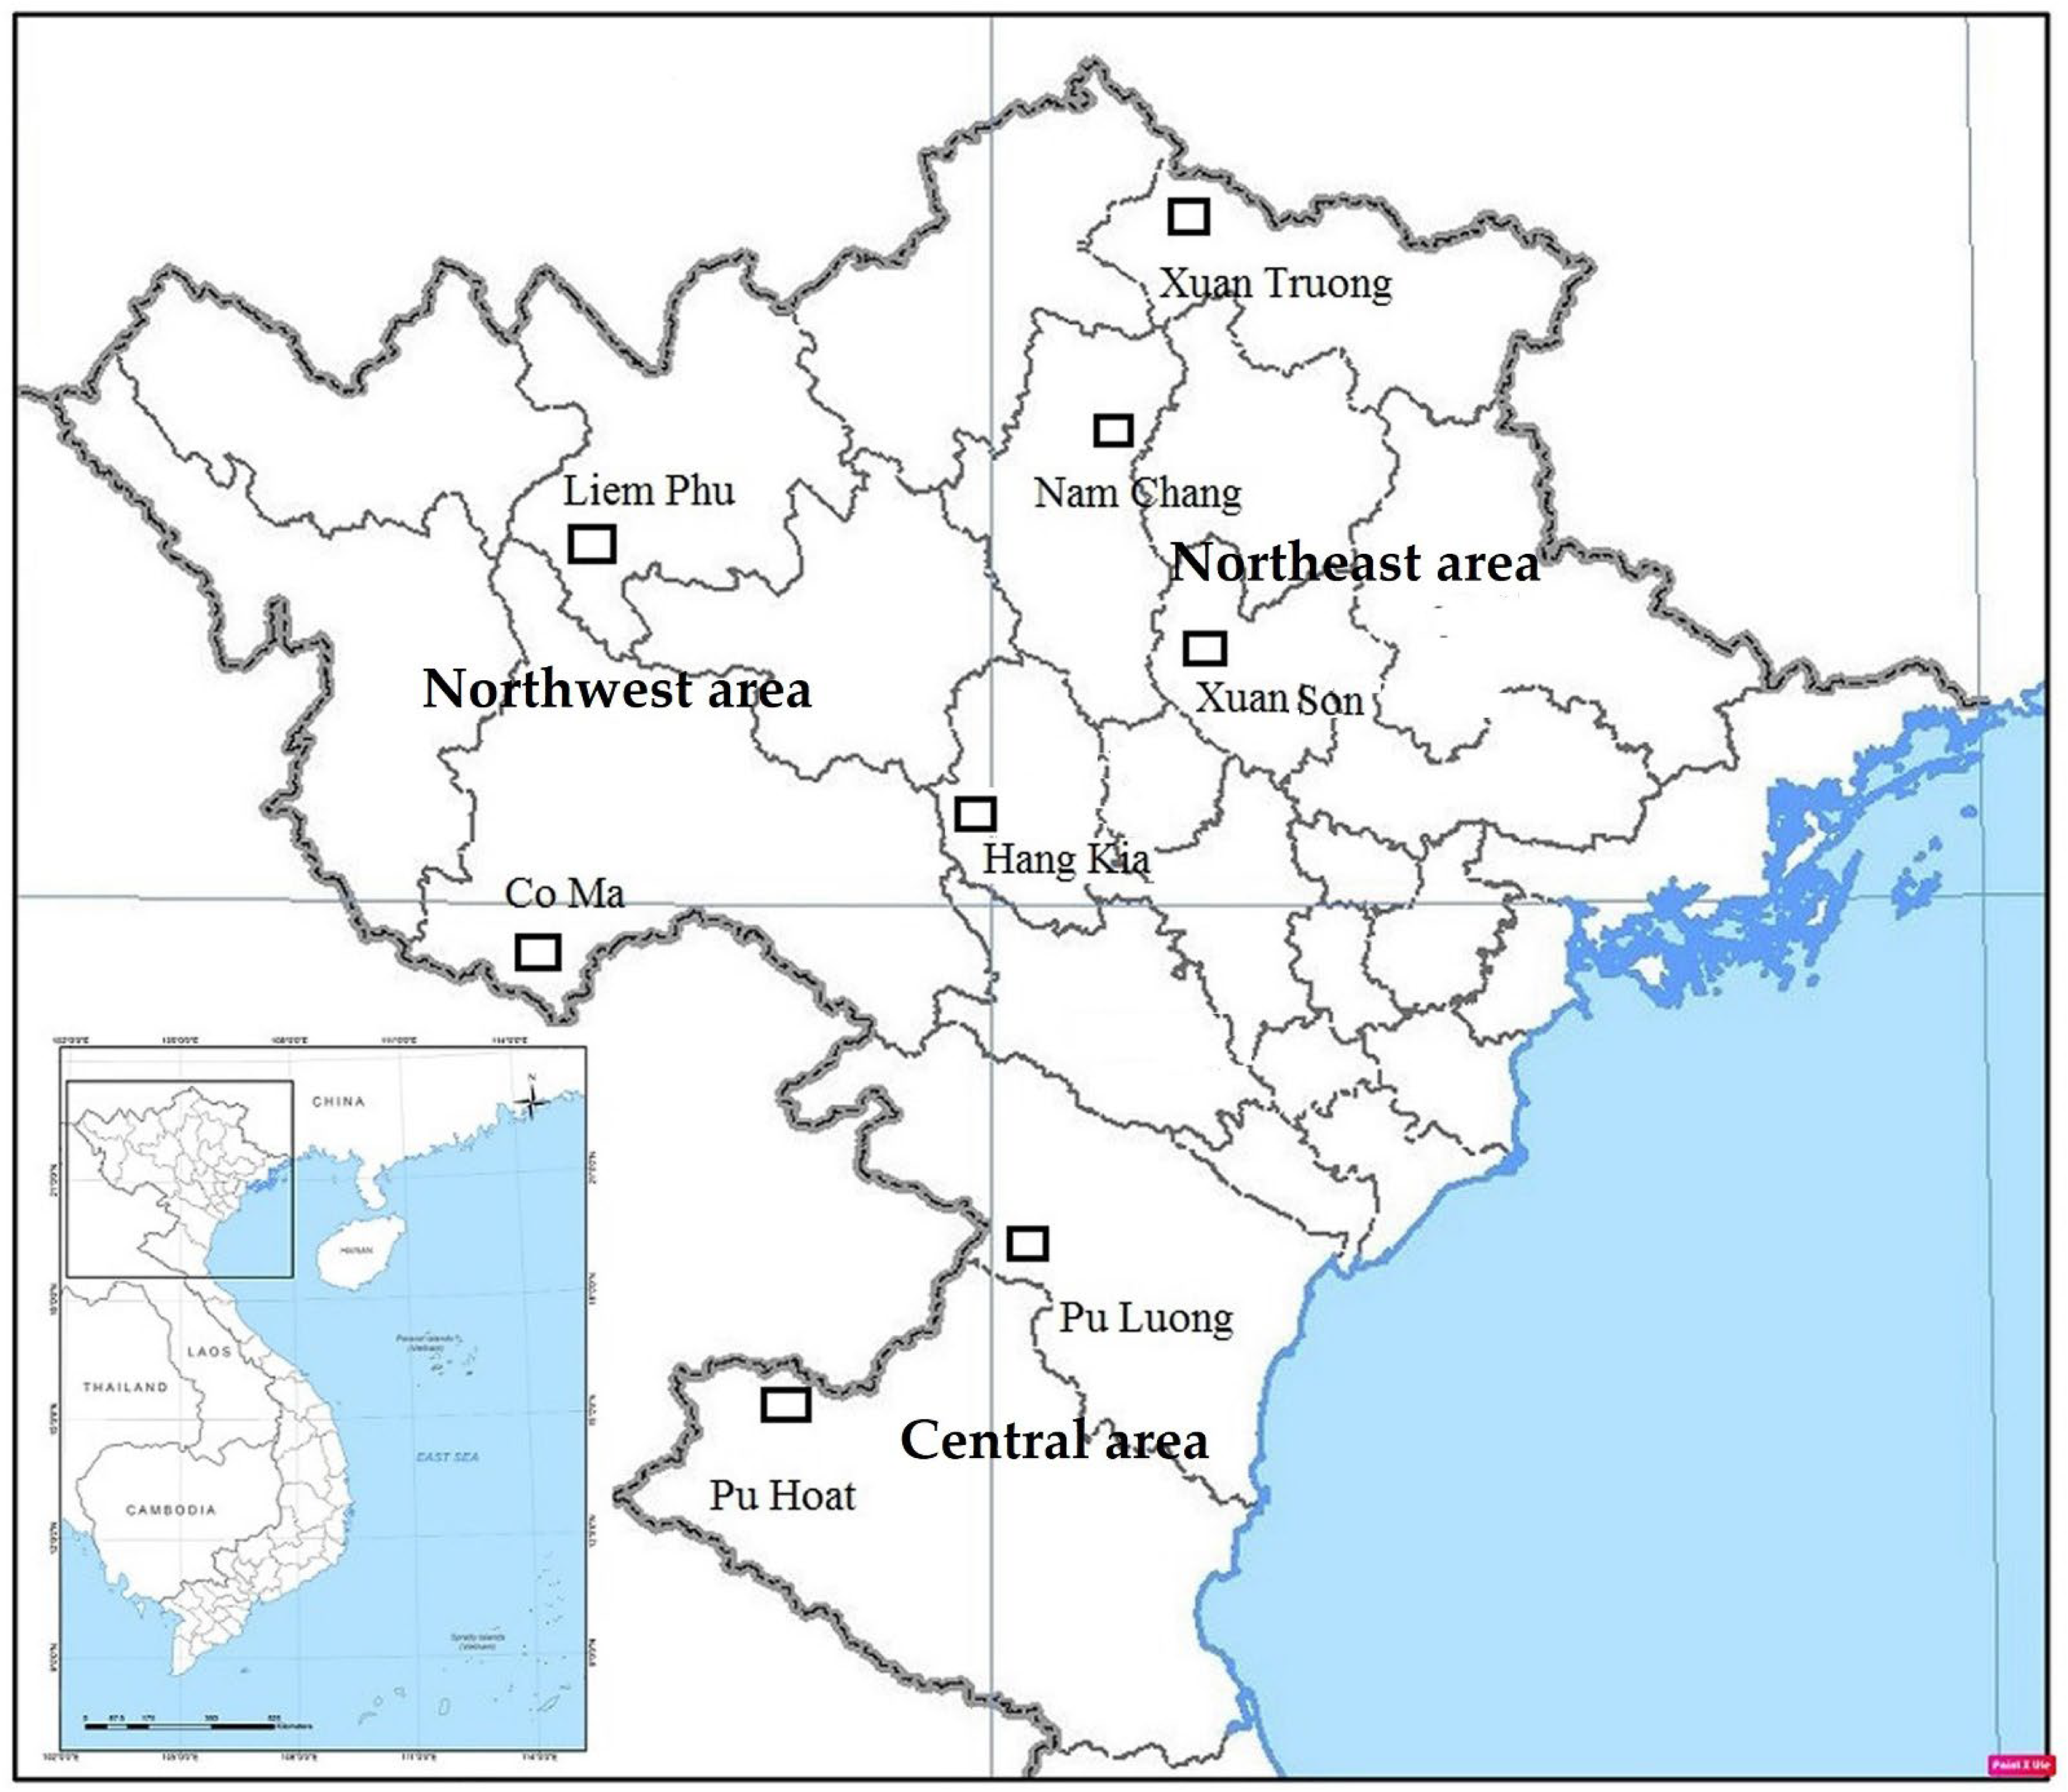
2.1. Study Sites and Tree Sample Collection

Eight sites, across the current distribution range of Amentotaxus argotaenia in Vietnam were sampled (Table S1 and Figure 1). In total, 200 A. Argotaenia trees were sampled. In each population, adult trees were randomly selected with a distance between the two collected consecutive trees at least 70 m, along the investigated transect of 2.5–3 km. A global position system (GPS) receiver was used to record the sampled locations. Inner bark samples were dried in the field using silica gel, and stored at −30 °C until they were used for the extraction of genomic DNA.

2.2. DNA Extraction and Microsatellite Amplification

In the laboratory, samples were ground using a Mixer mill MM 400 (Retsch, Haan, Germany). Total genomic DNA was extracted from the inner bark using the CTAB-based protocol proposed by Doyle and Doyle [27]. We added liquid nitrogen to each sample before the sample was ground. Genomic DNA was verified after electrophoresis on 1.2% agarose gel, and quantification of DNA samples was implemented by spectrophotometer using NanoDrop 2000C (Thermo fisher Scientific Inc., Waltham, MA, USA), and was then diluted to a concentration of 10 ng/µL. The nine SSR primers were used to analyze A. argotaenia (Table S2). All primers were developed for Amentotaxus formosana from southern Taiwan [26]. Multiplex PCR amplification reaction was conducted in a 25 µL solution volume containing 12 μL of 2× master mix (Thermo Fisher Scientific, Waltham, MA, USA), 8 μL of ddH2O, 1 μL of 10 pmol each primer, and 3 μL of the extracted DNA template (30 ng). PCR amplification was implemented on a GeneAmp PCR System 9700 (Applied Biosystems Inc., Calsbad, CA, USA), with a procedure as follows: initial denaturation at 94 °C for 5 min, followed by 30 cycles of 94 °C for 30 s, suitable annealing temperature for 45 s for each primer at 59 or 60 °C and 1 min extension at 72 °C, and a final extension at 72 °C for 10 min, was then stored at 4 °C. PCR products were resolved using the Sequi-Gen®GT DNA electrophoresis system on a 6% polyacrylamide gel in 1× AE buffer and visualized SSR bands by GelRedTM Nucleic Acid Gel Stain. Allele sizes were determined using Gel-Analyzer software of GenoSens1850 (Clinx Science Instruments Co., Ltd., Shanghai, China) with a 25 bp DNA ladder (Thermo fisher Scientific, Waltham, MA, USA).

2.3. Molecular Analysis, Genetic Diversity and Population Genetic Structure

The existence of null alleles was checked using a Micro-checker [28]. The values of polymorphism information content (PIC) for each locus were calculated using Cercus [29]. The deviation from the Hardy-Weinberg equilibrium at each locus and the linkage disequilibrium for each locus pairwise combination in each population performed were tested using Genepop [30]. The genetic diversity parameters include the mean number of alleles (NA), number of effective alleles (NE) per locus, number of private alleles (NP), observed heterozygosity (HO) and expected heterozygosity (HE) across loci and populations, the proportion of polymorphic loci (PPL) and gene flow (Nm) were calculated based on the allele frequencies using GenAlEx [31]. Allelic richness (AR) and fixation index (FIS—inbreeding coefficient) were estimated using Fstat [32]. The FIS values for null allele frequencies were corrected based on the individual inbreeding model (IIM) using Inest [33]. The existence of population bottlenecks and test deviations in heterozygotes from expected heterozygosity under mutation-drift balance for each population were evaluated using Bottleneck [34]. A two-phase model (TPM) and tested it via the Wilcoxon signed-rank test were performed.
The genetic differentiation among A. Argotaenia populations was estimated according to FST [35] and GST [36] values using Genalex. The significance values of FST across all loci were determined at the 0.05 significance level using Arlequin [37]. The analysis of molecular variance (AMOVA) was conducted based on 10,000 permutations using Arlequin. A neighbor-joining (NJ) tree was implemented for genetic relationships among populations based on the FST values using Poptree2 [38]. The genetic structure of the studied populations was analyzed based on Bayesian clustering using Structure [39]. Markov chain Monte Carlo (MCMC) of 100,000 times and the length of burn-in of 500,000 times were implemented using the admixture and correlated allele frequency models. We set ten separate runs each for a range of K values from 1 to 15. Then, the best K numbers that fit the dataset according to the principle of the highest value of DeltaK of Evanno et al. [40], were selected using Structure Harvester [41]. The most likely number of clusters were also determined based on the estimators for the median of medians (MedMedK), the median of means (MedMeanK), the maximum of medians (MaxMedK) and the maximum of mean (MaxMeanK) criteria [42], using StructureSelector [43]. The bar plots of the assigned cluster memberships were performed based on the Structure results using Clumpak [44]. A discriminant analysis of principal components (DAPC) was also performed using the adegenet package for the R software to detect clusters of genetically related individuals [45]. DAPC was implemented with and without prior information on population origin to analyze for assignment of individuals to populations.

3. Results

3.1. Genetic Diversity

All nine SSR primers in the present study were polymorphic (Table 1). Null allele frequencies were detected at four loci (p < 0.05). Genotypic linkage disequilibrium was tested for eight populations of Amentotaxus argotaenia.
Thirty-eight out of the 288 tests were significant at the 5% level. The two loci of amen7 and amen8 had a highly informative allele with a PIC value higher than 0.5, whereas the two loci (amen5 and amen9) had a less informative allele with this value of less than 0.3, and the remaining five loci have moderate informative allele values with PIC values ranging from 0.366 (amen6) to 0.466 (amen4). At the locus level, alleles (NA) were generated from 2 at two loci (amen5 and amen6) to 4 alleles at 5 loci (amen1, amen2, amen7, amen8 and amen9), with 30 alleles in total from 200 individuals in eight populations. The highest allelic richness (AR) was found at amen7 (3.8) and the lowest AR was 1.9 at amen5, with an average of 2.6. The number of effective alleles (NE) ranged from 1.16 at locus amen6 to 2.2 at locus amen8, an average of 1.7. The two loci of amen1 and amen5 showed the lowest genetic diversity values HO and HE, which were 0.15 and 0.124 for HO and 0.222 and 0.112 for HE, respectively. The two values FIS and FIT reflect the degree to deviation from Hardy-Weinberg equilibrium (HWE) within and across populations. The fixation index (FIS) ranged from 0.234 (amen2) to −0.174 (amen5), with an average of 0.12, indicating heterozygosity deficiency across all populations and inbreeding. The average value of the coefficient of total inbreeding (FIT) was 0.339, ranging from 0.121 (amen9) to 0.694 (amen1). The test of Hardy-Weinberg equilibrium (HWE) from 200 individuals showed significant deviation for seven loci. However, no significant deviations were found in two loci amen3 and amen9 (Table 1), indicating the majority of populations are under the influence of selection by migration and mutation.
At the population level, among the eight investigated populations, the percentage of polymorphism (P) ranged from 88.89% in the two populations of Liem Phu and Hang Kia to 100% in the remaining six populations, with an average of 97.22% (Table 2). Alleles (NA) per locus ranged from 2.3 in Hang Kia to 2.9 in Liem Phu, with an average of 2.6. Effective alleles (AE) ranged from 1.5 in Pu Luong to 1.8 in the three populations of Xuan Truong, Xuan Son and Pu Hoat, with an average of 1.7. Of alleles, four were private alleles.
Three private alleles (NP) were detected in the Liem Phu population and one allele appeared only in the Pu Hoat population. The observed heterozygosity (HO) and expected heterozygosity (HE) varied from 0.296 in Nam Chang to 0.354 in Xuan Son (an average of 0.331) and 0.303 in Pu Luong to 0.421 in Xuan Son (an average of 0.358), respectively. The fixation index (FIS) averaged 0.084 per population. Significantly positive FIS values were found in three populations of Xuan Truong, Nam Chang and Xuan Son, showing a deficiency in heterozygotes (p < 0.01). The individual inbreeding model (FISIIM) showed that the inbreeding corrected for null alleles varied between 0.022 in Hang Kia and 0.138 in Nam Chang, with an average of 0.074, and indicating homozygosity excess. The mean FISIIM value was lower compared to the mean FIS value. The Bottleneck analysis is presented in Table 2 and suggested no evidence of a recent bottleneck in all studied populations.

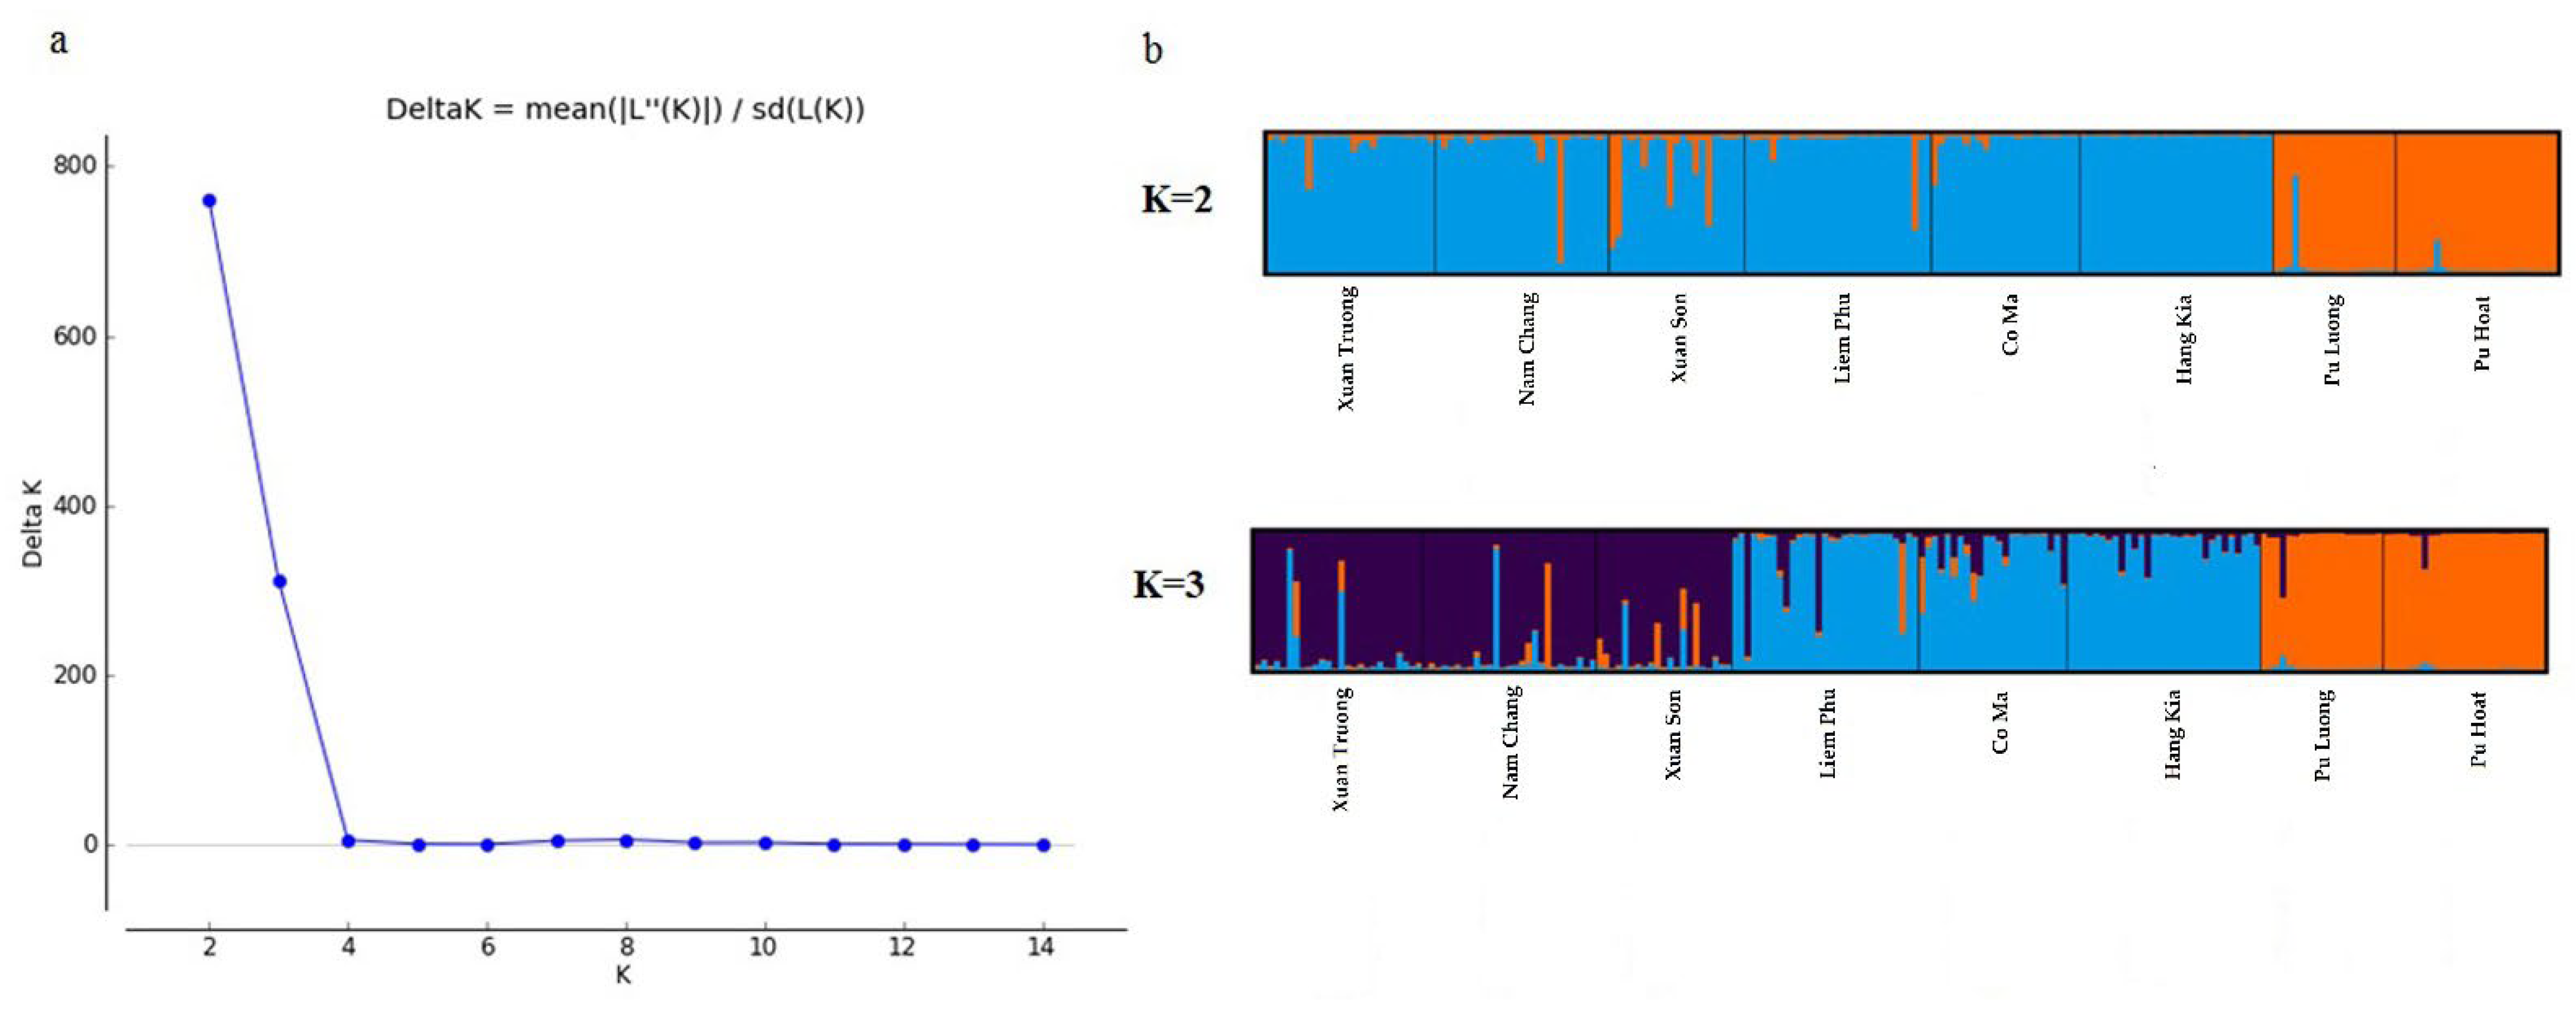
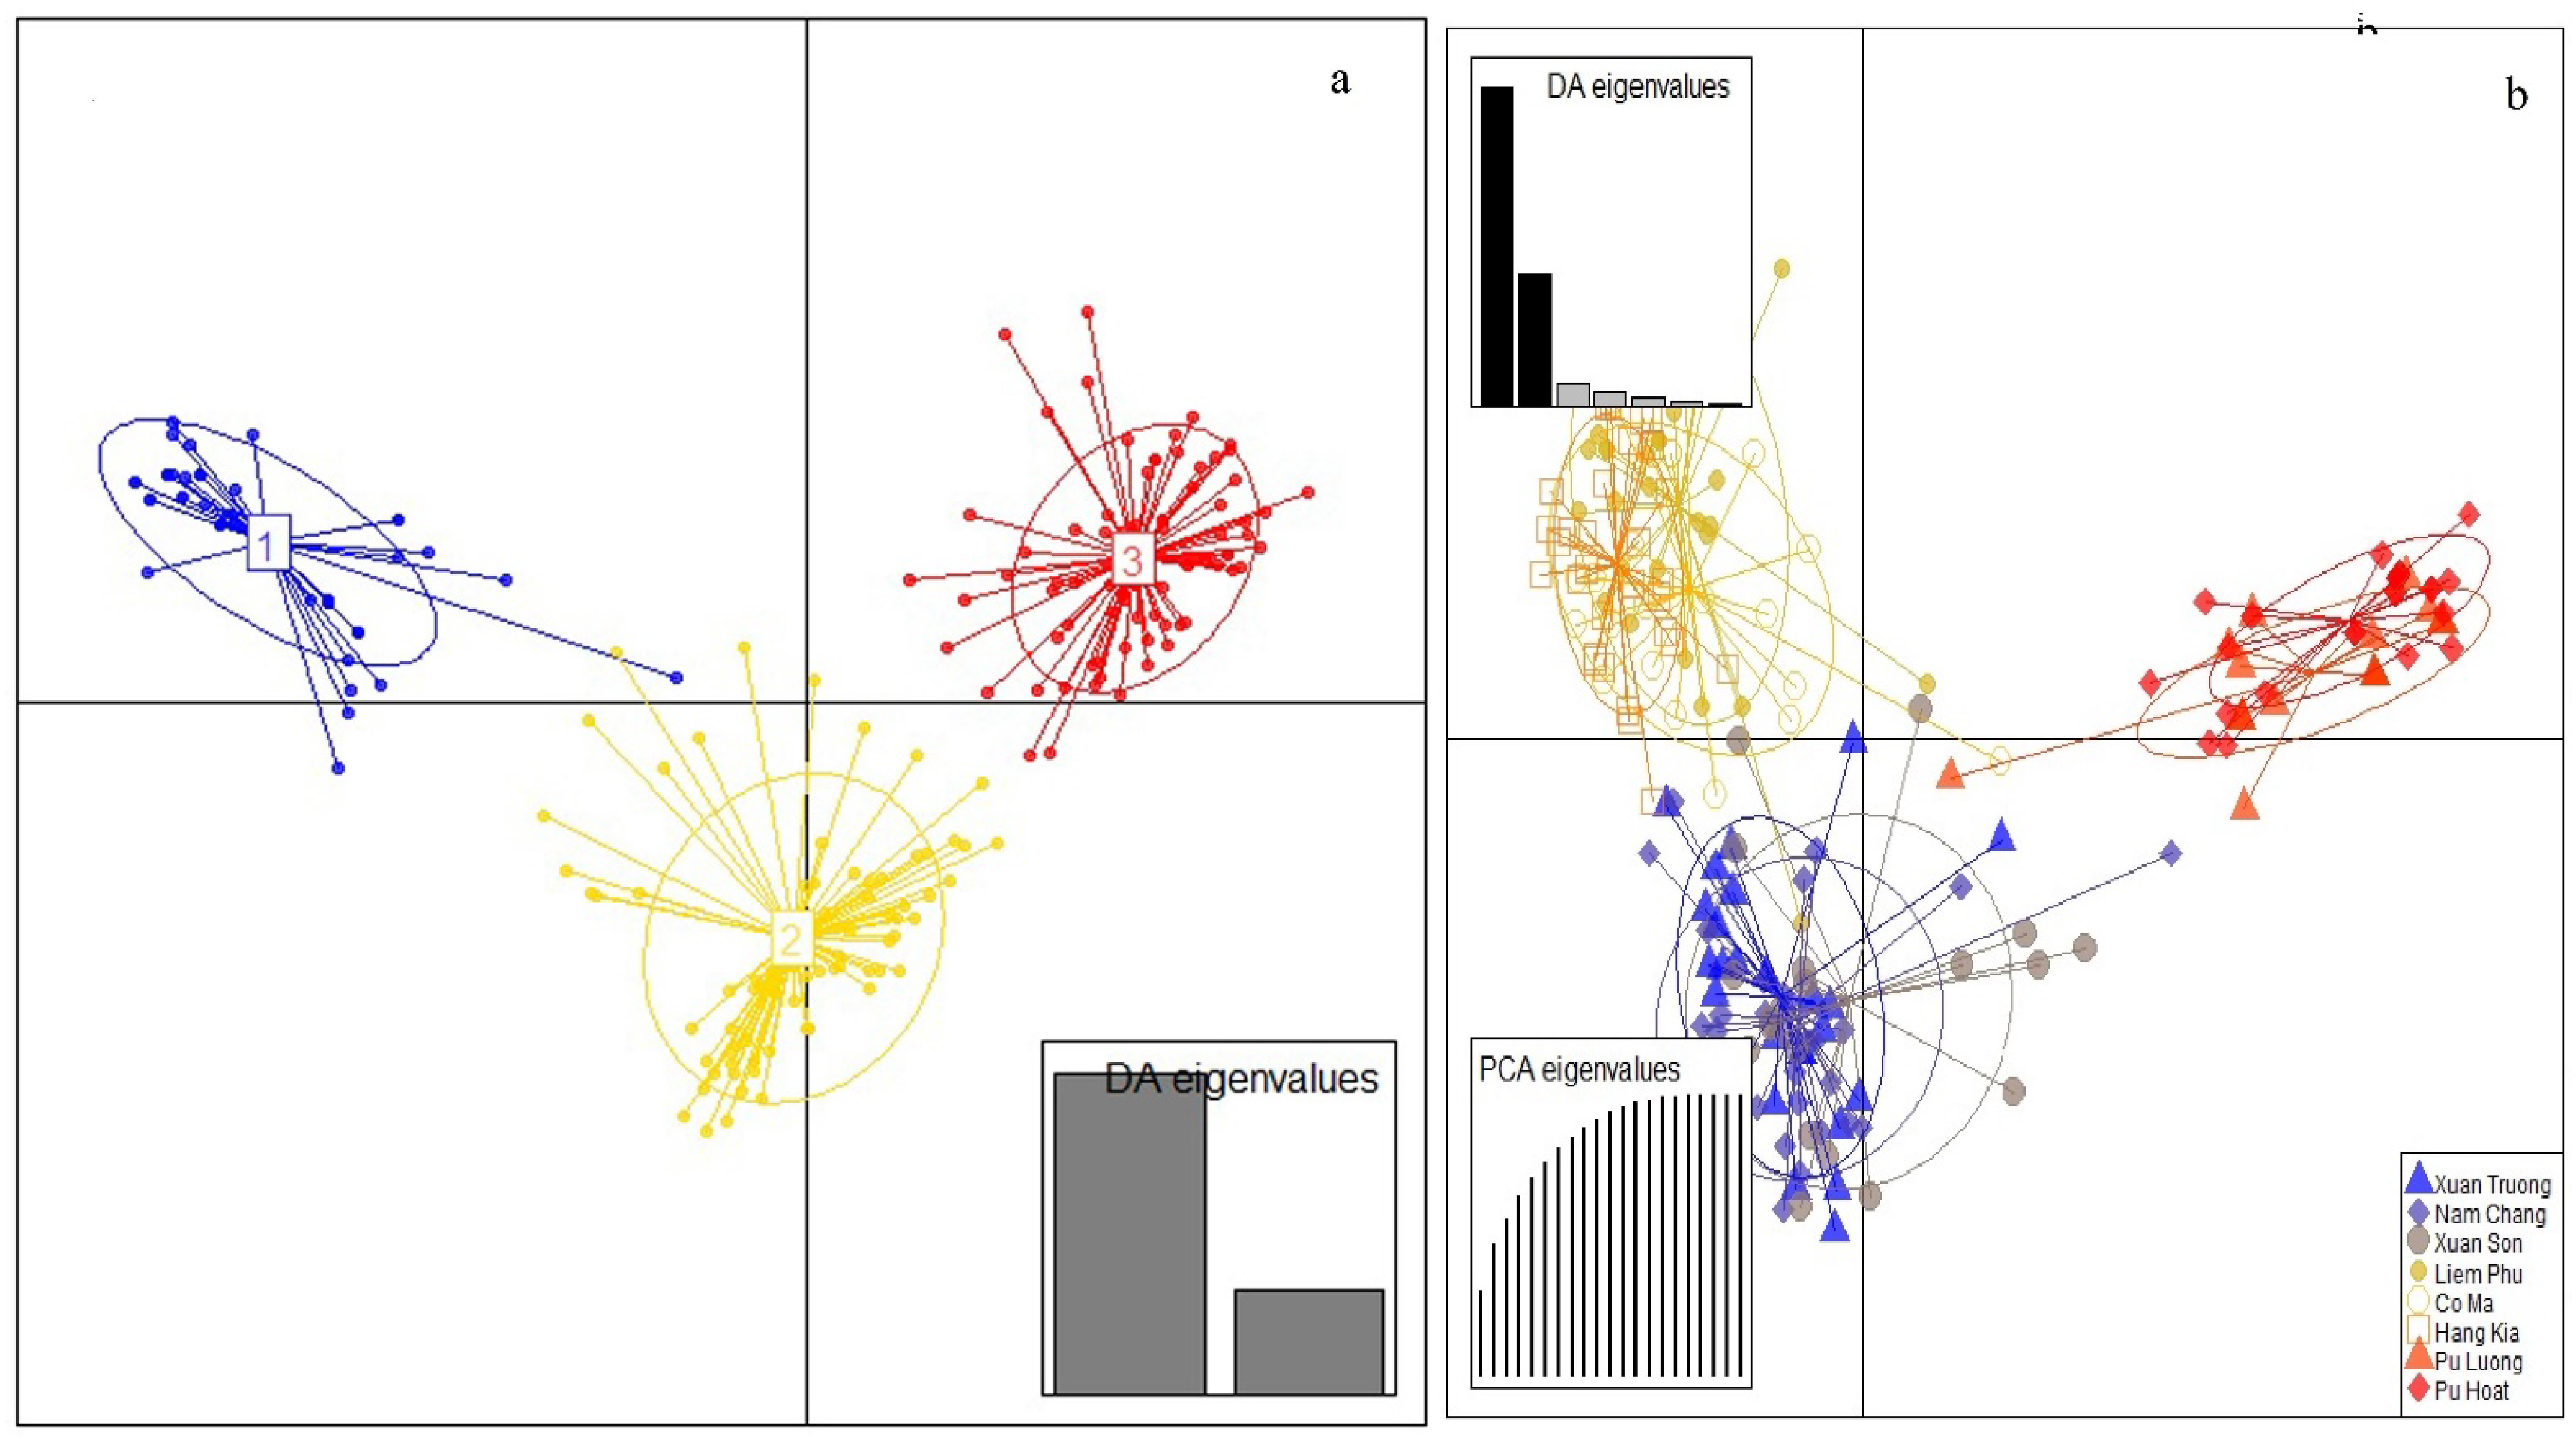
3.2. Genetic Structure

The genetic differentiation (FST) of loci ranged from 0.088 (amen3) to 0.665 (amen5), with an average of 0.29, indicating that 29% of the genetic variation existed among A. argotaenia populations, while GST values varied in the range between 0.104 (amen9) to 0.756 (amen5), with an average of 0.443. The average value of gene flow (Nm) was 1.17, ranging from 0.208 (amen1) to 2.587 (amen3). Pairwise FST values between A. argotaenia populations ranged from 0.01 to 0.376 (Table S3). The highest FST value was found between the two populations of Hang Kia and Pu Luong (0.376), while the lowest value was detected between Nam Chang and Xuan Truong (0.01). Significant differentiations were detected between populations (p < 0.01), except for the FST values for three pairs, Xuan Truong and Nam Chang, Xuan Son and Xuan Truong, and Co Ma and Liem Phu. Low FST values were found between populations in the same area. These were 0.02, 0.027 and 0.056 for the Northeast, Northwest and Central areas, respectively. Analysis of molecular variance (AMOVA) showed that 32.49% of the genetic variation were among areas (p < 0.001). The smallest proportion (2.57%) of variation was among populations within areas. The greatest proportion (64.95%) of variation was related to heterozygosity within populations (Table 3). These were confirmed by the values FST, GST and Nm (Table 1). Various clustering methods were used to identify the genetic groups of A. argotaenia populations. The Neighbor-joining (NJ) analysis determined three groups (Figure S1). The three populations of Xuan Son, Xuan Truong and Nam Chang in the Northeast area were clustered together with a bootstrap value of 86%. The three populations of Co Ma, Liem Phu and Hang Kia in the Northwest area were clustered into the second group with a bootstrap value of 95%. The remaining two populations of Pu Luong and Pu Hoat in the Central area were clustered into the third group with a bootstrap of 99%.
The Bayesian analysis showed two peaks (Figure 2a) with K = 2 (deltaK = 760.6) and K = 3 (deltaK = 312.4). However, the optimal number of genetic groups (K) was two, with the highest value of deltaK (760.6) obtained from Structure Harvester. At K = 2, the bar plot of admixture assignment for each individual was shown in Figure 2b. All individuals exhibited admixture from the two genetic groups. The ancestry percentage of individuals and each population in the two groups was shown in each color. The first group (blue) was predominant in six populations containing two areas of Northwest and Northeast (Figure 2b) with strong ancestry values ranging from 82.3% (Xuan Son) to 99.1% (Hang Kia), with an average of 93.6% (Table S4). The second group (orange) included the remaining two populations in the Central area with ancestry values of 95% (Pu Luong) and 98.1% (Pu Hoat). At K = 3, all populations in the same area were clustered together into distinct groups (Figure 2b). One group (orange) included two populations of Pu Luong and Pu Hoat in the Central area, with ancestry values of 94.6% and 96.9%, respectively. The second group (blue) included three populations Xuan Son, Xuan Truong and Nam Chang in the Northeast area, with ancestral values 86.3%, 87.4% and 88.4%, respectively. The third group (violet) included the remaining three populations Co Ma, Liem Phu and Hang Kia in the Northeast area, with ancestry values 84.8%, 85.8% and 93.1%, respectively. The Puechmaille approach showed three groups based on the estimator MedMeanK, MedMedK, MaxMedK and MaxMeanK (Figure S2). Although the K = 3 model showed a lower deltaK than the deltaK value at K = 2.
The K = 3 models were supported by the results of the Puechmaille estimator. Disriminant analysis of principal components (DAPC) without prior information also showed three genetic clusters (Figure 3a). All individuals from the two populations Pu Luong and Pu Hoat, except for one individual in Pu Luong were assigned to cluster 1 (Table S5, Figure S3). Two individuals, one in Nam Chang and one in Liem Phu were also assigned to this cluster. The second cluster included all individuals from the three populations of Xuan Truong, Nam Chang and Xuan Son, except for two individuals one in Xuan Truong, one in Xuan Son, and two in Nam Chang. However, some individuals from Liem Phu, Co Ma and Pu Luong were assigned to the second cluster. Most individuals from the remaining three populations were assigned to the third cluster. This cluster was composed of three individuals, one from each population, Xuan Truong, Nam Chang and Xuan Son. DAPC with prior information on population origin revealed individuals within and among populations (Figure 3b). The high overlap of clusters showed low genetic differentiation between populations in the same area. The results indicated that high overlap was detected between populations in the Northeast area, with the FST values ranging from 0.01 to 0.033, with an average of 0.02. Similarly, a high overlap was found between populations in the Central area (FST = 0.056) and between populations in the Northwest area with an average of FST value = 0.093 (0.016–0.043). High genetic differentiation among A. argotaenia populations was identified between different areas. The highest degree of differentiation was found between the Northwest population and the Central population, with an average FST value = 0.311 (0.272–0.376). High genetic differentiation was found between the Northeast population and Central population, with an average of FST value = 0.236 (0.201–0.258), and between the Northwest population and Northeast population, an average of FST value = 0.149 (0.12–0.165).

4. Discussion

4.1. Genetic Diversity

Outcrossing species with great potential genetic movement generally tend to maintain more genetic diversity compared with other species [46,47]. Amentotaxus argotaenia is widely distributed in the tropical forests of central and northern Vietnam and is a dioecious species with wind pollination [1]. Therefore, it is expected that this species will maintain modest genetic differentiation and great genetic diversity within its populations. Previously, information on high genetic diversity has been reported for some conifer species, such as two Amentotaxus conifers A. Argotaenia and A. Formasana in China (HE = 0.61; [25]), Cephalotaxus oliveri in China (HO = 0.57, HE = 0.568; [48]), Taxus wallichiana in Nepal (HO = 0.227–0.527, HE = 0.299–0.587; [49]), T. wallichiana var. Mairei in China (HO = 0.39, HE = 0.538; [50]), Larix decidua in Romania (HO = 0.542, HE = 0.738; [51]), Pinus nigra in Portugal (HO = 0.74, HE = 0.76; [52]), using genomic SSRs. Ho et al. [26] developed 15 nuclear microsatellites and analyzed 20 individuals each A. Argotaenia in Vietnam, A. Formosana and A. Yunnanensis in China and showed high genetic diversity with HO = 0.425, HE = 0.552; HO = 0.397, HE = 0.603; HO = 0.479, HE = 0.499, respectively. Ding et al. [53] developed 11 EST-SSRs and estimated genetic diversity from 45 individuals of three populations in China and showed high genetic diversity within Fokienia hodginsii populations (HO = 0.527, HE = 0.48). In the present study, we detected relatively moderate genetic diversity with the observed and expected heterozygosity, 0.331 and 0.358, respectively. Similar results were also recorded for three Amentotaxus conifers A. Argotaenia (HO = 0.279, HE = 0.394), A. Yunnanensis (HO = 0.268, HE = 0.334) and A. Poilanei (HO = 0.359, HE = 0.347) in China using 23 SSRs [23], Juiperus squamata in the Asian mountains (HO = 0.422, HE = 0.42; [15]) using 11 EST-SSRs, Pseudotsuga menziesii in Mexico (HO = 0.23, HE = 0.302; [54]) using 12 SSRs, Pseudotaxus chienii in China (HO = 0.341, HE = 0.37; [55]) using 20 EST-SSRs, two Amentotaxus conifers A. Yunnanensis in China (HE = 0.36) and A. Poilanei in Vietnam (HE = 0.27; [25] using 15 SSRs. But additional research revealed that the three Amentotaxus conifers A. Argotaenia (genetic diversity (H) = 0.038, Shannon‘s index (I) = 0.055), A. Formosana (H = 0.043, I = 0.063), and A. Yunnanensis (H = 0.043, I = 0.063) in China had low levels of genetic diversity. [21], Fokienia hodginsii in Vietnam (H = 0.093, I = 0.177; [22]), Pinus armandii subsp. Xuannhaensis in Vietnam (H = 0.114, I = 0.176; [56]), using inter-simple sequence repeats (ISSRs), A. Formasana (HO = 0.053, HE = 0.199; [23] in China using 23 EST-SSRs. Our findings suggested that A. Argotaenia‘s poor genetic heterozygosity was caused by habitat degradation and overexploitation. These may be the main causes of the genetic diversity within populations that is being reduced. Our study also showed that a low number of alleles (NA) was found in Hang Kia (2.3), Pu Hoat and Nam Chang (2.4). Low genetic diversity is associated with anthropogenic disturbance, which therefore may have reduced through high homozygotes for common alleles due to loss of rare alleles [57,58]. Such populations are vulnerable and subsequently at highrisk of extinction [59]. Of all the studied populations, the three populations of Liem Phu, Hang Kia and Pu Luong had lower genetic diversities compared with the remaining populations. Of the five populations of Nam Chang, Xuan Son, Hang Kia, Pu Hoat and Pu Luong in the protected areas, two populations (Xuan Son and Pu Hoat) maintained higher genetic diversity, whereas the remaining populations had lower genetic diversity. This suggests that populations can have suffered habitat disturbance and overexploitation, although several populations are conserved. The degree of disruption and the limited population size can both contribute to low genetic diversity. Our study indicated high allelic richness was detected in five populations of Xuan Truong (2.4), Xuan Son (2.4), Co Ma (2.4), Pu Luong (2.5) and Pu Hoat (2.4). These populations might be the focus of conservation efforts. Heterozygote deficiency in all studied populations, except for the two populations of Hang Kia and Pu Luong, suggests the existence of inbreeding within the distribution range of A. argotaenia, although this conifer is a predominantly outcrossing species. A significantly high heterozygote deficit was found in three populations in Northeast Vietnam (Xuan Truong, Nam Chang and Xuan Son) with a p-value < 0.01. The heterozygosity deficit was also identified by Bottleneck analysis and no evidence of recent bottlenecks was recorded. Therefore, we propose that the population size fluctuations have taken place over the past many decades.

4.2. Population Genetic Structure

Previous studies reported low genetic differentiation and high gene flow among populations such as Thuja koraiensis in China (FST = 0.048–0.078, Nm = 2.94–4.958; [14]) using genomic SSRs, Picea abies in Serbia (FST = 0.007; [24]) using EST-SSRs, Pinus nigra in Portugal (FST = 0.04; [52]) using genomic SSRs. In the present study, our results detected moderate genetic differentiation among A. argotaenia populations (FST = 0.29, GST = 0.443), indicating a restriction of gene flow. However, gene flow was relatively high (Nm = 1.17) and may effectively suppress genetic differentiation caused by genetic drift [60]. Extensive migrant rates, which reduced genetic differentiation, confirmed high gene flow between A. argotaenia communities. The AMOVA analysis also showed a low significant variation between the A. argotaenia populations within areas (p < 0.001). This could be a result of populations’ genetic divergence becoming less diverse. Similar results were also detected for Pseudotsuga menziesii in Mexico (FST = 0.285; [54]) using genomic SSRs. Low genetic differentiation among populations was observed in the same area, such as among three populations in the Northeast area (FST = 0.02), three populations in the Northwest area (FST = 0.027) and two populations in the Central area (FST = 0.056). These were supported by the NJ tree, Structure analysis and DAPC. These findings may be explained by factors including the reproductive system, out-crossing rate, and close proximity to one another. Pollen dispersal can primarily affect the gene flow and population structure of coniferous species due to the tiny pollen particle weight and low sedimentation velocity. Pollen grains can travel and provide gene flow across their distribution area. Low genetic differentiation reflects a high level of gene flow [61]. Higher genetic differentiation was found between different areas (FST = 0.201–0.258 for population pairs between Northeast and Central areas, FST = 0.120–0.165 for population pairs between Northeast and Northwest areas). These were also confirmed by the AMOVA analysis. This suggests that the large geographic distance and high mountain range as a physical barrier leading to increased isolation among populations might reduce gene exchange among populations via pollen dispersal.
Different clustering methods revealed the genetic structure of A. argotaenia and visualized the genetic relationships of its populations. The NJ tree identified three clusters related to the geographic distribution area. The admixture model-based method implemented in Structure identified that the two clusters were optimal for the 200 sampled trees. A cluster was composed of the two populations of Pu Luong and Pu Hoat in the Central area. Another cluster included the remaining six populations in both the Northeast and Northwest areas. However, the Puechmaille method using the Structure result showed three genetic clusters based on the estimators MedMeanK, MedMedK, MaxMedK and MaxMeanK. This was consistent with the NJ tree. The existence of genetic structure can be a consequence of gene flow, regarding populations into different clusters. Populations in the same area maintained strong gene flow and low genetic differentiation. Thus, these populations often clustered together and formed a genetic group. The DAPC analysis without prior information revealed three major groups. This result also confirmed that three genetic groups were optimal for the 200 sampled A. argotaenia trees. However, the mixing of three groups was observed in two populations of Nam Chang and Liem Phu, while the mixing of two groups was found in four populations of Xuan Truong, Xuan Son, Co Ma and Pu Luong. No mixture was found in the two populations of Hang Kia and Pu Hoat. The isolated populations might be associated with anthropogenic disturbance. The reduction in the dispersal of pollen grains could be considered a barrier to the gene flow of this species. The DAPC analysis with prior information also revealed three genetic groups. This suggests that genetic differentiation among populations in the same area was relatively low and gene flow was high.

4.3. Conservation of Amentotaxus argotaenia in Vietnam

To comprehend the nature of the threat and come up with solutions to protect the species, knowledge of genetic variation and population genetic structure is required. In the present study, we detected that A. argotaenia had moderate genetic diversity and relatively high differentiation among populations. Low genetic differentiation was detected between populations in the same geographic area compared with genetic differentiation between different areas. Besides genetic diversity, allelic richness and private alleles were also revealed as more suitable parameters for conservation activities. These alleles depend on effective population size and provide better information about evolutionary potential. They are an important resource for maintaining populations and adapting to altered selection pressure [62,63]. Our results showed the high allelic richness in five populations of Xuan Truong, Xuan Son, Co Ma, Pu Luong and Pu Hoat compared with the remaining populations. Private alleles were detected in two populations of Liem Phu and Pu Hoat. These populations could be considered as in situ conservation.Establishment of seed stands and promotion of natural regeneration can prevent a reduction in population size and genetic variation, thus ensuring the A. argotaenia conservation.

5. Conclusions

Based on a sampling technique that matched the A. argotaenia populations’ natural distribution area, we examined the genetic diversity within and across these populations in submontane forests in Vietnam. The findings revealed a modest level of genetic diversity within populations and a high degree of genetic difference between groups. In the same distribution area, low genetic differentiation was discovered. Some populations under study may have experienced anthropogenic disruption. The genetic diversity of A. argotaenia was low compared to previous studies in the available literature. The Bayesian analysis showed that three major genetic clusters were consistent with the NJ tree and DAPC without and with prior information. The high allelic richness and private alleles were also observed in some populations. These are the genetic resources to contribute to the survival and evolution of this species. As a result, populations like Xuan Truong, Xuan Son, Co Ma, Liem Phu, and Pu Hoat that have high genetic diversity or private alleles may be given priority for in situ conservation during A. argotaenia conservation efforts. In the future, seeds from the remnant populations could be gathered to be used in ex situ conservation as a genetic resource for this species.

Supplementary Materials

The following supporting information can be downloaded at: https://www.mdpi.com/article/10.3390/f13091452/s1, Table S1. Collection localities of Amentotaxus argotaenia. Table S2. Nucleotide sequences of the SSR primers, allele size range for A. argotaenia. Table S3. Pairwise genetic differentiation (FST) between eight A. argotaenia populations using GenAlEx 6.5. Table S4. Percentage of ancestry for eight A, argotaenia populations, based on 10 runs at K = 2 and K = 3 in STRUCTURE and compiled in STRUCTURE HARVESTER. Table S5. Number of individuals for each population assigned to a cluster. Figure S1. Genetic relationships between the eight A. argotaenia populations based on Neighbor-joining (NJ) tree using the FST values produced from Poptree2. Figure S2. Genetic clusters inferred with estimators MedMedK, MedMeanK, MaxMedK and MaxMeanK from Structure results for eight A. argotaenia populations and compiled in StructureSelector. Figure S3. Number of individuals for each population (rows) assigned to each of the three inferred genetic clusters (columns) using DAPC without prior information.

Author Contributions

The ideas conceived and the study designed, T.T.N., X.T.D. and T.T.L.; the samples collected in the field, T.T.L. and H.P.L.N.; experiment performed, H.P.L.N. and T.T.L.; the statistical analysis conducted, T.T.N., H.V.D., T.M.N. and D.M.N.; Writing-original draft preparation, T.T.N., X.T.D., L.K.P. and T.T.L.; Writing-review and editing, T.T.N., H.N.M. and T.M.N.; Supervision, H.N.M. All authors have read and agreed to the published version of the manuscript.

Funding

This research was funded by Vietnam National Foundation for Science and Technology Development (NAFOSTED), the grant number 106.03-2020.28.

Conflicts of Interest

The authors declare no conflict of interest.

References

  1. Hiep, N.T.; Loc, P.K.; Luu, N.D.T.; Thomas, P.L.; Farjon, A.; Averyanov, L.; Regalado, J., Jr. Vietnam Conifers: Conservation Status Review 2004; Science and Technics Publishing House: Hanoi, Vietnam, 2004. (In Vietnamese) [Google Scholar]
  2. Huey-Jen, S.; Lin, C.N.; Day, S.H.; Wang, L.W. A diterpenoid with a new skeleton and cytotoxic terpenoids isolated from Amentotaxus formosama. Helv. Chim. Acta 2003, 86, 2645–2652. [Google Scholar] [CrossRef]
  3. Hilton-Taylor, C.; Yang, Y.; Rushforth, K.; Liao, W. Amentotaxus argotaenia. IUCN Red List. Threat. Species 2013, e.T42545A2986540. [Google Scholar] [CrossRef]
  4. [BKHCN] Ministry of Science and Technology (Vietnam). Red Book of Vietnam, Part II Plants; Science and Technics Publishing House: Hanoi, Vietnam, 2007. (In Vietnamese)
  5. Charles, E.F.; Jeremie, B.F.; Hoban, S.; Kathleen, S.K.; Steger, L.; Aubihl, E.; Miquel, A.G.; Forry, S.; Hille, A.; Alejandro, A.R. Optimizing conservation strategies for a threatened tree species: In situ conservation of white ash (Fraxinus americana L.) genetic diversity through insecticide treatment. Forests 2018, 9, 202. [Google Scholar]
  6. Hamrick, J.L.; Godt, M.J.W.; Sherman-Broyles, S.L. Factors influencing levels of genetic diversity in woody plant species. New For. 1992, 6, 95–124. [Google Scholar] [CrossRef]
  7. Frankham, R.; Bailou, J.D.; Briscoe, D.A. Introduction to Conservation Genetics; Cambridge University Press: Cambridge, UK, 2004; Volume 190, pp. 385–386. [Google Scholar]
  8. Lira, C.F.; Cardoso, S.R.; Ferreira, P.C.; Cardoso, M.A.; Provan, J. Long-term population isolation in the endangered tropical tree species Caesalpinia echinata Lam. revealed by chloroplast microsatellites. Mol. Ecol. 2003, 12, 3219–3225. [Google Scholar] [CrossRef]
  9. Bijlsma, P.; van Arendonk, J.A.M.; Woolliam, J.A. A general procedure for predict rates of inbreeding in populations undergoing mass selection. Genetics 2000, 154, 1865–1877. [Google Scholar] [CrossRef]
  10. Hamrick, J.L.; Godt, M.J.W. Effects of history traits on genetic diversity in plant species. Philos. Trans. R. Soc. London. Ser. B Biol. Sci. 1996, 351, 1683–1685. [Google Scholar]
  11. Mihai, G.; Teodosiu, M. Genetic diversity and breeding of latch (Larix decidua Mill.) in Romania. Ann. For. Res. 2009, 52, 97–108. [Google Scholar]
  12. Bruford, M.W.; Davies, N.; Dulloo, M.E.; Faith, D.P.; Walter, M. Monitoring changes in genetic diversity. In The GEO Handbook on Biodiversity Observation Networks; Walter, M., Scholes, R.J., Eds.; Springer International Publishing: New York, NY, USA, 2017; pp. 107–128. [Google Scholar]
  13. Vu, D.D.; Bui, T.T.X.; Nguyen, M.T.; Vu, D.G.; Nguyen, M.D.; Bui, V.T.; Huang, X.; Zhang, Y. Genetic variation in two threatened species: North taxad pine (Taxus chinensis) and south taxad pine (Taxus wallichiana). J. For. Res. 2017, 28, 265–272. [Google Scholar] [CrossRef]
  14. Hou, L.; Cui, Y.; Li, X.C.W.; Zhang, Z.; Pang, X.; Li, Y. Genetic evaluation of natural populations of the endangered conifer Thuja koraiensis using microsatellite markers by restriction-associsted DNA sequencing. Genes 2018, 9, 218. [Google Scholar] [CrossRef]
  15. Ju, T.; Farhat, P.; Tao, W.; Miao, J.L.J.; Fan, X.; Tso, S.; Mao, K. Development and chareacterization of EST-SSR markers for Juniperus squamata (Cupressaceae), an ecologically important conifer in Asian mountains. Silvae Genet. 2020, 69, 116–122. [Google Scholar] [CrossRef]
  16. Cho, Y.G.; Ishii, T.; Temnykh, S.; Chen, X.; Lipovich, L.; McCouch, S.R.; Park, W.D.; Ayres, N.; Cartinhour, S. Diversity of microsatellites derived from genomic libraries and GenBank sequences in rice (Oryza sativa L.). Theor. Appl. Genet. 2000, 100, 713–722. [Google Scholar] [CrossRef]
  17. Hu, J.; Wang, L.; Li, J. Comparison of genomic SSR and EST-SSR markers for estimating genetic diversity in cucumber. Biol. Plant 2011, 55, 577–580. [Google Scholar] [CrossRef]
  18. Munoz-Falcon, J.E.; Vilanova, S.; Plazas, M.; Prohens, J. Diversity, relationships, and genetic fingerprinting of the Listada de Gandia eggplant landrace using genomic SSRs and EST-SSRs. Sci. Hortic. 2011, 129, 238–246. [Google Scholar] [CrossRef]
  19. Kalia, R.K.; Rai, M.K.; Kalia, S.; Singh, R.; Dhawan, A.K. Microsatellite markers: An overview of the recent progress in plants. Euphytica 2011, 177, 309–334. [Google Scholar] [CrossRef]
  20. Tam, N.M.; Duy, V.D.; Xuan, B.T.T.; Duc, N.M. Genetic variation and population structure in Chinese water pine (Glyptostrobus pensilis): A threatened species. Indian J. Biotechnol. 2013, 12, 499–503. [Google Scholar]
  21. Ge, X.J.; Zhou, X.L.; Li, Z.C.; Hsu, T.W.; Schaal, B.A.; Chiang, T.Y. Low genetic diversity and significant population structuring in the relict Amentotaxus argotaenia complex (Taxaceae) based on ISSR fingerprinting. J. Plant Res. 2005, 118, 415–422. [Google Scholar] [CrossRef]
  22. Tam, M.N.; Trang, N.T.P.; Hoa, N.T. Genetic diversity of an endangered species Fokienia hodginsii (Cupressaceae). Afr. J. Biotechnol. 2011, 10, 15838–15844. [Google Scholar] [CrossRef]
  23. Li, C.Y.; Chiang, T.Y.; Chiang, Y.C.; Hsu, H.M.; Ge, X.J.; Huang, C.C.; Chen, C.T.; Hung, K.H. Cross-species, amplifiable EST-SSR markers for Amentotaxus species obtained by next-generation sequencing. Molecules 2016, 21, 67. [Google Scholar] [CrossRef]
  24. Stojnic, S.; Avramidou, E.V.; Fussi, B.; Westergren, M.; Orlovic, S.; Matovic, B.; Trudic, B.; Kraigher, H.; Aravanopoulos, F.A.; Konnert, M. Assessment of genetic diversity and population genetic structure of Norway spruce (Picea abies (L.) Karsten) at its southern lineage in Europe. Implications for conservation of forest genetic resources. Forests 2019, 10, 258. [Google Scholar] [CrossRef]
  25. Ge, X.J.; Hung, K.H.; Ko, Y.Z.; Hsu, T.W.; Gong, X.; Chiang, T.Y.; Chiang, Y.C. Genetic divergence and biogeographical patterns in Amentotaxus argotaenia species complex. Plant Mol. Biol. Rep. 2015, 33, 264–280. [Google Scholar] [CrossRef]
  26. Ho, C.S.; Chen, C.T.; Ko, Y.Z.; Ge, X.J.; Hung, K.H.; Hsu, T.W.; Chiang, Y.C. Isolation and characterization of 15 microsatellite loci in four endangered Amentotaxus species (Taxaceae). Am. J. Bot. 2012, 99, e157–e159. [Google Scholar] [CrossRef]
  27. Doyle, J.J.; Doyle, L.J. Isolation of plant DNA from fresh tissue. Focus 1990, 12, 13–15. [Google Scholar]
  28. Van Oosterhout, C.; Hutchinson, W.F.; Wills, D.P.M.; Shipley, D.F. Micro-Checker: Software for identifying and correcting genotyping errors in microsatellite data. Mol. Ecol. Notes 2004, 4, 435–538. [Google Scholar] [CrossRef]
  29. Kalinowski, S.T.; Taper, M.L.; Marshall, T.C. Revising how the computer program CERVUS accommodates genotyping error increases success in paternity assignment. Mol. Ecol. 2007, 16, 1099–1106. [Google Scholar] [CrossRef]
  30. Rousset, F. GENEPOP’007: A complete re-implementation of the GENEPOP software for Windows and Linux. Mol. Ecol. Res. 2008, 8, 103–106. [Google Scholar] [CrossRef]
  31. Peakall, R.; Smouse, P.E. GenAlEx 6.5: Genetic analysis in excel. Population genetic software for teaching and research an update. Bioinformatics 2012, 28, 2537–2539. [Google Scholar] [CrossRef]
  32. Goudet, J. FSTAT, a Program to Estimate and Test Gene Diversities and Fixation Indices (Version 2.9.3). 2001. Available online: http://www.unil.ch/izea/softwares/fstat.html (accessed on 1 August 2022).
  33. Chybicki, I.J.; Burczyk, J. Simultaneous estimation of null alleles and inbreeding coefficient. J. Hered. 2009, 100, 106–113. [Google Scholar] [CrossRef]
  34. Piry, S.; Luikart, G.; Cornnet, J.M. Bottleneck: A computer program for detecting recent reductions in the effective population size frequency data. J. Hered. 1999, 90, 502–503. [Google Scholar] [CrossRef]
  35. Weir, B.; Cookerham, C. Estimating F-statistics for the analysis of population structure. Evolution 1984, 38, 1358–1370. [Google Scholar] [PubMed]
  36. Hedrick, P.W. A standardized genetic differentiation measure. Evolution 2005, 59, 1633–1638. [Google Scholar] [CrossRef] [PubMed]
  37. Excoffer, L.; Laval, G.; Schneider, S. Arlequin v. 3.5. an integrated software package for population genetics data analysis. Evol. Bioinform. Online 2005, 1, 47–50. [Google Scholar]
  38. Takezaki, N.; Nei, M.; Tamura, K. Software for constructing population trees from allele frequency data and computing other population statistics with windows interface. Mol. Evol. 2010, 27, 747–752. [Google Scholar] [CrossRef] [PubMed]
  39. Pritchard, J.K.; Stephens, M.; Donnelly, P. Inference of population structure using multilocus genotype data. Genetics 2000, 155, 945–959. [Google Scholar] [CrossRef]
  40. Evanno, G.; Regnaut, S.; Goudet, J. Detecting the number of clusters of individuals using the software structure: A simulation study. Mol. Ecol. 2005, 14, 2611–2620. [Google Scholar] [CrossRef]
  41. Earl, D.A.; von-Holdt, B.M. Structure Harvester: A website and program for visualizing structure output and implementing the Evanno method. Conserv. Genet. Res. 2012, 4, 359–361. [Google Scholar] [CrossRef]
  42. Puechmaille, S.J. The program structure does not reliably recover the correct population structure when sampling is uneven: Subsampling and new estimators alleviate the problem. Mol. Ecol. Res. 2016, 16, 608–627. [Google Scholar] [CrossRef]
  43. Li, Y.L.; Liu, J.X. StructureSelector: A web-based software to select and visualize the optimal number of clusters using multiple methods. Mol. Ecol. Res. 2018, 18, 176–177. [Google Scholar] [CrossRef]
  44. Kopelman, N.M.; Mayzel, J.; Jakobsson, M.; Rosenberg, N.A. CLUMPAK: A program for identifying clustering modes and packaging population structure inferences across K. Mol. Ecol. Res. 2015, 15, 1179–1191. [Google Scholar] [CrossRef]
  45. Jombart, T.; Devillard, S.; Balloux, F. Discriminant analysis of principal components: A new method for the analysis of genetically structured populations. BMC Genet. 2010, 11, 94. [Google Scholar] [CrossRef]
  46. Hamrick, J.L. The distribution of genetic variation within and among natural plant populations. In Genetics and Conservation; Schenwald-Cox, C.M., Chamber, S.M., MacBryde, B., Thomas, L., Eds.; The Benjamin/Cummings Publishing Company, Inc.: Menio Park, CA, USA, 1983; pp. 335–348. [Google Scholar]
  47. Nybom, H. Comparison of different nuclear DNA markers for estimating intraspecific genetic diversity in plants. Mol. Ecol. 2004, 13, 1143–1155. [Google Scholar] [CrossRef] [PubMed]
  48. Miao, Y.; Lang, X.; Li, S.; Su, J.; Wang, Y. Characterization of 15 polymorphic microsatellite loci for Cephalotaxus oliveri (Cephalotaxaceae), a conifer of medicinal importance. Int. J. Mol. Sci. 2012, 13, 11165–11172. [Google Scholar] [CrossRef] [PubMed]
  49. Gajurel, J.P.; Cornejo, C.; Werth, S.; Shrestha, K.K.; Scheidedegger, C. Development and characterization of microsatellite loci in the endangered species Taxus wallichiana (Taxaceae). Appl. Plant Sci. 2013, 1, 1200281. [Google Scholar] [CrossRef] [PubMed]
  50. Zhang, D.Q.; Zhou, N. Genetic diversity and population structure of the endangered conifer Taxus wallichiana var. mairei (Taxaceae) revealed by simple sequence repeat (SSR) markers. Biochem. Syst. Ecol. 2013, 49, 107–114. [Google Scholar] [CrossRef]
  51. Gramazio, P.; Plesa, J.; Truta, A.M.; Sestras, A.; Vilanova, S.; Plazas, M.; Vicente, O.; Boscaiu, M.; Prohens, J.; Sestra, R.E. Highly onformation SSR genotyping reveals large genetic diversity and limited differentiation in European larch (Larix decidua) populations from Romania. Turk. J. Agric. For. 2018, 42, 165–175. [Google Scholar] [CrossRef]
  52. Dias, A.; Giovannelli, G.; Fady, B.; Spanu, I.; Vendramin, G.G.; Bagnoli, F.; Carvalho, A.; Silva, M.E.; Brito, J.L.; Lousada, J.L.; et al. Portuguese Pinus nigra J.F. Arnold populations: Genetic diversity, structure and relationships inferred by SSR markers. Ann. For. Sci. 2020, 77, 64. [Google Scholar] [CrossRef]
  53. Ding, M.; Meng, K.; Fan, Q.; Tan, W.; Liao, W.; Chen, S. Development and valadation of EST-SSR markers for Fokienia hodginsii (Cupressaceae). Appl. Plant Sci. 2017, 5, 1600152. [Google Scholar] [CrossRef]
  54. Castelan, P.M.; Cortes-Cruz, M.; Mendoza-Castillo, M.C.; Cruz-Izquierdo, S.; Lopez-Upton, J.; Padilla, I.S. Diversity and geneitc structure inferred with microsatellites in natural populations of Pseudotsuga menziesii (Mirb.) Franco (Pinaceae) in the Central region of Mexico. Forests 2019, 10, 101. [Google Scholar] [CrossRef]
  55. Li, S.; Wang, Z.; Su, Y.; Wang, T. EST-SSR-based landscape genetics of Pseudotaxus chienii, a tertiary relict conifer endemic to China. Ecol. Evol. 2021, 11, 9498–9515. [Google Scholar] [CrossRef]
  56. Tam, M.N.; Loc, P.K.; Duy, V.D. Genetic diversity in Xuan nha pine (Pinus armandii subsp. xuannhaensis L.K. Phan). Res. J. Biotechnol. 2015, 10, 30–36. [Google Scholar]
  57. Honnay, O.; Jacquemyn, H. Susceptibility of common and rare plant species to the genetic consequence of habitat fragmentation. Conserv. Biol. 2007, 21, 823–831. [Google Scholar] [CrossRef]
  58. Gijbels, P.; Hert, K.D.; Jacquemyn, H.; Honnay, O. Reduced fecundity and genetic diversity in small populations of rewarding versus deceptive orchd species: A meta-analysis. Ecol. Evol. 2015, 148, 153–159. [Google Scholar] [CrossRef]
  59. Falk, D.A.; Holsinger, K.E. (Eds.) Genetic and Conservation of Rare Plants; Oxford University Press: New York, NY, USA, 1991; p. 283. [Google Scholar]
  60. Slatkin, M.; Barton, N.H. A comparison of three indirect methods for estimating average levels of gene flow. Evolution 1989, 43, 1349–1368. [Google Scholar] [CrossRef]
  61. Brutting, C.; Wesche, K.; Mayer, S.; Hensen, I. Genetic diversity of six arable plants in relation to their Red List status. Biodiv. Conserv. 2012, 21, 745–761. [Google Scholar] [CrossRef]
  62. Petit, R.J.; Mousadik, E.I.; Pons, O. Identifying populations for conservation on the basis of genetic markers. Conserv. Biol. 1998, 12, 844–855. [Google Scholar] [CrossRef]
  63. Markert, J.A.; Chamolin, D.M.; Gutjahr-Gobell, R.; Grear, J.S.; Kuhn, A.; McGreevy, T.J.; Roth, A.; Bagley, M.J.; Nacci, D.E. Population genetic diversity and fitness in multiple environments. BMC Evol. Biol. 2010, 10, 205. [Google Scholar] [CrossRef] [Green Version]
Figure 1. Studying locations (□) of A. argotaenia.
Forests 13 01452 g001
Figure 2. Results of Structure analysis for the eight A. argotaenia populations. (a) DeltaK with cluster number K from one to forteen. (b) Barplot of admixture assignment for the 200 individuals of eight populations with K = 2 and 3.
Forests 13 01452 g002
Figure 3. Analyses of population structure using DAPC. (a) Scatterplot of the DAPC without prior information; 1-3 is a genetic cluster. (b) Scatterplot of the DAPC with prior information.
Forests 13 01452 g003
Table 1. Genetic parameters of the 9 SSR loci for A. argotaenia.
LociNAARNEHOHEFISPICNull AlleleFITFSTGSTNmPHWE
amen142.71.320.1500.2220.2210.391no0.6940.5460.7150.208***
amen242.71.930.4190.4640.2340.4490.1090.2280.1450.2581.475**
amen332.41.830.4250.4440.0780.387no0.1260.0880.1372.587ns
amen432.92.050.4270.4480.1190.4660.0910.1880.1480.2571.444*
amen521.91.160.1240.112−0.1740.260no0.6300.6650.7560.126***
amen6221.410.2760.277−0.0430.366no0.4130.4130.5810.356***
amen743.81.960.3650.4440.2070.6290.2330.4760.3630.6810.439***
amen8432.200.5210.5290.1010.5500.0870.1720.1580.3341.328***
amen942.31.460.2740.2840.0210.275no0.1210.0890.1042.566ns
Mean 1.700.331
(0.023)
0.358
(0.022)
0.1200.419 0.339 (0.074)0.290 (0.071)0.4431.170 (0.320)
NA, number of alleles; AR, allelic richness; NE, effective alleles; PIC, polymorphism information content; HO and HE, observed and expected heterozygosity; FIS, fixation index; Null allele the average null allele frequency, FIT, coefficient of total inbreeding; FST, genetic differentiation index of Weir and Cockerham (1984); GST, genetic differentiation index of Hedrick (2005); Nm, number of migrants; SE, standard error; * p < 0.05, ** p < 0.01, *** p < 0.001.
Table 2. Genetic diversity and results of bottleneck tests for eight A. argotaenia populations.
PopulationP%NAARAENPHO
(SE)
HE
(SE)
FIS
(SE)
FIS IIMp Value of Bottleneck
SMMTPM
Xuan Truong1002.62.41.8-0.3290.3860.166 **0.0920.2480.125
Nam Chang1002.42.31.7-0.2960.3590.193 **0.1380.4100.150
Xuan Son1002.62.41.8-0.3540.4210.181 **0.0770.2130.064
Liem Phu88.892.92.31.730.3140.3370.0860.0700.7260.679
Co Ma1002.72.41.7-0.3530.3650.0560.0510.8200.589
Hang Kia88.892.32.11.6-0.3410.313−0.0830.0220.5270.320
Pu Hoat1002.42.41.810.3470.3820.0740.0930.8750.715
Pu Luong1002.62.51.5-0.3160.303−0.0170.0450.4100.248
Mean97.222.6 1.7 0.331
(0.023)
0.358
(0.022)
0.0830.074
P, percentage of polymorphic loci; NA, alleles per locus; AR, allelic richness; AE, effective alleles; NP, number of private alleles; HO and HE, observed and expected heterozygosities; FIS, fixation index; FIS IIM, corrected inbreeding coefficient for null alleles; SMM, Stepwise mutation model and TPM, Two-phase model; SE standard error; ** p < 0.01.
Table 3. Analysis of molecular variance from natural populations of A. argotaenia produced from ARLEQUIN.
DfSum of SquaresVariance ComponentsTotal
Variation (%)
Fixation Indices
Among areas2221.9040.82032.49FST = 0.325 ***
Among populations within areas
Within populations
5
392
24.408
642.948
0.065
1.640
2.57
64.95
Total399889.2602.525
df, degree of freedom; *** p < 0.001.
Publisher’s Note: MDPI stays neutral with regard to jurisdictional claims in published maps and institutional affiliations.

