Article

Ecological Niche Overlap and Prediction of the Potential Distribution of Two Sympatric Ficus (Moraceae) Species in the Indo-Burma Region

1
CAS Key Laboratory of Tropical Forest Ecology, Xishuangbanna Tropical Botanical Garden, Chinese Academy of Sciences, Menglun 666303, China
2
University of Chinese Academy of Sciences, Beijing 100049, China
3
School of Biological Sciences, The University of Hong Kong, Hong Kong 999077, China
4
Key Laboratory for Insect-Pollinator Biology of the Ministry of Agriculture and Rural Affairs, Institute of Apicultural Research, Chinese Academy of Agricultural Sciences, Beijing 100193, China
*
Authors to whom correspondence should be addressed.
These authors contributed equally to this work.
Forests 2022, 13(9), 1420; https://doi.org/10.3390/f13091420
Submission received: 29 April 2022 / Revised: 31 August 2022 / Accepted: 31 August 2022 / Published: 4 September 2022
(This article belongs to the Special Issue Forest Species Distribution and Diversity under Climate Change)

Abstract

:
Climate change is a major factor influencing the species distribution and population diversity of living creatures. In this study, the ecological niche model (ENM) MaxEnt was used to evaluate habitat suitability and predict potential habitats of two sympatric fig species, i.e., Ficus squamosa and F. heterostyla, in the Xishuangbanna region of China. Results indicated that mean diurnal range, isothermality, cation exchange capacity (at pH 7), and temperature seasonality were key variables influencing habitat suitability for F. squamosa. However, temperature seasonality and precipitation of the driest quarter showed the greatest contributions to F. heterostyla distribution. During the current period, the habitat suitability distributions of both Ficus species were considerably higher than known occurrences. In the future, potentially suitable distribution areas for both species will reduce overall across the whole study area, although some expansion may occur by 2070. Niche overlap of suitable areas for both species was initially high and then declined in the current period and future epochs in the RCP 2.6 scenario, but increased in the RCP 8.5 scenario. In short, the responses of both Ficus species to climate change differed. Thus, specific actions such as ex situ conservation and assisted migration may be needed to conserve both species.

1. Introduction

Global climate change poses a serious threat to natural ecosystems and biodiversity in tropical and temperate climate zones [1,2,3]. Habitat loss and fragmentation due to anthropogenic disturbance and activities can also impact biodiversity and isolation of geographic areas [4,5,6,7]. Ecological niche models (ENMs) can be used to investigate the effects of environmental change on the species distributions across extended timescales, using sampling occurrence and the environmental factors to predict the potential habitats of species. Moreover, the ENMs can more accurately predict species distributions when they incorporate information on population genetic structure and, concomitantly, local adaptation [8,9]. Under changing climates, species generally respond by adaptation or extinction, with 15–37% of species predicted to go extinct by 2050 [10,11,12]. Hence, conservation strategies are critical for slowing the rate of species loss [11].
The Indo-Burma region is a hotspot of geographic diversity, covering southern China, Laos, Myanmar, Vietnam, Cambodia, and Thailand. The region supports a variety of habitats spanning 0–6000 m in elevation and experiences strong seasonal climates. Notably, in summer, the southern and western parts are dominated by the southwest monsoon and the northeastern part is dominated by the northeast monsoon, with drier conditions prevailing throughout much of the region in winter [13]. The region supports 15,000–25,000 species of flora and more than 2000 species of fauna [14,15,16], and new species continue to be discovered. Under the influence of climate change, it is predicted that 1.9–40.5% of endemic plant and vertebrate species in this region will go extinct over the next century [17].
Of the approximately 800 Ficus species recognized worldwide, most are distributed in tropical regions. Fig trees provide nutrients, microclimates, and predator protection for the organisms living within them (e.g., pollinator and parasitic wasps, ants, mites, and nematodes) [18]. Fig trees and pollinating fig wasps (Agonidae) exhibit species-specific mutualistic relationships, with one Ficus species allowing one specific agonid species to enter the syconium to complete pollination [19,20,21]. However, several recent studies have reported a breakdown of the one-to-one rule in the fig–fig wasp breeding system, whereby one Ficus species is pollinated by more than one fig wasp species, or two Ficus species could share the same pollinator [22,23,24,25,26,27]. For example, the closely related dioecious Ficus squamosa and Ficus heterostyla share a pollinating fig wasp species in overlapping distribution areas of the Indo-Burma region [28,29], despite different habitats. Ficus squamosa is a small riparian shrub species. Its figs grow along branches close to the ground, which are often submerged during the rainy season, and seeds are primarily dispersed by water [30]. In contrast, F. heterostyla is a small deciduous species [31] that grows in forest, secondary forest, and along roadsides. Its figs are located in rooting stolons near or under the soil, where soil moisture and temperature influence fruit development. Both Ficus species show complementary fruiting phenologies in the Xishuangbanna region, which facilitates the sharing of a single pollinator fig wasp species [28]. Ecological niche overlap of the two sympatric Ficus species and the change in potential distribution under climate change are worth studying to better understand fig and fig wasp mutualism.
In recent years, maximum entropy model (MaxEnt) software has been widely used to understand fluctuations in the distribution of species impacted by climate change [32,33,34,35,36]. In this study, MaxEnt was used to model habitat suitability of the two sympatric Ficus species in the Indo-Burma region. We aimed to answer the following questions: (1) What are the suitable distribution ranges of both species under the current environment? (2) How has species distribution changed since the Last Glacial Maximum (LGM), and how will habitat availability change in the future (2050 and 2070)? (3) Does suitable habitat overlap between the two species?

2. Materials and Methods

2.1. Study Area and Collection of Species Occurrence Data

Ficus squamosa Roxb. (Subgenus Sycomorus, Section Sycocarpus) is distributed in Nepal, Bhutan, Sikkim, north-east India, Myanmar, Laos, and China (Yunnan), while F. heterostyla Merr. (Subgenus Sycomorus, Section Hemicardia) is distributed in Thailand, Vietnam, Laos, and Cambodia [37]. Both Ficus species show overlapping distributions in the Xishuangbanna region of China and share an undescribed pollinating fig wasp (Ceratosolen sp.) [28]. From 2008 to 2018, we conducted several field surveys and sample collections in China, Laos, Myanmar, Vietnam, Cambodia, and Thailand (98.5° E–109.5° E and 9.5° N–26.5° N). We investigated the distributions of both species referring to the Flora of Thailand [37] and Flora of China [38], as well as other potential parts of their ranges. We recorded 143 occurrences for F. squamosa and 257 occurrences of F. heterostylla in natural conditions, during April of 2008, April of 2014, and February of 2018 in China, June of 2013 in Vietnam, April of 2015 in Cambodia, October of 2016 in Myanmar, January of 2012, July of 2013, August of 2014, and March and October of 2018 in Thailand, and October of 2018 in Laos. We also downloaded the distribution data of both species from the Global Biodiversity Information Facility (GBIF) website (https://doi.org/10.15468/dl.m8cqz7, accessed on 21 August 2022), including 16 records for F. squamosa and nine records for F. heterostyla. All data obtained were exported to ArcGIS v10.5, with and duplicate presence data within 1 km removed, involving 104 points for F. squamosa and 199 points for F. heterostyla. Finally, the distribution data of the two sympatric species included 55 records of F. squamosa and 67 records of F. heterostyla (the source and distribution of all records are provided in Figure 1 and Table S1 in Supplementary Materials). We retained these records to match climate variables for further model analysis.

2.2. Environmental Variables

Before modeling species distributions, we tried to consider the variables that impacted on species distributions and could limit distributions at key periods. To model the habitat of target species, 19 bioclimatic and 13 other environmental variables were obtained from WorldClim (http://www.worldclim.org/, accessed on 21 August 2022), soilgrids250, and Global Forest Change [39]. To encompass forest cover (also important for seed dispersers), we included two parameters, tree height [40] and canopy cover [41]. These variables included 11 soil variables, forest canopy, and forest cover at 30 s resolution. Pearson correlation analysis was performed on the 19 bioclimatic variables at a threshold of 0.85 to exclude highly correlated variables. However, we tried to retain at least a maximum, minimum, mean/annual, and seasonality variable for both temperature and precipitation to determine limiting factors across the year. Using this criterion, nine bioclimatic variables and seven other environmental variables were selected to generate the model (Table 1). Elevation, whilst a useful variable for contemporary analysis, cannot be used for analysis over extended timescales, as it is a correlate of climate and not a direct driver, and using it for projective analysis would preclude the ability of projections to track climate across altitudes (as whilst their climate zone may shift upslope, a model using elevation as a direct driver would limit this shift). This would artificially limit species projections over time. This means that elevation would bias models of future movement, by restricting the ability of species to track climate, as well as falsely truncating species climate niches due to clearance of habitat at lower elevational bands. Furthermore paleo-elevation is notoriously challenging and risks introducing artifacts into analysis, especially in hindcast analysis, which would be hard to particularly capture across the then emergent Sunda shelf. Thus, different variables were used for contemporary and temporal analysis.
The LGM and Mid-Holocene warm period (Mid-Hol) were predicted using the nine selected bioclimatic variables (based on the assessment for redundancy detailed below) using the calibrated global climate model (GCM) data based on the Community Climate System Model ‘CCSM4′, while current and future periods (2050 and 2070 in the RCP 2.6 and RCP 8.5 scenario) were predicted with 16 (current) and 15 (future) environmental variables. The mask was created for the last glacial maximum by calculating exposed land for that period, using a bathymetric layer, and calculating the land exposed by subtracting 111 m and then classifying the area still above that level [42]. The future periods included Representative Concentration Pathway 2.6 (RCP 2.6) and Representative Concentration Pathway 8.5 (RCP 8.5) to represent both optimistic and pessimistic scenarios [43]. We used the default settings in MaxEnt, with fivefold replicates with bootstrap validation; we then used the average of the five models. Final model outputs were exported and analyzed in ArcGIS v. 10.5 (ESRI, Redlands, CA, USA).

2.3. Ecological Niche Model

MaxEnt v-3.4.0 [44] was used to model changing distributions of the species from the Last Glacial Maximum (LGM) to 2070 including two different scenarios. Spatial rarefication of localities was performed using the buffer and intersect in ArcGIS to reduce autocorrelation between the points at each grid cell (size 1 × 1 km). Removal of clustered points left 122 locations which were retained and used for subsequent analyses. Overlap between sites of both species was evaluated using the indices of equivalence (D) and similarity (I) according to the tests proposed by Warren et al. [45]. In ecology, Schoener’s index (D) is used to evaluate ecological niche and microhabitat overlap, while Hellinger’s index (I) is derived from distance, based on the comparison of probability distributions. Both indices range from 0 (no overlap) to 1 (models are identical). The potential habitats in 2050 and 2070 were determined to evaluate the future risk of species status [46].

3. Results

3.1. Model Performance

According to Pearson correlation analysis, nine of the 19 bioclimatic variables were significant for constructing the ENMs for F. squamosa and F. heterostyla. The models were validated using AUC values, with all models showing an AUC >0.9, thus being considered excellent [47]. Following these criteria, all habitat suitability models of F. squamosa and F. heterostyla were excellent. In the current period MaxEnt model, the Boyce index for F. squamosa and F. heterostyla was 0.842 and 0.875, respectively. For the 2050 and 2070 prediction models, the Boyce index for F. squamosa and F. heterostyla in different emission scenario was greater than 0.8 (Table S2).

3.2. Environmental Variable Importance

According to variable importance, both species had specific areas of suitable habitats based on percentage contribution and permutation importance estimated by MaxEnt (Table 2). The jackknife test for regularized training gain indicated that temperature seasonality (Bio4) and isothermality (Bio3) showed the highest contribution to the prediction of suitable habitats for F. squamosa and F. heterostyla (Figure S1). Interestingly, other variables contributing to the prediction of suitable habitat included mean diurnal range (Bio2) and cation exchange capacity (at pH 7) for F. squamosa and precipitation of driest quarter (Bio17) for F. heterostyla (Table 2).
The bioclimatic ranges of nine variables for both species are shown in Table 3, showing that drivers varied between species; F. heterostyla could tolerate higher daily temperature fluctuations than F. squamosa, which was distributed in areas with smaller annual temperature fluctuations.

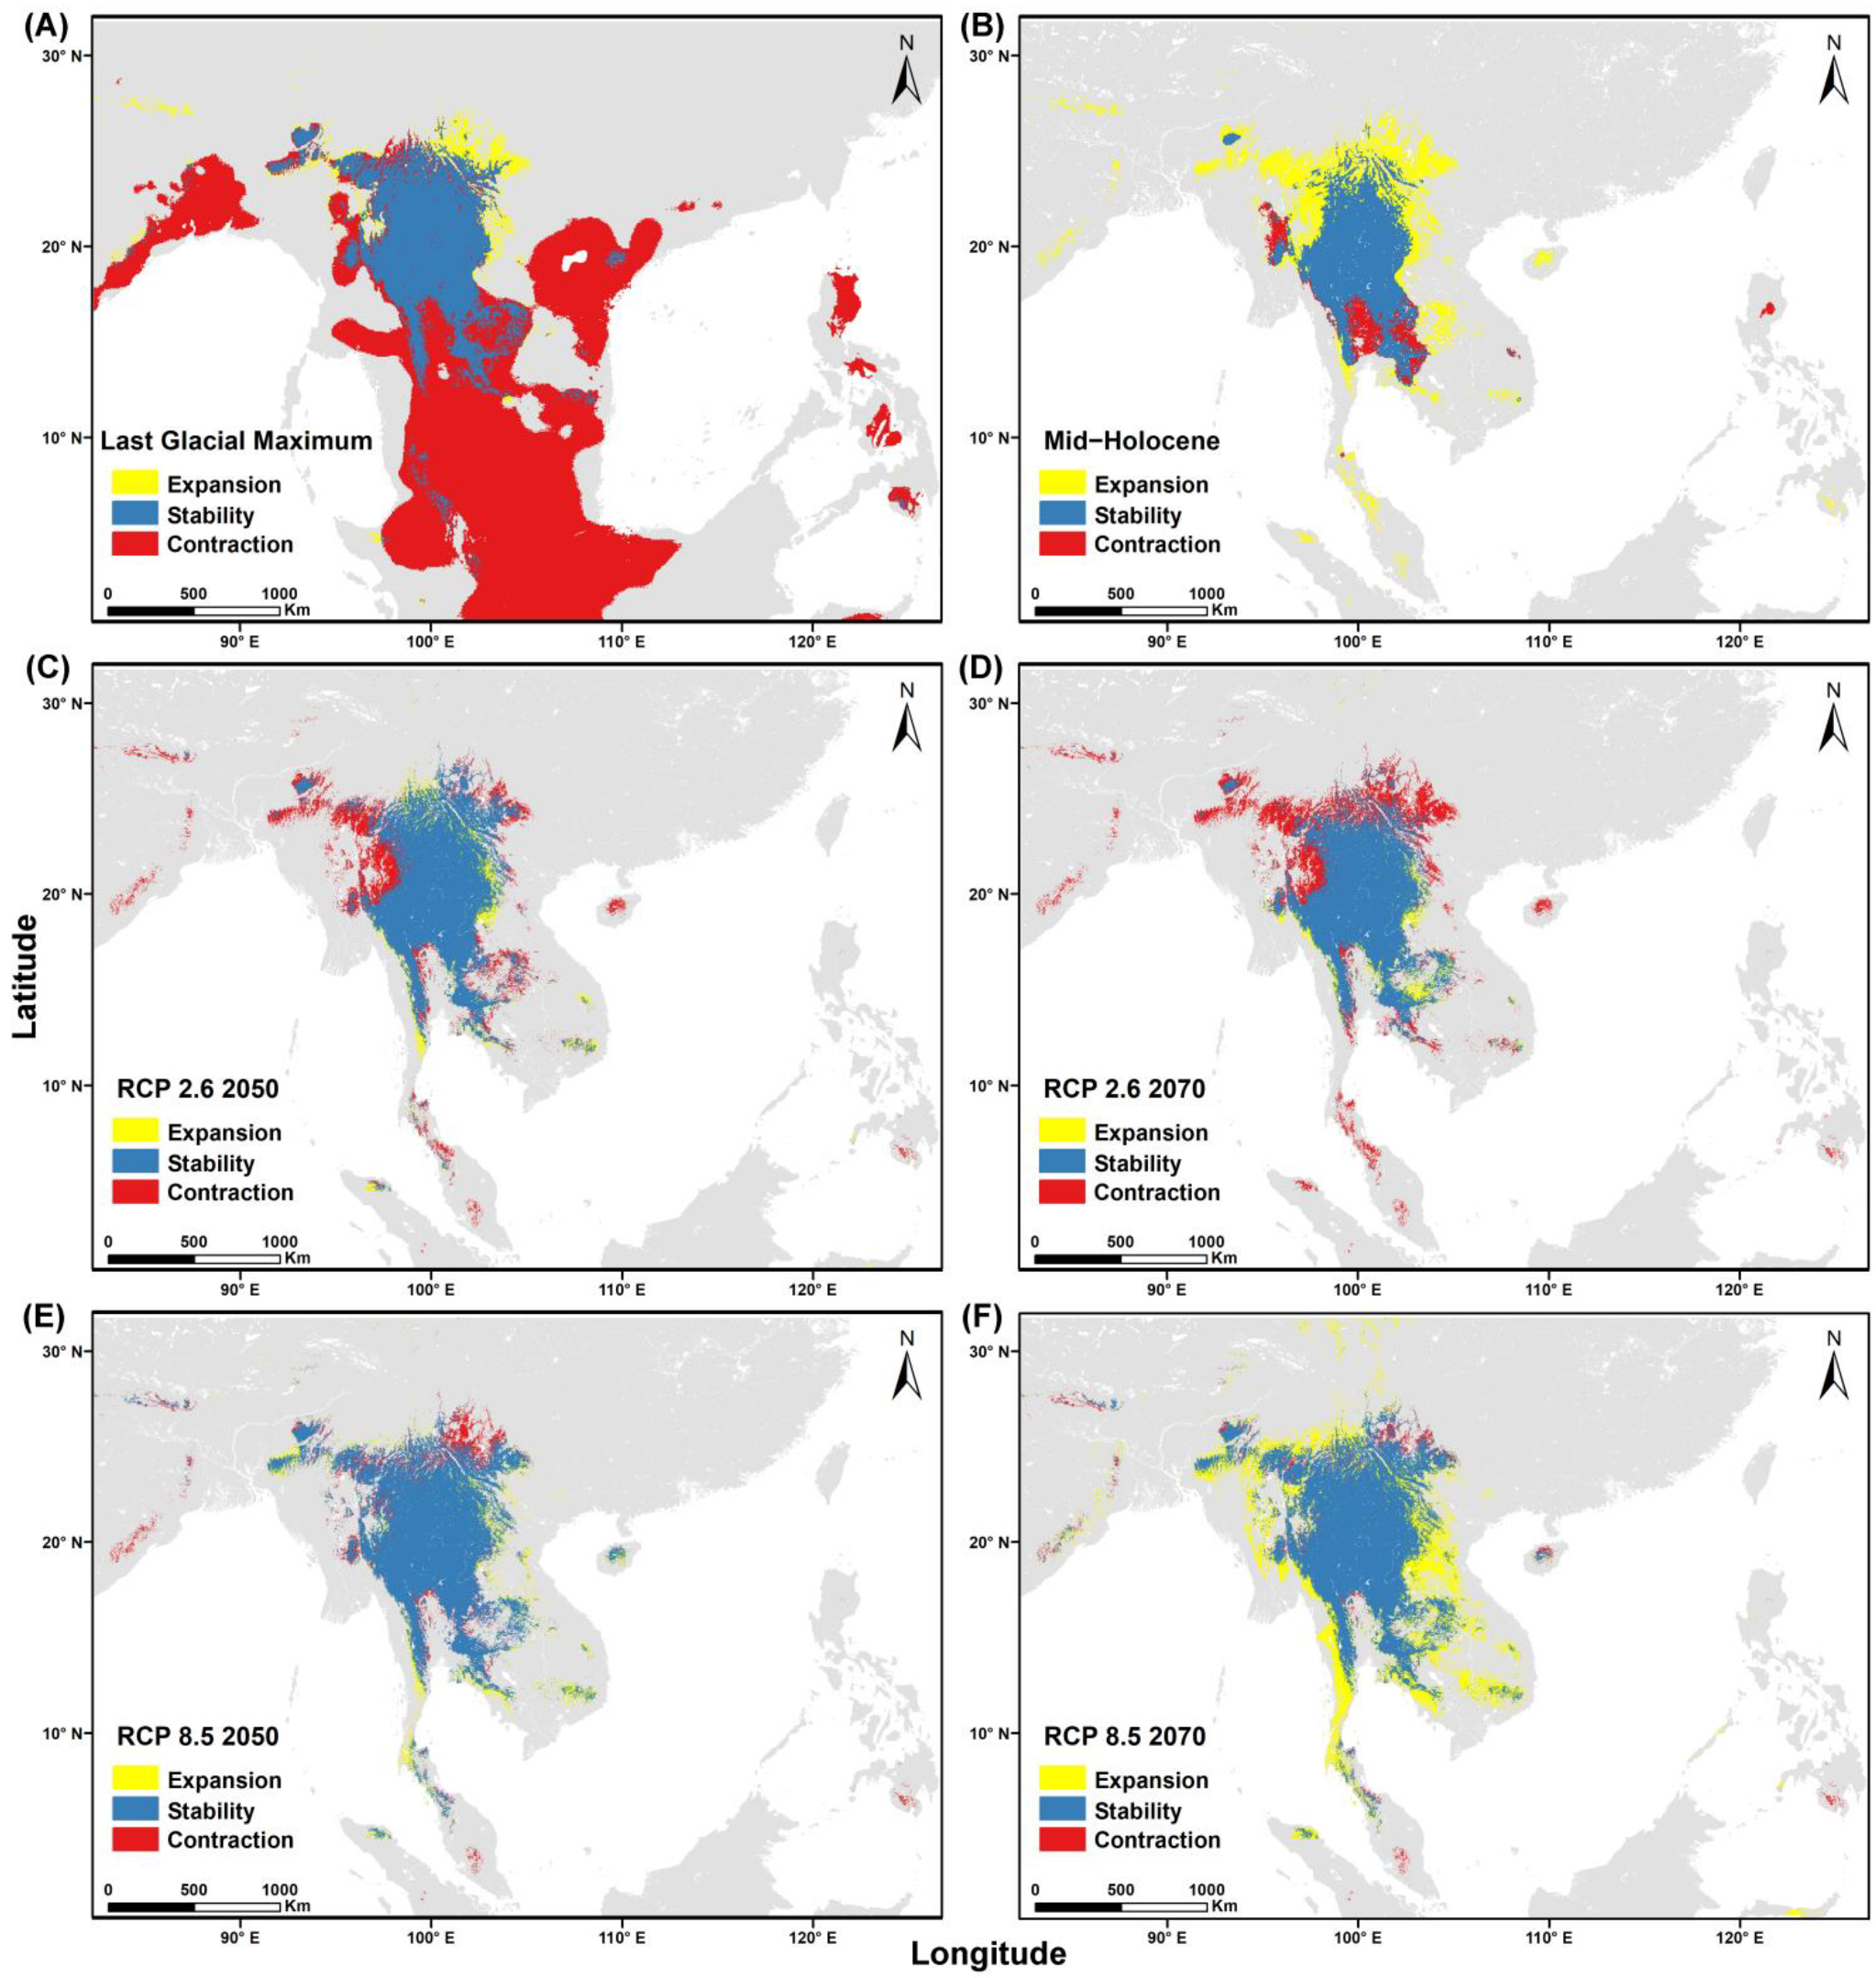
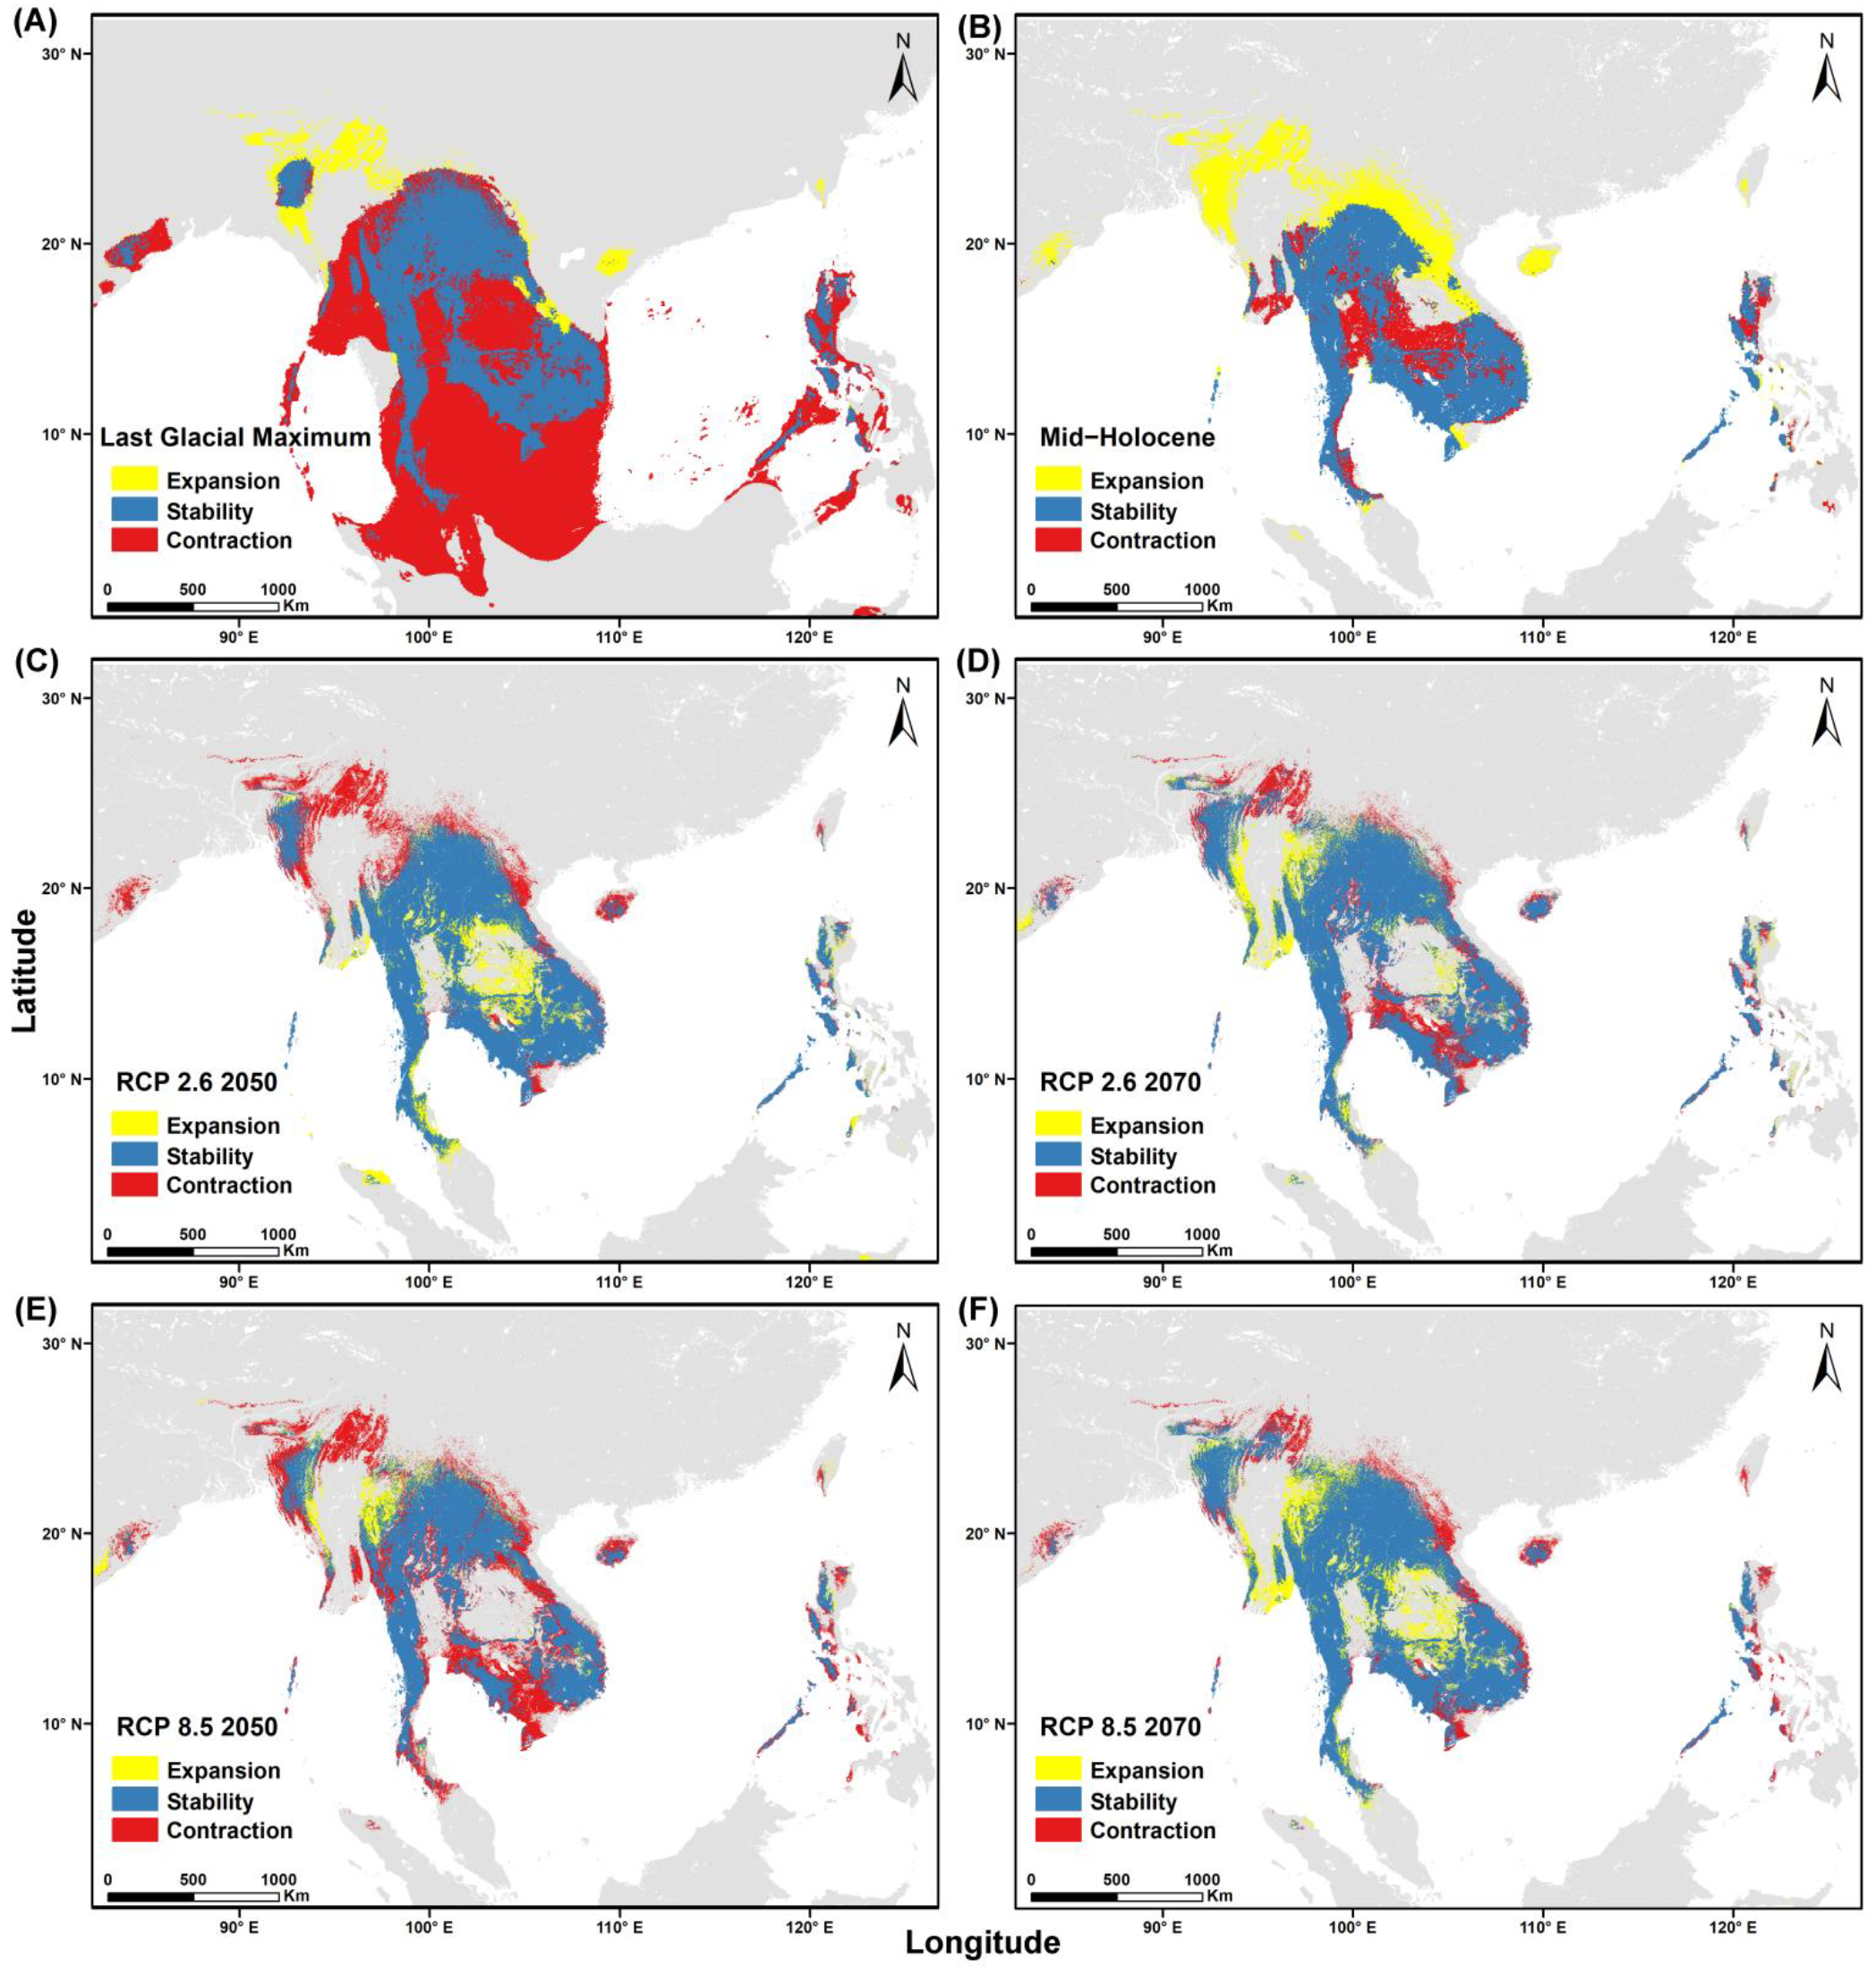
3.3. Predicting Suitable Habitats

Past, current, and future predictions of suitable habitat for F. squamosa and F. heterostyla are shown in Figure 2 and Figure 3, respectively. The ten-percentile training presence cog-log threshold was used to delineate unsuitable from suitable habitats. The distribution of suitable habitat for both species in the current period was considerably higher than known occurrences, as indicated by collected data and existing records.
During the LGM, both species had larger distribution areas than during the Mid-Hol and current period, as large portions of the now submerged Sunda shelf were suitable. Future projections for 2050 and 2070 suggested that regions from southern China to northern Thailand would still exhibit high habitat suitability potential for F. squamosa and F. heterostyla, but habitat suitability for both species would reduce overall across the whole study area, although some expansions may occur in 2070.

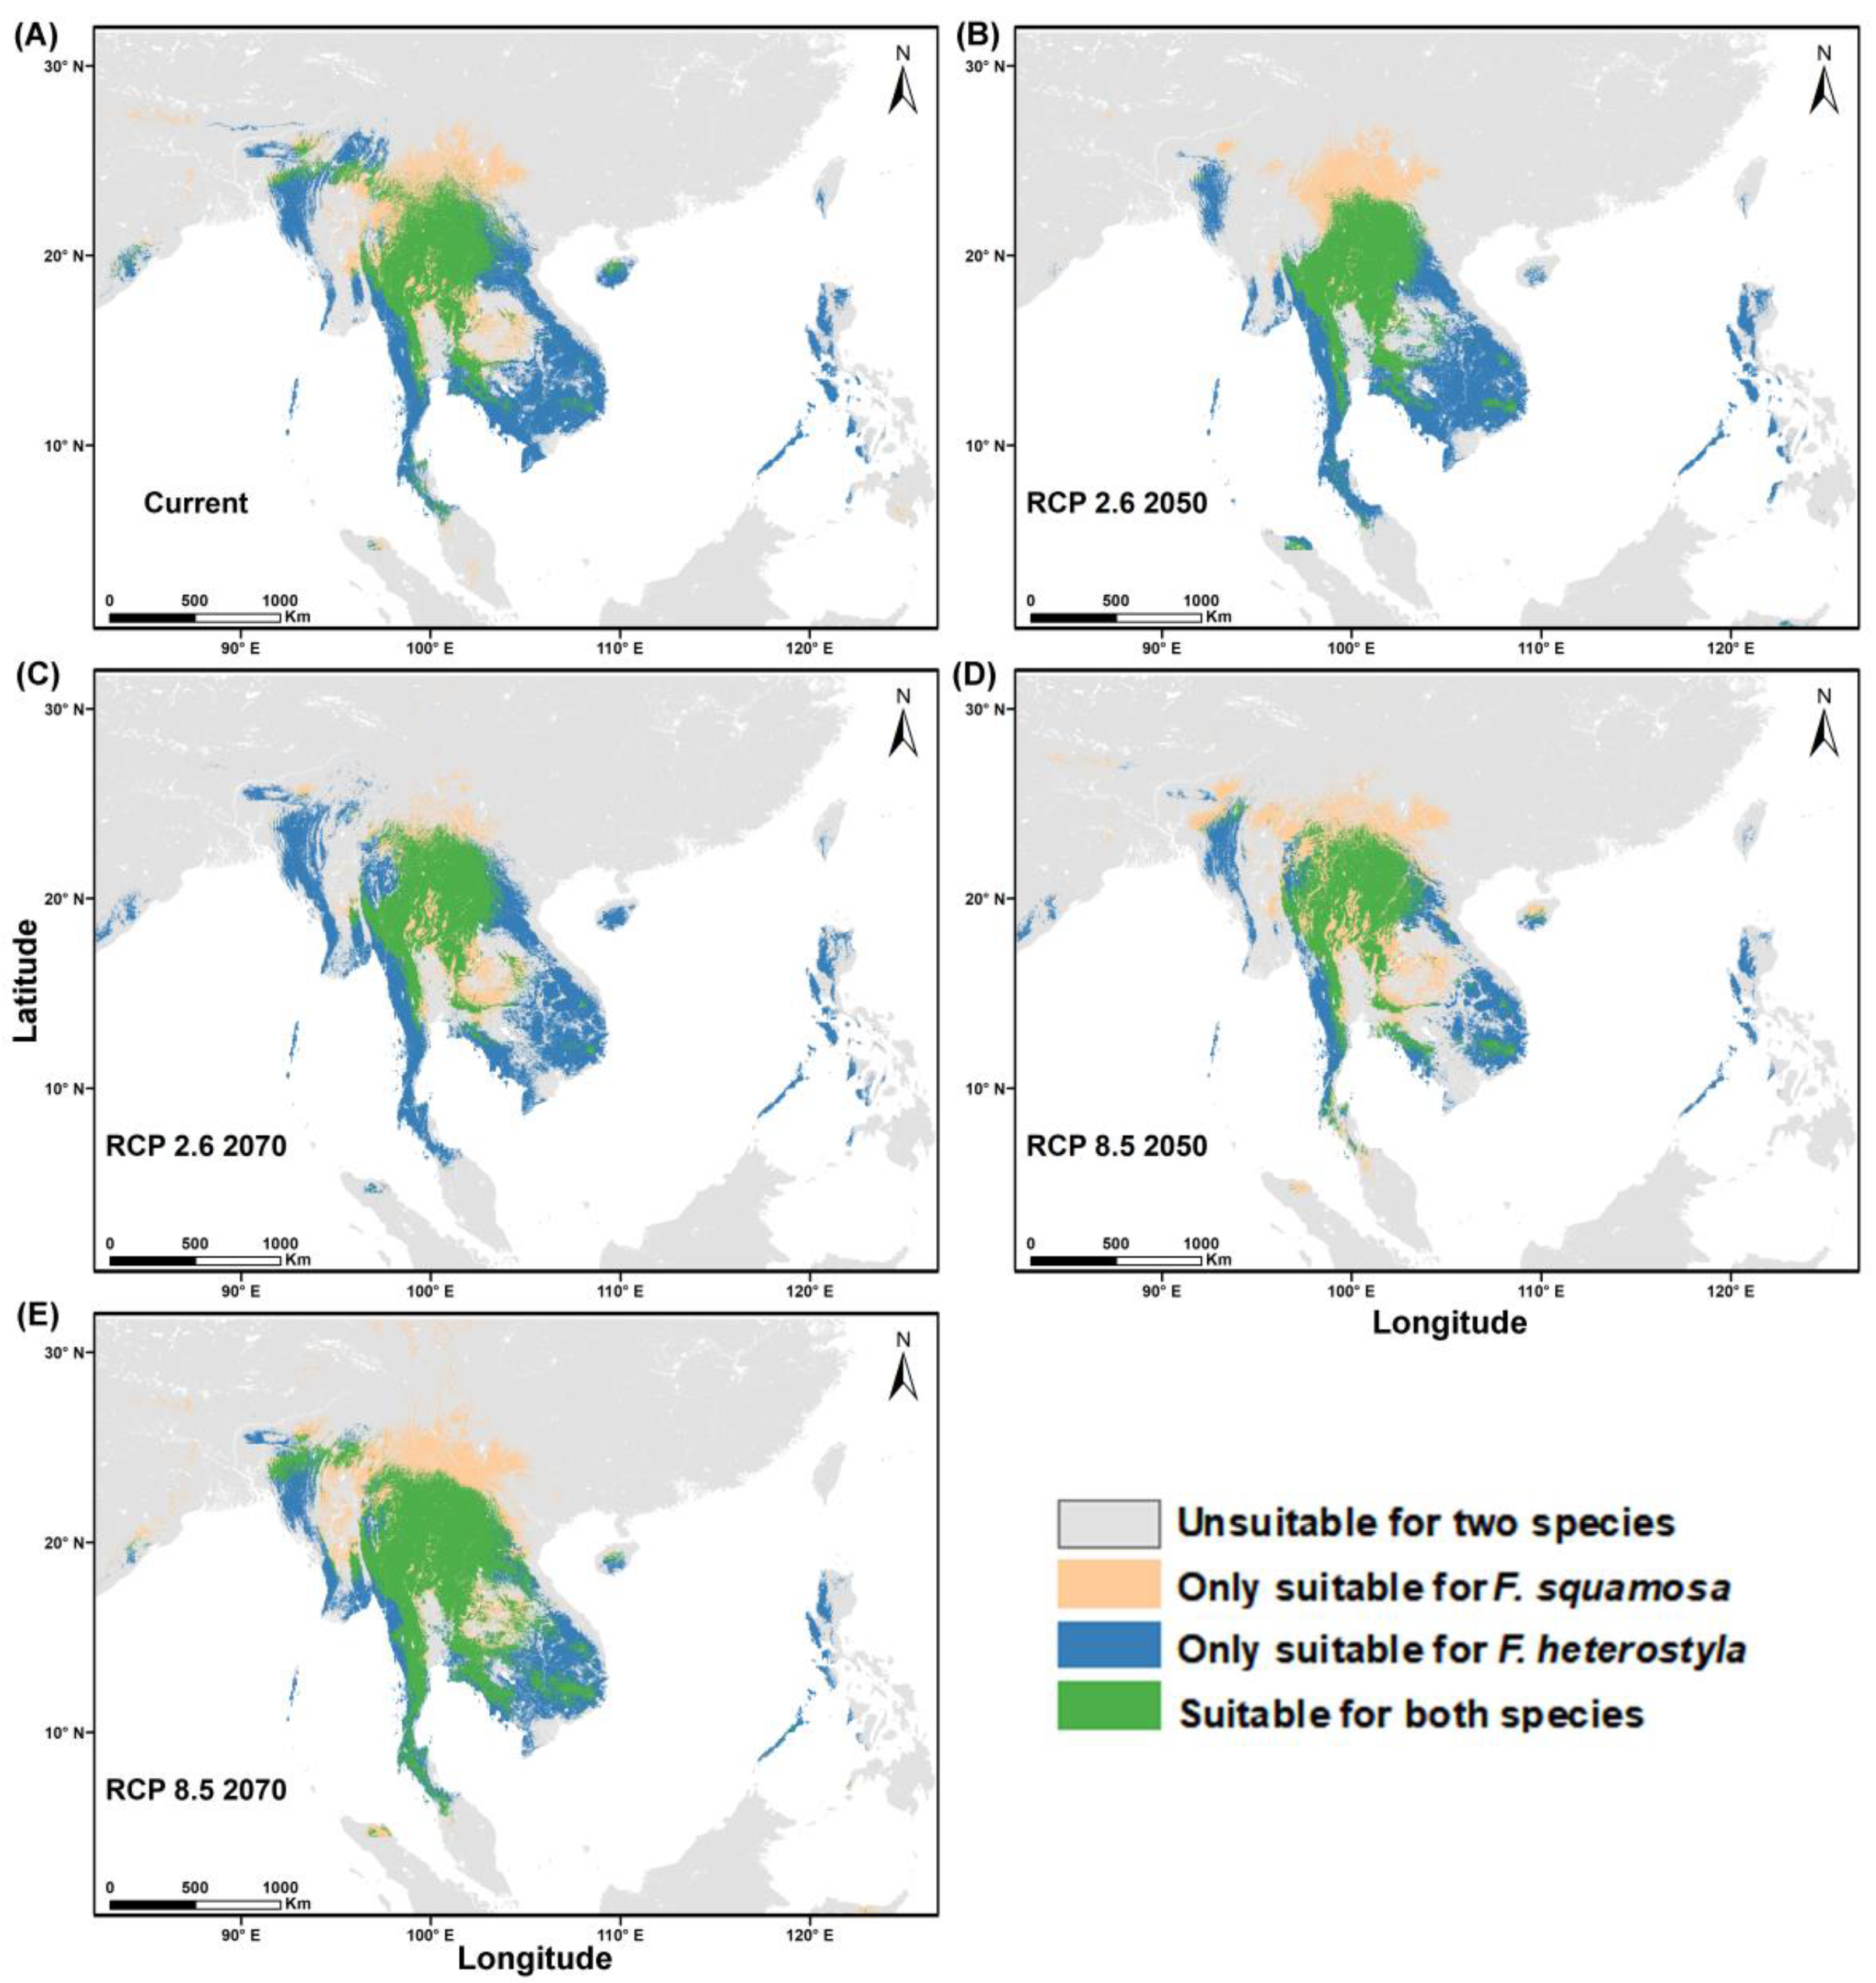
3.4. Niche Overlap and Distribution Area for Both Species

For the two species, the niche overlap of suitable areas was initially high and then declined in the current period and future epochs in they RCP 2.6 scenario, but they increased in the RCP 8.5 scenario, exceeding that under RCP 2.6 (Table 4, Figure 4). Suitable habitats for both species were found in southern China and Southeast Asia in the different time periods, with the overlapping area decreasing in the RCP 2.6 scenario and increasing in RCP 8.5 scenario (Table 5).

4. Discussion

In this study, ENMs were used to accurately predict the habitat suitability of two Ficus species [48]. On the basis of climatic variables, the MaxEnt model indicated that the distribution of both species has declined from past to current. The predicted future distributions exhibit high habitat suitability potential for F. squamosa and F. heterostyla, from southern China to northern Thailand, but habitat suitability for both species would reduce overall across the whole study area, although some expansions may occur in 2070. The seed dispersal would be key for this expansion to occur (which with the loss of larger bodied fruitbats due to hunting may be improbable). The two species showed considerable overlap in suitable habitat, which would decrease in the future. These results are consistent with the changes in area percentage for F. squamosa and the potential of F. heterostyla to better adapt to the changing environments [49], confirming that different species can detect changes in the climate and respond differently [50]. The two species showed large overlap in suitable area in the current model, indicating that they coexist in a large area. How do these coexisting species avoid competition? One explanation is their preference for different microhabitats, i.e., F. squamosa is a riparian species while F. heterostyla grows in forest, secondary forest, and along roadsides. In addition, a short overlap in flowering time, which reflects the timing of specific resource requirements by plants, in coexisting species may reduce competition for pollinator resources [51]. The primary region of overlapping distribution for both species is located toward the northern edge of tropical Asia with a highly seasonal climate. In response to seasonality, both Ficus species exhibit complementary flowering phenologies to facilitate the sharing of a single pollinator fig wasp species [28], thus supporting the temporal niche partitioning in the coexistence of plant species in the community. Previous studies have reported that climate change will affect the patterns of precipitation and temperature, especially in lowland ecosystems [52,53,54,55], with warmer surface water in concert with higher air temperatures [55]. Temperature (Bio4, Bio3) may have a stronger influence on the lowland species F. squamosa. In addition, for forest-distributed F. heterostyla, precipitation of the driest quarter (Bio17) may also significantly affect suitable niche range.
Previous research found that the 11 sympatric species of Zaluzania in Mexico show low values of overlap, suggesting that the species evolved in divergent environments [49]. However, our results indicated a high percentage of niche interactions between the sympatric species, with both influenced by similar variables, including temperature (Bio4, Bio3) and elevation. Notably, F. heterostyla can tolerate higher daily temperature fluctuations than F. squamosa, which is distributed in areas with smaller annual temperature fluctuations, and this may enable to allow the two species to co-exist [56,57]. In species-specific fig–fig wasp mutualism, pollinating fig wasps will influence the distribution of Ficus hosts, and those with short life cycles may be more sensitive to climate change. Thus, the response and adaptation of fig–fig wasp mutualism to climate change deserve further study.
The two species continue to overlap for both Ficus species in the past, current, and future (next five decades). These results suggest that F. heterostyla and F. squamosa will continue to coexist in the same areas as long as their shared pollinator can also survive in the region. Volatile organic compounds (VOCs) released by receptive figs play crucial roles in attracting pollinators and are sensitive to climate change [58]; thus, they are worthy of further study. Our results suggested that the distribution range of the two Ficus species is narrow and influenced by specific variables, facilitating targeted conservation efforts [59,60,61,62].

5. Conclusions

Both F. squamosa and F. heterostyla are distributed along the northern edge of tropical Asia, with the high seasonality in Xishuangbanna leading to the sharing of a single pollinator species. Both Ficus species are predominantly influenced by temperature and isothermality. In the future, the potential suitable distribution area of F. squamosa will decrease, while that of F. heterostyla will increase slightly but become increasingly fragmented. The niche overlap of suitable habitat of both species was high but decreased in the future. Both Ficus species show large responses to climate change, but their survival will be dependent on the presence of pollinating fig wasps and negatively impacted by human disturbance, while expansions may be contingent on the spread of fruit via vertebrate species which are also threatened.

Supplementary Materials

The following supporting information can be downloaded at https://www.mdpi.com/article/10.3390/f13091420/s1: Table S1. The occurrence data of Ficus squamosa and Ficus heterostyla used for the ENM analysis; Table S2. Predictive performance of ensemble ENMs for F. squamosa and F. heterostyla; Figure S1. Jackknife test for regularized training gain of environmental variable importance for (A) F. squamosa and (B) F. heterostyla; blue bars are relative to all environmental variables; the red bar indicates the MaxEnt model.

Author Contributions

Conceptualization, J.F., J.G. and Y.-Q.P.; data collection, Y.-Q.P., J.-F.H. and H.-H.C.; methodology, J.F., M.-J.H., A.C.H. and J.G.; writing—original draft preparation, J.F.; writing—review and editing, J.F., J.-F.H., M.-J.H., J.G. and Y.-Q.P.; review and reanalysis, M.-J.H. and A.C.H.; supervision, Y.-Q.P. All authors have read and agreed to the published version of the manuscript.

Funding

This research was supported by the National Natural Science Foundation of China (32070487).

Institutional Review Board Statement

All work was conducted in accordance with local regulations and approval.

Informed Consent Statement

No humans were interviewed as part of this study.

Data Availability Statement

Data used in this study is available in Supplementary Materials.

Acknowledgments

We would like to thank Vijak Chimchome and Nisa Leksungnoen from the Faculty of Forestry, Kasetsart University, Bangkok, Thailand, and Sreehari Raman for their helpful suggestions.

Conflicts of Interest

The authors declare no conflict of interest.

References

  1. Jump, A.S.; Peñuelas, J. Genetic effects of chronic habitat fragmentation in a wind-pollinated tree. Proc. Natl. Acad. Sci. USA 2006, 103, 8096–8100. [Google Scholar] [CrossRef] [PubMed]
  2. Thornton, P.K.; Herrero, M.; Freeman, H.A.; Okeyo, A.M.; Rege, E.; Jones, P.G.; McDermott, J. Vulnerability, climate change and livestock-opportunities and challenges for the poor. J. Semi-Arid. Trop. Agric. Res. 2007, 4, 1–23. [Google Scholar]
  3. Bacles, C.F.E.; Jump, A.S. Taking a tree’s perspective on forest fragmentation genetic. Trends Plant Sci. 2011, 16, 13–18. [Google Scholar] [CrossRef]
  4. García-Valdés, R.; Svennig, J.-C.; Zavala, M.A.; Purves, D.W.; Araújo, M.B. Evaluating the combined effects of climate and land-use change on tree species distribution. J. Appl. Ecol. 2015, 52, 902–912. [Google Scholar] [CrossRef]
  5. Zambrano, J.; Garzon-Lopez, C.X.; Yeager, L.; Fortunel, C.; Cordeiro, N.J.; Beckman, N.G. The effects of habitat loss and fragmentation on plant functional traits and functional diversity: What do we know so far? Oecologia 2019, 191, 505–518. [Google Scholar] [CrossRef] [PubMed]
  6. Zhang, C.; Xai, W.; Luan, X.; Zhuang, H.; Khan, T.U.; Zhang, G.; Wu, S. Use of historical data to assess the impact of climate change and anthropogenic disturbance on the black-billed capercaillie (Tetrao urogalloides) in northeast China. Glob. Ecol. Conserv. 2020, 22, e00972. [Google Scholar] [CrossRef]
  7. Dibattista, J.D. Patterns of genetic variation in anthropogenically impacted populations. Conserv. Genet. 2008, 9, 141–156. [Google Scholar] [CrossRef]
  8. Ikeda, D.; Max, T.L.; Allan, G.J.; Lau, M.K.; Shuster, S.M.; Whitham, T.G. Genetically informed ecological niche models improve climate change predictions. Glob. Chang. Biol. 2017, 23, 164–176. [Google Scholar] [CrossRef]
  9. Culshaw, V.; Mairal, M.; Sanmartin, I. Biogeography meets niche modeling: Interring the role of deep time climate change when data is limited. Front. Ecol. Evol. 2021, 9, 662092. [Google Scholar] [CrossRef]
  10. Williams, J.E. The biodiversity crisis and adaptation to climate change: A case study from Australia’s forests. Environ. Monit. Assess. 2000, 61, 65–74. [Google Scholar] [CrossRef]
  11. Lewis, O.T. Climate change, species-area curves and the extinction crisis. R. Soc. 2006, 361, 1465. [Google Scholar] [CrossRef] [PubMed] [Green Version]
  12. Rinawati, F.; Stein, K.; Lindner, A. Climate change impacts om biodiversity-the setting of a lingering global crisis. Diversity 2013, 5, 114–123. [Google Scholar] [CrossRef]
  13. Tordoff, A.W.; Bezuijen, M.R.; Duckworth, J.W.; Fellowes, J.R.; Koenig, K.; Pollard, E.H.B.; Royo, A.G. Ecosystem Profile Indo-Burma Biodiversity Hotspot 2011 Update; Critical Ecosystem Partnership Fund: Washington, DC, USA, 2012. [Google Scholar]
  14. Davis, S.D.; Droop, S.J.; Gregerson, P.; Henson, L.; Leon, C.J.; Synge, H.; Villa-Lobos, J.L.; Zantovska, J. Plants in Danger, What Do We Know; IUCN: Gland, Switzerland; Cambridge, UK, 1986. [Google Scholar]
  15. Davis, S.D.; Heywood, V.H.; Hamilton, A.C. Centres of Plant Diversity: A Guide and Strategy for Their Conservation: Asia, Australasia and the Pacific; IUCN Publications Unit: Cambridge, UK, 1995; Volume 2. [Google Scholar]
  16. Mittermeier, R.A.; Robles Gil, P.; Hoffmann, M.; Pilgrim, J.D.; Brooks, T.M.; Mittermeier, C.G.; Lamoreux, J.; da Fonseca, G.A.B. Hotspots Revisited: Earth’s Biologically Richest and Most Endangered Ecoregions; CEMEX: Mexico City, Mexico, 2004. [Google Scholar]
  17. Malcolm, J.R.; Liu, C.; Neilson, R.P.; Hansen, L.; Hannah, L. Global warming and extinctions of endemic species from biodiversity hotspots. Conserv. Biol. 2006, 20, 538–548. [Google Scholar] [CrossRef] [PubMed]
  18. Herre, E.; Jandér, K.; Machado, C. Evolutionary ecology of figs and their associates: Recent progress and outstanding puzzles. Annu. Rev. Ecol. Evol. Syst. 2008, 39, 439–458. [Google Scholar] [CrossRef]
  19. Jenzen, D.H. How to be a Fig. Annu. Rev. Ecol. Evol. Syst. 1979, 10, 13–51. [Google Scholar] [CrossRef]
  20. Wiebes, J.T. Co-evolution if figs and their insect pollinators. Annu. Rev. Ecol. Evol. Syst. 1979, 10, 1–12. [Google Scholar] [CrossRef]
  21. Cruaud, A.; Rønsted, N.; Chantarasuwan, B.; Chou, L.S.; Clement, W.L.; Couloux, A.; Cousins, B.; Genson, G.; Harrison, R.H.; Hanson, P.E.; et al. An extreme case of plant-insect co-diversification: Figs and fig-pollinating wasps. Syst. Biol. 2012, 61, 1029–1047. [Google Scholar] [CrossRef]
  22. Michaloud, G.; Carriere, S.; Kobbi, M. Exceptions to the one: One relationship between African fig trees and their fig wasp pollinators: Possible evolutionary scenarios. J. Biogeogr. 1996, 23, 513–520. [Google Scholar] [CrossRef]
  23. Rasplus, J.Y. The one-to-one species-specificity of the Ficus-Agaoninae mutualism: How casual? In The Biodiversity of African Plants; van der Maesen, L.J.G., van der Burgt, X.M., van Medenbach de Rooy, J.M., Eds.; Kluwer Academic Publishers: Wageningen, The Netherlands, 1996; pp. 639–649. [Google Scholar]
  24. Moe, A.M.; Rossi, D.R.; Weiblen, G.D. Pollinator sharing in dioecious figs (Ficus: Moraceae). Biol. J. Linn. Soc. 2011, 103, 546–558. [Google Scholar] [CrossRef]
  25. Darwell, C.T.; Al-Beidh, S.; Cook, J.M. Molecular species delimitation of a symbiotic fig-pollinating wasp species complex reveals extreme deviation from reciprocal partner specificity. BMC Evol. Biol. 2014, 14, 189. [Google Scholar] [CrossRef]
  26. Yu, H.; Tian, E.; Zheng, L.; Deng, X.; Cheng, Y.; Chen, L.; Wu, W.; Tanming, W.; Zhang, D.; Compton, S.G.; et al. Multiple parapatric pollinators have radiated across a continental fig tree displaying clinal genetic variation. Mol. Ecol. 2019, 28, 2391–2405. [Google Scholar] [CrossRef] [PubMed]
  27. Zhang, T.; Jandér, K.C.; Huang, J.F.; Wang, B.; Zhao, J.B.; Miao, B.G.; Peng, Y.Q.; Herre, E.A. The evolution of parasitism from mutualism in wasps pollinating the fig, Ficus microcarpa, in Yunnan Province, China. Proc. Natl. Acad. Sci. USA 2021, 188, e2021148118. [Google Scholar] [CrossRef] [PubMed]
  28. Liu, G.X.; Yang, D.R.; Peng, Y.Q.; Compton, S.G. Complementary fruiting phenologies facilitate sharing of one pollinator fig wasps by two fig trees. J. Plant Ecol. 2015, 8, 197–206. [Google Scholar] [CrossRef]
  29. Fungjanthuek, J.; Zhang, Z.R.; Peng, Y.Q.; Gao, J. The complete chloroplast genome of two related fig species Ficus squamosa and Ficus heterostyla. Mitochondrial DNA Part B 2022, 7, 236–238. [Google Scholar] [CrossRef]
  30. Pothasin, P.; Compton, S.G.; Wangpakapattanawong, P. Seasonality of leaf and fig production in Ficus squamosa, a fig tree with seeds dispersed by water. PLoS ONE 2016, 11, e0152380. [Google Scholar] [CrossRef] [PubMed]
  31. Shanahan, M.; So, S.; Gompton, S.G.; Corlett, R.T. Fig-eating by vertebrate frugivores: A global review. Biol. Rev. 2001, 76, 529–572. [Google Scholar] [CrossRef]
  32. Stock, C.A.; Alexander, M.A.; Bond, N.A.; Brander, K.M.; Cheung, W.W.; Curchitser, E.N.; Delworth, T.L.; Dunne, J.P.; Griffies, S.M.; Haltuch, M.A.; et al. On the use of IPCC-class models to assess the impact of climate on living marine resources. Prog. Oceanogr. 2011, 88, 1–27. [Google Scholar] [CrossRef]
  33. Bojinski, S.; Verstraete, M.; Peterson, T.C.; Richter, C.; Simmons, A.; Zemp, M. The concept of essential climate variables in support of climate research, applications, and policy. Bull. Am. Meteorol. Soc. 2014, 95, 1431–1443. [Google Scholar] [CrossRef]
  34. Harris, R.M.B.; Grose, M.R.; Lee, G.; Bindoff, N.L.; Porfirio, L.L.; Fox-Hughes, P. Climate projections for ecologists: Climate projections for ecologists. Wiley Interdiscip. Rev. Clim. Chang. 2014, 5, 621–637. [Google Scholar] [CrossRef]
  35. Cavanagh, R.D.; Murphy, E.J.; Bracegirdle, T.J.; John, T.; Knowland, C.A.; Corney, S.P.; Smith, W.O.; Waluda, C.M.; Johnston, N.M.; Bellberby, R.G.J. A synergistic approach for evaluating climate model output for ecological applications. Front. Mar. Sci. 2017, 4, 308. [Google Scholar] [CrossRef]
  36. Li, Y.; Li, M.; Li, C.; Liu, Z. Optimized Maxent model predictions of climate change impacts on the suitable distribution of Cunninghamia lanceolata in China. Forests 2020, 11, 302. [Google Scholar] [CrossRef] [Green Version]
  37. Berg, C.C.; Pattharahirantrlcin, N.; Chantarasuwan, B. Cecropiaceae and Moraceae. In Flora of Thailand; Santisuk, T., Larsen, K., Eds.; Forest Herbarium, Royal Forest Department: New York, NY, USA, 2011; Volume 10, pp. 475–675. [Google Scholar]
  38. Zhou, Z.; Gilbert, M.G. Flora of China. 2003, 5, 37–71. Available online: http://www.efloras.org/flora_page.aspx?flora_id=2 (accessed on 21 August 2022).
  39. Warren, D.L.; Seifert, S.N. Ecological niche modeling in Maxent: The importance of model complexity and the performance of model selection criteria. Ecol. Appl. 2011, 21, 335–342. [Google Scholar] [CrossRef] [PubMed]
  40. Crowther, T.W.; Glick, H.B.; Covey, K.R.; Bettigole, C.; Maynard, D.S.; Thomas, S.M.; Smith, J.R.; Hintler, G.; Duguid, M.C.; Amatulli, G.; et al. Mapping tree density at a global scale. Nature 2015, 525, 201–205. [Google Scholar] [CrossRef]
  41. Simard, M.; Pinto, N.; Fisher, J.B.; Baccini, A. Mapping forest canopy height globally with spaceborne lidar. J. Geophys. Res. Biogeosciences 2011, 116, G04021. [Google Scholar] [CrossRef]
  42. Hughes, A.C.; Satasook, C.; Bates, P.J.; Bumrungsri, S.; Jones, G. The projected effects of climatic and vegetation changes on the distribution and diversity of Southeast Asian bats. Glob. Chang. Biol. 2012, 18, 1854–1865. [Google Scholar] [CrossRef]
  43. Meinshausen, M.; Smith, S.J.; Calvin, K.; Daniel, J.S.; Kainuma, M.L.T.; Lamarque, J.F.; Matsumoto, K.; Montzka, S.A.; Raper, S.C.B.; Riahi, K. The RCP greenhouse gas concentrations and their extensions from 1765 to 2300. Clim. Chang. 2011, 109, 213–241. [Google Scholar] [CrossRef]
  44. Su, H.; Bista, M.; Li, M. Mapping habitat suitability for Asiatic black bear and red panda in Makalu Barun National Park of Nepal from Maxent and GARP models. Sci. Rep. 2021, 11, 14135. [Google Scholar] [CrossRef]
  45. Warren, D.L.; Glor, R.E.; Turelli, M. Environmental niche equivalency versus conservatism: Quantitative approaches to niche evolution. Evolution 2008, 62, 2868–2883. [Google Scholar] [CrossRef]
  46. Noce, S.; Caposaso, L.; Santini, M. A new global dataset of bioclimatic indicators. Sci. Data 2020, 7, 1–12. [Google Scholar] [CrossRef]
  47. Elith, J.; Phillips, S.J.; Hastie, T.; Dudík, M.; Chee, Y.E.; Yates, C.J. A statistical explanation of MaxEnt for ecologists. Divers. Distrib. 2011, 17, 43–57. [Google Scholar] [CrossRef]
  48. Shao, H.; Tian, J.Q.; Guo, K.; Sun, J.X. Effects of sample size and species traits on performance of Bioclim in predicting geographical distribution of tree species-a case study with 12 deciduous Quercus species indigenous to China. Chin. J. Plant Ecol. 2009, 33, 870–877. [Google Scholar]
  49. Suárez-Mota, M.E.; Villaseñor, J.L. Ecological niche overlap among species of the genus Zaluzania (Asteraceae) from the dry regions of Mexico. Plant Ecol. Evol. 2020, 153, 337–347. [Google Scholar] [CrossRef]
  50. Chown, S.L.; Hoffmann, A.A.; Kristensen, T.N.; Angilletta, M.J.J.; Stenseth, N.C.; Pertaldi, C. Adapting to climate change: A perspective from evolutionary physiology. Clim. Res. 2010, 43, 3–15. [Google Scholar] [CrossRef]
  51. Jensen, A.M.; Schamp, B.S.; Belleau, A. Evidence of temporal niche separation via low flowering time overlap in an old-feld plant community. Oecologia 2019, 189, 1071–1082. [Google Scholar] [CrossRef]
  52. Seavy, N.E.; Gardali, T.; Golet, G.H.; Griggs, F.O.; Howell, C.A.; Kelsey, R.; Small-Lorenz, S.; Viers, J.H.; Weigand, J. Why climate change makes riparian restoration more important than ever: Recommendations for practice and research. Ecol. Restor. 2009, 27, 330–338. [Google Scholar] [CrossRef]
  53. Capon, S.J.; Chambers, L.E.; Nally, R.M.; Naiman, R.J.; Davies, P.; Marshall, N.; Pittock, J.; Reid, M.; Capon, T.; Douglas, M.; et al. Riparian ecosystems in the 21st century: Hotspots for climate change adaptation? Ecosystems 2013, 16, 359–381. [Google Scholar] [CrossRef]
  54. Kominoski, J.S.; Shah, J.J.F.; Canhoto, C.; Fischer, D.G.; Giling, D.P.; González, E.; Griffiths, N.A.; Larrãnaga, A.; LeRoy, C.J.; Mineau, M.M.; et al. Forecasting functional implications of global changes in riparian plant communities. Front. Ecol. Environ. 2013, 11, 423–432. [Google Scholar] [CrossRef]
  55. Flanagan, N.E.; Richardson, C.J.; Ho, M. Connecting differential responses of native and invasive riparian plants to climate change and environmental alteration. Ecol. Appl. 2015, 25, 753–767. [Google Scholar] [CrossRef]
  56. Pearson, R.G.; Dawson, T.P. Predicting the impacts of climate change on the distribution of species: Are bioclimate envelope models useful? Glob. Ecol. Biogeogr. 2003, 12, 361–371. [Google Scholar] [CrossRef]
  57. Braunisch, L.; Coppes, J.; Arlettaz, R.; Suchant, R.; Schmid, H.; Bollmann, K. Selecting from correlated climate variables: A major source of uncertainty for predicting species distributions under climate change. Ecography 2013, 36, 971–983. [Google Scholar] [CrossRef]
  58. Proffit, M.; Lapeyre, B.; Buatois, B.; Deng, X.X.; Arnal, P.; Gouzerh, F.; Carrasco, D.; Hossaert-McKey, M. Chemical signal is in the blend: Bases of plant-pollinator encounter in a highly specialized interaction. Sci. Rep. 2020, 10, 10071. [Google Scholar] [CrossRef] [PubMed]
  59. Qin, A.; Liu, B.; Guo, Q.; Bussmann, R.W.; Ma, F.; Jian, Z.; Xu, G.; Pei, S. Maxent modeling for predicting impacts of climate change on the potential distribution of Thuja sutchuensis Franch., an extremely endangered conifer from southwestern China. Glob. Ecol. Conserv. 2017, 10, 139–146. [Google Scholar] [CrossRef]
  60. Qin, A.; Jin, K.; Batsaikhun, M.E.; Nyamjav, J.; Li, G.; Li, J.; Xue, Y.; Sun, G.; Wu, L.; Indree, T.; et al. Predicting the current and future suitable habitats of the main dietary plants of the Gobi Bear using Maxent modeling. Glob. Ecol. Conserv. 2020, 22, e01032. [Google Scholar] [CrossRef]
  61. Prayoon, U.; Suksavate, W.; Chaiyes, A.; Winitpornsawan, S.; Tunhikorn, S.; Faengbubpha, K.; Angkaew, C.; Pattanakiat, S.; Duengkae, P. Past, present and future habitat suitable for gaur (Bos gaurus) in Thailand. Agric. Nat. Resour. 2021, 55, 743–756. [Google Scholar]
  62. Valencia-Rodríguez, D.; Jiménez-Segura, L.; Rogéliz, C.A.; Parra, J.L. Ecological niche modeling as an effective tool to predict the distribution of freshwater organisms: The case of the Sabaleta Brycon henni (Eigenmann, 1913). PLoS ONE 2021, 16, e0247876. [Google Scholar] [CrossRef] [PubMed]
Figure 1. Study area covering habitat of F. squamosa and F. heterostyla.
Forests 13 01420 g001
Figure 2. From past to current (red areas indicate areas previously suitable and lost by the present period) and from current to future (red areas indicate areas currently suitable which will be lost), the expanded and contracted range of F. squamosa. (A) Last Glacial Maximum (LGM), (B) Mid-Holocene, (C) future (RCP 2.6 2050), (D) future (RCP 2.6 2070), (E) future (RCP 8.5 2050), and (F) future (RCP 8.5 2070).
Forests 13 01420 g002
Figure 3. From past to current (red areas indicate areas previously suitable and lost by the present period) and from current to future (red areas indicate areas currently suitable which will be lost), the expanded and contracted range of F. heterostyla. (A) Last Glacial Maximum (LGM), (B) Mid-Holocene, (C) future (RCP 2.6 2050), (D) future (RCP 2.6 2070), (E) future (RCP 8.5 2050), and (F) future (RCP 8.5 2070).
Forests 13 01420 g003
Figure 4. Overlapping maps of F. squamosa and F. heterostyla for current period and future. Gray refers to unsuitable areas for both species; yellow refers to areas only suitable for F. squamosa; blue refers to areas only suitable for F. heterostyla; green refers to areas suitable for both species. (A) Current, (B) future (RCP 2.6 2050), (C) future (RCP 2.6 2070), (D) future (RCP 8.5 2050), and (E) future (RCP 8.5 2070).
Forests 13 01420 g004
Table 1. Environmental variables selected for modeling.
CategoryVariableAbbreviationSource
Soil variablesBulk density *bdod *SoilGrids250m
Cation exchange capacity (at pH 7)cec
Coarse fragments cfvo
Clay content *clay *
Nitrogennitrogen
Organic carbon density *ocd *
Soil organic carbon stockocs
Soil pHph
Sand *sand *
Silt *silt *
Soil organic carbonsoc
Habitat variablesTree height *canopy *[40,41]
Forest covercover
Bioclimatic variablesAnnual mean temperature *bio1 *WORLDCLIM
Mean diurnal range (mean of monthly (max temp − min temp))bio2
Isothermality (BIO2/BIO7) (×100)bio3
Temperature seasonality (standard deviation ×100)bio4
Max temperature of warmest month *bio5 *
Min temperature of coldest month *bio6 *
Temperature annual range (BIO5–BIO6)bio7
Mean temperature of wettest quarterbio8
Mean temperature of driest quarterbio9
Mean temperature of warmest quarter *bio10 *
Mean temperature of coldest quarter *bio11 *
Annual precipitationbio12
Precipitation of wettest month *bio13 *
Precipitation of driest month *bio14 *
Precipitation seasonality (coefficient of variation)bio15
Precipitation of wettest quarter *bio16 *
Precipitation of driest quarterbio17
Precipitation of warmest quarterbio18 *
Precipitation of coldest quarter *bio19 *
* Variables excluded in final model simulation.
Table 2. Percentage contribution and permutation importance of environmental variables in predicting species distribution.
AbbreviationVariable DefinitionFicus squamosaFicus heterostyla
Contribution (%)PermutationContribution (%)Permutation
cecCation exchange capacity (at pH 7)10.913.41.31.3
cfvoCoarse fragments4.933.12.4
nitrogenNitrogen0.20.54.84.7
ocsSoil organic carbon stock0.73.51.32.2
phSoil pH 3.52.910.7
socSoil organic carbon0.80.91.91.4
coverForest cover0.30.67.33.8
bio2Mean diurnal range (mean of monthly (max temp − min temp))33.940.51.21.6
bio3Isothermality (BIO2/BIO7) (×100)17.407.61
bio4Temperature seasonality (standard deviation ×100)5.49.623.640.9
bio7Temperature annual range (BIO5–BIO6)5.30.517.80.6
bio8Mean temperature of wettest quarter3.24.20.10.8
bio9Mean temperature of driest quarter1.31.93.90.6
bio12Annual precipitation2.8110.30.1
bio15Precipitation seasonality (coefficient of variation)3.62.28.90.7
bio17Precipitation of driest quarter5.85.415.837.5
Note: Variables with more than 5% contribution and permutation are highlighted in bold.
Table 3. Bioclimatic ranges for F. squamosa and F. heterostyla. Key factors are noted in bold.
Environmental VariableF. squamosaF. heterostyla
Suitable RangesMost Suitable ValueSuitable RangesMost Suitable Value
Mean diurnal range (°C)>9.6912.04>3.5312.04
Isothermality43.47–74.9751.4846.97–78.9258.40
Temperature seasonality (C of V)10.29–48.8224.686.24–37.5814.56
Temperature annual range (°C)14.56–27.5021.999.92–23.4315.30
Mean temperature of wettest quarter (°C)14.29–29.4325.64>18.8525.86
Mean temperature of driest quarter (°C)3.90–28.4622.07>15.0521.70
Annual precipitation (mm)<2525.671 129.60>905.74\
Precipitation seasonality (C of V)0.49–1.190.780.57–1.220.76
Precipitation of driest quarter (mm)8.06–161.5237.0620.46–132.1737.65
Table 4. Ecological niche overlap of suitable habitat between F. squamosa and F. heterostyla in current, RCP 2.6 2050, RCP 2.62070, RCP 8.5 2050, and RCP 8.5 2070 periods, as indicated by equivalence (D) and similarity (I) parameters.
Niche OverlapSchoener’s Parameter (D)Hellinger’s-Based Parameter (I)
Current epoch0.70300.9253
RCP2.6 20500.71680.9332
RCP2.6 20700.69790.9259
RCP8.5 20500.73360.9376
RCP8.5 20700.79410.9625
Table 5. The percentage of suitable habitats in the study area for F. squamosa and F. heterostyla in different periods.
SpeciesArea (%)
LGMMidCurrentRCP 2.6 2050RCP 2.6 2070RCP 8.5 2050RCP 8.5 2070
F. squamosa31.76%7.80%12.49%10.28%9.10%12.34%17.69%
F. heterostyla29.97%16.54%18.91%17.37%17.49%12.71%19.11%
OverlapN.D.N.D.7.57%7.09%6.43%6.55%12.05%
Publisher’s Note: MDPI stays neutral with regard to jurisdictional claims in published maps and institutional affiliations.

