Abstract
The carbon sequestration potential of exotics might be considered as one of the several alternatives for forest adaptation to climate change. The results presented here demonstrate that exotic larches’ (Larix spp.) growth rates for both carbon accumulation and traditional forest products exceed those of both natural regeneration and other planted species when planted on a good site in Maine. Recent re-measurement of a species-site trial established in 1988 represents the 34th growing season. Species included Black Spruce (BS) (Picea mariana Mill.), European larch (EL) (Larix decidua Mill.), hybrid larch (HL) (L. x marschelensi), Japanese larch (JL) (L. kaempferi (Lam.) Carrière), Jack pine (JP) (Pinus banksiana Lamb.), Red pine (RP) (Pinus resinosa Ait.), Tamarack (TL) (L. larcinia (Du Roi) K. Koch), and White spruce (WS)(Picea glauca (Moench) Voss). All three of the exotic larches outgrew the other species. Hybrid larch had over nearly twice the merchantable volume (m3 ha−1) and over three times the sawlog volume (green tonnes ha−1) than Red pine. Hybrid larch had the highest growth rate at age 34, over 20 m3 per hectare per year (nearly 3.3 cords ac−1 year−1 or 6.8 tons−1 acre−1 year−1). The other two exotic larches are growing at over 19 m3 ha−1 year−1 (3 cords acre−1 year−1 or 6.4 tons acre−1 year−1). Converting these growth rates to accumulation of CO2eq over the 34-year period produces stunning contrasts compared to native species. Over the 34-year period, larch hybrids sequestered 2.4 times as much CO2eq as the untreated plots (444 vs. 186 tonnes−1 ha−1). We discuss practical implications for forest management and carbon policies.
1. Introduction
Global forests are the only large carbon sink that humanity has in its grasp to mitigate carbon accumulation in the atmosphere. Forest management is a well-understood mechanism for providing humanity’s needs for fiber, fuel, and food. Forest carbon sequestration results are available from several management schemes ranging from reserves to managing high stocking while maintaining production [1]. One potential scheme is planting exotic species that exceed indigenous species in their ability to sequester carbon.
Foresters, biologists, and horticulturists have planted exotic species to understand their characteristics and potential uses. Espinoza and Gonzalez [2] identified five benefits for using exotic species:
- Where indigenous species do not provide the type, quantity, or quality of forest products.
- Generally, exotic species have higher growth rates than native species.
- Exotic species used in forestry plantations can grow in poor sites with better yield than indigenous species.
- Exotic species can usually adapt to different environmental conditions.
- Exotic species could be used as a source of different types of products and so reduce the pressure on native species.
Perhaps the most famous use of exotic tree species is the Monterey Pine (Pinus radiata D. Don) in New Zealand. Numerous other studies have shown how exotic tree species can provide greater wood fiber productivity compared to local tree species [3,4,5]. Miller [6] found that poplar (Populus spp.) hybrids grown under intensive forest management exceeded natural regeneration stands in producing fiber for biomass and may be effective for rapidly sequestering carbon. Ciccarese et al. [7] suggested that short-rotation plantations offer a double-positive input by providing feed-stocks for bioenergy to displace fossil fuel use while storing carbon in biomass and soil. In this paper, we explore the use of exotics to increase carbon sequestration rapidly. This research strengthens arguments made elsewhere [8].
This paper reports on the results of a 1988 species-site trial established to determine the growth, value, and use of conifer plantations in central Maine. A key purpose of planting these plantations was to offset a predicted shortfall in fiber production following losses due to a widespread insect infestation, eastern spruce budworm (Choristoneura fumiferana). Otherwise, plantation establishment in Maine has had a limited and spotty history, because most native species naturally regenerate well. This trial was not established to examine carbon sequestration; however, we have re-evaluated the data to identify tree growth and carbon accumulation patterns that we use to draw significant conclusions about how these exotics accumulate carbon. We primarily address biomass carbon accumulation and have not evaluated soil carbon or carbon in down and dead trees. We know of no other such trial anywhere in the northeast with such a range of species, replication, duration, and history of repeated re-measurement. The area has had no management activity since the initial planting.
2. Materials and Methods
This study was part of a larger randomized complete block design on three previously forested sites to determine growth and development of planted conifers over a range of site qualities. (Location of sites on shown in Figure 1, named for the township in which they reside; Lily Bay (LB), Chase Stream (CS), Brighton Plantation (BP).) The Chase Stream Study reported here was one of three sites selected by Carl Haag on Scott Paper Company land in 1988 to determine the relationship between planted tree species response and site quality [9]. The other two sites (Brighton Plantation (BP) and Lily Bay (LB)) have since been harvested and are no longer available for study. This site was fully measured at ages 5, 10, 16, partially measured at age 20, fully measured at age 27 and again fully measured in 2021 at age 34.
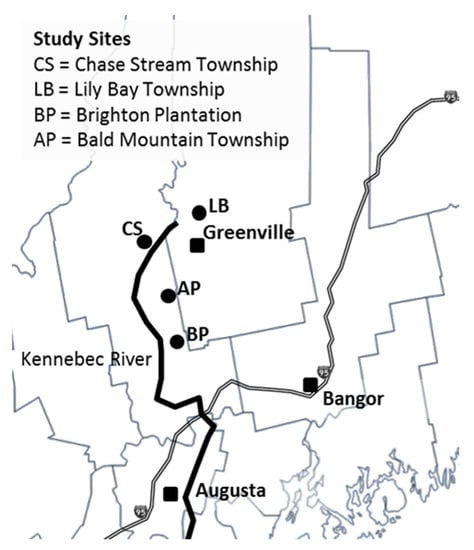
Figure 1.
Study sites in central Maine, USA. Maine counties are shown along with the cities of Augusta and Bangor along Interstate 95. The three sites were designated as Chase Stream (CS on the map), Lily Bay (LB on the map), and Brighton Plantation (BP on the map). A comparison site described later is Austin Pond (AP on the map).
The Chase Stream site is located on a north-facing slope at an elevation of about 380 m (1250 feet). The soils are of the Telos-Chesuncook-Elliotsville Association and are well- and moderately-well drained to a maximum depth of 100 cm (43 inches). The site was likely clearcut in 1985 or 1986 and treated with glyphosate or glyphosate-sulfmeturon mixture in 1987 to reduce competition with native broad-leaved tree species and other vegetation (for more information on site quality, see Gilmore et al. [10]).
At Chase Stream, a total of 49 blocks at 16.5 m (54 feet) by 16.5 m (54 feet) (0.0669421 acres or 0.027 hectares) were laid out. Of these, 39 were planted. It is presumed that the remaining 10 were not planted due to surface rocks. Eight species were planted with different seed sources and stock types. Species included were European larch, Japanese larch, Tamarack, Hybrid larch, White and Black spruce, Jack and Red pine. With different seed sources and planting stock, there were 13 different combinations. These were planted in 3 replications, making 39 planted plots (see Maass [9] for further details).
The planted plots had six rows of 6 trees or 36 total trees in each plot. The outside row of trees on all sides was considered to be a border. The inner test block consisted of four rows of 4 trees or 16 trees. At 2.7 m (9 feet) by 2.7 m (9 feet) spacing, the plot size was 0.012 hectares (0.02975 acres). It is these test blocks that we report on in this paper.
In 2021, 34 growing seasons after planting, we identified each planted tree by block and tree number. Because of our interest in carbon sequestration by exotics, all living and standing dead planted trees were tallied. We tallied trees forked below breast height as separate trees. We measured diameter to breast height (dbh) to the nearest 0.1 inches (0.25 cm) using a diameter tape. Height was measured using Haglof and Suunto Clinometers to the nearest 0.03 m (0.1 feet). Suunto Clinometers were used when the Haglof Clinometers were not functioning.
In growth and yield studies similar to this, non-planted control blocks are typically not examined or included in the analysis. On other sites planted next to exotic larches, we observed that the adjacent naturally regenerated sites were inferior in growth of desirable species. For this study, to quantify what was apparent, we measured trees in three unplanted blocks. In the “outblocks”, all trees at least 4 inches (10.2 cm) dbh or larger were recorded within the 16.5 m (54 feet) by 16.5 m (54 feet) blocks. These outblocks cannot be strictly considered control blocks. However, the data gathered from them provide insight. No accommodation was made for the shadow effect from adjacent plots.
All volumes were calculated using Kozak taper equations following a macro developed by Li et al. [11]. Merchantable volume was measured above a 0.15 m (6 inch) stump to a 9 cm (3 inch) top diameter. Sawlog volume and weight were calculated for trees 9.0 inches (23 cm) dbh and larger to a 12.7 cm (5 inch) top. Topwood was calculated between the 12.7 cm (5 inch) and 9 cm (3 inch) top. Pulpwood was calculated for trees with diameters less than 23 cm (9 inches). For related methods, see Gilmore et al. [12].
Survival, height, diameter, and volumes for each species were compared using MS Excel one-way ANOVAs using an alpha of 0.01 (α = 0.01).
MTCO2eq estimation: A MS Excel spreadsheet using diameter distribution was used to generate estimates of green tons of carbon acre−1 for the eight species sampled (see Appendix B). This spreadsheet used the composite formulas estimating green tons of carbon acre−1 that were derived for 6 species groups [13]. The green tons estimate was then recalculated to produce MTCO2eq ha−1 estimates (multiplying green tons acre−1 times 2.47 hectares acre−1 times 0.91 Mtonnes ton−1 times 44 mass of CO2eq 12 mass of carbon−1). Assignments to groups were as follows: the four larch species (European, Hybrid, Japanese, and Tamarack) to the Cedar/Larch group, Jack and Red pine to the Pine group, and Black and White spruce to the Spruce/Fir group. We calculated average tree component estimates for the following pieces: stem wood, bark, bole (arithmetic sum of stem wood and bark), foliage, tops and branches, total aboveground (arithmetic sum of bole, foliage, and tops and branches), coarse roots, and total above and below ground (arithmetic sum of total aboveground and coarse roots).
3. Results
Survival: Percent survival of the original 16 test plot trees in each block (forks not included) is shown in Figure 2. Survival through age 27 of 80% or higher for all species was considered acceptable for further analysis. At age 27, there was no significant difference in survival between the species (α = 0.01). Only in the last measurement did we see a decline in the spruces. At age 34, only Black spruce had a significantly lower survival (α = 0.01) than the other species.
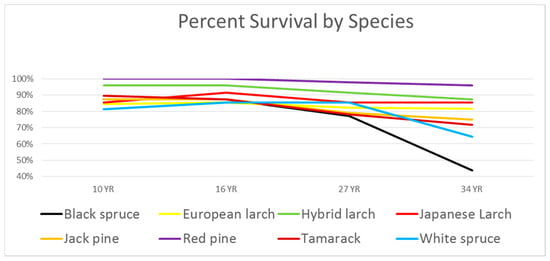
Figure 2.
Percent survival of single test plot trees.
Table 1 shows the number of dead trees between ages 27 and 34. Only Japanese larch experienced no mortality between these two measurements. Black spruce and White spruce show a downturn at age 34. We believe that this is due to overtopping of these species by adjacent taller trees. One of the three black spruce blocks is surrounded on four sides by exotic larch, and 10 of its 16 test plot trees died between ages 27 and 34. An average of 3 out of 16 White spruce trees died, as well.

Table 1.
Number of dead trees between ages 27 and 34 in the test plots.
The number of forked trees differed by species, with Tamarack and White spruce having the most (Table 2). It is not clear what the reason is for the forked trees, perhaps animal predation or a late spring frost. By tallying the volume of the fork trees in the last measurement, some additional volume was added compared to the previous measurements.
Table 2.
Number of forked trees tallied in the 2021 measurement for the first time within the test blocks.
Volume-related Tree Attributes: The three exotics had the tallest (and statistically very similar) average height (Figure 3 and Table 3). The exotics differed in QMD, but were not statistically different. Tamarack and Red pine were not statistically different in either height or QMD. Tamarack surpassed the spruces in both height and QMD at age 34 and was significantly taller and larger. Black and white spruce showed the lowest height and QMD increment. Interestingly, the average height and QMD for the outblocks were higher than either of the spruces, but not statistically different. In the spruce blocks, the planted trees were of low vigor, poor survival, and virtually all were overtopped by the surrounding blocks.
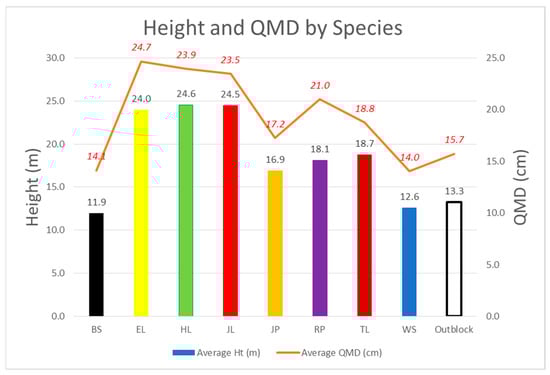
Figure 3.
34-year average height and quadratic mean diameter (QMD). Bars and black data labels indicate height and the orange line with red italicized numbers indicates QMD for each species.
Table 3.
Mean Height (m) and QMD (cm) and groupings by significance (α = 0.01).
Volume calculations (green tons ha−1) are based on both height and diameter measurements. The three exotic larches, particularly the hybrid larch, performed much better than the other species (Figure 4 and Table 4). The hybrid larch had more than twice the volume of Red pine, while European larch had 75% and Japanese larch had 65% more volume than Red pine. Remarkably, the naturally regenerated outblocks had more merchantable volume than either of the spruces.
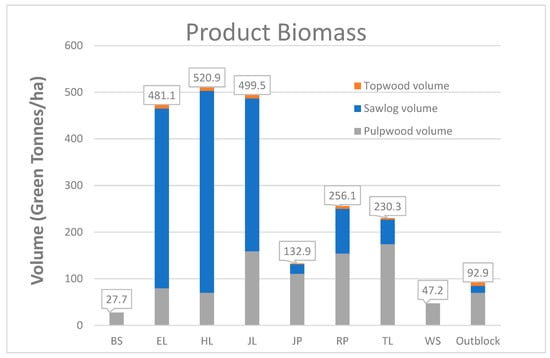
Figure 4.
Merchantable green tonnes per hectare of weight by product class.
Table 4.
List of species by Merchantable green tonnes per hectare.
Statistically, there were four groups (Table 4). The means of three exotics were not different from one another (Table 4) and all were significantly greater than the other species. The means of Tamarack and Red pine were next and not significantly different. The means of Jack pine and the outblocks were significantly different from and greater than the spruces.
Examining green tons per hectare by product classes, the exotic larches have most of the weight in sawlog size classes (Figure 4). Among Red pine and Tamarack, green weight is roughly 50/50 sawlogs and pulp. For Jack pine, the spruces, and the outblocks, the preponderance of the weight was in pulpwood. As noted in Table 1, there was no mortality in Japanese larch, and dead trees were not tallied in the outblocks.
Mean Annual Increment Trends: Mean Annual Increment trends for all the species over time are indicative of future growth trends (Figure 5). As we expected, the hybrid larch is growing the best and appears to be continuing to grow quite well. The other two exotic larch species follow similar growth trends. Red pine is growing the best of the non-exotics and is successful at 11.2 m−3 ha−1 year −1 (1.9 cords ac−1 year−1). Remarkably, tamarack continues to grow well and may not have reached its full potential at age 34. However, this is due in part to the inclusion of forked trees at the last measurement. The two spruces are last and appear to be declining in growth at this measurement, which is expected as they are suppressed by overtopping adjacent plots and are experiencing substantial mortality.
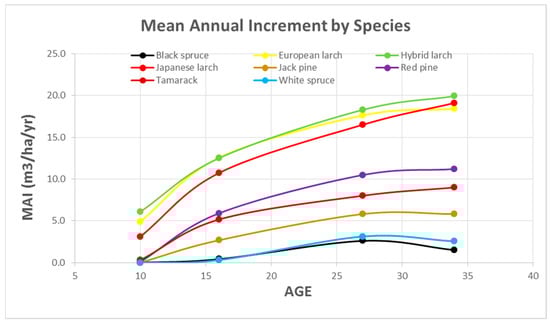
Figure 5.
Mean Annual Increment of planted species.
In the naturally regenerated outblocks, balsam fir (Abies balsamea (L.) Mill.), white birch (Betula papyrifera Marsh.), quaking aspen (Populus tremuloides Michx.), and red maple (Acer rubrum L.) made up the preponderance of the trees on these plots. Several balsam fir and quaking aspen grew to reach sawlog size class (23+ cm) (Figure 6).
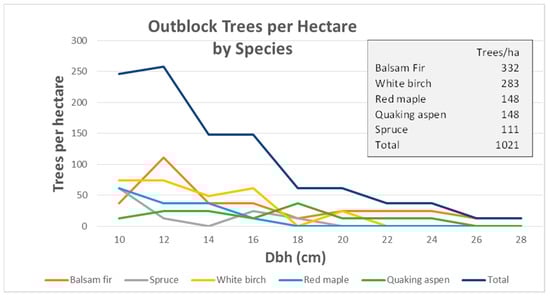
Figure 6.
Outblock trees per hectare by Species and diameter at breast height (cm).
We compare stocking rates and growth as calculated by mean and periodic annual increment (MAI and PAI) (Table 5). Growth by the exotic larches and Red pine continues at high rates despite high stocking. MAI and PAI for the two spruces demonstrate that these species are in decline.
Table 5.
List of basal area and incremental growth by species.
Tree Carbon Dioxide equivalence: Shown as CO2 equivalence (Figure 7 based on statistically significant data shown in Table 4), the results show that exotic larches sequester more CO2eq than other species, with the hybrid taking the lead at nearly 460 MTonnes of CO2e ha−1 over the 34-year period. (The spreadsheet showing the calculated values is in Appendix A). Red pine accumulated 376 Mtonnes. Tamarack, the native larch, accumulated nearly 195 MTonnes. The outblocks, with measuring trees just 10.2 cm and larger at dbh, have accumulated nearly 187 Mtonnes in the 34 years since plantation establishment. By comparison, the Maine state-wide average is 204 MTonnes ha−1 for above and belowground tree carbon on timberland (from FIA data (USDA Forest Service [14]) calculating 25 tons acre−1 × 2.47 acres ha−1 × 0.91 Mtonnes ton−1 × 44 mass of CO2eq 12 mass of carbon−1).
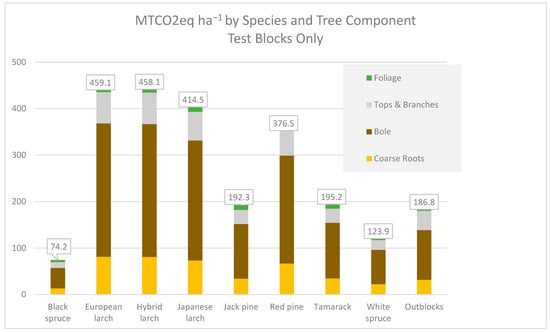
Figure 7.
Above and Below Ground CO2eq in Metric tonnes per hectare.
4. Discussion
In this trial, at age 34, exotic larches are much greater in height, diameter, and have much more volume than other planted species. Hybrid larch exceeded both European and Japanese larch, but there was no statistically significant difference between the three species. Additionally, Red pine outgrew Jack pine and the two spruce species. Non-planted blocks accumulated volume and carbon better than either of the two spruces. An unanticipated result is that the native Tamarack grew better than the spruces on this site. Landowners who are averse to planting exotics might consider this native species.
In this paper, we have documented important growth comparisons; exactly how this more rapid growth should be credited to either CO2 reduction goals or marketing as carbon credits is a totally different and difficult subject which we do not address here.
We compare these volumes to both managed and unmanaged spruce-fir production on a nearby study area. The Austin Pond (AP on the map) (in Bald Mountain Township, ME) study was established to examine the growth and development of naturally regenerated spruce-fir stands using chemical release alone and in combination with pre-commercial thinning treatments [15] (Table 3, p. 390). Bataineh states that merchantable volume ranged from 70.6 m3 ha−1 for un-thinned and untreated control to 99.7 m m3 ha−1 for glyphosate-triclopyr thinned treatment after 33 years following treatment. The merchantable volume in this species-site trial ranges from 9 m3 ha−1 for the black spruce to 306 m m3 ha−1 for European larch and 386 m3 ha−1 for the hybrid larch after 34 years. Further, a widely used synthesis report [16] (p. 49) shows northeastern regional averages for northern hardwoods of 72.8 m3 ha−1 at age 35. While site differences likely account for some of the growth differences, our results clearly indicate that exotic species can potentially exceed the volume and carbon growth of native species.
Graphing the comparison of the results of this study to other studies demonstrates the greater volume (and therefore greater biomass and carbon sequestration) of the exotics in a fewer number of years (Figure 8).
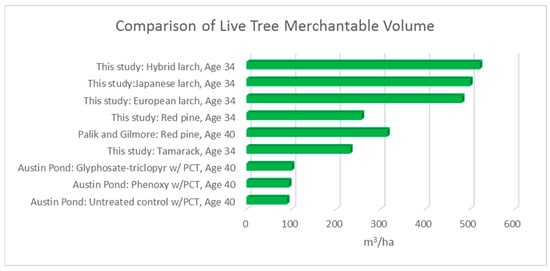
Figure 8.
Comparison of merchantable volume (m3 ha−1), this study and others.
Red pine growth reported here is not quite as good as the Red pine in the Lake States region at 7.8 m3 ha−1 year−1 (44.8 cunits for site index of 75 at age 40 for 180 square feet per acre of basal area) [17] (p. 49).
The 2021 observation indicates that regeneration under the spruces and pines consisted of ferns and grasses, while under the exotic larches, sugar maple (Acer saccharum Marsh.) regeneration is abundant. Similarly, in the 2014 measurement, the field crew observed that the site had a preponderance of sugar maple in the understory at that time (Figure 9 and Figure 10). Detailed analysis of the understory under the various plantation regimes needs to be done. The findings and their implications should be discussed in the broadest context possible. Future research directions may also be highlighted.
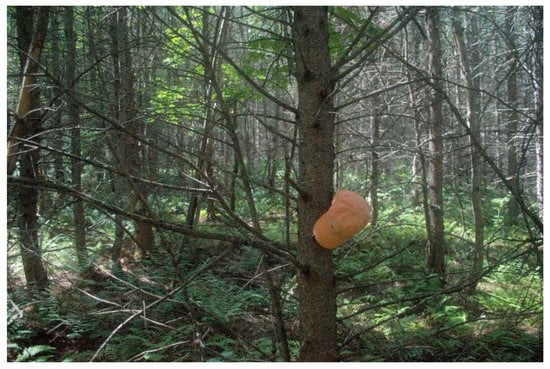
Figure 9.
Understory below spruce plots largely consists of ferns. David Maass photo.
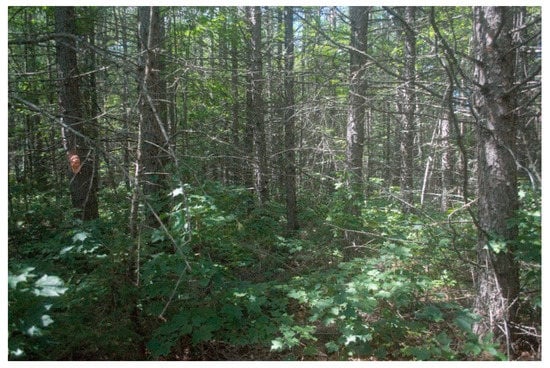
Figure 10.
Understory below larch plots is largely sugar maple. David Maass photo.
We also see that these reported volumes are not unique to this particular study. We have data from over 100 different sampled stands (Figure 11), some of which come from Gilmore [18] in Maine and northern New Hampshire. Mean annual increment (MAI) can range widely from just 5 to nearly 25 m3 ha−1 year−1. The average for the exotics is over 10 m3 ha−1 year−1, however for tamarack it is under 7 m3 ha−1 year−1. Gilmore et al. [10] discussed stocking standards for European larch.
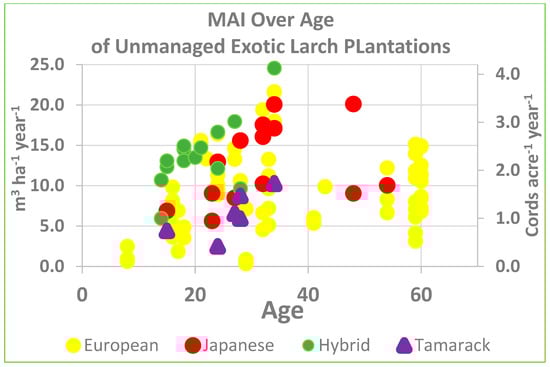
Figure 11.
Mean Annual Increment (MAI) of Exotic Larch Plantations in Maine.
Other examples of growth rates of exotic larches are shown below in Appendix A (Table A1, Table A2 and Table A3).
Exotic larches have been planted since the 1850s [19]. The oldest plantation of which we are aware is on the Marsh-Billings-Rockefeller National Historic Park in Woodstock, VT, planted in 1887. Decades of documented experience exist in New York [20,21]; Pennsylvania [22]; New Hampshire [23]; Eastern Canada [24,25]; for earlier literature on eastern North America, see Hunt [26]; Genys [27]; Jeffers and Isebrands [28]; Jacobs [29]; Carter et al. [30]; Carter and Maass [31]; Gerlach [32]; for Sweden, see Eko et al. [33].
Based on what we provide here, we conclude that exotic larches provide rapid and sustained carbon sequestration superior to that of many native species. Carbon accumulation is rapid for all of the larix species, including native tamarack. At age 34, these species exceed the carbon accumulation of native naturally regenerated species. We have to ask if there is a place for these species in any state-wide carbon policy.
We suggest that plantations of these species might be used as a short-term measure until state-wide carbon goals are reached. We recognize the need for native species and habitats as a long-term goal for policy. In fact, Hua et al. [34] found that natural systems offer benefits beyond plantations. For more information on rates and drivers for monoculture plantations, see Bukoski [35].
The quickest increase in carbon sequestration is through afforestation. To that end, we examine what increases might be accomplished if non-forested sites were planted with exotic larch. The Natural Resources Inventory [36] dataset published for the United States Department of Agriculture shows 593,000 hectares (1.466 million acres) in uncultivated and other rural land categories in Maine, New Hampshire, and Vermont. Suppose it would be possible to encourage landowners to plant half of this land with exotic larches. In 35 years, that land would sequester 123 million MTonnes of CO2eq (using 415 MTonnes CO2eq ha−1 from for Japanese Larch in Figure 7). Over those 34 years, that land base could accumulate 3.62 million Mtonnes annually. According to the EPA [37], a typical passenger vehicle emits 4.6 Mtonnes of CO2eq each year. Thus, sequestration in this land base would be equivalent to the CO2 of 786,750 passenger vehicles each year, surpassing the number of registered passenger vehicles in the three states.
Because of rapid growth and early production of harvestable timber, the economics of planting larch are favorable, as discussed recently [38,39]. Early bud break and rapid spring-time growth is responsible for the rapid stand development [40]. Furthermore, larch species are rot-resistant and are suitable for durable wood products, unlike other fast-growing species of aspen or willow, and thus offer superior long-term carbon storage.
An important point is that virtually all of the measurements noted here are in unmanaged stands. If under management, many would have been thinned long ago. Initial work, as well as our observations in the field, suggests that thinnings and stocking level control would significantly improve value growth and stand vigor [38,41,42].
To be clear, we have not examined soil carbon or the carbon flux with dead and dying trees. These are important components of the forest carbon taken as a whole. This study was not established to address these critical components. We may be able to address these issues later.
For private landowners, exotic larch might be considered to rehabilitate or replace degraded and/or beech-dominated stands. The early thinnings possibly as soon as age 15 can provide short-term income. Later income can be derived from later thinnings and returning the degraded forest to a more productive forest with desirable shade-tolerant species of maple, oak, or spruce. We have shown in the pictures above that the exotics allow for understory sugar maple to become established.
A major concern for exotic species is the risk that they may become invasive [2,43]. Anecdotally, we have witnessed volunteer larch regeneration becoming established on exposed mineral soil and gravel pits. However, because these species are shade intolerant, there is a lower likelihood that they will survive competition. Despite their being established across the northern US and eastern Canada [38], we have encountered limited literature regarding these species becoming invasive [44]. Additionally, the native tamarack performed better than other more widely planted species at least through age 34. If exotics are a concern because they could be invasive or for other reasons, landowners could consider tamarack.
There is concern that the exotics might hybridize with the native tamarack. In a genetics trial, the researchers tried to establish a European larch–tamarack hybrid [45,46,47]. They found that due to the very different timing of pollination and fertilization of the two species, it was very difficult to cross with low seed set and maturation even in a greenhouse environment. This suggests that any wild cross would likely fail. There are areas of the northeast where future conifer stocking is a concern. Anywhere tall conifers confer some habitat or aesthetic advantage would have the potential for using these larches.
This work suggests that there is value in exploring a number of related topics, including potential for use in restoration of heavily cut sites, habitat values, other nontimber resource benefits and impacts, and understanding why understories in the larch plots differ so markedly from the other conifers (on this question, see Royer-Tardif et al. [48]). As widespread deployment of planted larches is imminent, there is time for exploring these and other issues.
5. Conclusions
Emerging research is now arguing that carbon sequestration is becoming more and more urgent, with early action necessary. This research shows that plantations of exotic larches can boost carbon storage within the widely used 2050 period often stated for carbon goals.
- After clearcutting on good sites, exotic larches far outperform natural regrowth, as well as commonly planted conifers, in terms of merchantable volume as well as carbon storage over 34 years.
- Other work shows that due to rapid growth and early availability of merchantable wood, economic results for planting these species are favorable for many landowners.
- Larches seem to have a neutral to favorable effect in understories compared to other planted conifers.
- Monoculture plantings are far from the only potential applications of these species.
- Research on various potential impacts of larch plantings on soils, habitat, and other values is warranted.
Author Contributions
D.I.M.: conceptualization, data curation, writing—original draft, writing—review & editing. K.M.L.: software; writing—original draft, writing—review & editing. All authors have read and agreed to the published version of the manuscript.
Funding
Field work conducted in 2021 was funded privately in part by Juglans 14 LP.
Institutional Review Board Statement
Not applicable.
Informed Consent Statement
Not applicable.
Data Availability Statement
Data is available from the principal author.
Acknowledgments
First: we acknowledge Carl Haag for the forethought and design of the project, as well as the early measurements. Lloyd Irland assisted with measurements and editorial advice. Next, we thank Weyerhaeuser for allowing us access to the site and permission to use the data. We also want to recognize Brian Roth formerly with University of Maine, Cooperative Forest Research Unit and his students for the 2014 re-measurement. Lastly, we thank the volunteers who helped with the 2021 re-measurement, namely Andy Maass, Victoria Jofery, and Dave Welbourn, as well as staff from the New York DEC who assisted with the New York measurements reported here. We thank Justin Waskiewicz at Paul Smith’s College and Andrew Whitman at Manomet for their helpful review on the manuscript.
Conflicts of Interest
The authors declare no conflict of interest.
Appendix A
Table A1.
Jericho Forest in Vermont, age 75.
Table A1.
Jericho Forest in Vermont, age 75.
| From University of Vermont Jericho Forest |
|---|
|
|
Source: [49].
Table A2.
Larch stands at Fox Forest, New Hampshire, age 62.
Table A2.
Larch stands at Fox Forest, New Hampshire, age 62.
| Pine Glen | Per Year | No. Trees | Bible Hill | Per Year | No. Trees | |
|---|---|---|---|---|---|---|
| Dbh cm | 297 | 0.48 | 48 | 34.5 | 0.56 | 53 |
| Ht m | 25.9 | 0.42 | 48 | 31.7 | 0.52 | 5 |
Source: [50].
Table A3.
Larch stands at Winona State Forest, New York (measured 2021).
Table A3.
Larch stands at Winona State Forest, New York (measured 2021).
| Stand | Age | No. Plots | Ave dbh cm | Per year | Height m | Per Year |
|---|---|---|---|---|---|---|
| 1 | 72 | 1 | 46.5 | 0.65 | 28.06 | 0.39 |
| 2 | 68 | 1 | 56.8 | 0.83 | 29.59 | 0.44 |
| 3 | 71 | 3 | 41.2 | 0.58 | 26.13 | 0.37 |
Source: [51].
Appendix B
| MTCO2e Estimates at Age 34 by Species and Size Class, Test Blocks Only | |||||||||
| derived from Jenkins species groupings and components (GTR NE-319) | |||||||||
| MTonnes CO2 eq ha−1 | |||||||||
| Species | Size Class | Stem Wood | Stem Bark | Bole | Foliage | Tops and Branches | Total Aboveground | Coarse Roots | Total Above and Belowground |
| BS | Sapling | 4.27 | 0.81 | 5.07 | 0.56 | 1.64 | 7.27 | 1.62 | 8.89 |
| Poletimber | 32.84 | 6.11 | 38.95 | 3.70 | 10.91 | 53.57 | 11.72 | 65.29 | |
| Sawtimber | 0.00 | 0.00 | 0.00 | 0.00 | 0.00 | 0.00 | 0.00 | 0.00 | |
| Total | 37.11 | 6.92 | 44.02 | 4.26 | 12.55 | 60.84 | 13.34 | 74.17 | |
| EL | Sapling | 0.93 | 0.18 | 1.11 | 0.12 | 0.36 | 1.59 | 0.35 | 1.94 |
| Poletimber | 151.25 | 27.73 | 178.98 | 14.89 | 43.38 | 237.25 | 51.18 | 288.43 | |
| Sawtimber | 90.29 | 16.44 | 106.73 | 8.32 | 23.92 | 138.97 | 29.77 | 168.73 | |
| Total | 242.47 | 44.35 | 286.82 | 23.33 | 67.66 | 377.81 | 81.30 | 459.11 | |
| HL | Sapling | 3.73 | 0.71 | 4.44 | 0.49 | 1.43 | 6.36 | 1.41 | 7.78 |
| Poletimber | 170.39 | 31.23 | 201.62 | 16.68 | 48.55 | 266.85 | 57.53 | 324.38 | |
| Sawtimber | 67.26 | 12.26 | 79.52 | 6.24 | 17.97 | 103.73 | 22.23 | 125.96 | |
| Total | 241.39 | 44.19 | 285.58 | 23.41 | 67.95 | 376.94 | 81.18 | 458.12 | |
| JL | Sapling | 0.93 | 0.18 | 1.11 | 0.12 | 0.36 | 1.59 | 0.35 | 1.94 |
| Poletimber | 159.31 | 29.24 | 188.55 | 15.82 | 46.12 | 250.49 | 54.08 | 304.57 | |
| Sawtimber | 57.65 | 10.51 | 68.15 | 5.35 | 15.40 | 88.90 | 19.06 | 107.96 | |
| Total | 217.89 | 39.92 | 257.81 | 21.29 | 61.88 | 340.98 | 73.49 | 414.47 | |
| JP | Sapling | 0.00 | 0.00 | 0.00 | 0.00 | 0.00 | 0.00 | 0.00 | 0.00 |
| Poletimber | 98.87 | 18.25 | 117.12 | 10.38 | 30.45 | 157.96 | 34.30 | 192.26 | |
| Sawtimber | 0.00 | 0.00 | 0.00 | 0.00 | 0.00 | 0.00 | 0.00 | 0.00 | |
| Total | 98.87 | 18.25 | 117.12 | 10.38 | 30.45 | 157.96 | 34.30 | 192.26 | |
| RP | Sapling | 0.00 | 0.00 | 0.00 | 0.00 | 0.00 | 0.00 | 0.00 | 0.00 |
| Poletimber | 195.93 | 36.02 | 231.95 | 19.79 | 57.82 | 309.57 | 66.95 | 376.52 | |
| Sawtimber | 0.00 | 0.00 | 0.00 | 0.00 | 0.00 | 0.00 | 0.00 | 0.00 | |
| Total | 195.93 | 36.02 | 231.95 | 19.79 | 57.82 | 309.57 | 66.95 | 376.52 | |
| TL | Sapling | 1.87 | 0.35 | 2.22 | 0.25 | 0.72 | 3.18 | 0.71 | 3.89 |
| Poletimber | 89.51 | 16.50 | 106.01 | 9.27 | 27.15 | 142.43 | 30.88 | 173.31 | |
| Sawtimber | 9.60 | 1.75 | 11.36 | 0.89 | 2.57 | 14.81 | 3.18 | 17.99 | |
| Total | 100.98 | 18.60 | 119.58 | 10.40 | 30.43 | 160.42 | 34.77 | 195.19 | |
| WS | Sapling | 9.60 | 1.81 | 11.41 | 1.26 | 3.69 | 16.36 | 3.64 | 20.00 |
| Poletimber | 52.74 | 9.78 | 62.52 | 5.78 | 16.99 | 85.29 | 18.60 | 103.90 | |
| Sawtimber | 0.00 | 0.00 | 0.00 | 0.00 | 0.00 | 0.00 | 0.00 | 0.00 | |
| Total | 62.34 | 11.59 | 73.93 | 7.04 | 20.68 | 101.65 | 22.24 | 123.89 | |
| Outblocks | Sapling | 12.57 | 2.81 | 15.38 | 1.18 | 8.24 | 24.80 | 5.15 | 29.95 |
| Poletimber | 75.76 | 15.45 | 91.21 | 5.69 | 33.32 | 130.22 | 26.64 | 156.86 | |
| Sawtimber | 0.00 | 0.00 | 0.00 | 0.00 | 0.00 | 0.00 | 0.00 | 0.00 | |
| Total | 88.33 | 18.26 | 106.59 | 6.87 | 41.57 | 155.02 | 31.79 | 186.81 | |
References
- Giffen, A.; Ryan, C.; Brown, S.; Pounch, M. Storing more carbon while enhancing other forest values by improving forest management in the Acadian Forest of New England, USA. Forests 2022, in press. [Google Scholar]
- Espinoza, J.A.; Gonzalez, R.W. Exotic forest plantations. In Forests and Forestry in the Americas: An Encylopedia; Cubbage, F.W., Ed.; Society of American Foresters and International Society of Tropical Foresters; Available online: https://sites.google.com/site/forestryencyclopedia/ (accessed on 18 June 2022).
- Fox, T.R.; Jokela, E.J.; Allen, H.L. The development of pine plantation silviculture in the southern United States. J. For. 2007, 105, 337–347. [Google Scholar]
- Hall, K.B.; Stape, J.L.; Bullock, B.P.; Frederic, D.; Wright, J.; Scolforo, H.F.; Cook, R. A growth and yield model for Eucalyptus benthamii in the southeastern United States. For. Sci. 2020, 66, 25–37. [Google Scholar] [CrossRef]
- Salas, C.; Donoso, P.J.; Vargas, R.; Arriagada, C.A.; Pedraza, R.; Soto, D.P. The forest sector in Chile: An overview and current challenges. J. For. 2016, 114, 562–571. [Google Scholar] [CrossRef]
- Miller, R.O. Forest Biomass Innovation Center Research Report 2017(g). In Short Rotation Fiber Farming in Michigan; Michigan State University: East Lansing, MI, USA, 2017; 13p, Available online: https://www.canr.msu.edu/fbic/uploads/files/2017G.pdf (accessed on 19 June 2022).
- Ciccarese, L.; Pellegrino, P.; Silli, V.; Zanchi, G. Short Rotation Forestry and Methods for Carbon Accounting. A Case Study of Black Locust (Robinia pseudoacacia L.) Plantation in Central Italy; Rapporti 200/2014; ISPRA-Istituto Superiore per la Protezione e la Ricerca Ambientale: Roma, Italy, 2014; 49p, ISBN 978-88-448-0658-3. [Google Scholar]
- Giffen, A.; Maass, D.; Irland, L.C.; Roth, B. Carbon forestry options using exotic larches. In Proceedings of the 8th Eastern CANUSA Forest Science Conference: Understanding and Managing ECANUSA Forests in a Changing Environment, Burlington, VT, USA, 30 September 30–1 October 2016; pp. 41–42. [Google Scholar]
- Maass, D. Ten-Year Conifer Growth Is Used to Determine Site Quality for Plantation Establishment in Central Maine. LVES Research Note #12; Larch Virtual Experimental Station. 11p. 2021. Available online: www.larchresearch.com (accessed on 13 June 2022).
- Gilmore, D.; Briggs, R.D.; Seymour, R.S. Stem volume and site index equations for European larch in Maine. North. J. Appl. For. 1993, 10, 70–74. [Google Scholar] [CrossRef]
- Li, R.; Weiskittel, A.; Dick, A.R.; Kershaw, J.R., Jr.; Seymour, R.S. Regional stem taper equations for eleven conifer species in the Acadian region of North America: Development and assessment. North. J. Appl. For. 2012, 29, 5–14. [Google Scholar] [CrossRef]
- Gilmore, D.; Briggs, R.D.; Seymour, R.S. Identification of low productivity sites for European larch (Larix decidua Miller) in Maine, USA. New For. 1994, 8, 289–297. [Google Scholar] [CrossRef]
- Jenkins, J.C.; Chojnacky, D.C.; Heath, L.S.; Birdsey, R.A. Comprehensive Database of Diameter-Based Biomass Regressions for North American Tree Species; Gen. Tech. Rep. NE-319; USDA Forest Service, Northeastern Research Station: Newtown Square, PA, USA, 2004; p. 45.
- USDA Forest Service. Forest Inventory and Analysis Program, Forest Inventory EVALIDator web-application Version 1.8.0.01; U.S. Department of Agriculture, Forest Service, Northern Research Station: St. Paul, MN, USA. Available online: http://apps.fs.usda.gov/Evalidator/evalidator.jsp (accessed on 12 August 2022).
- Bataineh, M.M.; Wagner, R.G.; Weiskittel, A.R. Long-term response of spruce–fir stands to herbicide and precommercial thinning: Observed and projected growth, yield, and financial returns in central Maine, USA. Can. J. For. Res. 2013, 43, 385–395. [Google Scholar] [CrossRef]
- Smith, J.E.; Heath, L.S.; Skog, K.E.; Birdsey, R.A. Methods for Calculating Forest Ecosystem and Harvested Carbon with Standard Estimates for Forest Types of the United States; Northeastern For. Exp. Sta., Gen. Tech. Rept. NE-343; USDA Forest Service: Newton Square, PA, USA, 2005; 216p.
- Gilmore, D.W.; Palik, B.J. A Revised Managers Handbook for Red Pine in the North Central Region; North Central Research Station, Gen. Tech. Rept. NC-264; USDA Forest Service: St. Paul, MN, USA, 2006; 55p.
- Gilmore, D. Soil-Site Relationships for European Larch (Larix decidua Miller) in Maine. Master’s Thesis, University of Maine, Orono, ME, USA, 1992. [Google Scholar]
- Nyland, R.D. Larch in the town of Bovina. J. For. 1965, 63, 206–208. [Google Scholar]
- Cook, D.B. Planted Larch in New York; Privately Printed: Albany, NY, USA, 1969; 116p. [Google Scholar]
- Stone, E.I. British Yield Tables for European and Japanese Larches in New York; Agronomy Paper 397; Cornell University: Ithaca, NY, USA, 1957; 4p. [Google Scholar]
- Shipman, R.D.; Fairweather, S.E. Yields of Japanese larch plantations in Pennsylvania. North. J. Appl. For. 1989, 6, 78–81. [Google Scholar] [CrossRef]
- Allen, P.H. Growing exotic larch in New Hampshire. For. Notes 1967, 94, 27–29. [Google Scholar]
- Vallee, G.; Stipanic, A. Growth and performance of larch plantations. In Larch Symposium, Potential for the Future; Graham, C.M., Farintosh, F.I., Graham, B.J., Eds.; University of Toronto: Toronto, ON, Canada, 1983; pp. 44–63. [Google Scholar]
- Bailey, R.E.; Neily, P.O. Growth and yield of exotic larch species. In Proceedings 1986 Larch Workshop; New Brunswick Forest Research Advisory Committee: Fredericton, NB, Canada, 1986; pp. 127–135. [Google Scholar]
- Hunt, S.S. European larch in the United States. Harv. For. Bull. 1932, 16. [Google Scholar]
- Genys, J.B. Geographic Variation in European Larch; Bulletin No. 13; New Hampshire Forestry and Recreation Commission: Concord, NH, USA, 1960. [Google Scholar]
- Jeffers, R.M.; Isebrands, J.G. Larch potential for north-central states. In Proceedings of the Central States Forest Tree Improvement Conference; USDA North Central Forest Experiment Station: St. Paul, MN, USA, 1974; Volume 8, pp. 80–85. [Google Scholar]
- Jacobs, R. Growth of Introduced Larches in Wisconsin; University of Wisconsin: Stevens Point, WI, USA, 1983. [Google Scholar]
- Carter, K.K.; Canavera, D.; Caron, P. Early Growth of Exotic Larches at Three Locations in Maine; Cooperative Forestry Research Unit, Research Note 8, MAES Misc. Report 241; University of Maine: Orono, ME, USA, 1981; 7p. [Google Scholar]
- Carter, K.; Maass, D. A Forester’s Guide to Larch in Eastern North America: An Annotated Bibliography; College of Forest Resources, Maine Agricultural Experiment Station, Miscellaneous Report 359; University of Maine: Orono, ME, USA, 1991; 47p. [Google Scholar]
- Gerlach, J.P. A Comparison of Growth Rates and Related Traits for European Larch (Larix decidua Miller) and Red Pine (Pinus resinosa Ait.) across a Site Gradient in the Great Lakes Region. Master’s Thesis, Michigan State University Department of Forestry, East Lansing, MI, USA, 2001; 114p. [Google Scholar]
- Eko, P.M.; Larsson-Stern, M.; Albrektson, A. Growth and yield of hybrid larch (Larix x eurolepis A. Henry) in southern Sweden. Scand. J. For. Res. 2004, 19, 320–328. [Google Scholar] [CrossRef]
- Hua, F.; Bruunzell, L.A.; Meli, P.; Martin, P.A.; Zhang, J.; Hakagawa, S.; Miao, X.; Wang, W.; McEvoy, C.; Pen-arancibia, J.L.; et al. The biodiversity and ecosystem service contributions and trade-offs of forest restoration approaches. Science 2022, 376, 839–844. [Google Scholar] [CrossRef]
- Bukoski, J.J.; Cook-Patton, S.C.; Melikov, C.; Ban, H.; Chen, J.L.; Goldman, E.D.; Harris, N.L.; Potts, M.D. Rates and drivers of aboveground carbon accumulation in global monoculture plantation forests. Nat. Commun. 2022, 13, 4206. [Google Scholar] [CrossRef]
- US. Department of Agriculture. 2017 National Resources Inventory; Natural Resources Conservation Service: Washington, DC, USA, 2017. Available online: http://www.nrcs.usda.gov/Internet/NRCS_RCA/reports/nri_dashboard.html (accessed on 10 August 2022).
- US Environmental Protection Agency, Greenhouse Gases Equivalencies Calculator–Calculations and References. Available online: https://www.epa.gov/energy/greenhouse-gases-equivalencies-calculator-calculations-and-references (accessed on 18 June 2022).
- Maass, D.I.; Irland, L.C.; Anderson, J.L.; Laustsen, K.M.; Greenwood, M.S.; Roth, B.E. Reassessing potential of exotic larch in northern United States. J. For. 2019, 118, 124–132. [Google Scholar] [CrossRef]
- Anderson, J.L.; Maass, D.; Irland, L.C. Forecasting Stand Value of Native, Exotic and Hybrid Larch in Maine Stumpage Market; LVES Research Note #9; Larch Virtual Experiment Station, 2018; p. 17. Available online: https://larchresearch.com/wp-content/uploads/2018/11/Forecasting-Stand-Value-of-Native-Exotic-and-Hybrid-Larch-in-Maines-Stumpage-Market-Anderson.pdf (accessed on 19 June 2022).
- Moser, L.; Fonti, P.; Butgen, U.; Esper, J.; Lutenbacher, J.; Frank, D. Timing and duration of European larch growing season along altitudinal gradients in the Swiss Alps. Tree Physiol. 2010, 30, 225–233. [Google Scholar] [CrossRef]
- Gilmore, D.; David, A. Current trends in management practices for European larch in North America. For. Chron. 2002, 78, 822–829. [Google Scholar] [CrossRef][Green Version]
- Gilmore, D.; Briggs, R.D. Stocking guide for European larch in eastern North America. North. J. Appl. For. 2003, 20, 34–38. [Google Scholar] [CrossRef][Green Version]
- Robbins, K. Risks associated with growing non-native larches in the northeast. North. J. Appl. For. 1985, 2, 101–104. [Google Scholar] [CrossRef]
- Cook, D.B. European Larch Reproduces in New York. J. For. 1939, 37, 891–893. [Google Scholar]
- Greenwood, M.S.; Roth, B.E.; Maass, D.I.; Irland, L.C. Near rotation-length performance of selected hybrid larch in Central Maine, U.S.A. Sylvae Genet. 2015, 64, 73–80. [Google Scholar] [CrossRef]
- Baltunis, B.S.; Greenwood, M.S.; Eysteinsson, T. Hybrid vigor in Larix: Growth of intra- and interspecific hybrids of Larix decidua, L. laricina, and L. kaempferi after 5 years. Silvae Genet. 1998, 47, 288–293. [Google Scholar]
- Baltunis, B.S.; Greenwood, M.S. Variation in lateral shoot elongation patterns and hybrid vigor in full-sib families and interspecific hybrids of larch. Tree Physiol. 1999, 19, 131–136. [Google Scholar] [CrossRef][Green Version]
- Royer-Tardif, S.; Paquette, A.; Messier, C.; Bournival, P.; Rivest, D. Fast-growing hybrids do not decrease understorey plant diversity compared to naturally regenerated forests and native plantations. Biodivers. Conserv. 2017, 27, 607–631. [Google Scholar] [CrossRef]
- Waskiewicz, J.; Tursini, R. The Japanese Larch Plantation at University of Vermont’s Jericho Research Forest after 75 Years; LVES Research Note #2; Larch Virtual Experiment Station: Maine, ME, USA, 2016; 7p. [Google Scholar]
- Irland, L.C.; Laustsen, K. Fox Forest, New Hampshire: Growth of Selected Exotic Larch Plantings, 1960–2021. LVES Research Note #14. Larch Virtual Experiment Station Report. 10p. 2022. Available online: www.larchresearch.com (accessed on 11 July 2022).
- Irland, L.C. Larch Measurements in Western New York Tug Hill Area LVES Research Note #15. Larch Virtual Experiment Station Report. 10p. 2022. Available online: www.larchresearch.com (accessed on 15 July 2022).
Publisher’s Note: MDPI stays neutral with regard to jurisdictional claims in published maps and institutional affiliations. |
© 2022 by the authors. Licensee MDPI, Basel, Switzerland. This article is an open access article distributed under the terms and conditions of the Creative Commons Attribution (CC BY) license (https://creativecommons.org/licenses/by/4.0/).