Abstract
The aim of this paper is to analyze the mechanical properties of Robinia pseudoacacia L. (black locust), Platanus × hybrida Brot. (London plane), Ulmus pumila L. (Siberian elm), and Populus alba L. (white poplar), estimated using ultrasound wave equipment (USLab y Sylvatest Duo) and impact wave equipment (Microsecond Timer) on standing trees, felled logs and on specimens obtained from different parts of the trees. Bending strength, axial compression strength and tension parallel to grain were determined for each specimen, in order to subsequently correlate the strength and stiffness with the acoustic properties determined in the standing tree. For the relationship between the static modulus of elasticity of the specimens and the dynamic modulus of elasticity determined in standing trees using the USLab, coefficients of determination were found to be between 0.30–0.92, between 0.52 and 0.80 using the Sylvatest Duo and between 0.60 and 0.94 with the Microsecond Timer. It would be necessary to determine whether the removal of bark for the correct coupling of the ultrasonic sensors would provide an entry route for pests or diseases that could affect the health of the tree.
1. Introduction
The benefits of urban trees are truly diverse, including aesthetic, recreational, environmental and even psychological benefits [1]. Since these physical structures are located in close proximity to people and property, their failure can cause damage. The science of tree stability uses biological and engineering principles to determine the structural soundness of the trees and predict the probability of failure [2]. Trees are living organisms, the properties and characteristics of which vary depending on the species, location, and growing conditions. Hence it is difficult to predict exactly when and under what conditions they will fail.
As trees age, they progressively develop features (such as a greater susceptibility to attack by fungi and insects) that can compromise their mechanical integrity. Therefore, older trees and their younger successors must be managed responsibly to support all ecosystem services, and appropriate methods of assessment must be developed to ensure an acceptable level of risk [3]. Nondestructive evaluation of the properties of standing trees was developed in response to the necessity to solve practical problems without compromising the integrity of the trees [4].
In biomechanics, the tree is considered a structural element, subject to wind and gravitational forces, so it is necessary to determine its physical and mechanical properties [5]. Nondestructive methods allow the physical and mechanical properties of a material to be identified, so that management decisions can be taken without affecting its final use [2]. Among the advantages of these methods are safety, low-cost equipment, versatility, time saving, equipment portability and the fact that they do not require laboratory stand equipment [6].
The nondestructive methods most used in the evaluation of both standing trees and structural wood are those based on the transmission of acoustic waves (impact or ultrasonic). The moisture content of the standing tree, the species, soil conditions, and environmental factors all affect the characteristics of the wood at both microscopic and macroscopic levels [7]. Acoustics is a practical, low-cost method to assess the wood quality of standing trees; the movement of acoustic waves through wood is directly related to its physical and mechanical properties, since stress waves travel more slowly through wood with some defect (cracks, deterioration by fungi or insects, or hollows) or with singularities (presence of knots or reaction wood) than through healthy wood [8,9]. Thus, the presence of deterioration from decay can greatly affect stress wave transmission time through wood, the transmission times for decayed wood being much greater than those for non-decayed wood [10]. Different studies have shown that, in the case of longitudinal measurements, the velocity in the standing tree is different from that of logs from a recently felled tree [11,12,13,14,15,16].
As regards the trees in Madrid City, the most commonly used nondestructive method is visual inspection, which often does not identify internal anomalies pointing to internal decomposition or instability. Hence, it is necessary to consider other techniques which, when combined with visual inspection, provide a more precise assessment of the mechanical condition and therefore the level of risk associated with a given tree. In the present study, the physical and mechanical properties of wood in six specimens of urban trees from Madrid City are determined, and nondestructive tests are carried out using ultrasound wave equipment (USLab, Sylvatest Duo) and impact waves (Microsecond Timer) on standing trees, on logs from felled trees, and on specimens obtained from each tree. Furthermore, destructive tests for bending strength, axial compression strength, and tension parallel to grain were carried out on small-sized specimens.
2. Materials and Methods
The sample used in this investigation consisted of one tree of Robinia pseudoacacia L. (black locust), one of Platanus × hybrida Brot. (London plane), three of Ulmus pumila L. Siberian elm) and one of Populus alba L. (white poplar). These trees were selected for felling because they had certain anomalies such as cracks in the bark, cavities in the tree trunk or because they were leaning, which can be a sign of structural issues and therefore risk of tree failure.
As regards the environment, the Populus alba L. tree was located in a green area together with other trees of the same species, whereas the rest of trees in this study were located in sidewalk tree pits. Samples of 15 cm in length were taken from each standing tree using a Pressler drill at three different heights on the trunk (0.3 m, 1.20 m and 2.0 m). These samples were sectioned and weighed directly in the field to obtain the green weight, and subsequently they were taken to the laboratory and dried in a stove at 103 ± 2 °C to obtain the oven-dry weight. The moisture content (MC) was calculated using the equation:
where Wg is the green weight of the sample and Wd is the oven-dry weight of the sample.
The green density of these Pressler drill samples was estimated (ρg) using the empirical method, for which the samples were considered to be perfect cylinders. Once the samples had been sectioned, freshly obtained from the standing tree, the length and three diameters (one at each end and one in the middle) were measured with a caliper to an accuracy of 0.01 mm. The three diameter measurements were then averaged. The green volume was obtained (Vg) using the the equation:
where Vg is the green volume, π = 3.1416, D is sample diameter and L is sample length.
Once the green volume and green weight have been obtained, the green density can be calculated using the equation:
where is the green density, is the green weight and is the green volume.
2.1. Longitudinal Measurements
For the standing trees, two logs of 90 cm in length were marked, starting at 30 cm from the base of the tree, and indirect and semidirect measurements of these logs were taken in the longitudinal direction, the circumference being divided into eight points of measurement with the first point facing geographical north and the seven remaining measurement points continuing in a clockwise direction. These measurements were obtained using the following two different pieces of ultrasound equipment: the USLab (Agricef, Campinas, Brazil), which measures the transmission time (time of flight or ToF) of an ultrasonic wave (μs) through two conical piezoelectric transducers, one emitter and the other receiver, with a frequency of 45 kHz, and the Sylvatest Duo (CBS-CBT, Paris, France), with 22 kHz conical transducers that also measures the transmission time of an ultrasonic wave (μs).
In addition, longitudinal measurements were taken using the Microsecond Timer (MST) (Fakopp Enterprise, Sopron, Hungary), which is an acoustic wave transmission time measurement device (μs) with two spike-type transducers (start transducer and stop transducer). A hammer weighing 100 g was used to generate a stress wave. The time of flight (ToF) was measured using the three pieces of equipment and thus the transmission velocity was calculated through the equation:
where V is the velocity and L is the distance of the sensors.
To perform the longitudinal measurements at the different measurement points, perforations were drilled through the bark and into the wood itself so that the sensors could then be coupled correctly in the trunk. In the case of semidirect measurements, each sensor was placed diametrically opposite to the other, whereas for indirect measurements, the two sensors were placed on the same side. For the indirect and semidirect measurements, each sensor was placed at 45°. For the semidirect measurements, the velocities were calculated by dividing the distance traveled by the time obtained, where the distance corresponds to the hypotenuse of a right triangle (Figure 1).
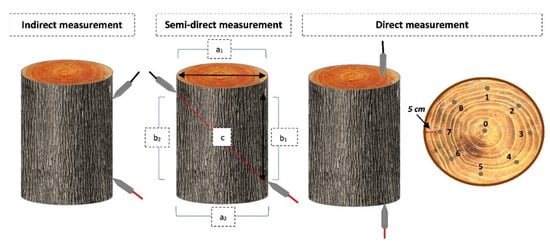
Figure 1.
Three different configurations of longitudinal measurements on standing trees and logs: indirect, semidirect and direct. In semidirect measurements, to determine the lengths of the right triangle, an average of a1, a2 and b1, b2 was obtained.
Once the trees had been felled, the logs were taken to the laboratory and the measurements were repeated at the same points as for the standing tree. In addition, direct measurements were performed, for which 5 mm perforations were drilled in both cross sections of the log, in order to correctly couple the sensors. Eight measurement points were considered at 5 cm from the bark (coinciding with the measurement points on the standing tree) as well as one more point in the center.
2.2. Preparation of Specimens
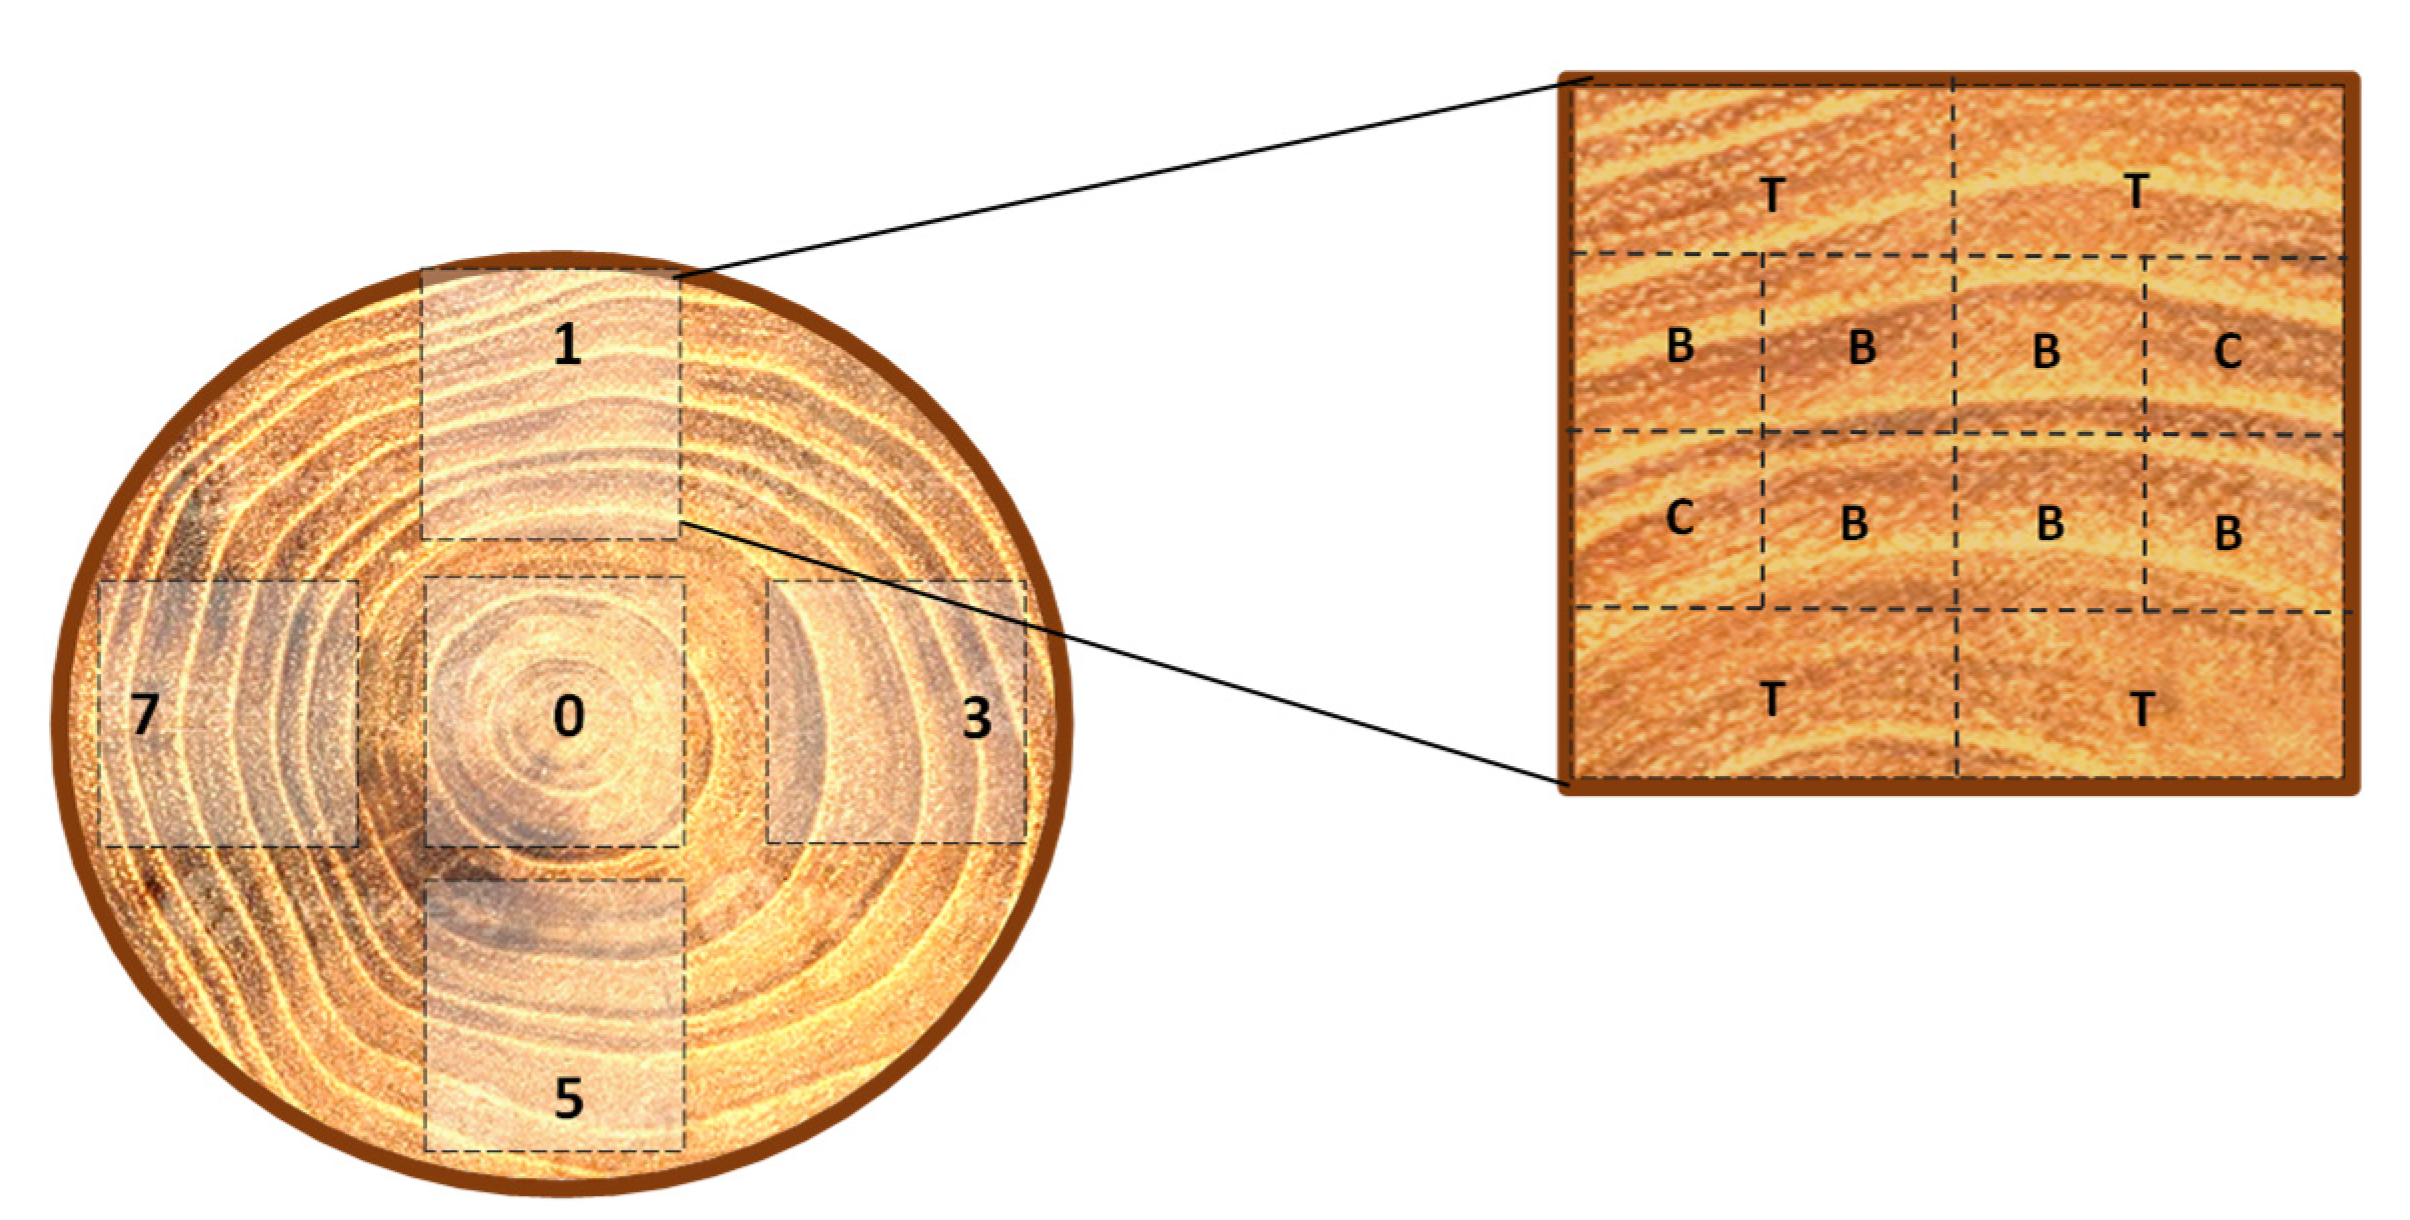
The preparation of the specimens was carried out according to standard UNE 56-528-78 [17]. The two logs obtained from each tree were cut in half, thus obtaining four logs of approximately 45 cm. Five pieces were then marked on the cross sections of the logs (Figure 2), each piece coinciding with points 0, 1, 3, 5 and 7 of the direct measurements (point 1 being that which faced geographic north on the standing tree). Specimens were then obtained from each of these pieces to perform bending strength tests (20 mm × 20 mm × 300 mm), axial compression strength (20 mm × 20 mm × 60 mm) and tension parallel to grain (locations illustrated in Figure 2). In the case of Robinia pseudoacacia L. it was not possible to obtain specimens from the central area, since it had a hole caused by a xylophagous agent.
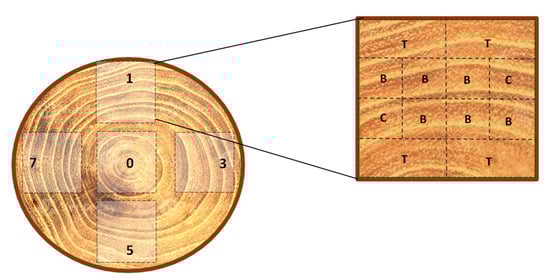
Figure 2.
Location of specimens obtained: B = bending strength, C = axial compression strength, T = tension parallel to grain.
The tests were carried out on conditioned and saturated specimens, with the latter having a humidity level similar to that of the standing tree. In the case of conditioned specimens, these were placed in a conditioning chamber at a temperature of 20 ± 2 °C and relative humidity of 65 ± 5% until they reached equilibrium humidity, which was confirmed by successive weighing. This equilibrium was considered to have been reached when two consecutive weights, separated by an interval of 6 h, did not differ by more than 0.1% of specimen weight, following the standard UNE EN 408 [18]. In the case of saturated specimens, an attempt was made to conserve the natural humidity of the wood by keeping them submerged in water.
2.3. Nondestructive and Mechanical Tests on Specimens
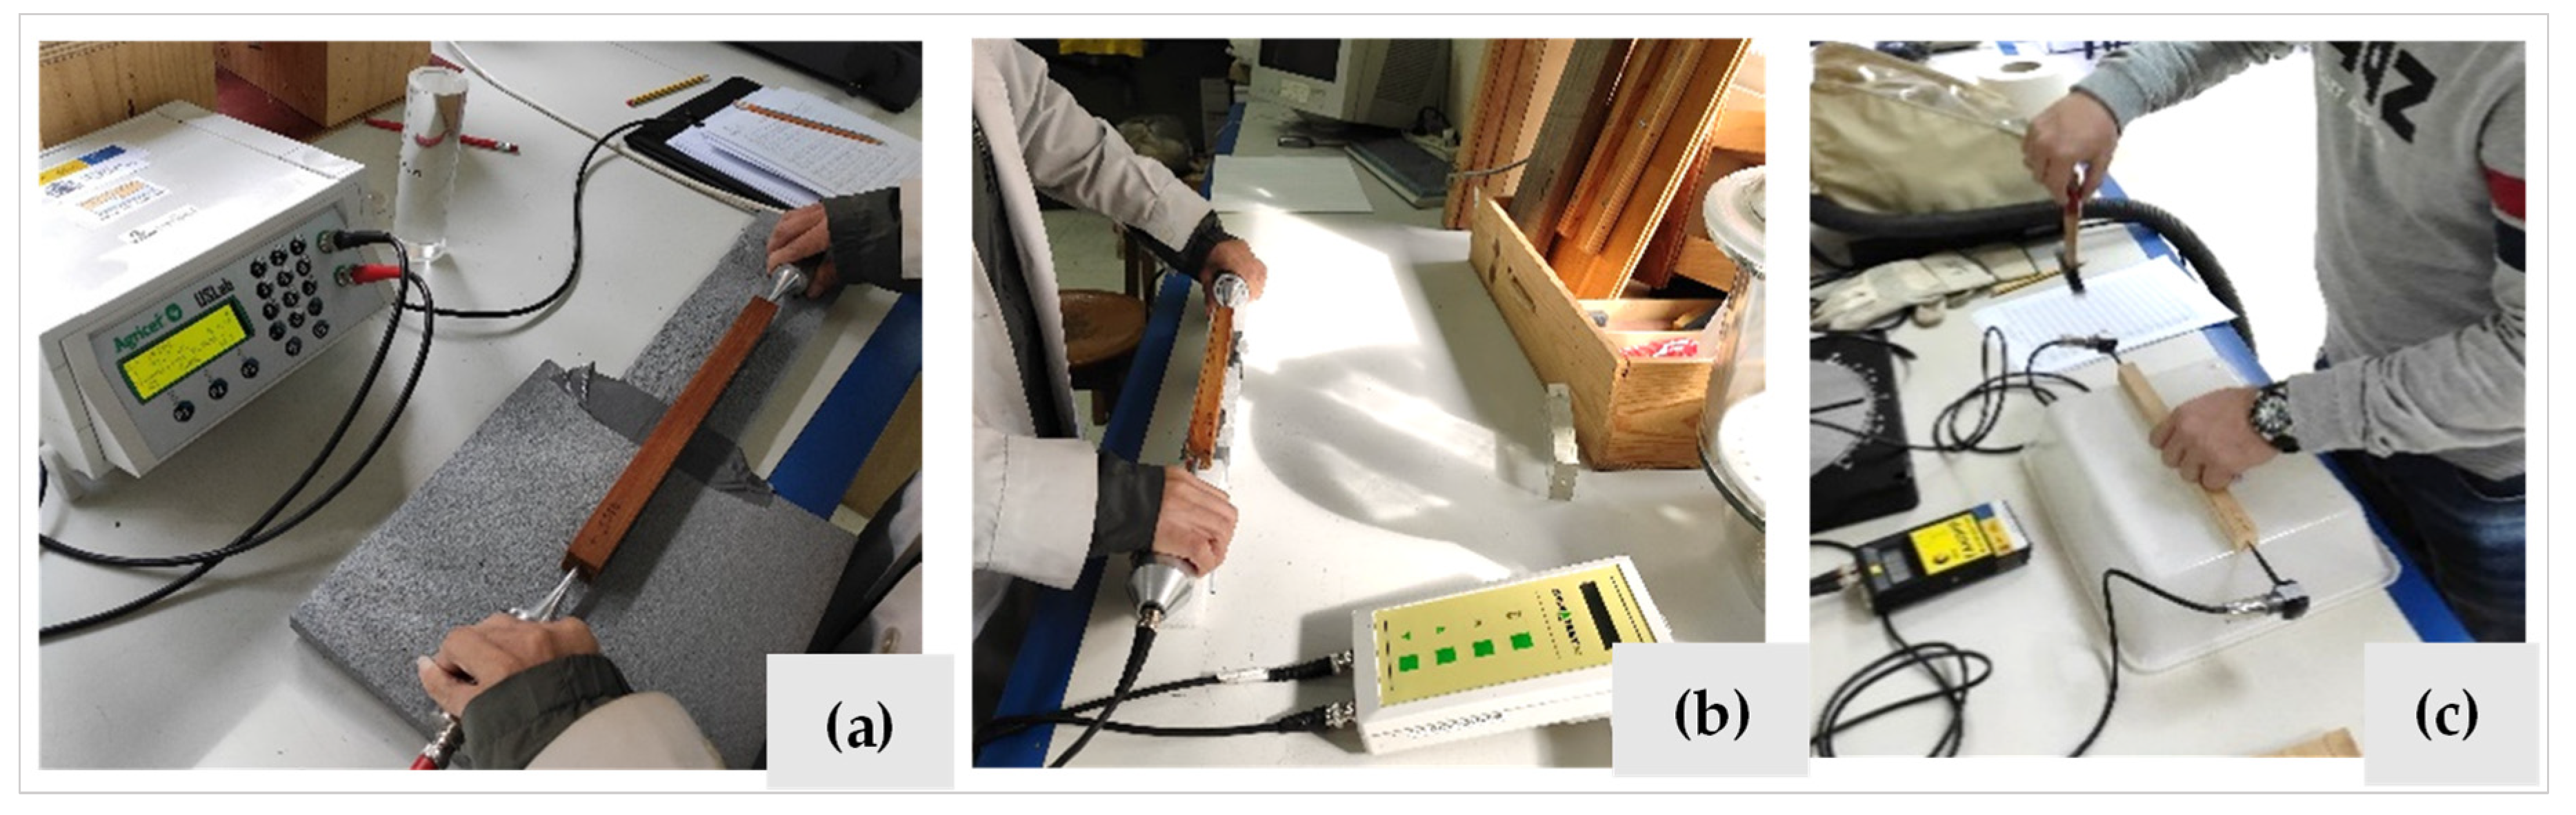
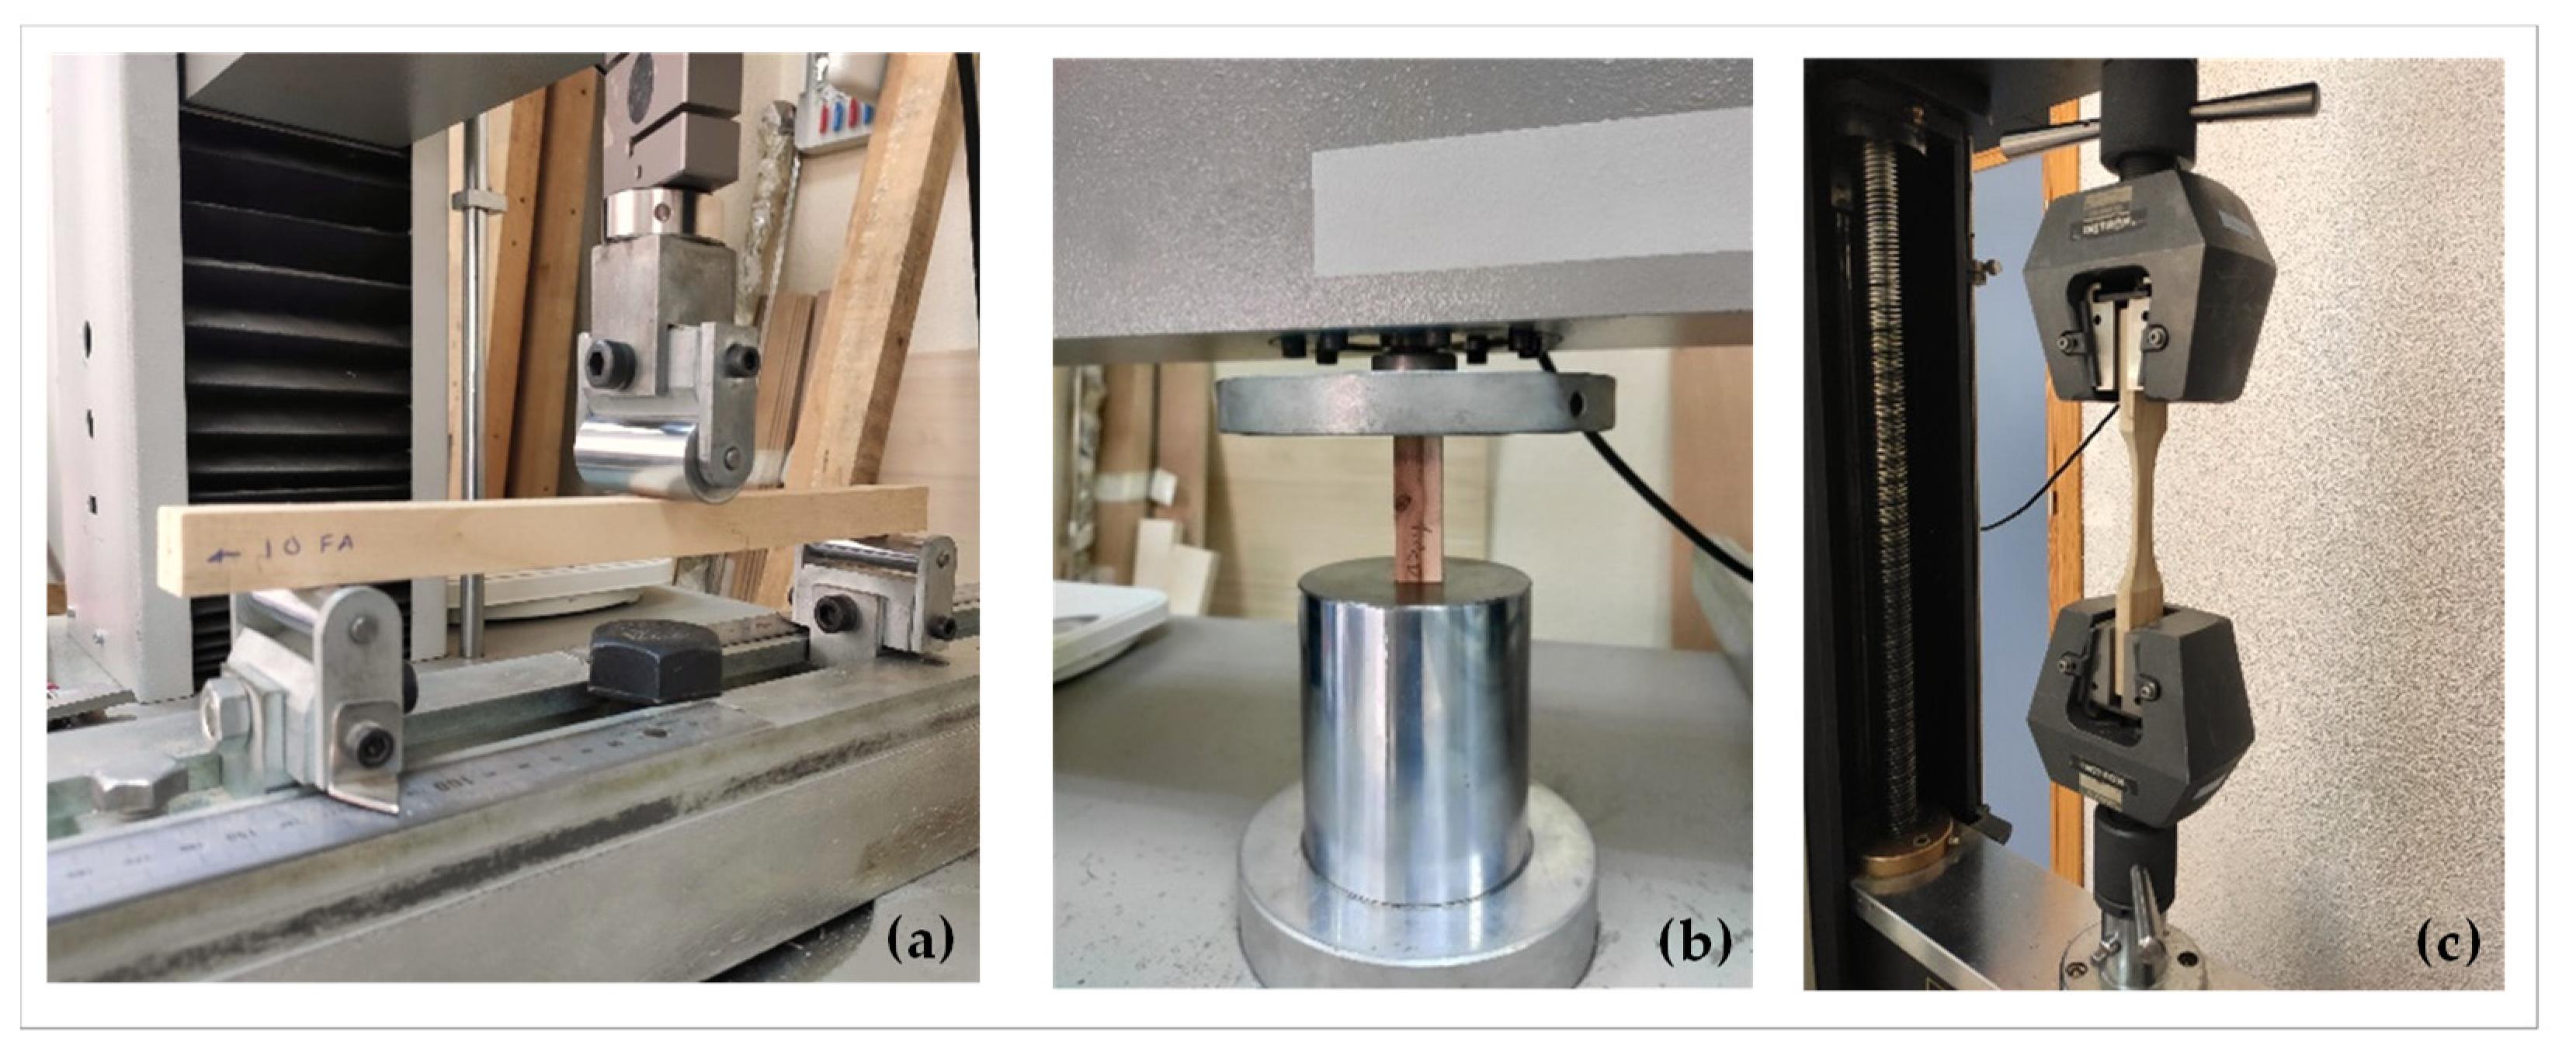
For the bending strength tests on both conditioned and saturated specimens, direct measurements were made with the USLab, Sylvatest Duo and Microsecond Timer equipment (Figure 3). In the same way as for the standing trees and logs, the wave transmission velocity was calculated through the time of flight (ToF).

Figure 3.
Nondestructive tests on specimens, direct measurements with USLab (a); Sylvatest Duo (b) and Microsecond Timer (c).
As regards the mechanical tests on specimens for bending and compression, a Suzpecar-Microtest universal testing machine was used with load cells of 7.9 kN and 24 kN, respectively. The dimensions of the specimens were measured to the nearest 0.1 mm. Determination of static bending strength was carried out according to standard UNE 56537 [19], applying the load at a constant velocity of 5 mm/min until breakage. The axial compression strength tests were carried out according to standard UNE 56535 [20]. The load was applied at a constant velocity of 250 kg/cm2 per minute until the specimen broke (Figure 4).
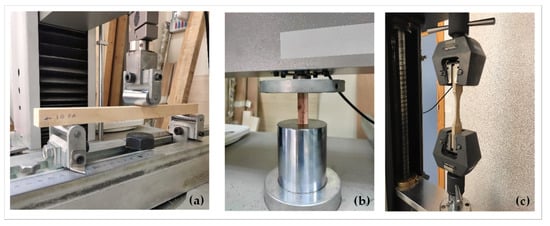
Figure 4.
Mechanical tests of bending strength (a); axial compression strength (b); and tension parallel to grain (c).
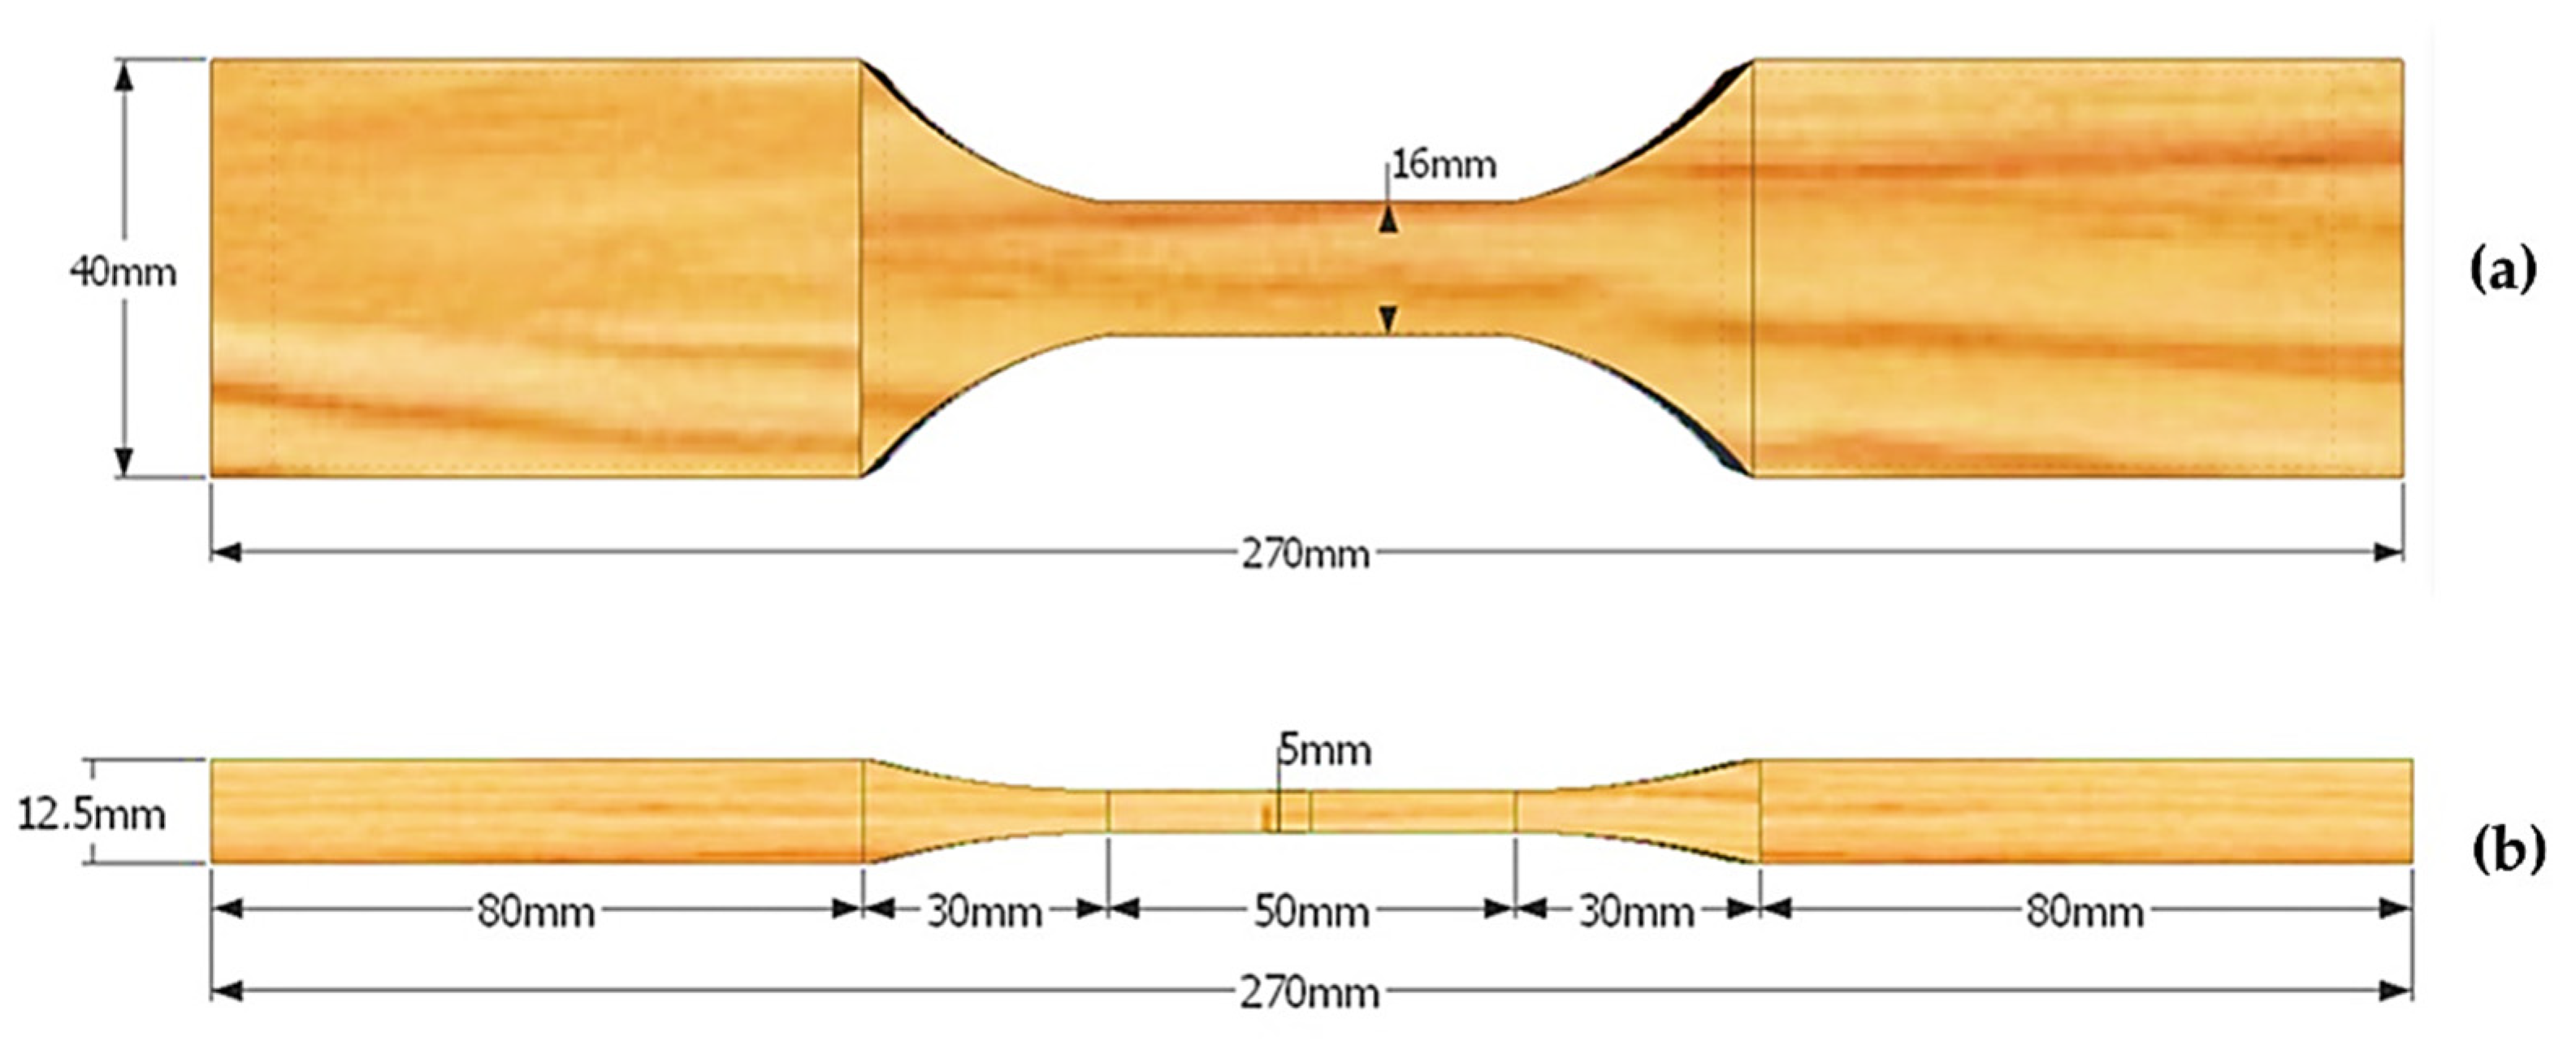
Tension parallel to grain tests were carried out according to standard UNE 28012-8 [21]. An Instron-Microtest universal testing machine with a 24.7 kN load cell was used. The specimens were prepared in the shape and dimensions needed for the test (Figure 5). The load was applied at a velocity of 33 N/s until the specimen broke.
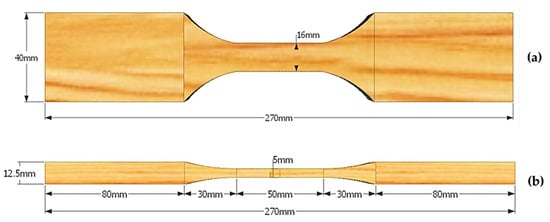
Figure 5.
Shape and dimensions of the specimen for tension parallel to grain test. Top (a) and side (b) views.
Once the conditioned and saturated specimens had been tested using both nondestructive and destructive methods, they were placed in drying stoves at 103 ± 2 °C to obtain the anhydrous weight and subsequently determine the moisture content of the specimens at the time of each test.
Bending strength values (fm) and static modulus of elasticity (MOE) were obtained using the equations:
where is the maximum load in N; l is the distance between supports (mm); b is the width of the specimen (mm); h is thickness of the specimen (mm); and is the slope of the stress-strain curve in the elastic range.
The axial compression strength () was obtained using the equation:
where Fmax is the maximum load applied (N) and A is the cross-sectional area of the compression specimen (mm2).
In the same way, tension parallel to grain () was obtained using the equation:
where is the maximum load applied (N) and A is the area of the breaking section (mm2).
In the conditioned specimens used in the present study, a correction factor was applied according to the variations mentioned above. For the density (ρ) the correction factor given in the standard UNE EN 384:2016+A1 [22] was applied, according to the equation:
where u is the moisture content at the time of the test and uref is the reference moisture content (12%).
2.4. Relationship between Dynamic MOE in Logs and Indirect Velocities in Standing Trees
With the direct velocities in logs (V), and the green density (ρg) estimated using the Pressler drill, the dynamic modulus of elasticity (MOED; MPa) was calculated through the equation:
2.5. Data Analysis
Data from the different tests were processed and statistically analyzed using Microsoft Office Excel 2019 and Statgraphics Centurion 18. The study of normality of the variables was carried out using the Shapiro–Wilk test, which is based on the comparison of quartiles of the fitted normal distribution of the data. To study differences between variables, analysis of variance (ANOVA) was performed with a confidence level of 95%. To analyze the relationship between variables, simple regression models were carried out, which allow the impact of certain factors (x) on a dependent variable (y) to be described. To evaluate the goodness of fit, the coefficient of determination (R2) was used, which represents the percentage of variability in the dependent variable explained by the independent variable.
3. Results and Discussion
3.1. Standing Tree and Log Measurements
The wave propagation velocity was obtained by dividing the distance traveled by transmission time obtained with each device: USLab, Sylvatest Duo and Microsecond Timer. The results for different species and devices used are presented below (Table 1, Table 2 and Table 3).

Table 1.
Longitudinal velocities obtained using USLab and coefficients of variation.
Table 2.
Longitudinal velocities obtained using Sylvatest Duo and coefficients of variation.
Table 3.
Longitudinal velocities with Microsecond Timer and coefficients of variation.
Indirect velocities obtained using USLab, both in standing trees and logs, were always higher than the respective semidirect velocities. The direct velocity in logs was higher than the indirect and semidirect velocities by different proportions depending on the tree species: Robinia pseudoacacia L. (24% and 31%), Platanus x hybrida Brot. (7% and 25%), Ulmus pumila L. 1 (71% and 78%), Ulmus pumila L. 2 (41% and 59%), Ulmus pumila L. 3 (14% and 32%), and Populus alba L. (28% and 75%). This difference is due to the angle of the propagation waves with respect to the longitudinal direction of the fiber, revealing that velocity decreases when changing the angle of propagation [23,24,25], in this case by changing the angle to 45° in indirect velocities.
Gonçalves et al. [14] evaluated the variation in ultrasonic wave propagation velocity with USLab in standing trees of Eucalyptus grandis, Pinus elliottii, Toona ciliata and Eucalyptus clones, the transducers being placed at 45° and 0.5 m apart. Once felled, logs were taken from the each of the above species with lengths ranging from 1.8 m to 3.5 m and tests were performed by placing the transducers at both ends. In this study, indirect velocities (in standing trees) of 4832 m/s, 1999 m/s, 4347 m/s, and 4449 m/s respectively, and direct velocities (in logs) of 4189 m/s, 2123 m/s, 3910 m/s, and 3872 m/s were obtained. These results contradict the notion that velocity decreases when the wave propagation angle is modified, although another important factor to consider is the distance between transducers. In this regard, although the length traveled by the acoustic pulse does not, in theory, affect the recorded propagation time, in practice, shorter read lengths tend to show higher velocity values; in other words, there seems to be a loss of velocity when the length between transducers is increased [24]. In the present study, the distances between transducers for indirect velocities was 0.8 m and for direct velocities was 0.9 m Since the distance between transducers was similar, the fact that lower velocities were recorded for indirect measurements can only be due to the modification of the wave propagation angle with respect to the fibers.
In the same way, direct velocity measured using the Sylvatest Duo was higher than the indirect and semidirect velocities by different proportions, depending on the tree species: Robinia pseudoacacia L. (20% and 25%), Platanus × hybrida Brot. (13% and 39%), Ulmus pumila L. 1 (43% and 56%), Ulmus pumila L. 2 (23% and 47%), Ulmus pumila L. 3 (14% and 37%), and Populus alba L. (44% and 75%). As in the case of USLab, there is a loss of velocity in the semidirect measurements compared to the direct measurements, mainly because the configuration of the semidirect approach means that the amplitude of the signal received is significantly smaller along its path and it also passes through the pith area. Hence, the waves encounter more defects in the wood, such as knots, cracks and possible decay.
Direct velocity measured using the Microsecond Timer was also higher than the indirect and semidirect velocities, although as with the other devices the differences varied depending on the tree species: Robinia pseudoacacia L. (17% and 22%) Platanus × hybrida Brot. (14% and 37%), Ulmus pumila L. 1 (11% and 40%) Ulmus pumila L. 2 (20% and 39%) Ulmus pumila L. 3 (11% and 29%) and Populus alba L. (58% and 65%). Using this device, the losses in velocity, especially for the indirect measurements with respect to direct measurements, were noticeably lower than those found using the ultrasound equipment.
For all trees studied, in general, the indirect velocities in logs were found to be slightly higher than the indirect velocities measured in standing trees, even though the measurements were taken at the same points. This difference can be explained by the load conditions and stresses to which standing trees are subjected, while logs are free of loads. These loads on the tree are influenced by the dimensions of each specimen (height, trunk diameter, crown, branches, etc.).
The variation in velocity at the different measurement points for Platanus × hybrida Brot. is shown graphically (Figure 6). Points 1 to 8 correspond to log A and points 9 to 16 correspond to log B. In these graphs, the indirect and semidirect velocities obtained in standing trees and those obtained in logs are compared. In general terms, the two ultrasound wave devices recorded greater variation between velocities for both standing trees and logs, in comparison to the same measurements taken using the impact wave equipment.
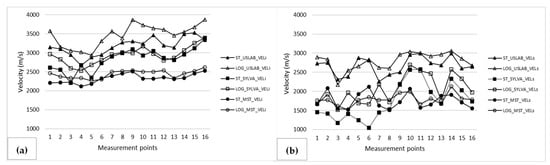
Figure 6.
(a) Indirect velocities and (b) Semidirect velocities, determined on standing tree and logs in Platanus × hybrida Brot.
As regards the species in this study, a greater variation in the velocities in standing trees was found when using the ultrasound devices (USLab and Sylvatest Duo), since these are more sensitive to external vibrations. This can be a problem when performing measurements on trees that are close to streets where vehicles generate vibrations that can affect the measurements. This was the case of the Ulmus pumila L. 1 and Ulmus pumila L. 2 trees in this study, as reflected by their coefficient of variation values.
Regarding the direct velocities determined in logs of the different species using ultrasound equipment (Sylvatest Duo and USLab), there was an appreciable difference between velocities measured using the 22 kHz sensors and the 45 kHz sensors, the latter being higher. It was expected that the three trees of Ulmus pumilla would have a similar average velocity, since they had no internal decay that could affect the transmission of the waves. However, the specimens from this species used for the testing were found to have a lot of small knots along the stem, which could have been a determining factor in the wave velocity variation among these trees of the same species. In contrast, lower velocities were recorded for all the different logs when using the impact wave equipment, in comparison to the ultrasound equipment.
3.2. Relationship between Dynamic MOE in Logs and Indirect Velocities in Standing Trees
Linear regressions were performed between MOED and the indirect velocities in standing trees obtained using each device (USLab, Sylvatest Duo and MST). Thus, with indirect measurements of the standing tree, the dynamic modulus of elasticity in the direction of the fiber can be estimated, this being related to a large extent to the mechanical properties of wood [23]. In Robinia pseudoacacia L. values of R2 = 0.88 were found using USLab, R2 = 0.93 with Sylvatest Duo and R2 = 0.89 in the case of MST. In Platanus × hybrida Brot., the values were R2 = 0.86 using USLab, R2 = 0.77 with Sylvatest Duo and R2 = 0.90 with MST (Figure 7).
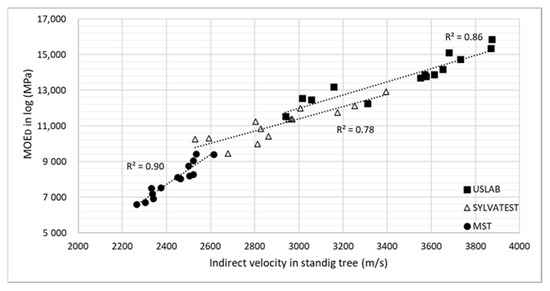
Figure 7.
Linear regression between MOED and indirect velocity using USLab, Sylvatest Duo and MST in Platanus × hybrida Brot.
In Ulmus pumila L. 1, values of R2 = 0.54 were found with Sylvatest and R2 = 0.70 with MST. In Ulmus pumila L. 2, an R2 = 0.55 was found using USLab, R2 = 0.21 with Sylvatest and R2 = 0.35 with MST. In Ulmus pumila L. 3, values of R2 = 0.39 were found using USLab, R2 = 0.33 with Sylvatest and R2 = 0.39 with MST, Finally, in the case of Populus alba L., an R2 = 0.43 was found using USLab, R2 = 0.29 with Sylvatest and R2 = 0.37 with MST. Wang et al. [11] reported a linear regression between the velocity of a tree and the log, characterized by a coefficient of determination that ranged between 0.71 and 0.93. Bertoldo [26] reported regression models for tree-log ultrasound velocities with an R2 = 0.89.
3.3. Nondestructive Tests and Destructive Tests on Specimens
Given that moisture content is known to be an important factor, several studies have highlighted its effect on ultrasonic waves. Results from these studies suggest that, below the fiber saturation point (FSP), the velocity of the waves in the direction parallel to the fibers decreases drastically with increasing moisture content (MC). However, in the longitudinal direction, moisture content above the FSP does not influence the ultrasonic velocity [23,27,28,29,30].
As regards the mechanical properties of the wood, above the FSP value, water freely fills the cavities of the fibers and does not influence the mechanical properties [31]. The influence of humidity differs among the various mechanical properties. For practical purposes, there is a linear relationship between each mechanical property and humidity for contents between 8 and 20%. The approximate variation in mechanical properties (%) of defect-free wood for a variation in moisture content of 1% is 5% in the case of parallel compression, 2.5% in tension parallel to grain and 4% in bending strength [31].
For the velocities determined in the specimens using ultrasound, a correction factor was applied corresponding to the fact that the velocity decreases by 0.8% and the velocity with stress waves (MST) by 1% for each point of increase in the moisture content, compared to reference moisture [32]. Table 4 summarizes the average velocities and dynamic modulus of elasticity obtained using nondestructive methods, both for conditioned and saturated specimens, as well as the values for bending strength and static modulus of elasticity obtained through the mechanical (destructive) tests. The bending strength, axial compression strength and tension parallel to grain varied along the tree trunk, although not significantly. Considering all the trees in this study, on average, the saturated specimens showed a reduction in bending strength of between 15% and 31%, compared to the bending strength values in conditioned specimens; between 8% and 27% reduction in the modulus of elasticity; between 27% and 52% reduction in axial compression strength, and between 7% and 38% reduction in tension parallel to grain.
Table 4.
Average velocities (VA), dynamic and static modulus of elasticity (MOED), bending strength, compression, and tension in conditioned and saturated specimens.
No previous studies were found on determining mechanical properties in small-sized specimens in saturated condition, although the properties obtained in conditioned specimens were taken as a reference for comparison with values reported for the species studied (Table 5). In the case of the bending strength, lower values were found in Robinia pseudoacacia L. and in the three Ulmus pumila L. trees. For the Platanus × hybrida Brot. and Populus alba L. trees, the bending strength, although also lower, was notably similar to that reported in the literature. The modulus of elasticity in Robinia pseudoacacia L., Platanus × hybrida Brot. and the three Ulmus pumila L. trees was lower than that reported for each of these species, whereas that of Populus alba L. was similar. The axial compression strength in Platanus × hybrida Brot. and Populus alba L. was similar to that reported, while in the rest of the specimens it was lower.
Table 5.
Reported values for normal density, bending strength, modulus of elasticity, compression, and tension parallel to grain.
The value for tension parallel to grain in the Populus alba L. tree was notably similar to that reported, while for the rest of the species, no comparative values for this property were found. It is important to mention that, unlike a tree located in a forest stand, the urban tree is subject to particular growth conditions that generate certain microscopic and macroscopic structural modifications. These conditions, including environmental pollution, soil type, nutrients, available water and temperature, will influence the density of the wood, which will vary among specimens of the same species as well as within a single specimen, each variation reflecting differences in the different mechanical properties.
3.4. Relationship between Dynamic and Static Modulus of Elasticity in Specimens
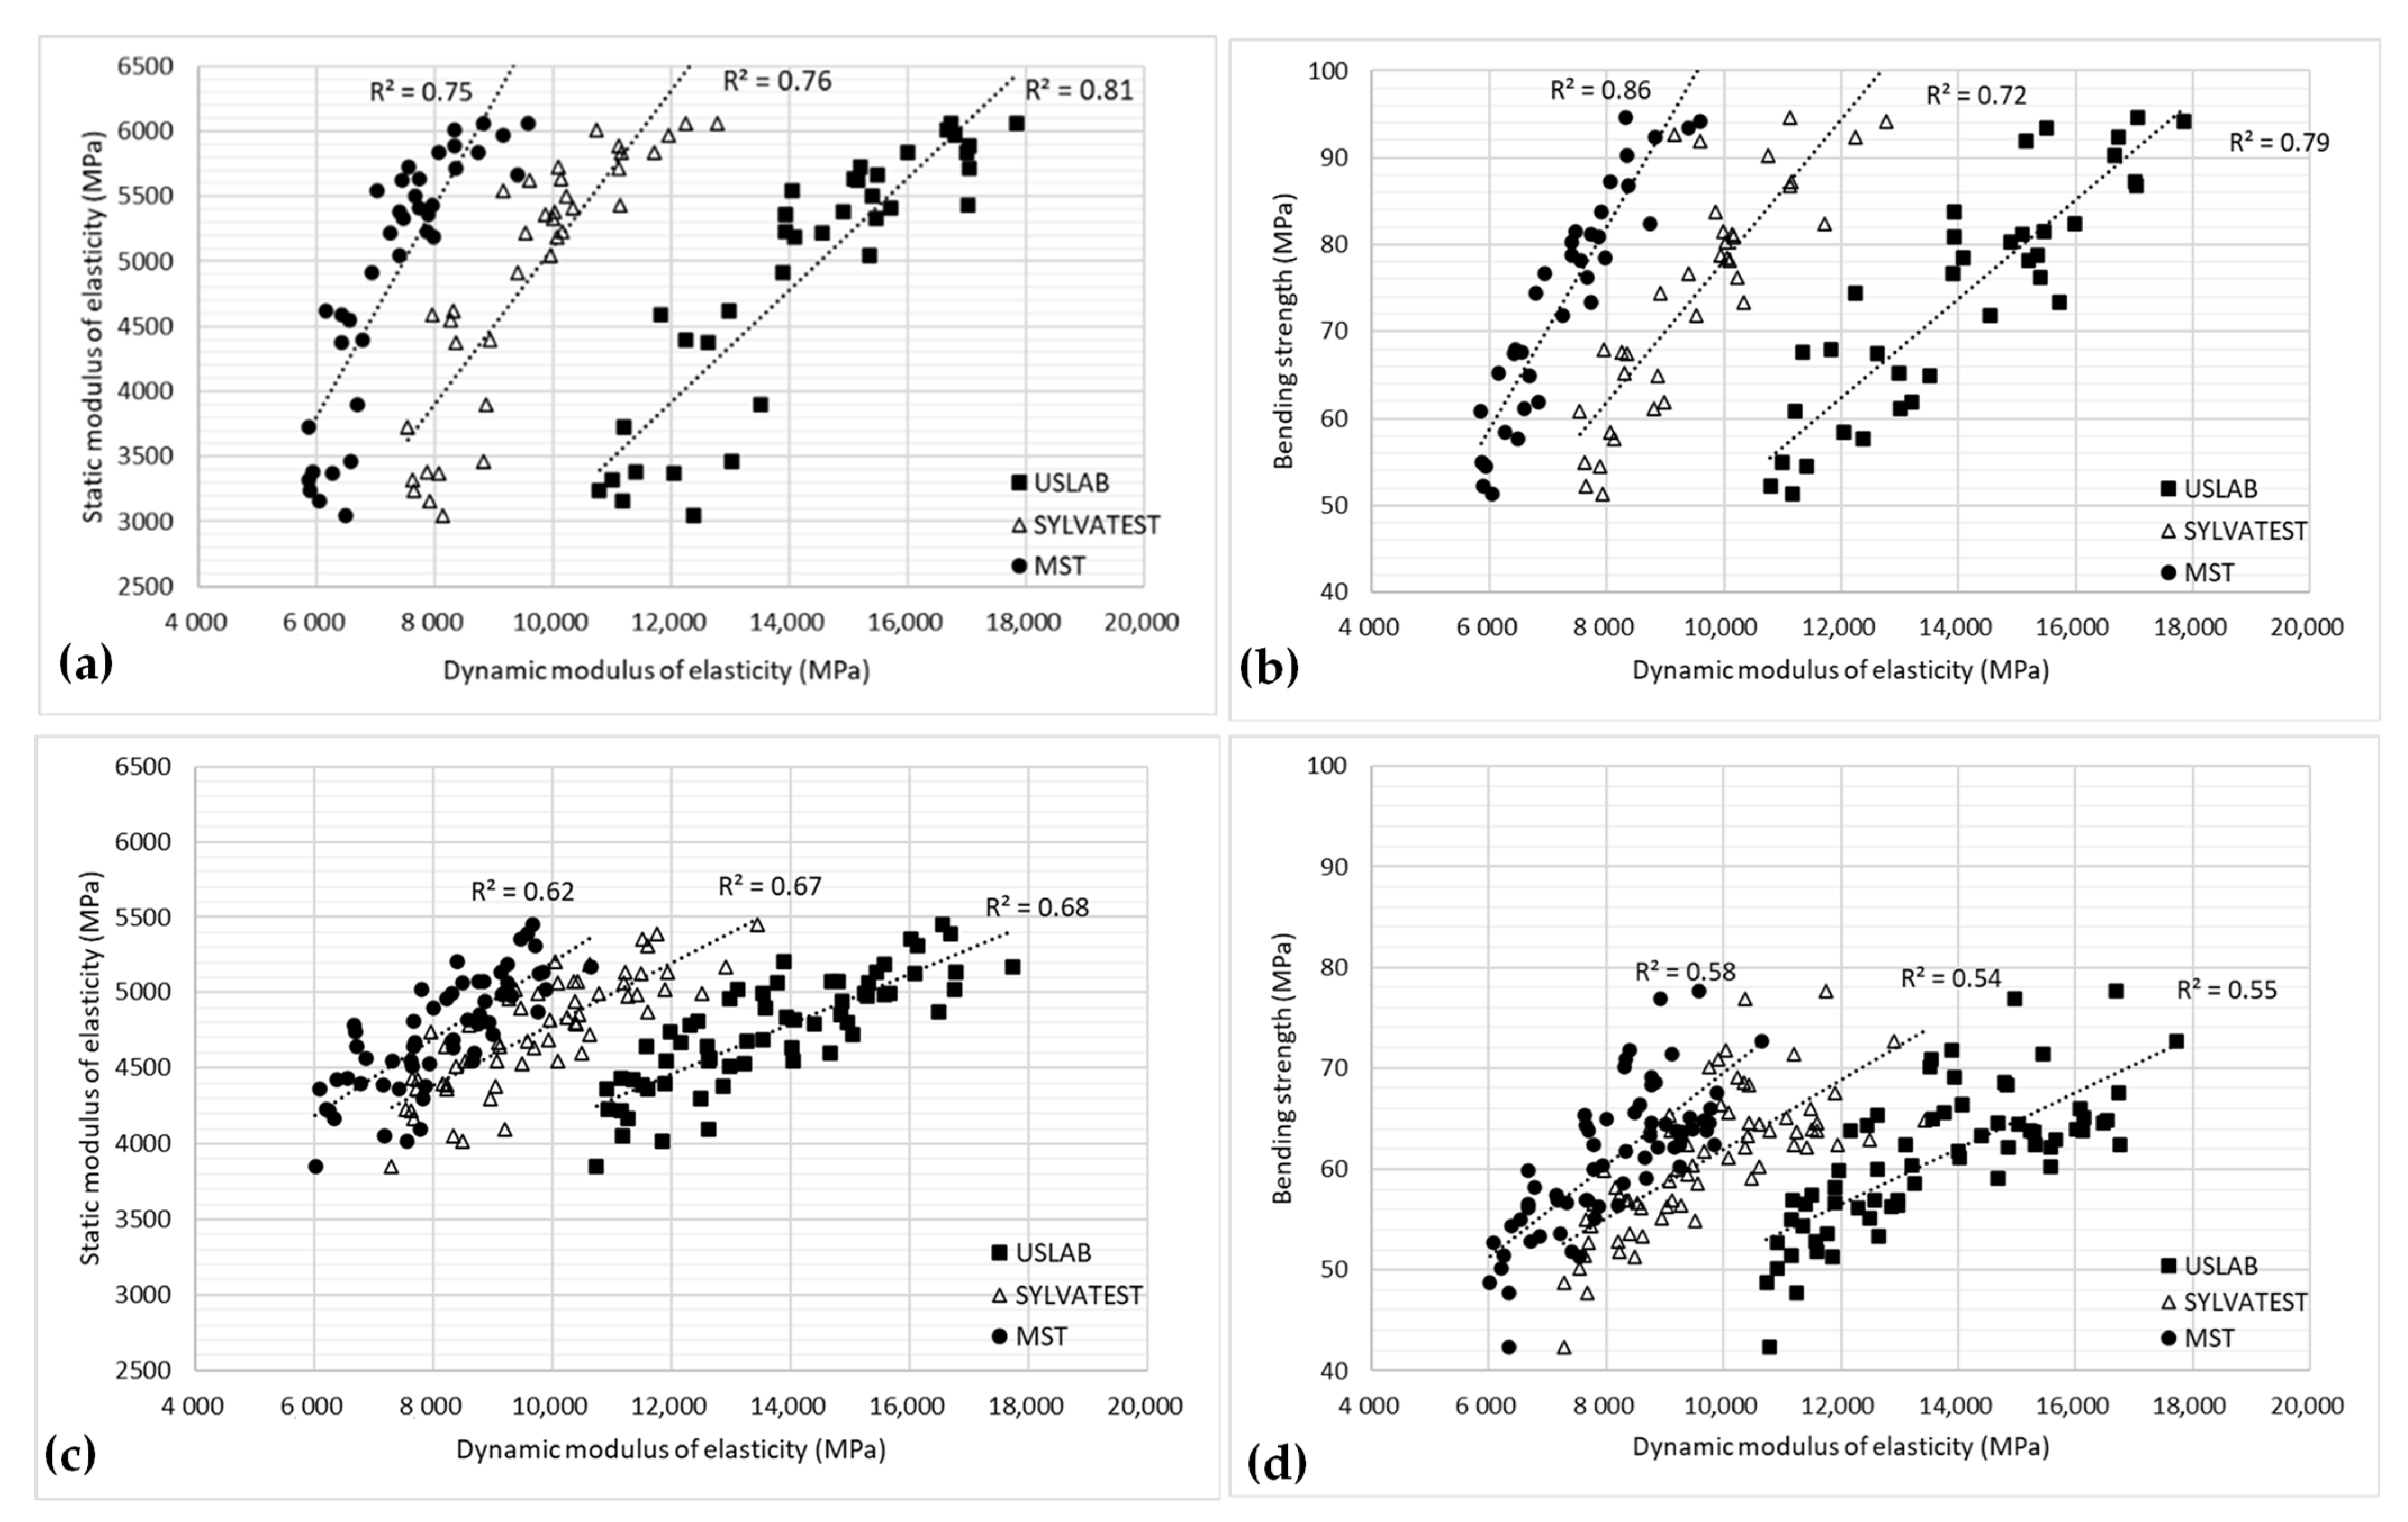
There are a multitude of studies, particularly with regard to structural wood, which address the relationship between velocity of propagation of ultrasound or stress waves in the longitudinal direction and the mechanical properties [32,35,36,37,38,39,40,41]. These studies have reported good coefficients of determination, reaching values as high as 0.98, in samples free of defects [42]. The relationship between nondestructive estimators and mechanical properties of wood is usually high, the wave transmission velocity or, better still, the dynamic modulus of elasticity, being good estimators of the static modulus of elasticity and the strength of the wood [24]. For the different specimens studied, a significant relationship was observed, both for the bending strength () and for the static modulus of elasticity (), the latter having a greater correlation with the dynamic modulus of elasticity (). Figure 8 shows the relationship between and that was obtained using each device with conditioned specimens of Platanus × hybrida Brot., the relationship between and in conditioned specimens, the relationship between and in saturated specimens, and the relationship between and in saturated specimens.

Figure 8.
(a) Linear regressions between the dynamic modulus of elasticity and static modulus of elasticity in conditioned specimens (b) dynamic modulus of elasticity and bending strength in conditioned specimens (c) dynamic modulus of elasticity and static modulus of elasticity in saturated specimens and (d) dynamic modulus of elasticity and bending strength in saturated specimens, of Platanus × hybrida Brot.
As can be seen in Table 6, the determination coefficient values for Robinia pseudoacacia L. were higher than those for the rest of the species, both in conditioned and saturated specimens, which could be related to the higher density of its wood compared to the rest of the species. Similarly, taking into account all the specimens, better determination coefficients were found when relating the dynamic modulus of elasticity with the static modulus of elasticity.
Table 6.
Determination coefficients values between dynamic modulus of elasticity () and static modulus of elasticity (), and determination coefficients values between and bending strength ().
In general, for all trees studied, the conditioned specimens presented higher coefficient of determination values than those for saturated specimens, reflecting the influence of the moisture content. As regards other factors in addition to the moisture content that directly affect the mechanical properties, the presence of certain defects (knots) and deviations of the fiber implies a decrease in strength [43]. The wood of Ulmus pumila L. had a lot of small knots that were unavoidable when preparing the specimens; hence their presence could be a relevant factor affecting the values for modulus of elasticity and strength. Fiber deviation, as such, was not an object of the present study. The influence of the aforementioned factors has previously been reported in several studies, especially for sawn wood [27,29,30,44,45,46,47,48].
3.5. Relationship of Mechanical Properties in Specimens and Indirect in Standing Trees
Linear regressions were performed between the mechanical properties obtained in the saturated specimens and the indirect velocities of the standing tree (dynamic modulus of elasticity) using the different devices (Table 7). For this purpose, the indirect velocities of the areas from which the specimens were obtained were used. The determination coefficient values found are shown below.
Table 7.
Linear regressions between mechanical properties in saturated specimens and indirect in standing trees.
For some of the models described in the Table 7, since the p-value in the ANOVA table was less than 0.05, a statistically significant relationship exists between the different mechanical properties and the dynamic modulus of elasticity obtained from the velocities determined in the standing trees, with a confidence level of 95%. Regarding the relationships between the and the compressive strength values, no significant relationship was found between the two variables, nor were good determination coefficients identified, hence they are not shown in the abovementioned table, except in case of Ulmus pumila L. 3, for which an R2 = 68% was found using USLab, R2 = 54% using Sylvatest Duo and R2 = 69% with MST.
4. Conclusions
Statistically significant coefficients of determination were found between the mechanical properties determined in saturated specimens and the dynamic modulus of elasticity determined from the indirect velocities measured in the standing tree. For reasons unrelated to this study, it was not possible to study a larger number of specimens of the same species or trees with similar conditions (healthy or deteriorated trees, leaning or straight, same diameter and/or height, etc.). Therefore, as a future line of research, it is proposed that the number of trees included in the study be increased, considering the characteristics mentioned. However, it is also important to consider that, when it comes to urban tree specimens, even if they are of the same species, they can be much more diverse and heterogeneous than specimens growing in a forest stand.
Various studies have shown that the use of nondestructive methods provides a useful tool with which to estimate and evaluate the mechanical properties of a standing tree. Acoustics methods cannot be used for absolute determination of the dynamic modulus of elasticity but are only suitable for relative determination of mechanical properties. However, based on the experience of this study, it is important to highlight that when the species has a very thick bark, as was the case of Ulmus pumila L. (2–3 cm of bark), it can be very complicated to carry out measurements using ultrasound equipment, since the sensors must be perfectly coupled with the wood and placed correctly at 45°, which involved removing a large part of the bark at the measurement points. In practice, this could lead to the use of these methods being questioned, given the negative aesthetic effect on the tree. Moreover, it would be necessary to determine whether or not this bark removal would provide an entry route for pests or diseases that could affect the health of the tree.
Author Contributions
Conceptualization, G.H.V.-C., G.O.-L., E.H. and M.E.; methodology, G.H.V.-C., G.O.-L., E.H. and M.E.; software, G.H.V.-C. and G.O.-L.; validation, G.H.V.-C., G.O.-L., E.H. and M.E.; formal analysis, G.H.V.-C., G.O.-L., E.H. and M.E.; investigation, G.H.V.-C., G.O.-L., E.H. and M.E.; resources, E.H. and M.E.; data curation, G.H.V.-C., G.O.-L., E.H. and M.E.; writing—original draft preparation, G.H.V.-C. and G.O.-L.; writing—review and editing, G.H.V.-C., G.O.-L., E.H. and M.E.; visualization, G.H.V.-C., G.O.-L., E.H. and M.E.; supervision, G.H.V.-C., E.H. and M.E.; project administration, E.H. and M.E.; funding acquisition, E.H. and M.E. All authors have read and agreed to the published version of the manuscript.
Funding
Gabriel Humberto Virgen Cobos and Guadalupe Olvera Licona were supported by the National Council of Science and Technology (CONACyT) from the Mexican Government through a doctorate grant.
Institutional Review Board Statement
Not applicable.
Informed Consent Statement
Not applicable.
Data Availability Statement
Not applicable.
Acknowledgments
The authors would like to thank the company Ferrovial S.A. for providing the trees tested. They also thank the Timber Laboratory of the Forest Research Centre (INIA-CSIC) and the Forest Products Industries Laboratory (Universidad Politécnica de Madrid) for the facilities provided to carry out tests.
Conflicts of Interest
The authors declare no conflict of interest.
References
- Calaza, P.; Iglesias, M. El Riesgo Del Arbolado Urbano. Contexto, Concepto Y Evaluación; Mundi-Prensa: Madrid, Spain, 2016; p. 526. [Google Scholar]
- Allison, R.B.; Wang, X. Nondestructive Testing in the Urban Forest. In Nondestructive Evaluation of Wood, 2nd ed.; Ross, R.J., Ed.; General Technical Report, FPL-GTR-238; Department of Agriculture, Forest Service, Forest Products Laboratory: Madison, WI, USA, 2015; pp. 77–86. [Google Scholar]
- Tomao, A.; Secondi, A.; Corona, P.; Giuliarelli, D.; Quantrini, V.; Agrimi, M. Can composite indices explain multidimensionality of tree risk assessment? A case study in an historical monumental complex. Urban For. Urban Green. 2015, 14, 456–465. [Google Scholar] [CrossRef]
- Bucur, V. Ultrasonic techniques for nondestructive testing of standing trees. Ultrasonics 2005, 43, 237–239. [Google Scholar] [CrossRef] [PubMed]
- Mattheck, C.; Breloer, H. The Body Language of Trees: A Handbook for Failure Analysis; HMSO Publications Centre: London, UK, 1998. [Google Scholar]
- Weiler, M.; Missio, A.L.; Gatto, D.A.; Güths, W.G. Nondestructive evaluation of wood decayed by xylophagous organisms. Mater. Res. 2013, 16, 1203–1213. [Google Scholar] [CrossRef]
- Wang, X. Acoustic measurements on trees and logs: A review and analysis. Wood Sci. Technol. 2013, 47, 965–975. [Google Scholar] [CrossRef]
- Proto, A.; Macrì, G.; Bernardini, V.; Russo, D.; Zimbalatti, G. Acoustic evaluation of wood quality with a non-destructive method in standing trees: A first survey in Italy. iForest-Biogeosci. For. 2017, 10, 700–706. [Google Scholar] [CrossRef]
- Allison, R.B.; Wang, X.; Senalik, C.A. Methods for Nondestructive Testing of Urban Trees. Forests 2020, 11, 1341. [Google Scholar] [CrossRef]
- Wang, X.; Divos, F.; Pilon, C.; Brashaw, B.K.; Ross, R.J.; Pellerin, R.F. Assessment of Decay in Standing Timber Using Stress Wave Timing Non-Destructive Evaluation Tools: A Guide for Use and Interpretation; General Technical Report (GTR), FPL-GTR-147; Department of Agriculture, Forest Service, Forest Products Laboratory: Madison, WI, USA, 2004. [Google Scholar]
- Wang, X.; Ross, R.J.; Carter, P. Acoustic Evaluation of Wood Quality in Standing Trees: Part 1. Acoustic Wave Behavior in Standing Trees. Wood Fiber Sci. 2007, 39, 28–38. [Google Scholar]
- Moore, J.; Lyon, A.J.; Ridley-Ellis, D.; Gardiner, B.A. Properties of UK-grown Sitka spruce: Extent and sources of variation. In Proceedings of the 10th World Conference on Timber Engineering, Miyazaki, Japan, 2–5 June 2008. [Google Scholar]
- Yin, Y.; Nagao, H.; Liu, X.; Nakai, T. Mechanical properties assessment of Cunninghamia lanceolata plantation wood with three acoustic-based nondestructive methods. J. Wood Sci. 2010, 56, 33–40. [Google Scholar] [CrossRef]
- Gonçalves, R.; Bertoldo, C.; Massak, M.V.; Batista, F.; Secco, C.B. Velocity of ultrasonic waves in live trees and freshly-felled logs. Wood Fiber Sci. 2011, 43, 232–235. [Google Scholar]
- Gonçalves, R.; Bertoldo, C.B.; Massak, M.V. Acoustic and bending properties in Pinus elliottii beams obtained from trees of different ages. J. Wood Sci. 2013, 59, 127–132. [Google Scholar] [CrossRef]
- Bertoldo, C.; Gonçalves, R. Influence of measurement position, tree diameter, and bulk wood density on models that predict wave propagation velocity in logs according to the velocity in trees. For. Prod. J. 2015, 65, 166–172. [Google Scholar] [CrossRef]
- UNE-EN 56528; Physical-Mechanical Properties of Wood. Preparation of Specimens for Testing. AENOR: Madrid, Spain, 1978; p. 3.
- UNE-EN 408:2011+A1:2012; Timber Structures. Sawn and Glued Laminated Timber for Structural Use. Determination of some Physical-Mechanical Properties. AENOR: Madrid, Spain, 2011; p. 10.
- UNE-EN 56537; Physical-Mechanical Properties of Wood. Determination of Strength Against Static Flexion. AENOR: Madrid, Spain, 1979; p. 2.
- UNE-EN 56535; Physical-Mechanical Properties of Wood. Determination of Axial Compression Strength. AENOR: Madrid, Spain, 1977; p. 2.
- UNE-EN 28012 h8; Woods Used in Aircraft. Axial Traction Test. AENOR: Madrid, Spain, 1955; p. 2.
- UNE-EN 384:2016+A1; Madera estructural. Determinación de los Valores Característicos de Las Propiedades Mecánicas Y La Densidad. AENOR: Madrid, Spain, 2020; p. 23.
- Bucur, V. Acoustics of Wood, 2nd ed.; Springer: Berlin, Germany, 2006; p. 393. [Google Scholar]
- Íñiguez, G. Clasificación Mediante Técnicas no Destructivas Y Evaluación de las Propiedades Mecánicas de la Madera Aserrada de Coníferas de Gran Escuadría Para Uso Estructural. Ph.D. Thesis, Universidad Politécnica de Madrid, Madrid, Spain, 2007. [Google Scholar]
- Balmori, R.J.A.; Acuña, R.L.; Basterra, O.L.A. Estudio de la influencia de la dirección de la fibra en la velocidad de propagación de ultrasonidos (FAKOPP) en madera estructural de “Pinus Sylvestris L. ” y “Pinus Radiata D. Don.”. In Proceedings of the Congreso Euro-Americano REHABEND, Burgos, Spain, 24–27 May 2016. [Google Scholar]
- Bertoldo, C. Propriedades de Resistência E de Rigidez da Madeira Obtidas a Partir da Avaliação Acústica na Árvore [Predicting of Strength and Stiffness of Wood Using Acoustic Measurement in Trees]. Ph.D. Thesis, Universidade Estadual de Campinas, São Paulo, Brazil, 2014. [Google Scholar]
- De Oliveira, F.G.R.; Candian, M.; Lucchette, F.F.; Salgon, J.L.; Sales, A. Moisture content effect on ultrasonic velocity in Goupia glabra. Mater. Res. 2005, 8, 11–14. [Google Scholar] [CrossRef]
- Gonçalves, R.; da Leme, C.O.A. Influence of moisture content on longitudinal, radial, and tangential ultrasonic velocity for two Brazilian wood species. Wood Fiber Sci. 2008, 40, 580–586. [Google Scholar]
- Moreno-Chan, J.; Walker, J.C.; Raymond, C.A. Effects of moisture content and temperature on acoustic velocity and dynamic MOE of radiata pine sapwood boards. Wood Sci. Technol. 2011, 45, 609–626. [Google Scholar] [CrossRef]
- Wang, X. Stress Wave E-Rating of Structural Timber—Size and Moisture Content Effects. In Proceedings of the 18th International Nondestructive Testing and Evaluation of Wood Symposium; General Technical Report FPL-GTR-226; Madison, WI, USA, 24–27 September 2013; Department of Agriculture, Forest Service, Forest Products Laboratory: Washington, DC, USA, 2013; pp. 38–46. [Google Scholar]
- Argüelles, R.; Arriaga, F.; Esteban, M.; Iñiguez, G.; Argüelles, R. Estructuras de Madera Bases de Cálculo, 1st ed.; AITIM: Madrid, Spain, 2013; pp. 30–40. [Google Scholar]
- Montero, M.J.; Mata, J.D.; Esteban, M.; Hermoso, E. Influence of moisture content on the wave velocity to estimate the mechanical properties of large cross-section pieces for structural use of Scots pine from Spain. Maderas Cienc. Tecnol. 2015, 17, 407–420. [Google Scholar] [CrossRef]
- Vignote Peña, S. Principales Maderas de Frondosas de España. Características, Tecnología Y Aplicaciones; Monograph (Technical Report); Universidad Politécnica de Madrid: Madrid, Spain, 2014. [Google Scholar]
- Vignote Peña, S.; Jiménez, F.J. Tecnología de La Madera; Mundi-Prensa: Madrid, Spain, 1996; p. 602. [Google Scholar]
- Esteban, H.M. Determinación de la Capacidad Resistente de la Madera Estructural de Gran Escuadría y Su Aplicación en Estructuras Existentes de Madera de Conífera. Ph.D. Thesis, Universidad Politécnica de Madrid, Madrid, Spain, 2003. [Google Scholar]
- Arriaga, F.; Íñiguez, G.; Esteban, M.; Fernandez-Golfin, J. Structural Tali timber (Erythrophleum ivorense A. Chev., Erythrophleum suaveolens Brenan.): Assessment of strength and stiffness properties using visual and ultrasonic methods. Eur. J. Wood Wood Prod. 2006, 64, 357–362. [Google Scholar] [CrossRef]
- Hermoso, E.; Fernández-Golfín, J.I.; Díez, M.R.; Mier, R. Aplicación de los ultrasonidos a la evaluación de las propiedades mecánicas de la madera en rollo de pequeño diámetro. Inf. Constr. 2007, 59, 87–95. [Google Scholar] [CrossRef]
- Carballo, J.; Hermoso, E.; Fernández-Golfín, J.I. Comparación de la evaluación y clasificación mecánica del Pinus pinaster Ait. con dos equipos de ultrasonidos. In Proceedings of the 5° Congreso Forestal Español, Ávila, Spain, 21–25 September 2009. [Google Scholar]
- Vega, A.; Dieste, A.; Guaita, M.; Majada, J.; Baño, V. Modelling of the mechanical properties of Castanea sativa Mill. structural timber by a combination of non-destructive variables and visual grading parameters. Eur. J. Wood. Prod. 2012, 70, 839–844. [Google Scholar] [CrossRef]
- Vázquez, C.; Gonçalves, R.; Bertoldo, C.; Baño, V.; Vega, A.; Crespo, J.; Guaita, M. Determination of the mechanical properties of Castanea sativa Mill. using ultrasonic wave propagation and comparison with static compression and bending methods. Wood Sci. Technol. 2015, 49, 607–622. [Google Scholar] [CrossRef]
- Llana, D.F.; Short, I.; Harte, A.M. Use of non-destructive test methods on Irish hardwood standing trees and small-diameter round timber for prediction of mechanical properties. Ann. For. Sci. 2020, 77, 1–13. [Google Scholar] [CrossRef]
- Ross, R.J. Nondestructive Evaluation of Wood, 2nd ed.; General Technical Report FPL-GTR-238; USDA Forest Service: Washington, DC, USA, 2015; p. 169. [Google Scholar]
- Lam, F.; Varoğlu, E. Effect of length on the tensile strength of lumber. For. Prod. J. 1990, 40, 37–42. [Google Scholar]
- Wang, X.P.; Ross, R.J.; Brashaw, B.K.; Punches, J.; Erickson, J.R.; Forsman, J.W.; Pellerin, R.F. Diameter effect on stress-wave evaluation of modulus of elasticity of logs. Wood Fiber Sci. 2004, 36, 368–377. [Google Scholar]
- Divos, F.; Denes, L.; Iñiguez, G. Effect of cross-sectional change of a board specimen on stress wave velocity determination. Holzforschung 2005, 59, 230–231. [Google Scholar] [CrossRef]
- Rello, L.A.; Barra, R.D.; Sanz, M.C.; Fernández, A.L.; Sánchez, T.L.; Blázquez, L.M.; Otero, A.B.; Ganga, E.R.; Ramón, G.C. La transmisión de ultrasonidos aplicada a la madera estructural. In Proceedings of the Congreso Iberoamericano de Productos Forestales-Iberomadera, Buenos Aires, Argentina, 3–5 July 2007. [Google Scholar]
- Wang, X. Effects of size and moisture on stress wave E-rating of structural lumber. In Proceedings of the 10th World Conference on Timber Engineering, Miyazaki, Japan, 2–5 June 2008. [Google Scholar]
- Trinca, A.J.; Gonçalves, R. Efeito das dimensões da seção transversal e da frequência do transdutor na velocidade de propagação de ondas de ultra-som na madeira. Rev. Árvore 2009, 33, 177–184. [Google Scholar] [CrossRef] [Green Version]


Publisher’s Note: MDPI stays neutral with regard to jurisdictional claims in published maps and institutional affiliations. |
© 2022 by the authors. Licensee MDPI, Basel, Switzerland. This article is an open access article distributed under the terms and conditions of the Creative Commons Attribution (CC BY) license (https://creativecommons.org/licenses/by/4.0/).