Abstract
The net primary productivity (NPP) of forest ecosystems is an important factor for understanding the carbon budget of forest ecosystems. There have been many studies on the spatialtemporal characteristics and change trends of the NPP in southwest areas based on observation and remote sensing models. A comprehensive view of the overall state of the research on the carbon budget and a deeper exploration of its laws and effects are needed to reach a clear conclusion and accurately assess the NPP of forests in southwest China. Therefore, in this paper, we aim to highlight the relevant achievements in the study of the NPP of forest ecosystems, to summarize the research progress and spatial–temporal distribution law of the estimation of the NPPs of forest ecosystems, to analyse the relationship between the NPP and climate factors (such as temperature, precipitation and VPD), and to identify the main unsolved issues and suggest directions for future research. Our summary is expected to serve as a reference for forest ecosystem carbon budget management in the southwest and as a starting place for further research, and to promote the realization of the “double carbon” goal.
1. Preface
Forests are an important part of terrestrial ecosystems and the main contributor to carbon sequestration. Their annual average carbon sequestration accounts for approximately 80% of total value for the whole terrestrial ecosystem in China [1]. They play an important role in achieving carbon neutrality in China. With the continuous improvement of forest quality, the net primary productivity (NPP) and carbon sink growth potential of forests are large [2]. Net ecosystem carbon exchange (NEE) can be defined as the difference between ecosystem NPP and its heterotrophic respiration (Rh), so the growth of NPP can reflect the growth of the carbon sink to a certain extent. Currently, China’s forest total carbon sequestration amount is 434 million tons per year, equivalent to 1.591 billion tons of CO2, according to the report of the “China carbon emission network” (http://www.forestry.gov.cn/ (accessed on 14 March 2021)). In 2018, China’s CO2 emissions were 10 billion tons, and the amount of CO2 absorbed by forests reached 15.91% in the same period, contributing greatly to carbon sequestration. This will play an important role in China’s efforts to reach the peak value of carbon dioxide emissions by 2030 and achieve carbon neutralization by 2060.
The NPP of ecosystems refers to the net content of dry organic matter produced by vegetation [3]; it is the difference between the total amount of organic matter produced by vegetation photosynthesis and the amount of organic matter consumed by autotrophic respiration (Figure 1). NPP represents the ability of vegetation to fix carbon. It is the ability of vegetation to use sunlight for photosynthesis (sunlight + inorganic matter + H2O + CO2→ heat + O2 + C organic) and to fix and convert inorganic carbon (CO2) into organic carbon. It is an important part of the carbon cycle. Changes in climate and other factors have a great impact on NPP. Precipitation, temperature, CO2 concentration and changes in land cover affect physiological activities such as plant transpiration, photosynthesis and respiration, which causes changes in the NPP of terrestrial ecosystems and affects their carbon balance [4].
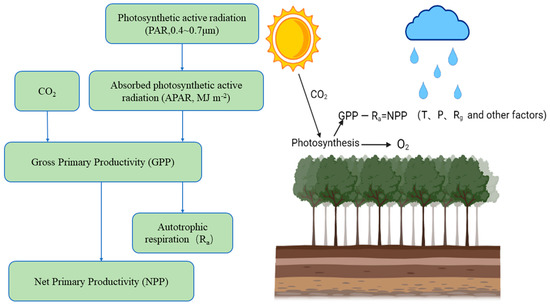
Figure 1.
NPP mode diagram. Solar radiation irradiates vegetation and is absorbed and reflected. The vegetation fixes CO2 as organic carbon through photosynthesis (the fixed amount of CO2 is usually expressed by the total primary productivity (GPP) minus the organic carbon consumed by autotrophic respiration (Ra), which is NPP). This process is affected by temperature (T) and precipitation (P), as well as the joint influence of climate factors such as radiation (Rg) and other environmental factors (topography, soil nutrients, CO2).
Southwest China is the second largest forest region in China [5] and contains the largest and most typical karst forest in the country. Rain–heat synchronization, afforestation, the binary three-dimensional geological structure and large-area-distributed carbonate rocks are features of karst areas that form a unique carbon cycle and create a huge carbon sink potential; these areas play an important role in the regional and global carbon cycles [6,7]. Based on the forest resources inventory data from 1989 to 2019 (the 4th to the 9th forest resources inventory) and the average biomass of the forest stand studied by Fang [8], it is calculated that the forest carbon reserves in the southwest forest area have increased by 0.95 PG, the annual change rates of forest area, stock density and biomass conversion ratio are 1.79%, 0.07 and −0.05%, respectively, and the net increase of biomass carbon is 1.81%, which is equivalent to 31.95 Tg per year, [9]. However, with serious water and soil loss and rocky desertification the environment has become sensitive and fragile, so karst areas have become one of the most vulnerable ecological areas in China [10]. The delicate ecological environment and frequent human activities make it difficult to restore the vegetation in the karst area once it is damaged; the damage affects ecosystem services and other functions and leads to fluctuations in the carbon sequestration and sink enhancement capacity in the area. Therefore, combining, analyzing and summarizing the research regarding forest NPP in karst areas is of great importance for improving the estimation accuracy and assessment of carbon storage and sequestration potential in this area.
Therefore, we systematically review the research progress of NPP based on the collation and summary of the literature, with the following aims: (1) to review the observation methods for forest ecosystem NPP and compare their advantages and disadvantages and (2) to summarize the spatiotemporal change trend of forest ecosystem NPP in karst areas and its response to climate change to comprehensively understand these spatiotemporal characteristics, promote an in-depth understanding of forest ecosystem NPP in karst areas and help achieve carbon peaks and carbon neutralization.
2. Research Progress on NPP in Karst Areas of Southwest China
2.1. Overview of NPP Research Models
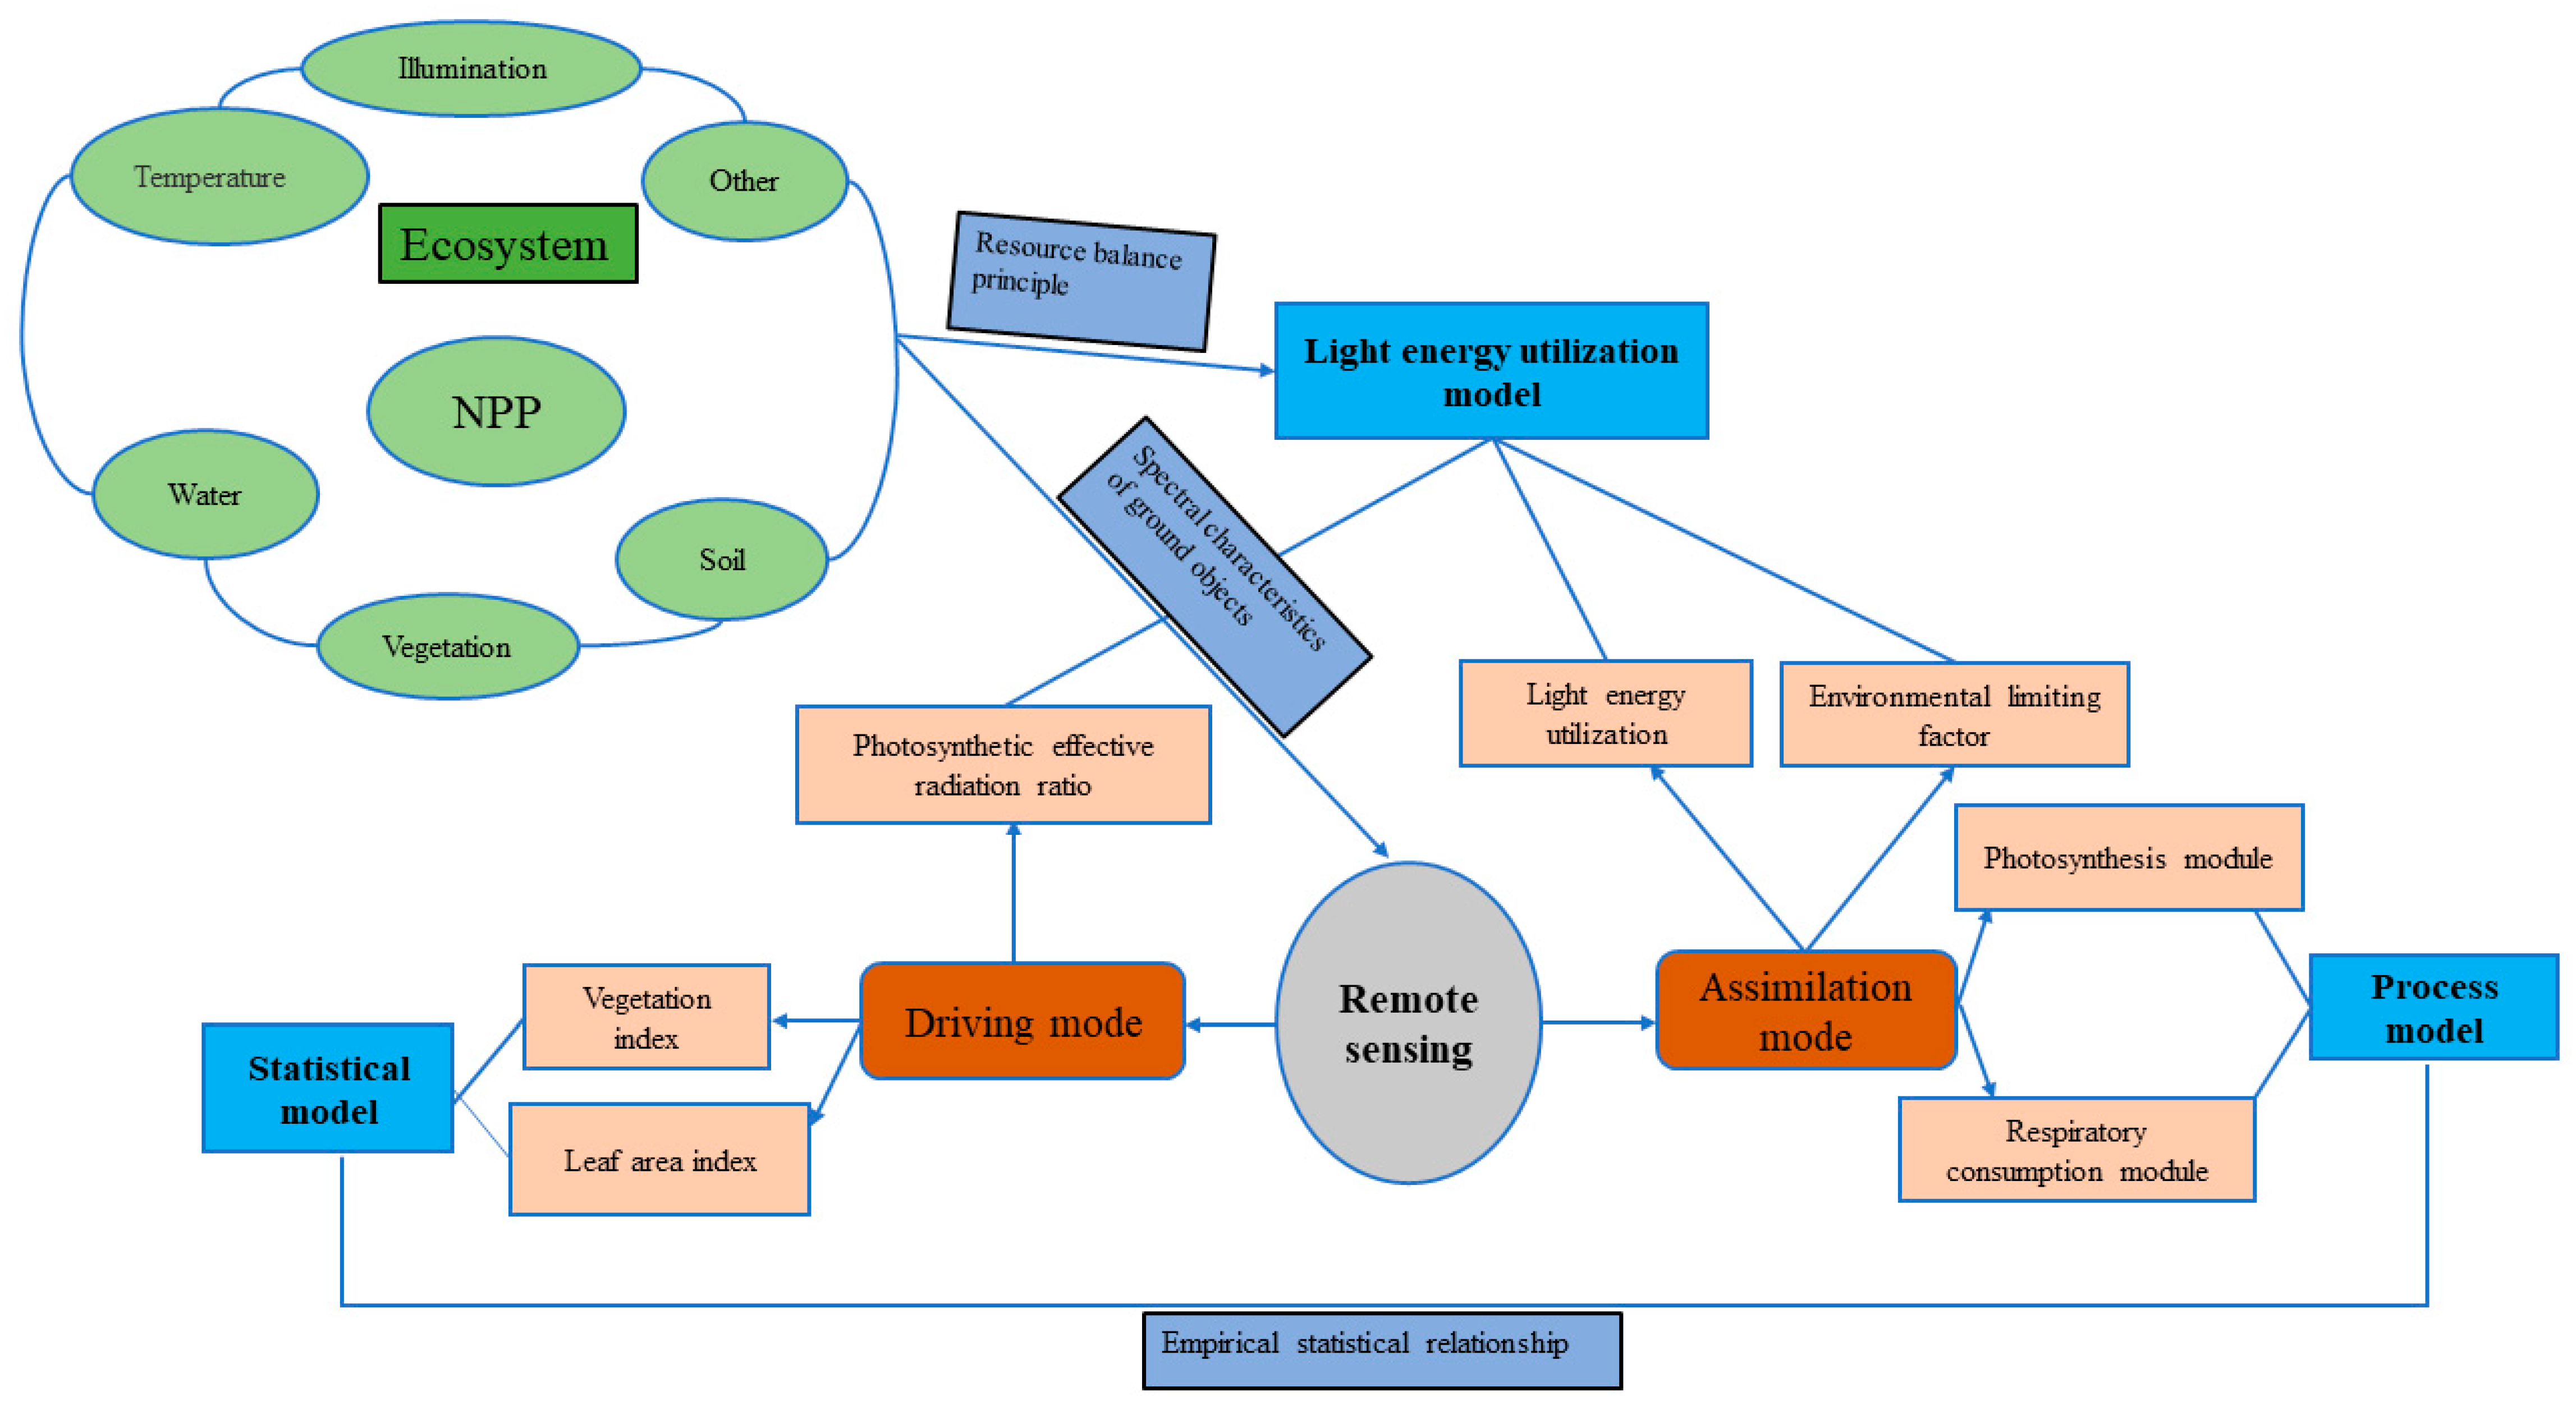
Currently, NPP research methods are mainly divided into two classes: field investigation/observation and model estimation. Methods developed in the early stages of station observation, such as the sample land inventory method (direct harvesting method, etc.), aerodynamics method, biological investigation method and Eddy Covariance Technique (EC method), can directly or indirectly obtain high-precision sample NPP and provide basic parameters and verification data for the construction of an estimation model; obtaining NPP results in large areas is a challenge for these methods [11]. The model estimation methods used to estimate large-scale NPP developed rapidly in the late 20th centuryand can be classified into three main categories: statistical models, process models and light energy utilization models. The NPP process of forest ecosystems is complex and is jointly affected by natural and human factors; the development of NPP estimation models faced major bottlenecks in terms of theory and technology [12]. At the beginning of the 21st century, with the rapid development of remote sensing technology, large-scale and high-resolution remote sensing data became available, providing favorable conditions for the quantitative creation of the spatial–temporal features of the light energy utilization model (parameter model); it became widely used as the main method for simulating and estimating large-scale and even global NPP. Based on the respective advantages of remote sensing observations and model simulations, researchers have proposed an observation method combining plant growth models and remote sensing models, in which the remote sensing models directly drive the plant growth models, remote sensing observations and plant growth model simulation assimilation methods (Figure 2) [13].
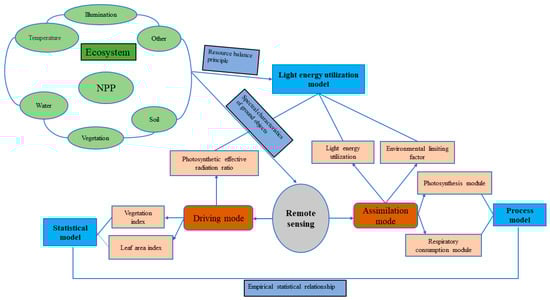
Figure 2.
Typical process of remote sensing data intervention in NPP estimation model (adapted from Hong [11]).
2.1.1. Field Observation Method
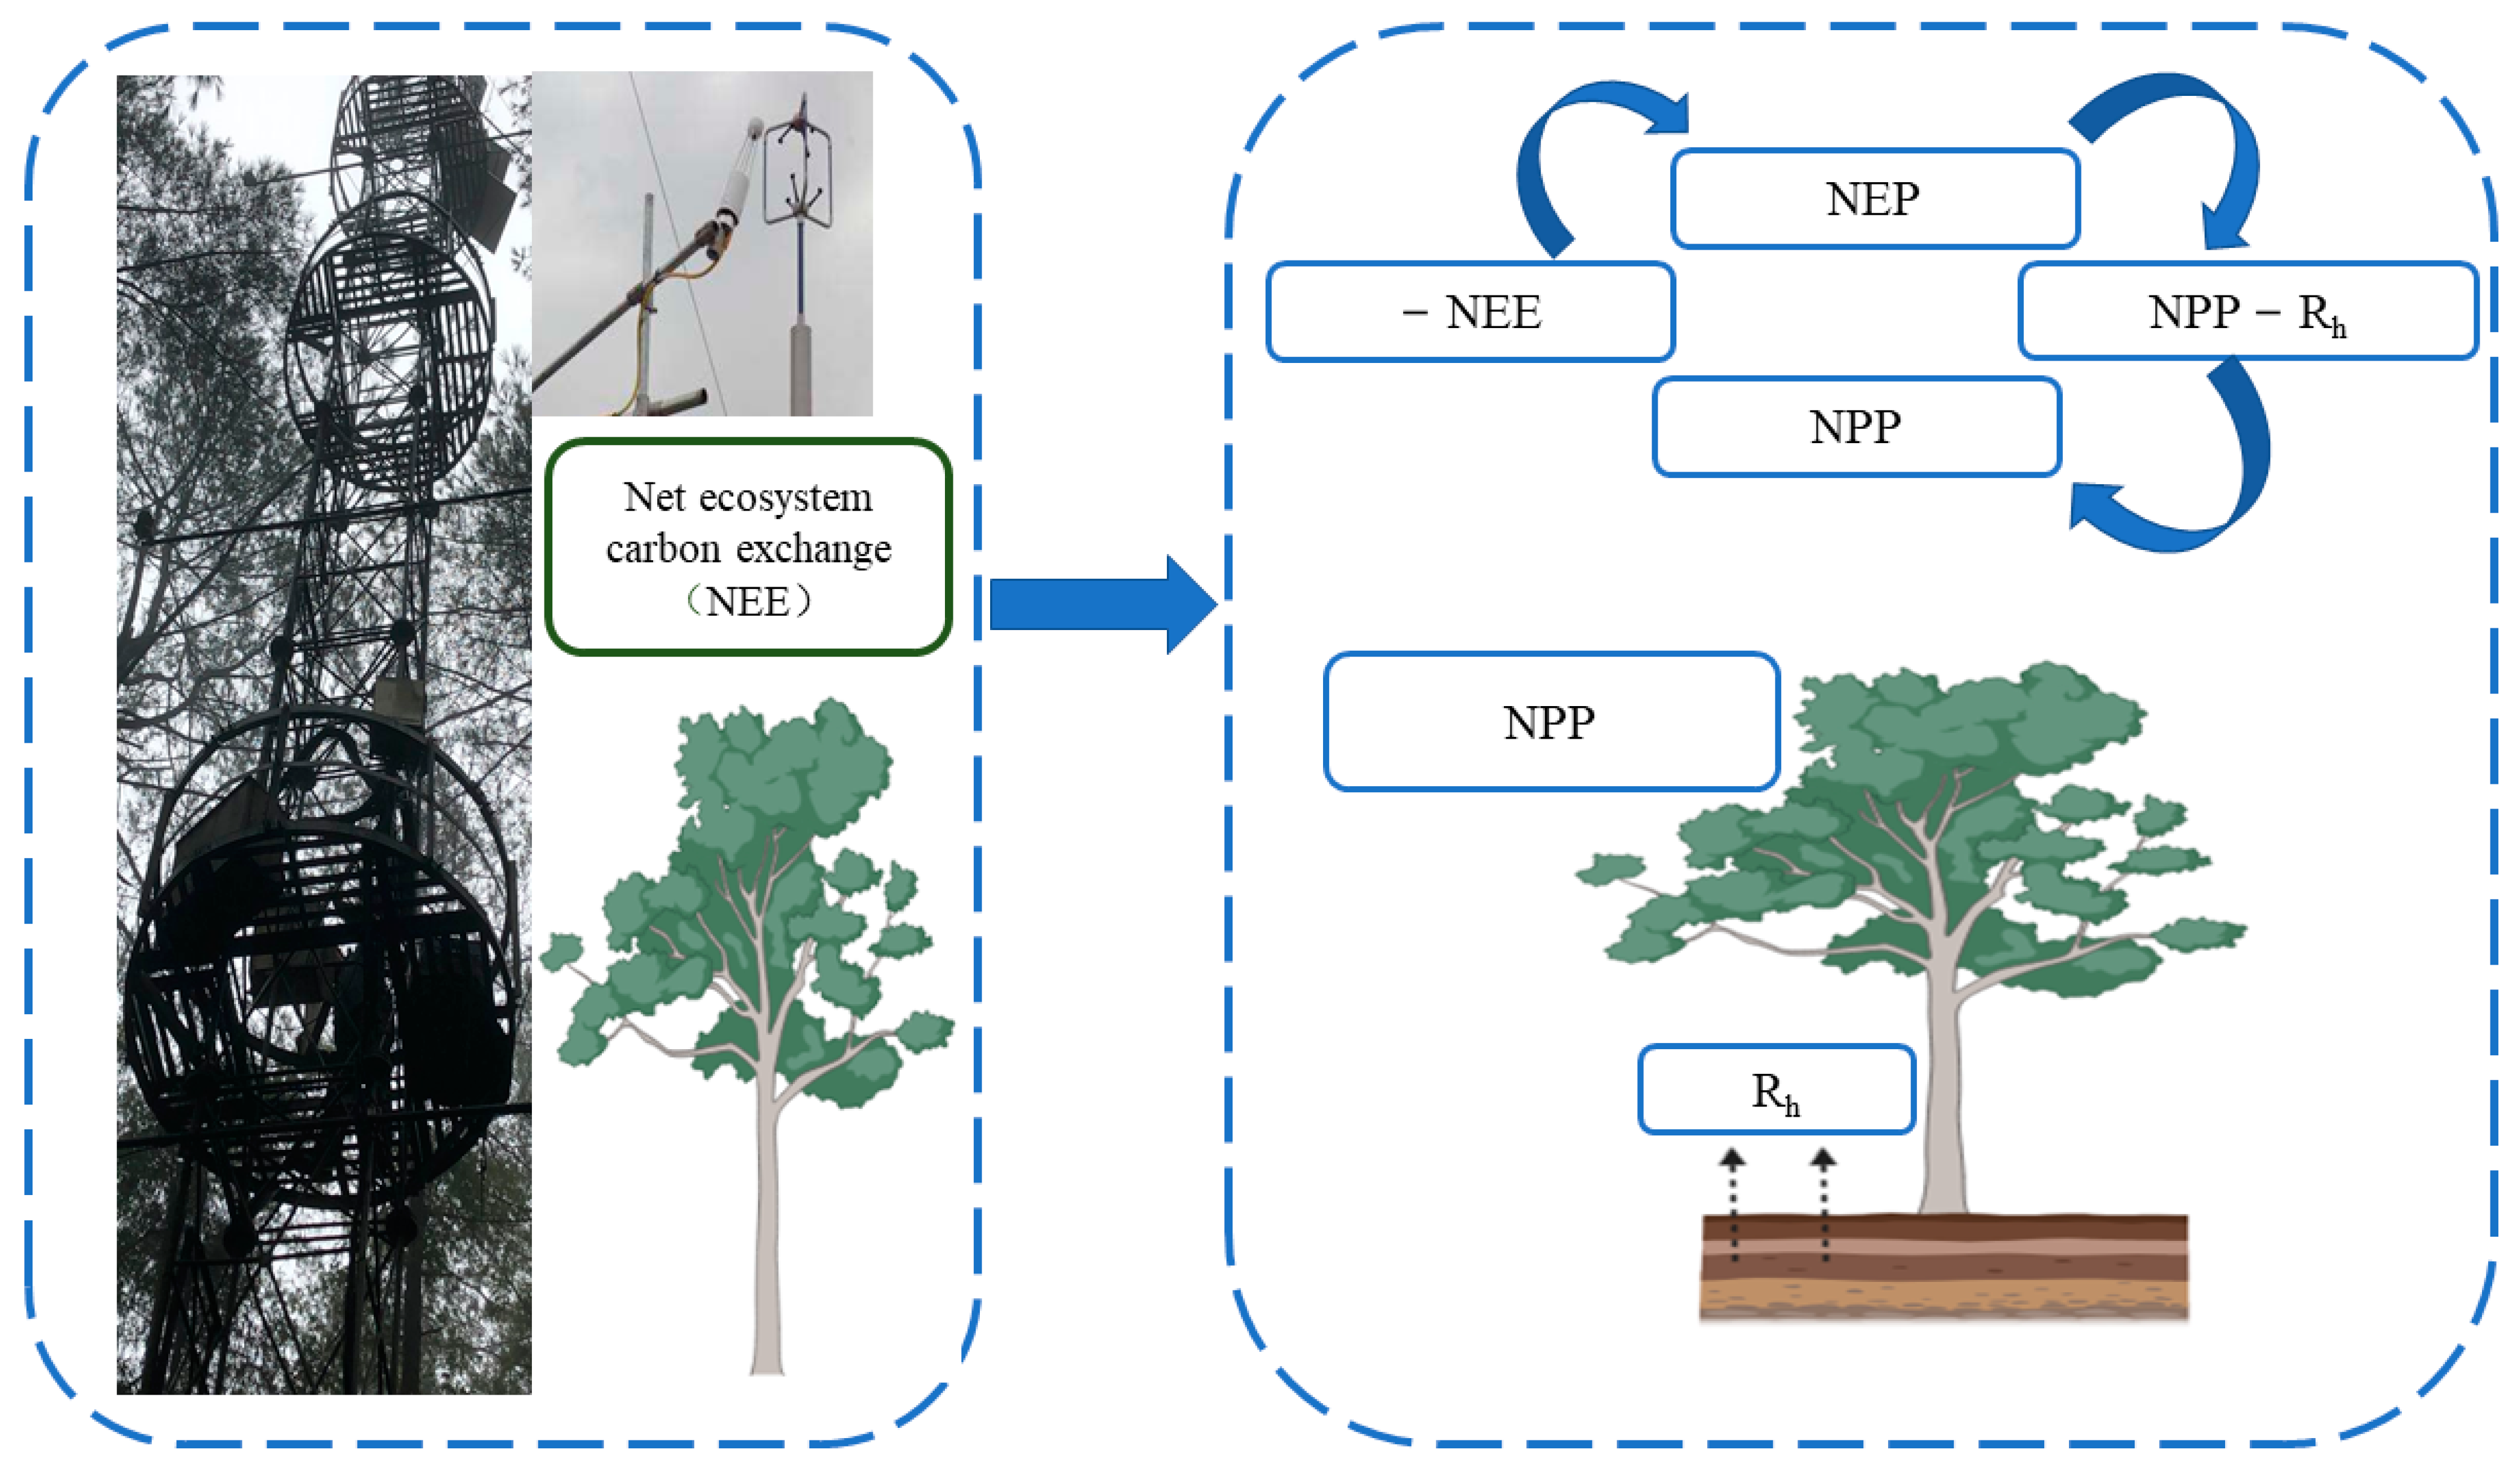
The study of NPP at the ecosystem scale is mainly realized by field observation methods (field investigation method and Eddy Covariance Technique (EC method)). In the field survey method, the biomass of vegetation is estimated on the sample plot/site scale and then the value is extrapolated to the watershed scale. The data sources required by this method include the forest resource inventory data of the site or measured biomass (volume) sample plot data published in the literature, such as the work of Fang [14], which is based on continuous forest resource inventory data and in which the change in wood volume is calculated. Then, the change in forest biomass carbon storage is derived from the biomass conversion equation. Another widely used NPP observation method is the EC method, which uses the micro meteorological principle to estimate the covariance of vertical wind speed and material or energy fluctuation to directly measure the energy and material exchange flux between the vegetation canopy and the atmosphere [15]. Therefore, this method can obtain NEE values and indirectly obtain NPP values through the relationship between NEE and NPP (Figure 3). The EC method has developed into an international standard method for flux observation. Compared with conventional observation methods, it has the following main advantages: the net exchange of ecosystems measured by vorticity correlation technology is based on the integration of the whole ecosystem and atmospheric material and energy exchange [16], and it can realize long-term continuous positioning observation of ecosystem carbon flux on a fine time scale, which is helpful for understanding the response of the carbon cycle process to environmental change and its mechanism [17]. The main limitation is that forest ecosystem flux observation stations are often set in areas with little human impact, which makes it difficult to account for the differences in forest age and ecosystem heterogeneity, resulting in deviation in regional-scale carbon sink deduction results [17]. Due to the large uncertainty of current remote sensing observations and model fitting methods in productivity estimation, long-term flux observation data have been used in many studies to verify these results or for model parameterization [15].
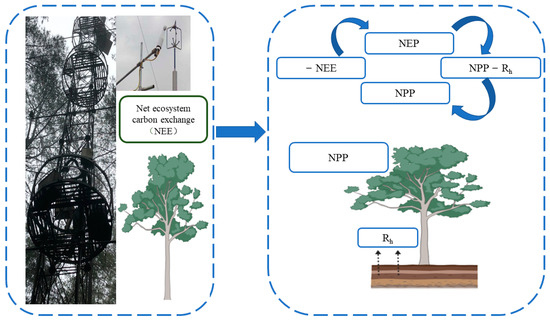
Figure 3.
The Eddy Covariance Technique is converted to an NPP schematic diagram after measuring NEE. Net primary ecosystem productivity (NEP) can be obtained by directly measuring the NEE value in the vorticity correlation system, and NEP is the difference between NPP and heterotrophic respiration (Rh). Therefore, the NPP value can be obtained by measuring NEE and heterotrophic respiration (Rh).
2.1.2. Statistical Model
The basic principle of the statistical model, also known as the climate-related model, is to construct a statistical relationship based on remote sensing data and vegetation productivity data observed on the ground, which is used to estimate regional vegetation productivity. This kind of model is based on the principle of correlation between environmental factors and plant growth, includes climate factors such as precipitation and temperature as driving factors and establishes a simple statistical regression model between climate factors and NPP to estimate the potential productivity of vegetation. Its representative models are the Miami model, Thornthwaite Memorial model, Chikugo model and Integrated model (Table 1).

Table 1.
Statistical model representative models and their expressions. Please see more details of “Reference” in Appendix A.
The Miami model is one of the earliest empirical models to estimate the NPP of global vegetation. It is a model based on site measurements and the relationship between annual precipitation and annual average temperature is fitted. The results obtained have been used as a benchmark data set [22]. However, the NPP of vegetation is also affected by other climatic factors, and the reliability of the estimated results of this model is only 66% to 75% [23]. Based on the Miami model, the Thornthwaite memorial model considers the role of evapotranspiration and links NPP with the annual average evapotranspiration. Because evapotranspiration is affected by various climatic factors and has a certain relationship with photosynthesis, the estimation of NPP using this model is more reliable. However, both the Thornthwaite memorial model and the Miami model are empirical factor statistical models that lack a theoretical basis. The Chikugo model accounts for physiological information regarding vegetation and uses information such as radiation dryness and net radiation. It is a semi-empirical and semi-theoretical NPP estimation model. However, the model is based on the condition that the soil water supply is sufficient, so the estimated NPP is actually the potential or maximum NPP, which may be different from the real-world situation. Additionally, the model does not include the vegetation information from grasslands and deserts. Zhouguangsheng established a more comprehensive model (the natural vegetation NPP model) with a theoretical basis similar to that of the Chikugo model, accounting for the physiological and ecological characteristics of plants, combined with the energy balance and water balance equations, including biomass data for 23 natural vegetation ecosystems, such as forests, grasslands and deserts and the corresponding meteorological data. The model is based on the actual evapotranspiration, which is closely related to vegetation photosynthesis. The interaction between climate and ecological factors is comprehensively considered [21]. In a comparison of the models based on applications, this model was superior to the Chikugo model, especially in arid and semi-arid areas. In addition, there is another model: semi-empirical model. These models are of a statistical nature and reflect regional peculiarities of forest growth and productivity under definite (assuming stable) environmental conditions. This method is based on snapshot or periodic measurement of stand biological characteristics on the sampled plot and uses regression analysis to establish the relationship between average height (H) and average diameter (d), basal area (BA), growth stock (GS) and total yield (TP), and can include the impact of environmental factors on it [24]. However, this model cannot predict the future changes of NPP.
When physiological knowledge of vegetation was lacking, statistical models were widely used because of their simplicity, intuitiveness, ease of implementation and small number of required parameters. They have often been used to describe vegetation on regional and even global scales [25]. However, climate-related models consider fewer climate factors and lack the theoretical basis of physiology and ecology, and the statistical laws obtained in different regions and conditions lack universality.
2.1.3. Process Model
A process model is a kind of model that simulates vegetation processes such as growth (including photosynthesis, respiration, etc.), individual-level dynamics and ecosystem functions [26]; it is also called the biogeochemical model. Based on the plant physiological and ecological processes of different ecosystems, such models are established to calculate ecosystem NPP by simulating vegetation photosynthesis, respiration, transpiration and soil microbial decomposition processes, combined with meteorological, soil and plant physiological parameters [27,28]. The NPP of vegetation can be estimated accurately, and the impact of global change on vegetation productivity can be predicted. The representative models are the terrestrial ecosystem model (TEM) [29], Biome-BGC model [30] and Vegetation-Ecosystem Modelling and Analysis Project (VEMAP) model [31]. The TEM model is a dynamic simulation model based on ecosystem processes and is one of the earliest biogeochemical models. The model estimates ecosystem NPP based on information regarding spatially distributed climatic conditions, altitude, soil type, vegetation and water. Its temporal resolution is 1 month, and its spatial resolution is 0.5°. The Biome-BGC model can simulate biogeochemical models of vegetation, litter, soil water, carbon and nitrogen storage and flux on different ecosystem scales (local ecosystem, regional ecosystem, global ecosystem) [32]. The model includes complete physiological and ecological parameters relevant for forest, shrub, grassland and other biological communities. However, there are still some limitations in the application of this model in mixed forests and other multiple vegetation areas. The VEMAP model mainly considers the processes of photosynthesis, growth and maintenance respiration, evaporation and transpiration of water, absorption and release of carbon and nitrogen, distribution of photosynthetic products, decomposition of litter and phenological changes. In addition to temperature and precipitation, the environmental factors used to drive the model also include solar radiation, CO2 concentration, soil texture, soil water holding capacity and wind speed.
Climate, soil and other factors are input factors for the process model, the processes of photosynthesis, respiration and soil microbial interaction in the ecosystem are simulated, and the exchange flux of greenhouse gases (CO2, CH4, N2O) between vegetation, soil and atmosphere are calculated. The model is based on a clear physiological and ecological mechanism and can reveal the ecosystem process and its interaction with the environment. In addition, it can be combined with the general circulation model (GCM) to study the impact of global change on the NPP of vegetation. However, the model relies on a large number of parameters, many of which are difficult to obtain with accuracy, greatly limiting the application of the model.
2.1.4. Light Energy Utilization Model
The light energy utilization model or light use efficiency model, also known as the parameter model, is based on light energy utilization theory and resource balance theory, which postulates that plants tend to adjust their own characteristics to adapt to environmental changes in ecological processes [33]. This kind of model focuses on the impact of the utilization rate of light energy absorbed by vegetation and photosynthetic effective radiation on the NPP of vegetation. Since light energy is the basic energy source of life on land, the NPP of the ecosystem is estimated by using the light and effective radiation (APAR) absorbed by plants and related regulatory factors [34]. The representative models are the CASA model, GLO-PEM model [35] and C-FIX model [36] (Table 2). The normalized difference vegetation index (NDVI) has become a widely used tool for estimating the proportion of solar radiation absorbed by leaves [37]. NDVI () is a metric of “vegetation greenness”, which is the sum of normalized differences between measured values of spectral reflectance in red and near-infrared bands. NDVI that has been integrated for more than one year has become a common substitute index for annual NPP. With the rapid development of remote sensing technology and the wide application of various spatiotemporal remote sensing data, the light energy utilization model based on remote sensing data has gradually become the mainstream method for estimating the NPP of vegetation [38].
Table 2.
Typical light energy utilization models and their advantages and disadvantages [39].
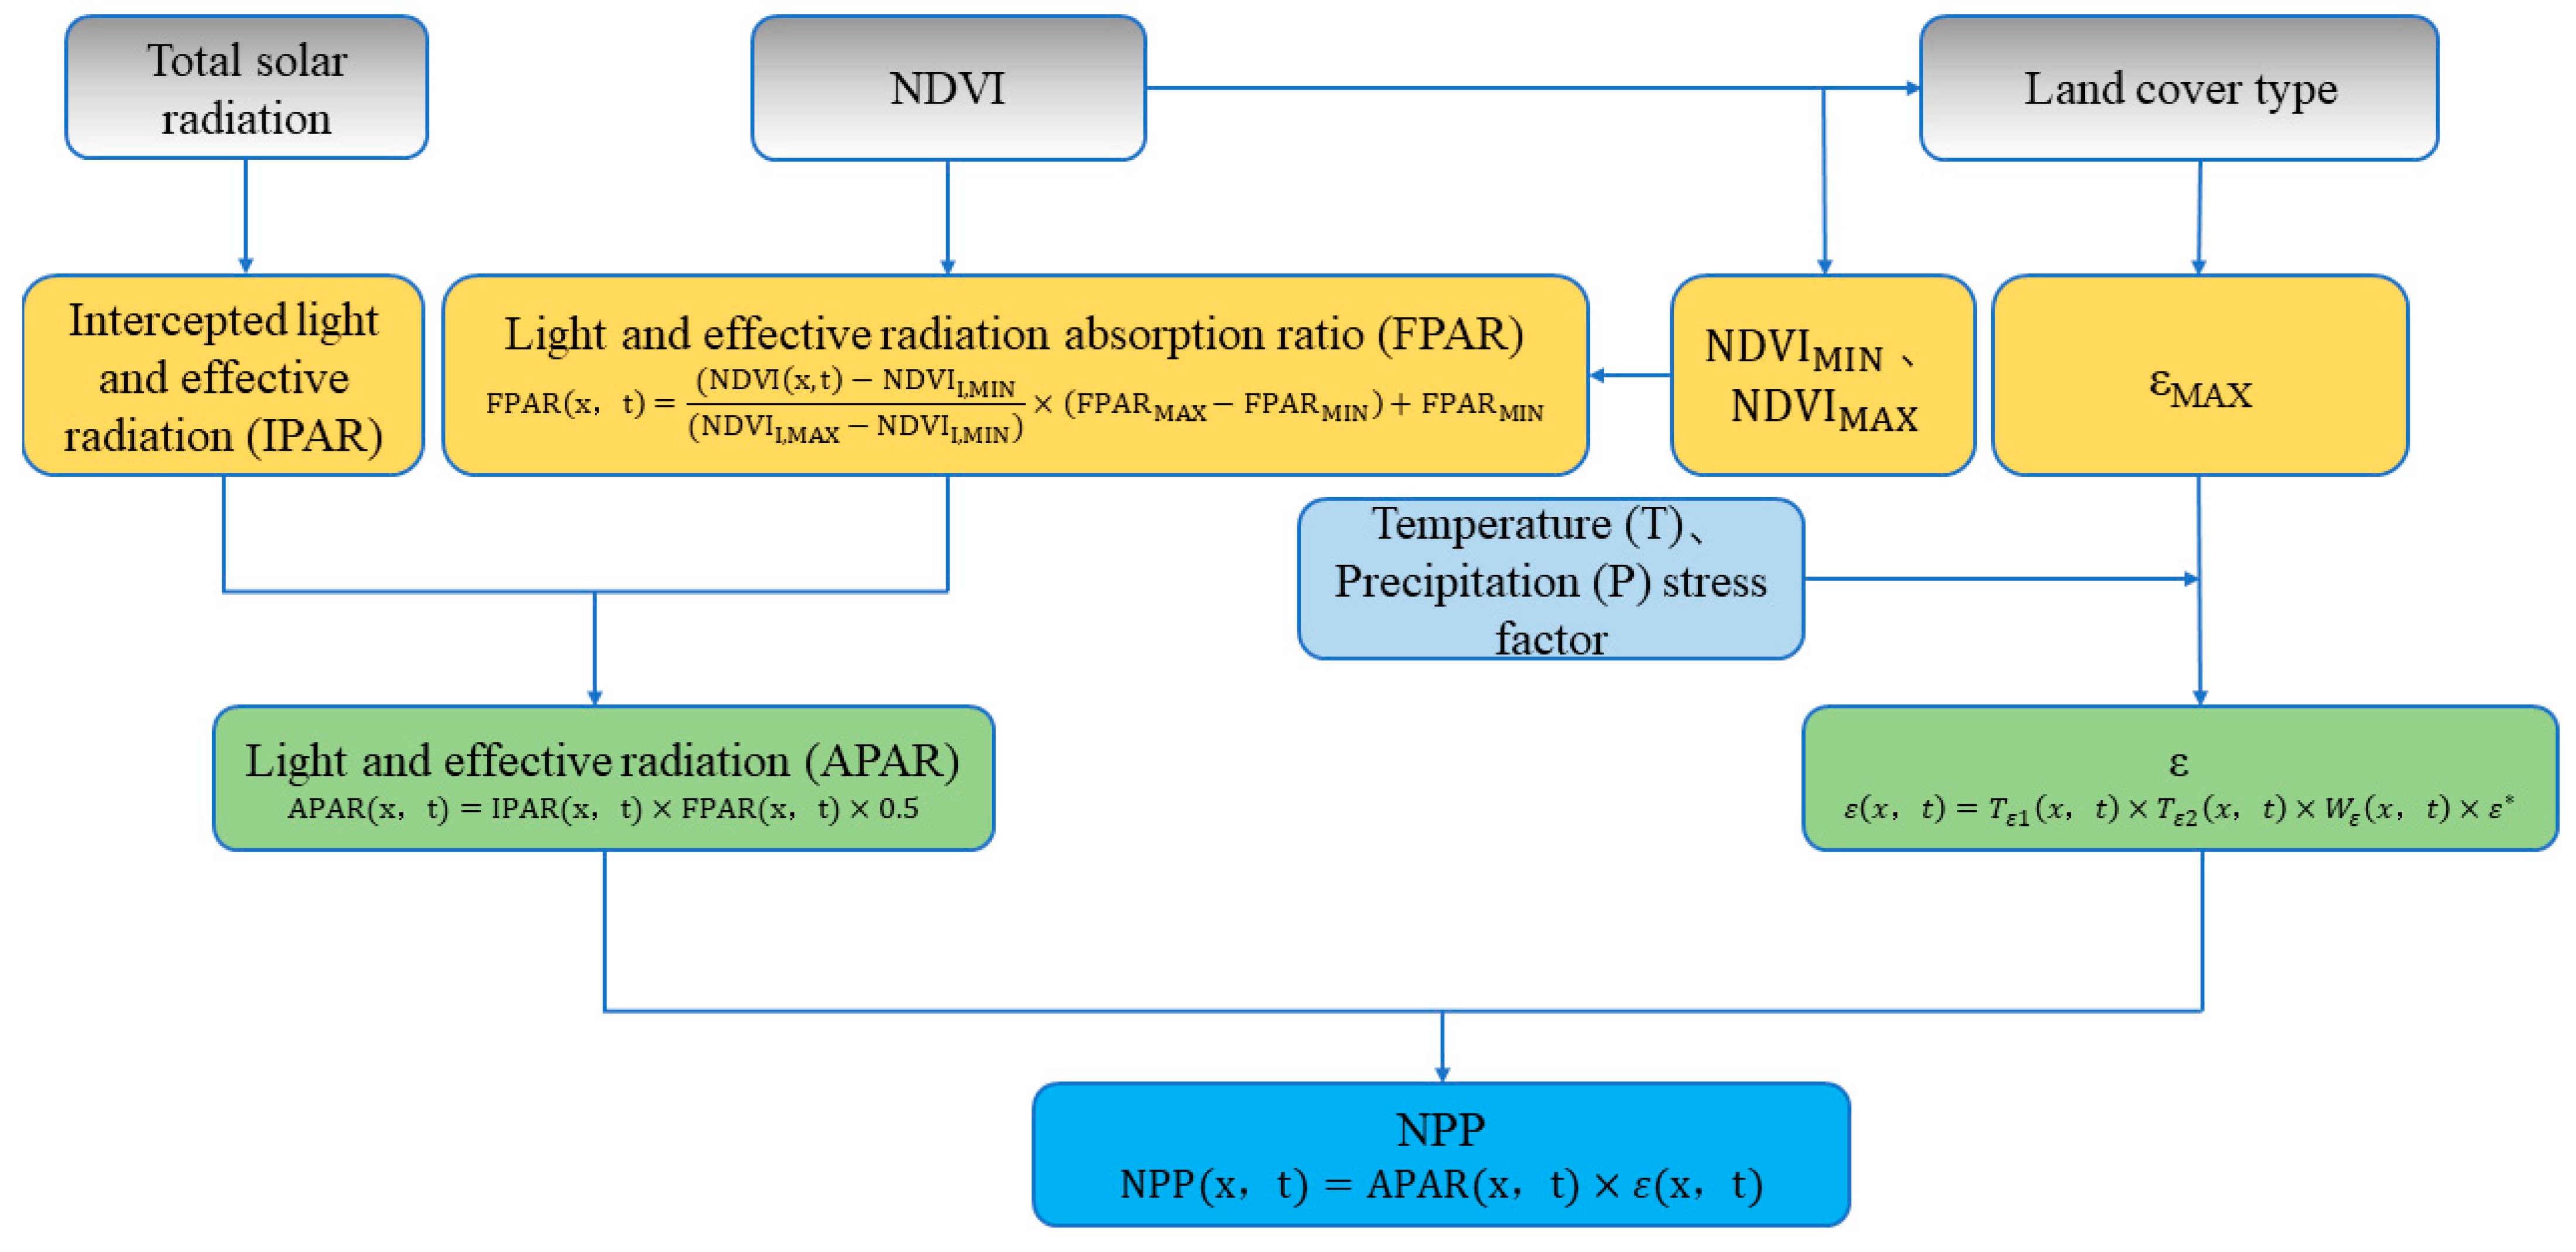
The Carnegie Ames Stanford Approach (CASA) model proposed by Potter effectively estimates the global NPP of vegetation [40]. The main input to the model are large-scale long-term remote sensing satellite data. In addition, the model takes full account of photosynthesis stress factors such as precipitation and temperature and is more suitable for monitoring the dynamic changes in the NPP of vegetation on a large scale [41]. The CASA model is the first light energy utilization model (PEM) to use light use efficiency (LUE) and has been widely applied [42]. The NPP calculation in the CASA model and the plant photosynthetic effective radiation (APAR) and actual light energy utilization (ε) are related (Figure 4).

Figure 4.
CASA model estimation NPP process (adapted from Zhu [43]). Please see more details of “Reference” in Appendix A.
The CASA model is generally accepted for use when running global NPP is 0.389 (gC·MJ−1). The annual APAR (MJ·m−2a−1) and annual average of typical forest vegetation types in China ε (gC·MJ−1) and annual NPP (gC·m−2·a−1) were simulated (Table 3).
Table 3.
Annual APAR (MJ·m−2a−1) and annual average of typical forest vegetation types in China ε (gC·MJ−1) and annual NPP (gC·m−2·a−1) [44].
The CASA model not only has a simple calculation formula but can also be used with remote sensing and extended to regional and even global scales. Temperature stress is calculated according to the optimal temperature of plant production, and water stress is estimated according to the comparison of water supply and potential evapotranspiration demand [42]. The model can also be used to analyze the seasonal and interannual changes in the NPP, so it has been widely implemented. For example, the CASA model-based NPP of vegetation in China in 1997 was 1.95 Pg C, representing approximately 4.0% of the world’s annual NPP of land vegetation at that time [44]. Dong used the improved CASA model to estimate the NPP value of vegetation in the karst area of southwest China and found that the NPP increased slightly from 1999 to 2003, but the spatial change was not significant [45]. In most studies, the NPP in the study area is estimated by optimizing the parameters of the traditional CASA model. Li estimated that the total NPP of the Hexi Corridor in 2015 was 34.29 Tg C/a based on the corrected CASA model, while the original CASA model overestimated the value t 0.23 Tg C/a [46]. Yan assimilated the synthetic NDVI and the land cover classification map extracted from its phenological information into the CASA model for synthetic NPP estimation. The results showed that the accuracy of comprehensive NPP estimation using non-fused NDVI data was better than that of NPP estimation. Improving the accuracy of land cover classification can improve the accuracy of comprehensive NPP estimation [47].
However, using the NDVI to calculate the NPP also has some limitations. In dense vegetation, the NDVI reaches saturation, resulting in similar NDVI values for forests with different NPP values [48]. Another problem is the presence of clouds, which distorts the measurement of reflectivity and may lead to the underestimation of the NPP in some tropical areas with dense cloud cover [49]. Finally, without the information of light use efficiency, pure NDVI cannot fully measure the proportion of photosynthetic effective radiation absorbed by leaves [50]. In the later developed radiative transfer model, near-infrared reflectance is more representative of fAPAR than NDVI, so a new index, namely, near-infrared reflectance of vegetation (NIRV), is calculated by multiplying the NDVI by NIR. This index is highly correlated with the NPP on a specific time scale [51]. Its advantage is that it can reduce the saturation of dense canopies and reduce the cross sensitivity to soil and atmospheric conditions. It can also measure the changes in the NPP in the short term [52].
In conclusion, it can be seen that the estimation of the NPP in forest ecosystems still requires long-term and systematic research. The light energy utilization model is widely applicable (Table 4). In recent years, Chinese scholars have further improved the remote sensing inversion algorithm of ecosystem productivity based on the light energy utilization model to improve the estimation accuracy of global and regional ecosystem productivity. For the estimation of forest ecosystem NPP, it is necessary to strengthen the research on the carbon cycle mechanism of different regions and types of forest ecosystems, realize the standardized measurement of biomass, and reduce the measurement error of surface biomass. Second, when constructing the model for estimating the NPP of forest ecosystems, the complexity of forest ecosystems must be considered, and the adaptability of existing models needs to be assessed and verified to reduce the uncertainty caused by model parameters and achieve the goal of accurately estimating the NPP of forest ecosystems.
Table 4.
Comparison and application of the main remote sensing models.
2.2. Response of the NPP to Climate Change in Karst Areas of Southwest China
Quantifying the relative contributions of climate change and human activities to vegetation dynamics is the key to coping with global climate change [66]. The southwest karst region covers a vast territory with complex landforms. In addition, the influence of upper air circulation has formed a unique and diverse climate. The main part is characterized by a warm and humid subtropical monsoon climate [67]. Climate determines the NPP of vegetation in terms of the physiological structure and processes of vegetation by changing the environmental conditions. Therefore, changes in NPP can directly reflect the response of vegetation ecosystems to environmental and climatic conditions [68]. In general, climate factors and season length are positively correlated with NPP, while the relationship between regions is more varied [69].
2.2.1. Effect of Temperature Change on NPP
Temperature affects the growth and metabolic rate of all organisms [70] and affects the processes of photosynthesis and respiration. Usually, based on the remote sensing model of light energy utilization, photosynthesis (rate) rises along the temperature, but only up to certain threshold above each of which it is too hot for the plant and the rate goes down, and respiration is positively related to temperature. Most models also consider the temperature dependence of other processes, such as water balance, evaporation or decomposition rate. In addition, the model usually assumes that the minimum temperature is more important than the average temperature [71]. The impact of temperature on forest NPP is complex. Temperature rise simultaneously controls the two processes of vegetation photosynthesis and respiration. The impact on these two processes determines the increase or decrease in ecosystem NPP; that is, there are both positive and negative effects.
On the one hand, the increase in temperature will increase the respiration of forest vegetation, consume dry matter, and reduce the NPP value. At the same time, the increase in temperature will increase the transpiration of vegetation and affect the growth and development of vegetation. For example, in some areas of southeast Yunnan and central Guangxi, the temperature is negatively correlated with the vegetation coverage. The lack of surface water and the increase in temperature aggravates the surface evaporation in this area, thus inhibiting vegetation growth [72]. In the south of the Hengduan Mountain, when the temperature rises and the precipitation remains unchanged, the NPP shows a downwards trend [73]. The NDVI values of coniferous forests in Yunnan Province are significantly negatively correlated with air temperature [74].
On the other hand, with the increase in temperature, the enzyme activity of photosynthesis in plants is enhanced, and the photosynthetic efficiency of vegetation is improved, which promotes the growth of vegetation and improves the NPP of vegetation [75]. The growth of many middle- and high-latitude forests is limited by the nitrogen supply to some extent, and warming can lead to an increase in soil nitrogen availability, which may also indirectly promote an increase in forest vegetation productivity. There are many reports on the promoting effect of warming on the NPP. For example, in March and April, when the temperature is ≥10 °C, plants begin to grow and the NPP in Guizhou Province begins to increase gradually. In summer (June–August), before the end of June, all parts of Guizhou experience the first day of temperatures ≥20 °C, and the vegetation enters a rapid growth period. From July to August, the average temperature in Guizhou is approximately 20 to 28 °C, depending on the altitude. The vegetation enters a high-speed growth period, and the NPP value reaches the maximum value in a year [76]. On a monthly scale, temperature is the controlling factor of the NPP in humid and semi-humid regions [77].
Temperature is one of the main climatic factors driving changes in the NPP, with obvious seasonal variation. In high latitudes, vegetation growth is periodic, and in humid and semi-humid areas, temperature promotes NPP growth by promoting photosynthesis of vegetation and the release of nutrients in soil. When the temperature is too high, it aggravates the transpiration of vegetation and decreases the NPP.
2.2.2. Impact of Precipitation Change on NPP
The distribution pattern of forest productivity in China mainly depends on the hydrothermal conditions in the climatic environment, and the moisture conditions play a decisive role in determining the level of forest productivity in most regions of China [78]. Most of the karst areas in southwest China are monsoon climate areas, with abundant annual precipitation. Most areas have an annual precipitation between 1000 and 1600 mm, and some areas have an annual precipitation between 1800 and 2000 mm; the annual average relative humidity is 75% to 80%. The region has the distribution characteristics of hydrothermal and thermal synchronization, but the spatial and temporal distribution of precipitation is extremely uneven. In response to water stress or high temperature, the stomata of leaves will partially close, to prevent excessive transpiration of water, thus limiting the entry of CO2 into the plant through the stomata, reducing the concentration of CO2 between mesophyll cells. This results in an increase in the content of solute in the plant and a decrease in the stomatal conductance of leaves, leading to a weakening of light cooperation, thus affecting the growth and development of vegetation and the accumulation of dry matter [79]. Although the temperature in different vegetation distribution areas in southwest China has increased to varying degrees, the change trend of forest NPP is consistent with the change trend of precipitation in vegetation distribution areas [80]. For example, in the southern part of the Hengduan Mountain, under the condition of constant temperature, the change trend of NPP is consistent with that of precipitation, indicating that precipitation is the dominant factor affecting the change in the NPP in this region [73]. In the two decades from 1981 to 2000, forests were widely distributed in the southwestern region. The temperature rise rate was 0.037 °C/year, the precipitation change trend was not obvious, and the NPP of forest vegetation did not exhibit an obvious change trend [80]. From 2000 to 2011, the average temperature in Sichuan was 12.3 °C, and the annual average precipitation was 732.4 mm. From 1981 to 2000, the annual average temperature was 12.3 °C and the average annual precipitation was 976.0 mm. The average annual temperature was relatively stable, and the precipitation decreased significantly. At the same time, the coefficient of variability obtained from the correlation analysis between NPP and precipitation reached 83.4%, indicating that precipitation was the main driving factor affecting the change in the NPP of vegetation in Sichuan Province [65]. In addition, the impact of precipitation on the NPP was due to the effects of dry and wet environments of vegetation. For example, during the drought events in southwest China from 2009 to 2010, the NDVI value of vegetation exhibited a general downward trend in the region, especially in southwest Yunnan and Guizhou [81], which corresponded to the general downward trend of NPP in this region as a result of precipitation changes.
Precipitations is one of the main climatic factors driving changes in the NPP. NPP can be promoted in the vegetation growth period and in arid areas, as seen in the drought from 2009 to 2010. However, the southwest karst region is located in the subtropical monsoon region. Although the rainfall (1000–2000 mm) is relatively low, the water stress effect caused by engineering water shortages caused by karst landforms and their impact on the NPP are very worthy of attention and research.
2.2.3. Impact of VPD on NPP
The vapor pressure deficit (VPD) describes the difference between the saturated vapour pressure and the actual vapor pressure at a given temperature [82], which reflects the temperature, humidity and dryness of the air and determines the whole transpiration rate [83]. Under constant temperature, plants growing at low VPD usually showed higher photosynthetic rates and enhanced stomatal and mesophyll conductance. In contrast, plants exposed to high VPD are subject to high evaporation demand and have low efficiency from a physiological point of view, often showing a decrease in net photosynthesis, stomatal conductance and water use efficiency [84]. In some studies [82,84], the mechanism of the decline in productivity was related to the limitation of photosynthesis caused by the decrease in stomatal conductance caused by the rise in VPD. Increased VPD during growth resulted in a higher transpiration water loss rate. With a decrease in leaf water status, stomatal conductance decreases, thus reducing CO2 capture [85] and resulting in a decline in photosynthetic capacity. For example, in the southwest Xishuangbanna region, in the dry and hot seasons, the increase in VPD and temperature has greatly increased the demand for atmospheric evaporation, further causing stomatal closure and limiting photosynthesis [86]. The fertilization effect of CO2 on vegetation has been recognized as the main driving force of global green up. The increase in CO2 concentration increases the content of CO2 between cells, thus promoting leaf photosynthesis [87]. CO2 is a raw material that participates in photosynthesis and affects the NPP through its effects on temperature, plant water and nutrient demand. Generally, when the CO2 concentration increases, plants can reduce canopy evapotranspiration by reducing their own stomatal conductance to improve the use efficiency of soil water. They can also improve the use efficiency of soil nitrogen to improve the photosynthesis efficiency of forest vegetation and promote the accumulation of dry matter [68,88]. However, the current terrestrial ecosystem models do not accurately reflect the limiting effect of atmospheric water vapor pressure on vegetation growth, which will lead to the models overestimating future ecosystem productivity.
In summary, from the perspective of a single climate factor, the relationship between NPP changes in forest vegetation and temperature in karst areas of southwest China is mainly positive, the relationship with precipitation is complex and the relationship with VPD is negative. However, generally, temperature, precipitation and VPD affect NPP changes together, and the impact on the NPP also has a certain seasonality and lag. In humid and semi-humid areas, temperature is the dominant factor, and precipitation is the dominant factor in arid, semi-arid and engineering water shortage areas. In dry and hot seasons, temperature and precipitation affect the VPD and NPP. In addition, the response of forest vegetation NPP to climate is also affected by topographic factors [74]. For example, in high-altitude areas, due to the particularity of karst landforms, precipitation increases soil erosion, thus reducing vegetation NPP; water and soil loss is not easy in low-altitude areas, and precipitation promotes the increase in NPP.
3. Current Situation and Change Trend of the NPP of Forest Ecosystems in Karst Areas
The terrain of southwest China is inclined from southeast to northwest and includes mostly mountainous and hilly landforms. The region is rich in forestry resources and is an important forest resource zone in China [89]. At the end of the 20th century, the planting of fast-growing forests (mainly eucalyptus, poplar and pine) was promoted in the region, the vegetation coverage increased (the forest area in Southwest China accounted for 47.6% of the total land area in 2018), and the NPP and carbon reserves in the region also increased. From 2001 to 2018, the NPP of vegetation in southwest China fluctuated significantly. The highest annual average value of NPP occurred in 2015, which was 752.55 gC/m2·a, the lowest value occurred in 2004, which was 668.21 gC/m2·a, and the multiyear average value was 710.44 gC/m2·a. In terms of spatial distribution, it was high in the south and low in the north, and there were great differences among different provinces, Yunnan (989.63 gC/m2·a) > Guizhou (773 gC/m2·a) > Chongqing (597.2 gC/m2·a) > Sichuan (496.27 gC/m2·a) [59].
For the study of the forest NPP in Southwest China, the vegetation was mainly classified into coniferous forest, broad-leaved forest and coniferous broad-leaved mixed forest [59,90]. However, most NPP studies in Southwest China focused on the overall vegetation NPP, while little information was reported regarding the total NPP of forests and the NPP of different types of forest vegetation. Based on previous research results, in this study, we classified and summarized the annual average NPP of different regions in Southwest China, as well as that of major forest vegetation types in China (Table 5), along with the annual average total NPP of forests (Table 6). The results showed that the annual average NPP of evergreen broad-leaved forests was the highest in all regions of Southwest China, and even in the entire country, due to the long growth cycle of evergreens and the long duration of light and action. The annual average NPP of mixed forests and coniferous forests were ranked second and third. However, the NPP of the evergreen broad-leaved forest in the Qinba Mountain area was slightly lower than that of the evergreen coniferous forest, mainly because the evergreen broad-leaved forest is better suited for growing in subtropical areas, while the Qinba Mountain area is at the intersection of subtropical and warm temperate zones. Compared with subtropical areas with lower latitudes, the subtropical climate characteristics in the Qinba Mountain area are relatively weak, affecting the growth of evergreen broad-leaved forests [59,91]. From the perspective of the average value of total forest NPP, all the southwestern provinces, except Sichuan Province, exceed the national average value of forest vegetation, of which Guizhou Province has the highest average value (1100.31 ± 6.39 gC/m2·a), and Yunnan Province does not include tropical rainforest, so the average value is low.
Table 5.
Summary of the annual average NPP of different forest vegetation types in Southwest China and China.
Table 6.
Summary of the annual average NPP of forests in Southwest China and China.
For the estimation of the annual average NPP of common forest vegetation in Southwest China, the research results of different scholars are different (Table 7). Based on forest inventory data, Yu estimated that the average NPP in southwest China from 1989 to 1993 was 9.64 t·ha−1year−1, of which the annual average NPP of evergreen broad-leaved forest was the highest [97]; Ni calculated the annual average NPP of different forest vegetation types according to Luo’s data from 1989 to 1993 [98,99]; Liu summarized the literature published from 1982 to early 2013 and summarized the annual average NPP of different forest vegetation types in Southwest China [90]. Liu’s annual average NPP is much lower than that of Weilian and Ni because the latter adopts the combination of forest inventory and field investigation.
Table 7.
Summary of the annual average NPP of common forest vegetation in Southwest China.
In conclusion, the spatial distribution of vegetation NPP in Southwest China is related to the regional hydrothermal conditions and the zonal distribution of vegetation types. The highest NPP of forest vegetation in Southwest China is broad-leaved forest, followed by mixed forest and coniferous forest. From the distribution pattern, Yunnan has better hydrothermal conditions, with the highest NPP (989.63 gC/m2·a) in Yunnan and the lowest NPP (496.27 gC/m2·a) in Sichuan. Moreover, the forest NPP of Yunnan Province and Guizhou Province exceeded the national average of forest NPP.
4. Summary and Perspectives
Reviewing the observation methods of forest ecosystem NPP and comprehensively understanding the spatial and temporal characteristics and change trends of NPP in karst areas are of great significance for promoting the in-depth understanding of forest ecosystem NPP in karst areas and helping to achieve carbon peaks and carbon neutralization. Due to different methods for estimating NPP at the regional scale, great uncertainty has been brought to the results of forest NPP estimation in karst areas of southwest China. By summarizing and commenting on the progress of NPP estimation methods in academic circles at home and abroad, the following aspects can be considered for future NPP research: (1) establishing a highly accurate and comprehensive coupling model; (2) developing high-precision climate data sets; and (3) further strengthening the research on the interaction mechanism between climate change, LUCC and productivity.
4.1. Establishment of a High-Precision and Comprehensive Coupling Model
Whether through site measurement or model simulation, the sources of differences in NPP estimates are very wide. For the measured results, even if they are also from the field site survey, the results may still be quite different. The possible reasons are that the above ground and underground parts measured by NPP are incomplete, and the artificial forest and natural forest are not distinguished. For model simulation, statistical models are widely used for NPP estimation of regional forest ecosystems due to their simple operation and easy access to parameters. However, they lack physical significance and have poor space–time portability. At the same time, the complex interaction between the atmosphere and the ecosystem leads to uncertainty in the simulation results, which may lead to great differences in the simulation values of NPP in the same region. Process models have clear physiological and ecological mechanisms and can reveal ecosystem processes and their interactions with the environment. It is helpful to study the impact of global change on the NPP of vegetation. However, the model relies on a large number of parameters, many of which are difficult to obtain with accuracy. However, the light energy utilization model has simple parameters and little dependence on ground measurements. It is suitable for large-scale regional observations, but the accuracy needs to be improved. Therefore, it has more potential for the development of multimodel fusion or to improve the accuracy of light energy utilization models for NPP detection in forest ecosystems.
4.2. Developing High-Precision Climate Data Sets
Remote sensing model simulations of large-scale regional operations require data regarding many meteorological factors for use as driving variables, such as temperature, radiation and precipitation. Traditionally, a variety of meteorological data collected by meteorological stations are obtained and the spatial interpolation method is used to generate various types of spatially continuous meteorological data maps. One drawback is that this method is restricted by the number of meteorological stations providing the data used in the interpolation. The more sites there are, the more representative the data will be. However, in reality, the number of meteorological stations is very limited, and their spatial distribution is extremely uneven. Another limitation of the interpolation method itself is its inability to consider the influence of other elements, such as terrain and altitude, in the spatial interpolation. The error in the model spatial driving data is one of the main sources of model regional estimation error. Cai found that the photosynthetic effective radiation retrieved by the remote sensing method can significantly improve the regional simulation accuracy of the remote sensing model, and radiation data with higher spatial resolution improve the simulation accuracy of regional vegetation productivity [100]. Therefore, using remote sensing to retrieve climate data can effectively improve the accuracy of NPP estimation.
4.3. Further Research on Interaction Mechanisms
Great progress has been made in the study of the relationship between terrestrial ecosystems and key climate factors. An analysis of the mechanism of interactions is a topic for future research. It is generally believed that the greenhouse effect and climate factors affect vegetation productivity by affecting the process of plant growth and development and the water cycle. However, changes in the factors related to plant growth and the interactions between them are not often considered. In addition, the mechanism of interaction between terrestrial ecosystems and climate change needs to be further clarified from the perspective of plant physiology. There have been few studies on the relationship between climate change, LUCC, topographic factors, soil conditions and forest NPP.
The “measurability, reportability and verifiability” of terrestrial ecosystem carbon sequestration is an important scientific framework for formulating China’s emission reduction and foreign exchange increase policies [17]. Reviewing the methods of observation of forest ecosystem NPP and gaining a comprehensive understanding of the temporal and spatial characteristics and change trends of NPP in karst areas are important for the implementation of China’s carbon neutrality strategies. It is of great importance to help achieve the goals of carbon peaks and carbon neutralization.
Author Contributions
Conceptualization, B.Z. and X.F.; methodology, B.Z.; software, B.Z. and J.Z.; validation, J.Z.; formal analysis, B.Z.; investigation, B.Z. and S.C.; resources, H.J. and X.F.; data curation, Z.L.; writing—original draft preparation, B.Z. and Z.L.; writing—review and editing, X.F.; visualization, S.C. and H.J.; supervision, X.F.; project administration, X.F.; funding acquisition, X.F. All authors have read and agreed to the published version of the manuscript.
Funding
This study was supported by the Science and Technology Research Project of Guizhou Province, China ((2020)1Y073), the National Natural Science Foundation of China (32160290), the Special Research Fund of Natural Science (Special Post) of Guizhou University, China ((2018) 29), the Cultivation Project of Natural Science of Guizhou University, China ((2019)69), and the Opening Fund for Guizhou Province Key Laboratory of Ecological Protection and Restoration of Typical Plateau Wetlands (No. Bikelianhezi Guigongcheng (2021)07). And The APC was funded by the Science and Technology Research Project of Guizhou Province, China ((2020)1Y073) and the National Natural Science Foundation of China (32160290).
Data Availability Statement
The paper is a review and does not present original data. All data can be found in the cited references.
Acknowledgments
This publication was supported by Guizhou Karst Environmental Ecosystems Observation and Research Station, Ministry of Education. And the Key Laboratory of Karst Geological Resources and Environment, Ministry of Education.
Conflicts of Interest
The authors declare no competing financial interests.
Appendix A
Table A1.
Data related references cited in this study.
Table A1.
Data related references cited in this study.
| Author | Year | Reference | Source | Website/Doi |
|---|---|---|---|---|
| Hong, C., et al. | 2017 | [11] | Progress in Geographical Science | https://cnki.net/ |
| Lieth, H. | 1975 | [18] | Primary Productivity of the Biosphere | https://doi.org/10.1007/978-3-642-80913-2_12 |
| Lieth, H. | 1972 | [19] | pub in climatology | https://www.researchgate.net/publication/284261627 |
| Zenbei, U. and S. Hiroshi | 1985 | [20] | Journal of Agricultural Meteorology | https://doi.org/10.2480/agrmet.40.343 |
| Zhou, G. and X. Zhang | 1995 | [21] | Journal of plant ecology | https://cnki.net/ |
| Shen, B. | 2019 | [39] | Chinese Academy of Agricultural Sciences | https://cnki.net/ |
| Zhu, W. | 2005 | [43] | Beijing Normal University | https://cnki.net/ |
| Piao, S., J. Fang, and Q. Guo | 2001 | [44] | Journal of plant ecology | https://cnki.net/ |
| Sun, C., et al. | 2013 | [53] | Journal of Yangzhou University | https://doi.org/10.16872/j.cnki.1671-4652.2013.04.012 |
| Sun, J., H. Niu, and M. Yuan | 2020 | [54] | Journal of agricultural machinery | https://cnki.net/ |
| Sun, Z. and S. Xie | 2021 | [55] | Journal of ecology | https://doi.org/10.13292/j.1000-4890.202111.033 |
| Wu, G. | 2015 | [56] | Nanjing Forestry University | https://cnki.net/ |
| Zhao, M., et al. | 2019 | [57] | Journal of ecological environment | https://doi.org/10.16258/j.cnki.1674-5906.2019.02.001 |
| Li, M., et al | 2019 | [58] | Environmental Science Research | https://doi.org/10.13198/j.issn.1001-6929.2018.11.14 |
| Hong, X., Y. Huang, and T. SUn | 2021 | [59] | Journal of ecology | https://cnki.net/ |
| Lin, X., et al. | 2015 | [60] | Environmental Protection Science | https://doi.org/10.16803/j.cnki.issn.1004-6216.2015.02.020 |
| Xiong, X., et al. | 2019 | [61] | Journal of Guangxi Normal University | https://doi.org/10.16088/j.issn.1001-6600.2019.03.022 |
| Xu, Y., Y. Zhang, and W. Pan | 2018 | [62] | Environment and sustainable development | https://doi.org/10.19758/j.cnki.issn1673-288x.2018.01.024 |
| Zhao, Z., et al. | 2015 | [63] | Journal of ecology | https://cnki.net/ |
| Zhang, R., et al. | 2015 | [64] | JOURNAL OF SOUTHWEST UNIVERSITY | https://cnki.net/ |
| Liu, S., et al. | 2013 | [65] | Journal of Sichuan Agricultural University | https://cnki.net/ |
| Guan, X., et al. | 2017 | [92] | Environmental Earth Sciences | https://doi.org/10.3390/rs9101082 |
| Zhang, R., et al. | 2017 | [93] | Remote Sensing | https://doi.org/10.3390/rs9050477 |
| Gu, X., et al. | 2007 | [80] | Journal of natural resources | https://cnki.net/ |
| Zhang, X. | 2011 | [94] | Remote Sensing | https://cnki.net/ |
| Zhao, X. | 2019 | [95] | China Academy of Forestry Sciences | https://cnki.net/ |
| Liu, X. | 2019 | [96] | Southwest University | https://doi.org/10.27284/d.cnki.gsxiu.2019.000161 |
| Yu, W., D. Dong, and J. Ni | 2010 | [97] | Shanxi University | https://doi.org/10.19687/j.cnki.1673-7105.2010.02.004 |
| Ni, J., Z. Xin-Shi, and M.O.S. Jonathan | 2001 | [98] | Journal of subtropical resources and environment | www.edpsciences.org |
| Liu, L.B., et al. | 2016 | [90] | Forests | https://doi.org/10.3390/f7080173 |
References
- Fang, J.; Yu, G.; Liu, L.; Hu, S.; Chapin, F. Climate change, human impacts, and carbon sequestration in China. Proc. Natl. Acad. Sci. USA 2018, 115, 4015–4020. [Google Scholar] [CrossRef]
- Wang, B.; Niu, X.; Song, Q. Analysis of forest carbon neutralization capacity in China based on full caliber carbon sink monitoring. Environ. Prot. 2021, 49, 30–34. [Google Scholar]
- Rafique, R.; Zhao, F.; Jong, R.; Zeng, N.; Asrar, G. Global and Regional Variability and Change in Terrestrial Ecosystems Net Primary Production and NDVI: A Model-Data Comparison. Remote Sens. 2016, 8, 117. [Google Scholar] [CrossRef]
- Ji, Y.; Zhou, G.; Luo, T.; Dan, Y.; Zhou, L.; Lv, X. Variation of net primary productivity and its drivers in China’s forests during 2000–2018. For. Ecosyst. 2020, 7, 15. [Google Scholar] [CrossRef]
- Zhang, H.; Wang, K.; Zeng, Z.; Zou, Z.; Xu, Y.; Zeng, F. Multiple Factors Drive Variation of Forest Root Biomass in Southwestern China. Forests 2018, 9, 456. [Google Scholar] [CrossRef]
- Piao, S.; Fang, J.; Ciais, P.; Peylin, P.; Huang, Y.; Sitch, S.; Wang, T. The carbon balance of terrestrial ecosystems in China. Nature 2009, 458, 1009–1013. [Google Scholar] [CrossRef]
- Tang, X.; Zhao, X.; Bai, Y.; Tang, Z.; Wang, W.; Zhao, Y.; Wan, H.; Xie, Z.; Shi, X.; Wu, B.; et al. Carbon pools in China’s terrestrial ecosystems: New estimates based on an intensive field survey. Proc. Natl. Acad. Sci. USA 2018, 115, 4021–4026. [Google Scholar] [CrossRef] [PubMed]
- Fang, J.; Wang, G.; Liu, G.; Xu, S. Forest biomass of China: An estimate based on the biomass–volume relationship. Ecol. Appl. 1998, 8, 1084–1091. [Google Scholar]
- Xu, E.; Nie, Y.; Bing, X. Analysis on the forest land use efficiency change based on forest resource inventory data. J. Nanjing For. Univ. (Nat. Sci. Ed.) 2022, 1–13. Available online: http://kns.cnki.net/kcms/detail/32.1161.S.20220620.1359.002.html (accessed on 16 August 2022).
- Zeng, S.; Liu, Z.; Kaufmann, G. Sensitivity of the global carbonate weathering carbon-sink flux to climate and land-use changes. Nat. Commun. 2019, 10, 5749. [Google Scholar] [CrossRef]
- Hong, C.; Jing, X.; Cheng, C.; Wang, S.; Yang, X.; Xiang, X. A review of land net primary productivity estimation models based on integrated remote sensing data. Prog. Geogr. Sci. 2017, 36, 924–939. [Google Scholar]
- Li, M.; Wang, b.; Fan, w.; Zhao, D. Simulation study on net primary productivity of northeast forest region and forest fire disturbance in Daxinganling region. J. Plant Ecol. 2015, 39, 322–332. [Google Scholar]
- Li, Z. Study on Maize Growth Monitoring Method Based on Light Energy Utilization Model and Quantitative Remote Sensing. Ph.D. Thesis, Chinese Academy of Agricultural Sciences, Beijing, China, 2014. [Google Scholar]
- Fang, J.; Guo, Z.; Piao, S.; Chen, A. Terrestrial vegetation carbon sinks in China,1981–2000. Sci. China (Ser. D Earth Sci.) 2007, 50, 1341–1350. [Google Scholar] [CrossRef]
- Dennis, D.B. How eddy covariance flux measurements have contributed to our understanding of Global Change Biology. Glob. Chang. Biol. 2019, 26, 242–260. [Google Scholar]
- Marc, A. Eddy covariance CO2 flux measurements in nocturnal conditions: An analysis of the problem. Ecol. Appl. 2008, 18, 1368–1378. [Google Scholar]
- Piao, S.; He, Y.; Wang, X.; Chen, F. Carbon sequestration estimation of terrestrial ecosystems in China: Methods, progress and Prospects. Chin. Sci. Earth Sci. 2022, 52, 1010–1020. [Google Scholar]
- Lieth, H. Modeling the primary productivity of the world. In Primary Productivity of the Biosphere; Springer: Berlin/Heidelberg, Germany, 1975; pp. 237–263. [Google Scholar]
- Lieth, H. Evapotranspiration and primary productivity: CW Thornthwaite memorial model. Publ. Climatol. 1972, 25, 37–46. [Google Scholar]
- Zenbei, U.; Hiroshi, S. Agroclimatic Evaluation of Net Primary Productivity of Natural Vegetations. J. Agric. Meteorol. 1985, 40, 343–352. [Google Scholar]
- Zhou, G.; Zhang, X. A preliminary study on the net primary productivity model of natural vegetation. J. Plant Ecol. 1995, 19, 193–200. [Google Scholar]
- Adams, B.; White, A.; Lenton, T.M. An analysis of some diverse approaches to modelling terrestrial net primary productivity. Ecol. Model. 2004, 177, 353–391. [Google Scholar] [CrossRef]
- Sun, J.; Guan, D.; Wu, J.; Jin, C.; Yuan, F. Research advances in net primary productivity of terrestrial vegetation. World For. Res. 2012, 25, 1–6. [Google Scholar]
- Shvidenko, A.; Schepaschenko, D.; Nilsson, S.; Bouloui, Y. Semi-empirical models for assessing biological productivity of Northern Eurasian forests. Ecol. Model. 2007, 204, 163–179. [Google Scholar] [CrossRef]
- Zaks, D.; Ramankutty, N.; Barford, C.; Foley, J. From Miami to Madison: Investigating the relationship between climate and terrestrial net primary production. Glob. Biogeochem. Cycles 2007, 21, 3. [Google Scholar] [CrossRef]
- Wang, Z.; Guo, Z.; Song, K.; Liu, D.; Zhang, B.; Zhang, S.; Li, F. Effects of land use/Cover Change on net primary productivity of vegetation in Sanjiang Plain from 2000 to 2005. J. Nat. Resour. 2009, 24, 136–146. [Google Scholar]
- Zhu, W.; Chen, Y.; Xu, D.; Dong, J. Advances in the calculation models of net primary productivity of terrestrial vegetation. J. Ecol. 2005, 24, 296–300. [Google Scholar]
- Zhang, M.; Jiang, W.; Chen, Q.; Zhao, Y.; Liu, X.; Kicklighter, D.; Grace, A.; Moore, B.; Vorosmarty, C. Research Progress on estimation model of grassland net primary productivity. Grassl. J. 2011, 19, 356–366. [Google Scholar]
- McGuire, A.; Melillo, J.; Joyce, L.; Kicklighter, D.; Grace, A.; Moore, B.; Vorosmarty, C. Interactions between carbon and nitrogen dynamics in estimating net primary productivity for potential vegetation in North America. Glob. Biogeochem. Cycles 1992, 6, 102–124. [Google Scholar] [CrossRef]
- Running, S.W.; Gower, S.T. FOREST-BGC, A general model of forest ecosystem processes for regional applications. II. Dynamic carbon allocation and nitrogen budgets. Tree Physiol. 1991, 9, 147–160. [Google Scholar] [CrossRef]
- Vemap, P. Vegetation/ecosystem modeling and analysis project: Comparing biogeography and biogeochemistry models in a continental-scale study of terrestrial ecosystem responses to climate change and CO2 doubling. Glob. Biogeochem. Cycles 1995, 9, 407. [Google Scholar]
- Steven, W.R.; Joseph, C.C. A general model of forest ecosystem processes for regional applications I. Hydrologic balance, canopy gas exchange and primary production processes. Ecol. Model. 1988, 42, 125–154. [Google Scholar]
- Monteith, J.L. Solar Radiation and Productivity in Tropical Ecosystems. J. Appl. Ecol. 1972, 9, 747–766. [Google Scholar] [CrossRef]
- Nikolaos, M.F.; Lisa Patrick, B.; Alexander, S.; Gregory, P.; Owen, K.; Sandra, D.; Brian, J.; William, F.; Emanuel, G.; Rossella, G.; et al. Solar radiation and functional traits explain the decline of forest primary productivity along a tropical elevation gradient. Ecol. Lett. 2017, 20, 730–740. [Google Scholar]
- Prince, S.D.; Goward, S.N. Global primary production: A remote sensing approach. J. Biogeogr. 1995, 22, 815–835. [Google Scholar] [CrossRef]
- Veroustraete, F.; Sabbe, H.; Eerens, H. Estimation of carbon mass fluxes over Europe using the C-Fix model and Euroflux data. Remote Sens. Environ. 2002, 83, 376–399. [Google Scholar] [CrossRef]
- Box, E.O.; Holben, B.N.; Kalb, V. Accuracy of the AVHRR vegetation index as a predictor of biomass, primary productivity and net CO2 flux. Vegetatio 1989, 80, 71–89. [Google Scholar] [CrossRef]
- Yuan, W.; Cai, W.; Liu, D.; Dong, W. Satellite-based vegetation production models of terrestrial ecosystem: An overview. Adv. Earth Sci. 2014, 29, 541–550. [Google Scholar]
- Shen, B. The Simulation and Analysis of NPP Based on CASA Model in Hulunber Grassland. Master’s Thesis, Chinese Academy of Agricultural Sciences, Beijing, China, 2019. [Google Scholar]
- Potter, C.S.; Randerson, J.; Field, C.; Matson, P.; Vitousek, P.; Mooney, H.; Klooster, S. Terrestrial ecosystem production: A process model based on global satellite and surface data. Glob. Biogeochem. Cycles 1993, 7, 811–841. [Google Scholar] [CrossRef]
- Li, C.; Fan, Y.; Cao, H.; Han, H. Quantitative study on human impact of primary productivity of Vegetation Based on CASA model—A case study of Shiyang River Basin. Geogr. Arid. Areas 2018, 41, 142–151. [Google Scholar]
- Liu, Z.; Hu, M.; Hu, Y.; Wang, G. Estimation of net primary productivity of forests by modified CASA models and remotely sensed data. Int. J. Remote Sens. 2017, 39, 1092–1116. [Google Scholar] [CrossRef]
- Zhu, W. Remote Sensing Estimation of Net Primary Productivity of Terrestrial Ecosystems in China and its Relationship with Climate Change. Ph.D. Thesis, Beijing Normal University, Beijing, China, 2005. [Google Scholar]
- Piao, S.; Fang, J.; Guo, Q. Estimation of net primary productivity of vegetation in China using CASA model. J. Plant Ecol. 2001, 25, 603–608. [Google Scholar]
- Dong, D.; Ni, J. Simulation of net primary productivity of Karst Vegetation in Southwest China using CASA model. J. Ecol. 2011, 31, 1855–1866. [Google Scholar]
- Li, C.; Li, C.; Fan, Y.; Cao, H.; Han, H.; Sun, H.; Wang, Y. NPP remote sensing estimation and analysis of CASA model based on Correction—Taking Hexi Corridor as an example. J. Ecol. 2019, 39, 1616–1626. [Google Scholar]
- Yan, Y.; Liu, X.; Ou, J.; Li, X.; Wen, Y. Assimilating multi-source remotely sensed data into a light use efficiency model for net primary productivity estimation. Int. J. Appl. Earth Obs. Geoinf. 2018, 72, 11–25. [Google Scholar] [CrossRef]
- Lee, J.-E.; Frankenberg, C.; van der Tol, C.; Berry, J.; Guanter, L.; Boyce, C.; Fisher, J.; Morrow, E.; Worden, J.; Asefi, S. Forest productivity and water stress in Amazonia: Observations from GOSAT chlorophyll fluorescence. Proc. R. Soc. B Biol. Sci. 2013, 280, 20130171. [Google Scholar] [CrossRef] [PubMed]
- Zhao, M.; Heinsch, F.; Nemani, R.; Running, S. Improvements of the MODIS terrestrial gross and net primary production global data set. Remote Sens. Environ. 2005, 95, 164–176. [Google Scholar] [CrossRef]
- Jenkins, J.; Richardson, A.; Braswell, B.; Ollinger, S.; Hollinger, D.; Smith, M. Refining light-use efficiency calculations for a deciduous forest canopy using simultaneous tower-based carbon flux and radiometric measurements. Agric. For. Meteorol. 2007, 143, 64–79. [Google Scholar] [CrossRef]
- Gustau, C.-V.; Manuel, C.; Álvaro, M.; Sophia, W.; Grégory, D.; Alessandro, C.; Miguel, D.; Jordi, M.; Francisco Javier, G.; Luis, G.; et al. A unified vegetation index for quantifying the terrestrial biosphere. Sci. Adv. 2021, 7, eabc7447. [Google Scholar]
- César, H.-H.; Goulden, M.L. Plant Traits Help Explain the Tight Relationship between Vegetation Indices and Gross Primary Production. Remote Sens. 2020, 12, 1405. [Google Scholar]
- Sun, C.; Chen, Y.; Wu, W.; Chen, W.; Han, Z.; Li, J. Study on spatial distribution pattern of grassland NPP in southern China based on climate productivity model. J. Yangzhou Univ. 2013, 34, 56–61. [Google Scholar]
- Sun, J.; Niu, H.; Yuan, M. Analysis on NPP spatial pattern change of terrestrial vegetation ecosystem in China. J. Agric. Mach. 2020, 51, 162–168. [Google Scholar]
- Sun, Z.; Xie, S. Spatial and temporal evolution and factor detection of net primary productivity in Yunnan Province Based on geographical detectors. J. Ecol. 2021, 40, 3836–3848. [Google Scholar] [CrossRef]
- Wu, G. Estimation of Net Primary Productivity and Carbon Storage of Forest Vegetation in Jiangxi Province. Ph.D. Thesis, Nanjing Forestry University, Nanjing, China, 2015. [Google Scholar]
- Zhao, M.; Liu, Y.; Yang, J.; Liu, Y.; Zhao, N.; Yue, T. Spatial and temporal variation of NPP in Chinese Vegetation Based on HASM and its relationship with climate. J. Ecol. Environ. 2019, 28, 215–225. [Google Scholar]
- Li, M.; Yao, W.; Ren, X.; Zhang, L.; Xu, W.; Gu, F.; He, H. Estimation of net primary productivity of forest ecosystem in Shennongjia forest region from 1981 to 2015. Environ. Sci. Res. 2019, 32, 749–757. [Google Scholar]
- Hong, X.; Huang, Y.; Sun, T. Spatial and temporal evolution of net primary productivity of vegetation in karst areas of Southwest China from 2001 to 2018. J. Ecol. 2021, 41, 9836–9846. [Google Scholar]
- Lin, X.; Lin, X.; Cai, X.; Wang, J.; Mei, Z.; Dai, L. Spatial and temporal changes of net primary productivity of vegetation in Guizhou Province from 2000 to 2010. Environ. Prot. Sci. 2015, 41, 91–95+136. [Google Scholar] [CrossRef]
- Xiong, X.; Liao, C.; Hu, B.; Chen, Y.; Zhu, H. Spatial and temporal differentiation and driving forces of NPP in Guangxi vegetation based on MODIS. J. Guangxi Norm. Univ. 2019, 37, 187–195. [Google Scholar]
- Xu, Y.; Zhang, Y.; Pan, W. Dynamic changes of spatial and temporal pattern of net primary productivity (NPP) of vegetation in Yunnan Guizhou Plateau. Environ. Sustain. Dev. 2018, 43, 96–99. [Google Scholar]
- Zhao, Z.; Wu, X.; Li, G.; Li, J. Drought degree and its impact on net primary productivity of vegetation in Southwest China from 2009 to 2011. J. Ecol. 2015, 35, 350–360. [Google Scholar]
- Zhang, R.; Luo, H.; Zhang, R.; Liu, G.; Zheng, H.; Yang, T. Estimation of net primary productivity of vegetation and evaluation of its ecological service value in Chongqing. J. Southwest Univ. 2015, 37, 40–46. [Google Scholar]
- Liu, S.; Lu, T.; Tang, B.; Wu, Y.; Wu, N. Analysis of net primary productivity and its spatial-temporal pattern of vegetation in Sichuan Based on CASA model. J. Sichuan Agric. Univ. 2013, 31, 269–276+282. [Google Scholar]
- Ge, W.; Deng, L.; Wang, F.; Han, J. Quantifying the contributions of human activities and climate change to vegetation net primary productivity dynamics in China from 2001 to 2016. Sci. Total Environ. 2021, 773, 145648. [Google Scholar] [CrossRef] [PubMed]
- Rao, Y.; Wang, L.; Zhao, K. The causes of rocky desertification and Its Ecological Restoration Countermeasures in karst mountainous areas of Southwest China. J. West China Norm. Univ. 2004, 04, 440–443. [Google Scholar]
- Xu, Y.; Xiao, F.; Yu, L. Spatial and temporal distribution of net primary productivity of forest ecosystems in China and its response to climate change. J. Ecol. 2020, 40, 4710–4723. [Google Scholar]
- Yang, J.; Zhang, X.; Luo, Z.; Yu, X. Nonlinear Variations of Net Primary Productivity and Its Relationship with Climate and Vegetation Phenology, China. Forests 2017, 8, 361. [Google Scholar] [CrossRef]
- Brown, J.H.; Gillooly, J.; Allen, A.; Savage, V.; West, G. Toward a metabolic theory of ecology. Ecology 2004, 85, 1771–1789. [Google Scholar] [CrossRef]
- Šímová, I.; Storch, D. The enigma of terrestrial primary productivity: Measurements, models, scales and the diversity–productivity relationship. Ecography 2017, 40, 239–252. [Google Scholar] [CrossRef]
- Zhou, J.; Ma, M.; Xiao, Q.; Wen, J. Vegetation cover dynamics and its relationship with climatic factors in Southwest China. Remote Sens. Technol. Appl. 2017, 32, 966–972. [Google Scholar]
- Yin, L.; Dai, E.; Zheng, D.; Wang, Y.; Ma, L.; Tong, M. What drives the vegetation dynamics in the Hengduan Mountain region, southwest China: Climate change or human activity? Ecol. Indic. 2020, 112, 106013. [Google Scholar] [CrossRef]
- Liu, H.; Zhang, M.; Lin, Z.; Xu, X. Spatial heterogeneity of the relationship between vegetation dynamics and climate change and their driving forces at multiple time scales in Southwest China. Agric. For. Meteorol. 2018, 256, 10–21. [Google Scholar] [CrossRef]
- Li, Q. Study on Spatial and Temporal Changes and Driving Forces of Net Primary Productivity of Vegetation in Panxi Region. Master’s Thesis, Chengdu University of Technology, Chengdu, China, 2019. [Google Scholar]
- Luo, Y. Study on the Influence of Regional Climate on Net Primary Productivity of Vegetation in Guizhou, in Lanzhou University. Master’s Thesis, Lanzhou University, Lanzhou, China, 2009. [Google Scholar]
- Liang, W.; Yang, Y.; Fan, D.; Guan, H.; Zhang, T.; Long, D.; Zhou, Y.; Bai, D. Analysis of spatial and temporal patterns of net primary production and their climate controls in China from 1982 to 2010. Agric. For. Meteorol. 2015, 204, 22–36. [Google Scholar] [CrossRef]
- Liu, S.; Guo, Q.; Wang, B. Prediction of the response of forest productivity to climate change in China. J. Ecol. 1998, 05, 32–37. [Google Scholar]
- Fei, X. Carbon exchange in typical forest ecosystems in Yunnan and its response to climate change. In Xishuangbanna Tropical Botanical Garden, Chinese Academy of Sciences; University of Chinese Academy of Sciences: Beijing, China, 2018; p. 220. [Google Scholar]
- Gu, X.; Huang, W.; Ji, J.; Wu, Z. Effects of climate change on net primary productivity of vegetation in Southwest China in recent 20 years. J. Nat. Resour. 2007, 7, 251–259+324. [Google Scholar]
- Li, X.; Li, Y.; Chen, A.; Gao, M.; Slette, I.; Piao, S. The impact of the 2009/2010 drought on vegetation growth and terrestrial carbon balance in Southwest China. Agric. For. Meteorol. 2019, 269, 239–248. [Google Scholar] [CrossRef]
- Yuan, W.; Zheng, Y.; Piao, S.; Ciais, P.; Lombardozzi, D.; Wang, Y.; Ryu, Y.; Chen, G.; Dong, W.; Hu, Z.; et al. Increased atmospheric vapor pressure deficit reduces global vegetation growth. Sci. Adv. 2019, 5, eaax1396. [Google Scholar] [CrossRef] [PubMed]
- Madeline, R.; Jordan, G.J.; Brodribb, T.J. Acclimation to humidity modifies the link between leaf size and the density of veins and stomata. Plant Cell Env. 2014, 37, 124–131. [Google Scholar] [CrossRef] [PubMed]
- Shamshiri, R.R.; Jones, J.; Thorp, K.; Ahmad, D.; Man, H.; Taheri, S. Review of optimum temperature, humidity, and vapour pressure deficit for microclimate evaluation and control in greenhouse cultivation of tomato: A review. Int. Agrophys. 2018, 32, 287–302. [Google Scholar] [CrossRef]
- Lopez, J.; Way, D.A.; Sadok, W. Systemic effects of rising atmospheric vapor pressure deficit on plant physiology and productivity. Glob. Chang. Biol. 2021, 27, 1704–1720. [Google Scholar] [CrossRef]
- Li, Z.; Zhang, Y.; Wang, S.; Yuan, G.; Yang, Y.; Cao, M. Evapotranspiration of a tropical rain forest in Xishuangbanna, southwest China. Hydrol. Processes 2010, 24, 2405–2416. [Google Scholar] [CrossRef]
- Chen, S.; Zhang, Y.; Wu, Q.; Liu, S.; Song, C.; Xiao, J.; Band, L.; Vose, J. Vegetation structural change and CO2 fertilization more than offset gross primary production decline caused by reduced solar radiation in China. Agric. For. Meteorol. 2021, 296, 108207. [Google Scholar] [CrossRef]
- Kubiske, M.E.; Pregitzer, K.; Mikan, C.; Zak, D.; Maziasz, J.; Teeri, A. Populus tremuloides photosynthesis and crown architecture in response to elevated CO2 and soil N availability. Oecologia 1997, 110, 328–336. [Google Scholar] [CrossRef] [Green Version]
- Wang, S.; Wang, S.; Lai, P.; He, B.; Ma, M.; Han, X. Remote sensing monitoring and spatial-temporal analysis of forest loss characteristics in Southwest China from 2001 to 2019. Remote Sens. Technol. Appl. 2021, 36, 552–563. [Google Scholar]
- Liu, L.; Yang, H.M.; Xu, Y.; Guo, Y.M.; Ni, J. Forest Biomass and Net Primary Productivity in Southwestern China: A Meta-Analysis Focusing on Environmental Driving Factors. Forests 2016, 7, 173. [Google Scholar] [CrossRef]
- Chen, Y.; Zhang, W.; Yang, T.; Zhao, G.; Wang, S. Change characteristics of net primary productivity of different vegetation types in China. J. Fudan Univ. 2012, 51, 377–381. [Google Scholar]
- Guan, X.; Shen, H.; Gan, W.; Yang, G.; Wang, L.; Li, X.; Zhang, L. A 33-year NPP monitoring study in southwest China by the fusion of multi-source remote sensing and station data. Remote Sens. 2017, 9, 1082. [Google Scholar] [CrossRef]
- Zhang, R.; Zhou, Y.; Luo, H.; Wang, F.; Wang, S. Estimation and analysis of spatiotemporal dynamics of the net primary productivity integrating efficiency model with process model in karst area. Remote Sens. 2017, 9, 477. [Google Scholar] [CrossRef]
- Zhang, X. Spatiotemporal Dynamics of NDVI and NPP and Their Correlation with Climatic Factors in Southwest China. Master’s Thesis, China Academy of Forestry Sciences, Beijing, China, 2011. [Google Scholar]
- Zhao, X. Spatial and Temporal Differentiation of Net Primary Productivity of Vegetation in Qinba Mountain Area from 2000 to 2015. Master’s Thesis, Southwest University, Chongqing, China, 2019. [Google Scholar]
- Liu, X. Productivity of Main Terrestrial Vegetation Types in China and Its Relationship with Climatic Factors. Master’s Thesis, Shanxi University, Taiyuan, China, 2019. [Google Scholar]
- Yu, W.; Dong, D.; Ni, J. Comparison of biomass and productivity between karst and non karst forests in Southwest China. J. Subtrop. Resour. Environ. 2010, 5, 25–30. [Google Scholar]
- Ni, J.; Zhang, X.; Scurlock, J. Synthesis and analysis of biomass and net primary productivity in Chinese forests. Ann. For. Sci. 2001, 58, 351–384. [Google Scholar] [CrossRef]
- Luo, T. Patterns of biological production and its mathematical models for main forest types of China. Ph.D. Dissertation, Committee of Synthesis Investigation of Natural Resources, Chinese Academy of Sciences, Beijing, China, 1996. [Google Scholar]
- Cai, W.; Yuan, W.; Liang, S.; Zhang, X.; Dong, W.; Xia, J.; Fu, Y.; Chen, Y.; Liu, D.; Zhang, Q. Improved estimations of gross primary production using satellite-derived photosynthetically active radiation. J. Geophys. Res. Biogeosci. 2014, 119, 110–123. [Google Scholar] [CrossRef]

Publisher’s Note: MDPI stays neutral with regard to jurisdictional claims in published maps and institutional affiliations. |
© 2022 by the authors. Licensee MDPI, Basel, Switzerland. This article is an open access article distributed under the terms and conditions of the Creative Commons Attribution (CC BY) license (https://creativecommons.org/licenses/by/4.0/).