
Productivity and Fuel Consumption in Skidding Roundwood on Flat Terrains by a Zetor Farm Tractor in Group Shelterwood Cutting of Mixed Oak Forests


Abstract
1. Introduction
2. Materials and Methods
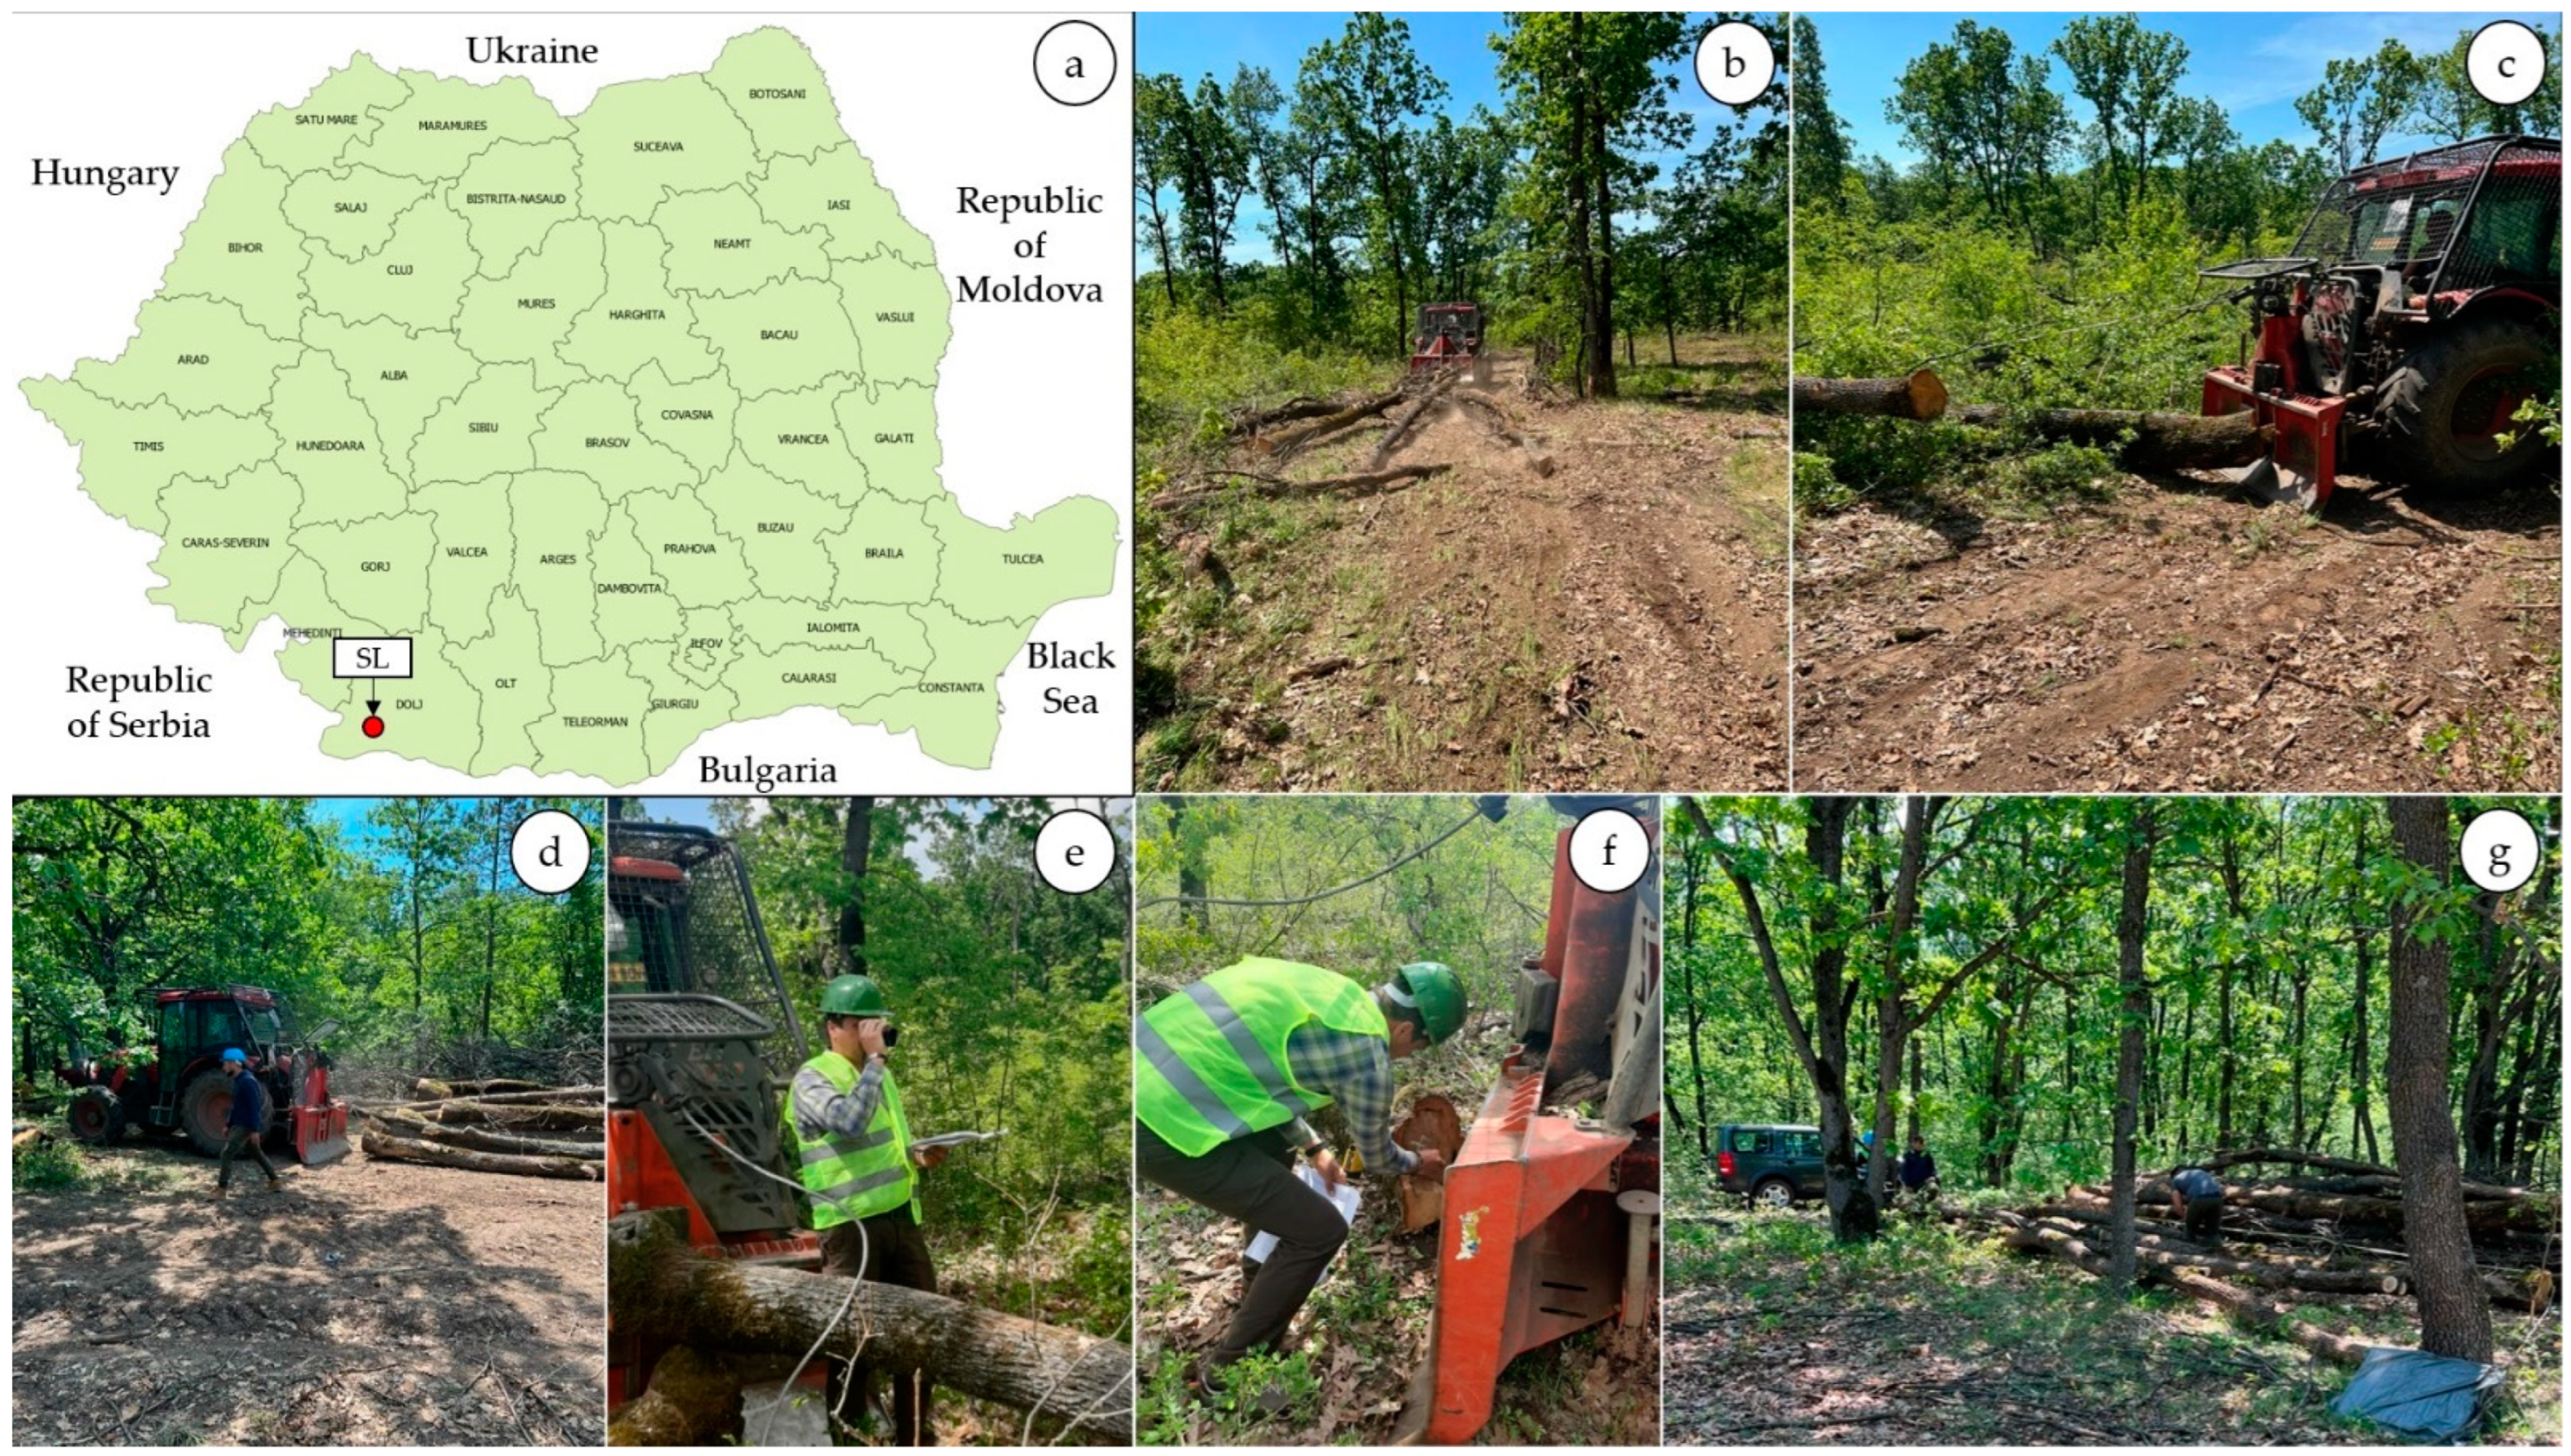
2.1. Study Location and Equipment Description
2.2. Organization of Work and Field Data Collection
2.3. Data Processing
2.3.1. Time Consumption, Efficiency and Productivity Data
2.3.2. Fuel Consumption Data
2.4. Data Analysis
2.4.1. Statistical Design
2.4.2. Prediction of Efficiency and Productivity
2.4.3. Software Used
3. Results
3.1. Time Consumption
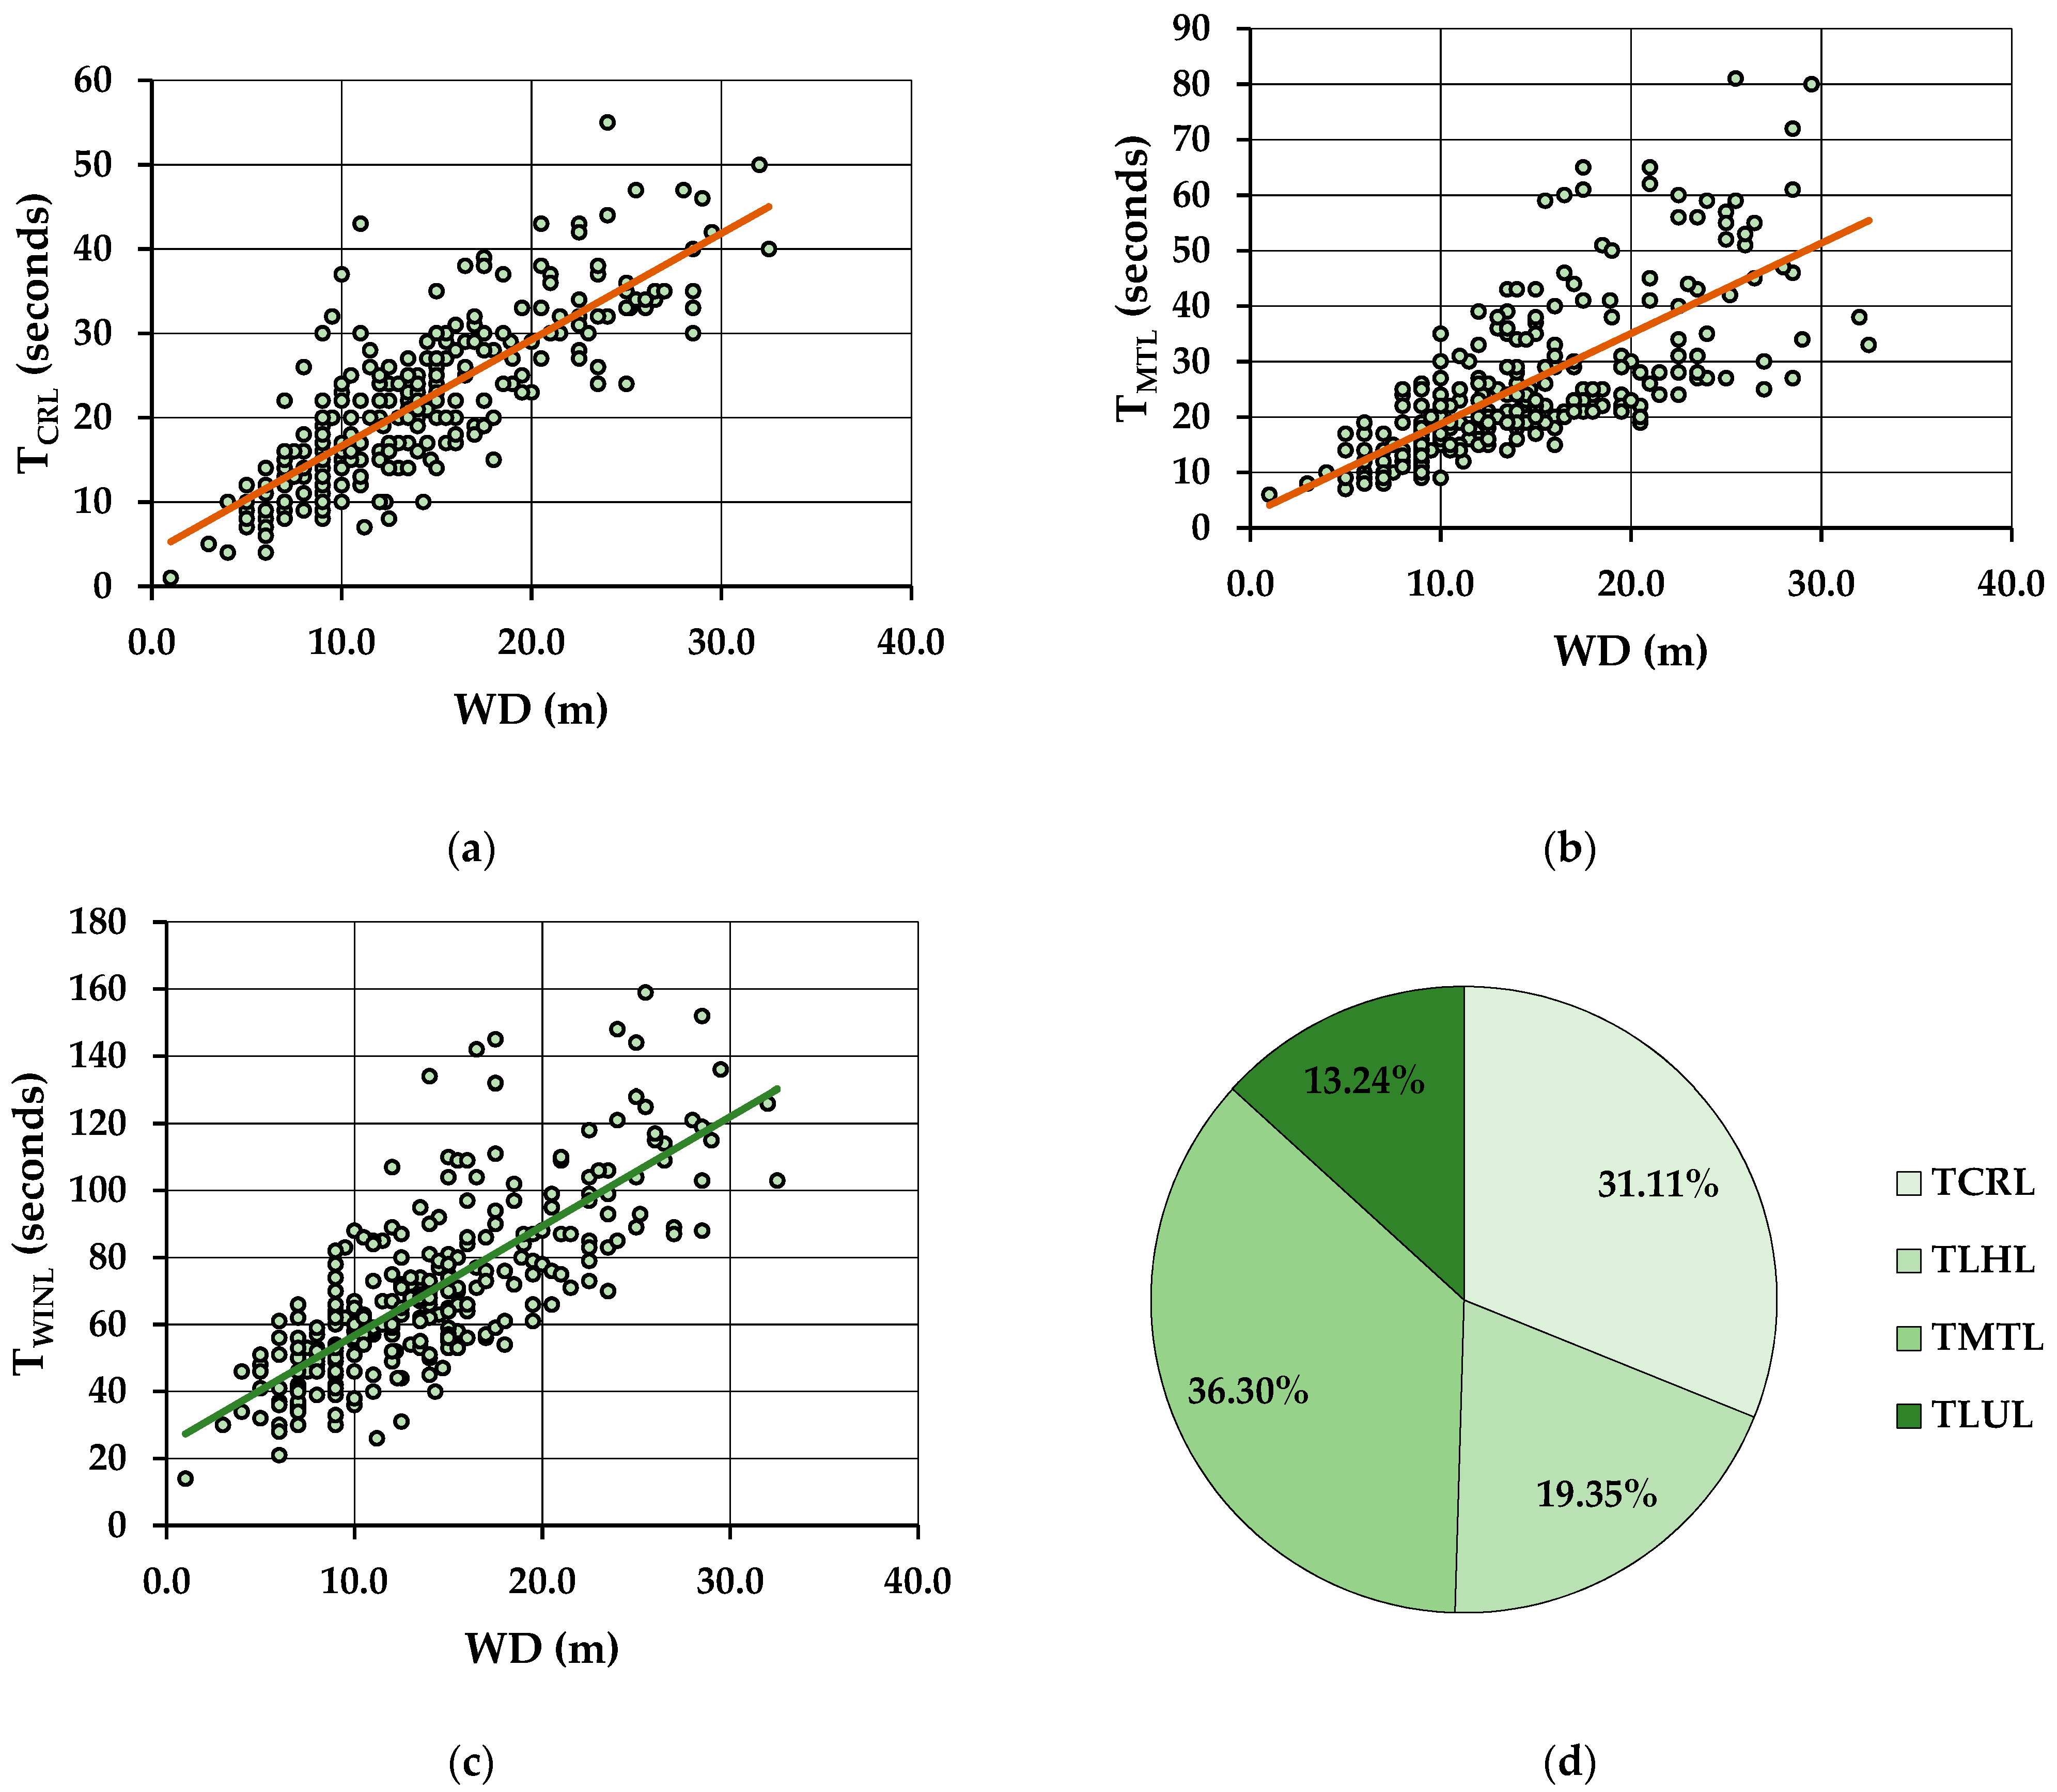
3.1.1. Log-Based Winching
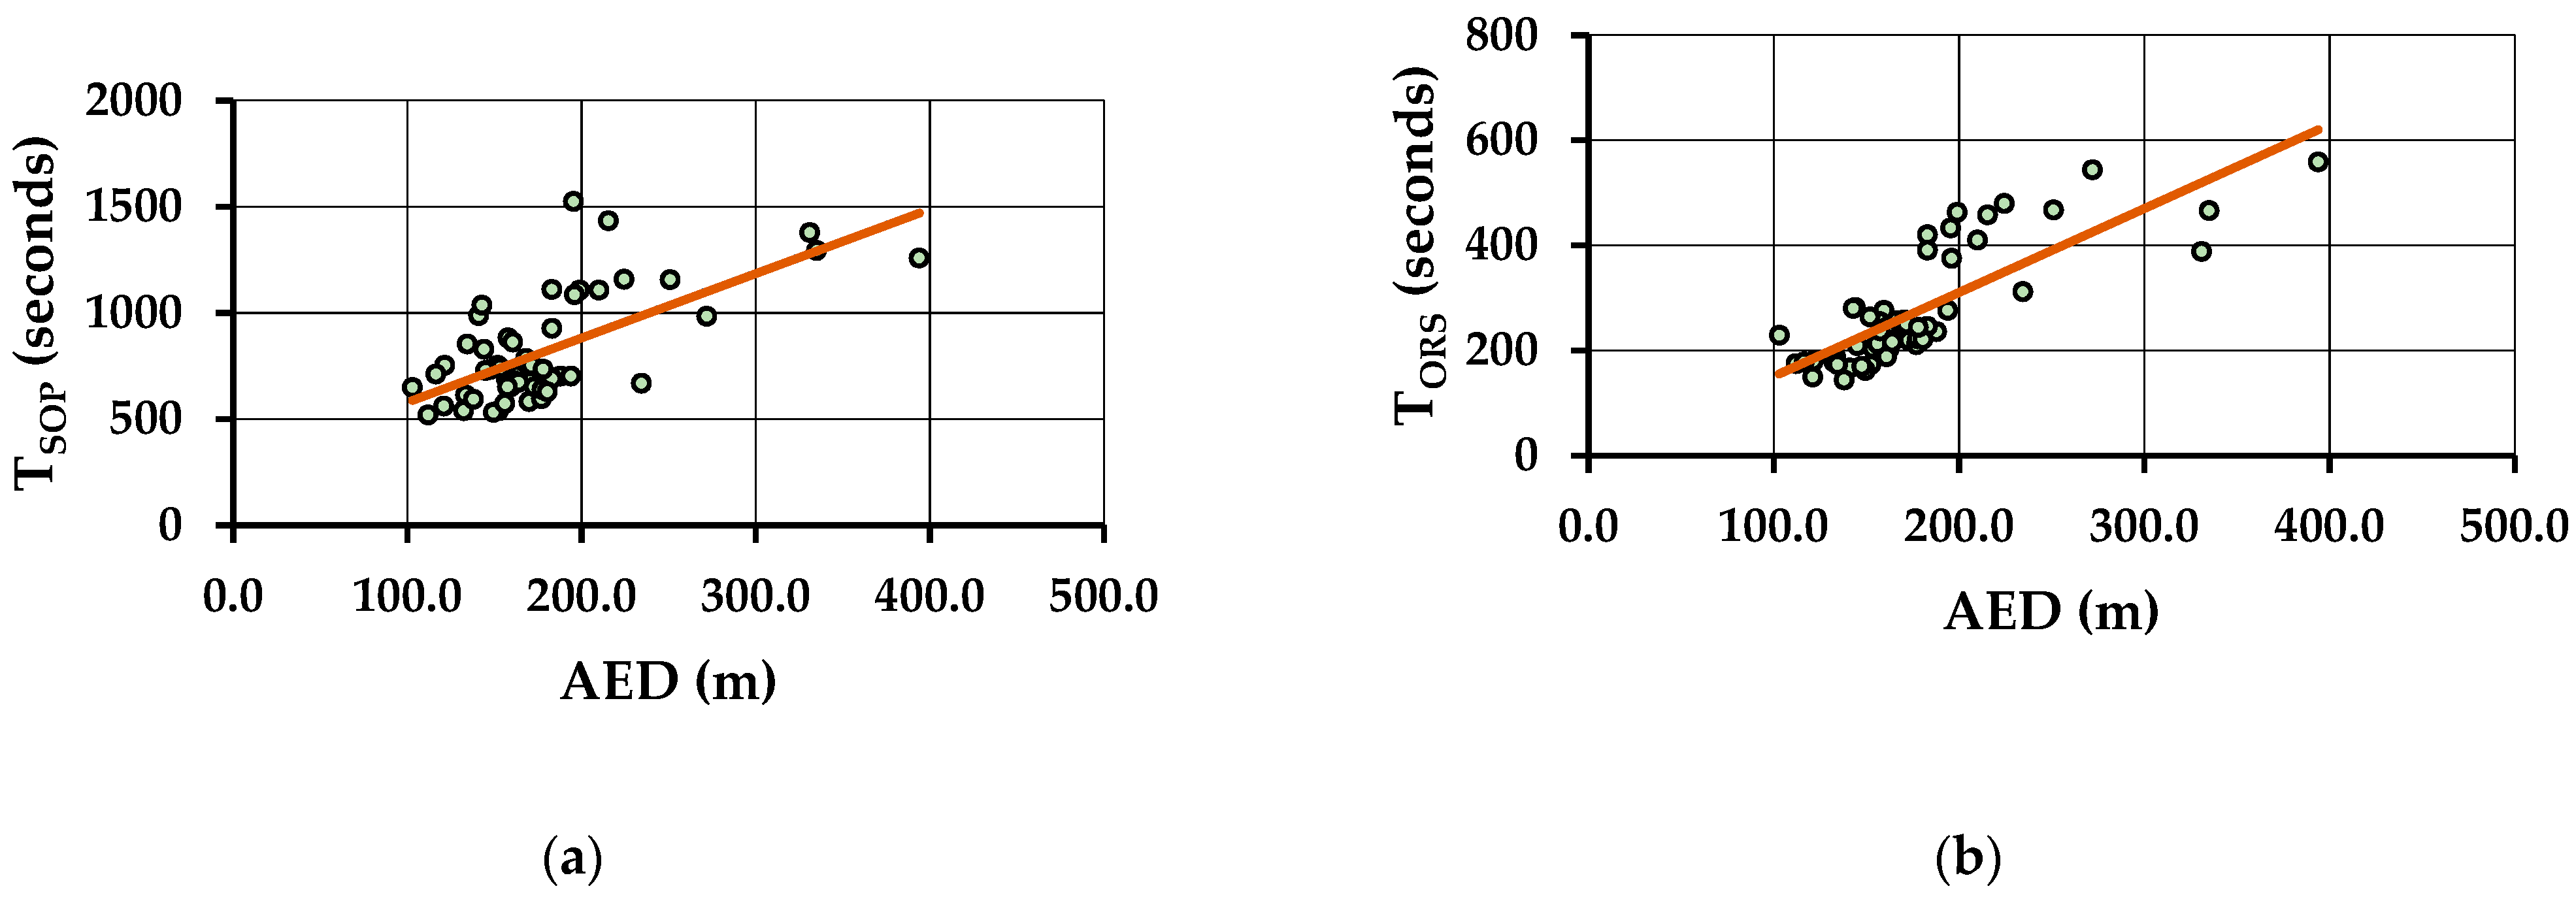
3.1.2. Skidding Operations
3.2. Fuel Consumption
3.3. Efficiency and Productivity
4. Discussion
5. Conclusions
Author Contributions
Funding
Informed Consent Statement
Data Availability Statement
Acknowledgments
Conflicts of Interest
Appendix A
References
- Marchi, E.; Chung, W.; Visser, R.; Abbas, D.; Nordfjell, T.; Mederski, P.S.; McEwan, A.; Brink, M.; Laschi, A. Sustainable forest operations (SFO): A new paradigm in a changing world and climate. Sci. Total Environ. 2018, 634, 1385–1397. [Google Scholar] [CrossRef] [PubMed]
- Hiesl, P.; Benjamin, J.G. Applicability of international harvesting equipment productivity studies in Maine, U.S.A.: A literature review. Forests 2013, 4, 898–921. [Google Scholar] [CrossRef]
- Borz, S.A.; Marcu, M.V.; Cataldo, M.F. Evaluation of an HSM 208F 14tone HVT-R2 forwarder prototype under conditions of steep-terrain low-access forests. Croat. J. For. Eng. 2021, 42, 185–200. [Google Scholar] [CrossRef]
- Lindroos, O.; Cavalli, R. Cable yarding productivity models: A systematic review over the period 2000–2011. Int. J. For. Eng. 2016, 27, 79–94. [Google Scholar] [CrossRef]
- Heinimann, H.R. A computer model to differentiate skidder and cable-yarder based road network concepts on steep slopes. J. For. Res. 1998, 3, 1–9. [Google Scholar] [CrossRef]
- Oprea, I. Tehnologia Exploatării Lemnului; Transilvania University Press: Braşov, Romania, 2008; pp. 11–80. ISBN 978-973-598-301-7. [Google Scholar]
- Lundbäck, M.; Häggström, C.; Nordfjell, T. Worldwide trends in methods for harvesting and extracting industrial roundwood. Int. J. For. Eng. 2021, 32, 202–215. [Google Scholar] [CrossRef]
- Spinelli, R.; Magagnotti, N.; Visser, R.; O’Neal, B. A survey of skidder fleet of Central, Eastern and Southern Europe. Eur. J. For. Res. 2021, 140, 901–911. [Google Scholar] [CrossRef]
- Moskalik, T.; Borz, S.A.; Dvorák, J.; Ferencik, M.; Glushkov, S.; Muiste, P.; Lazdinš, A.; Styranivsky, O. Timber harvesting methods in Eastern European countries: A review. Croat. J. For. Eng. 2017, 38, 231–241. [Google Scholar]
- Ghaffaryian, M.R. An overview on work productivity evaluation of farm tractors in skidding operations. Silva Balc. 2022, 23, 21–36. [Google Scholar] [CrossRef]
- Bîrda, M. Evaluation of winch performance in roundwood harvesting. Bull. Transilv. Univ. Bras. Ser. II For. Wood Ind. Agric. Food Eng. 2013, 6, 1–8. [Google Scholar]
- Borz, S.A. A Review of the Romanian and International Practices in Skidding Operations. In Proceedings of the XIV World Forestry Congress, Durban, South Africa, 7–11 September 2015; p. 11. [Google Scholar]
- Borz, S.A.; Ignea, G.; Popa, B.; Sparchez, G.; Iordache, E. Estimating time consumption and productivity of roundwood skidding in group shelterwood system—A case study in a broadleaved mixed stand located in reduced accessibility conditions. Croat. J. For. Eng. 2015, 36, 137–146. [Google Scholar]
- Borz, S.A.; Ignea, G.; Popa, B. Modelling and comparing timber winching performance in windthrow and uniform selective cuttings for two Romanian skidders. J. For. Res. 2014, 19, 473–482. [Google Scholar] [CrossRef]
- Borz, S.A.; Dinulica, F.; Birda, M.; Ignea, G.; Ciobanu, V.D.; Popa, B. Time consumption and productivity of skidding Silver fir (Abies alba Mill.) round wood in reduced accessibility conditions: A case study in windthorw salvage logging from Romanian Carpathians. Ann. For. Res. 2013, 56, 363–375. [Google Scholar]
- Vusić, D.; Šušnjar, M.; Marchi, E.; Spina, R.; Zečić, Ž.; Picchio, R. Skidding operations in thinning and shelterwood cut of mixed stands—Work productivity, energy inputs and emissions. Ecol. Eng. 2013, 61, 216–223. [Google Scholar] [CrossRef]
- Holzleitner, F.; Stampfer, K.; Visser, R. Utilization rates and cost factors in timber harvesting based on long-term machine data. Croat. J. For. Eng. 2011, 32, 501–508. [Google Scholar]
- Björheden, R.; Apel, K.; Shiba, M.; Thompson, M.A. IUFRO Forest Work Study Nomenclature; Swedish University of Agricultural Science: Grapenberg, Sweden, 1995; p. 16. [Google Scholar]
- Acuna, M.; Bigot, M.; Guerra, S.; Hartsough, B.; Kanzian, C.; Kärhä, K.; Lindroos, O.; Magagnotti, N.; Roux, S.; Spinelli, R.; et al. Good Practice Guidelines for Biomass Production Studies; CNR IVALSA Sesto Fiorentino (National Research Council of Italy—Trees and Timber Institute): Sesto Fiorentino, Italy, 2012; pp. 1–51. ISBN 978-88-901660-4-4. [Google Scholar]
- Ignea, G.; Ghaffaryian, M.R.; Borz, S.A. Impact of operational factors on fossil energy inputs in motor-manual tree felling and processing: Results of two case studies. Ann. For. Res. 2017, 60, 161–172. [Google Scholar] [CrossRef]
- Muşat, E.C.; Apăfăian, A.I.; Ignea, G.; Ciobanu, V.D.; Iordache, E.; Derczeni, R.A.; Spârchez, G.; Vasilescu, M.M.; Borz, S.A. Time expenditure in computer aided time studies implemented for highly mechanized forest equipment. Ann. For. Res. 2016, 59, 129–144. [Google Scholar] [CrossRef]
- Borz, S.A.; Cheţa, M.; Bîrda, M.; Proto, A.R. Classifying operational events in cable yarding by a machine learning application to GNSS-collected data: A case study on gravity-assisted downhill yarding. Bull. Transilv. Univ. Bras. Ser. II For. Wood Ind. Agric. Food Eng. 2022, 15, 13–32. [Google Scholar] [CrossRef]
- Cataldo, M.F.; Marcu, M.V.; Iordache, E.; Zimbalatti, G.; Proto, A.R.; Borz, S.A. Performance of forwarding operations in biomass recovery from apple orchards. Small-Scale For. 2022. [Google Scholar] [CrossRef]
- Zar, J.H. Biostatistical Analysis, 5th ed.; Pearson Prentice Hall: Hoboken, NJ, USA, 2010; p. 944. [Google Scholar]
- Gallis, C.; Spyroglou, G. Productivity linear regressions of tree-length harvesting system in natural coastal Aleppo pine (Pinus halepensis L.) forests in the Chalkidiki area of Greece. Croat. J. For. Eng. 2012, 33, 115–123. [Google Scholar]
- Yoshida, M.; Sakai, H. Winch harvesting on flat and steep terrain areas and improvements of its methodology. Croat. J. For. Eng. 2015, 36, 55–61. [Google Scholar]
- Sowa, J.M.; Szewczyk, G. Time consumption of skidding in mature stands performed by winches powered by farm tractor. Croat. J. For. Eng. 2013, 34, 255–264. [Google Scholar]
- Gilanipoor, N.; Najafi, A.; Heshmat Alvaezin, S.M. Productivity and cost of farm tractor skidding. J. For. Sci. 2012, 58, 21–26. [Google Scholar] [CrossRef]
- Proto, A.R.; Macri, G.; Visser, R.; Russo, D.; Zimbalatti, G. Comparison of timber extraction productivity between winch and grapple skidding: A case study in Southern Italian Forests. Forests 2018, 9, 61. [Google Scholar] [CrossRef]
- Gülci, S.; Büyüksakalli, H.; Taş, I.; Akay, A.E. Productivity analysis of timber skidding operation with farm tractor. Eur. J. For. Eng. 2018, 4, 26–32. [Google Scholar] [CrossRef][Green Version]
- Özturk, T.; Varsak, M.G.; Bilici, E. Evaluating productivity and cycle time of skidding method with farm tractors in Bigadic Forest Enterprise Directorate in Turkey. Eur. J. For. Eng. 2018, 5, 77–82. [Google Scholar]
- Sabo, A.; Poršinsky, T. Skidding of fir roundwood by Timberjack 240C from selective forests of Groski Kotar. Croat. J. For. Eng. 2005, 26, 13–27. [Google Scholar]
- Boja, N.; Borz, S.A. Energy inputs in motor-manual release cutting of broadleaved forests: Results of twelve options. Energies 2020, 13, 4597. [Google Scholar] [CrossRef]
- Berendt, F.; Fortin, M.; Suchomel, C.; Schweier, J. Productivity, costs, and selected environmental impacts of remote-controlled mini forestry crawlers. Forests 2018, 9, 591. [Google Scholar] [CrossRef]
- Balimunsi, H.; Grigolato, S.; Picchio, R.; Nyombi, K.; Cavalli, R. Productivity and energy balance of forest plantation harvesting in Uganda. For. Stud. China 2012, 14, 279–282. [Google Scholar] [CrossRef]
- Maesano, M.; Picchio, R.; Lo Monaco, A.; Neri, F.; Lasserre, B.; Marchetti, M. Productivity and energy consumption in logging operation in a Cameroonian tropical forest. Ecol. Eng. 2013, 57, 149–153. [Google Scholar] [CrossRef]
- Picchio, R.; Maesano, M.; Savelli, S.; Marchi, E. Productivity and Energy Balance in Conversion of a Quercus Cerris L. Coppice stand into a High Forest stand in Central Italy. Croat. J. For. Eng. 2009, 30, 15–26. [Google Scholar]
- Airoldi, G.; Calvo, A.; Manzone, M. Oil consumption in 4WD farm tractors used in forestry operations. Croat. J. For. Eng. 2020, 41, 333–345. [Google Scholar] [CrossRef][Green Version]
- Ottaviani Aalmo, G.; Magagnotti, N.; Spinelli, R. Forest workers and steep terrain winching: The impact of environmental and anthropometric parameters on performance. Croat. J. For. Eng. 2016, 37, 97–105. [Google Scholar]


| Parameter (Measurement Unit) | Forest Compartment | Source and Description | |
|---|---|---|---|
| 19M | 83B | ||
| Location, topography and spatial extent | |||
| County | Dolj | Dolj | - |
| Forest district | Filiaşi | Craiova | - |
| Coordinates | 44°25.5634′ N–23°18.530′ E | 44°14.351′ N–23°39.231′ E | Centers of the felling areas, based on GPS and GIS files |
| Altitude (m, a.s.l.) | 240 | 165 | Forest management plan |
| Area (ha) | 9.53 | 17.72 | Wood selling documents |
| Slope (°—%) | 10–18 | 0–0 | Wood selling documents |
| Aspect | Southeastern | - | Forest management plan |
| Topography | hill | plain | Forest management plan |
| Stock and silvicultural system | |||
| Tree species | Quercus frainetto Quercus cerris | Quercus frainetto Quercus cerris | Wood selling documents |
| Age (years) | 109 | 85 | Wood selling documents, average value of trees proposed for extraction |
| Tree height (m) | 13 | 15 | Wood selling documents, average value of trees proposed for extraction |
| Diameter at the breast height (cm) | 21 | 26 | Wood selling documents, average value of trees proposed for extraction |
| Volume for extraction (m3 over bark) | 148.82 | 490.74 | Wood selling documents, total value of trees proposed for extraction |
| No. of trees for extraction | 578 | 1009 | Wood selling documents, total value per compartment |
| Average tree size (m3/tree) | 0.257 | 0.486 | Wood selling documents, average value of trees proposed for extraction |
| Silvicultural system | Group shelterwood | Group shelterwood | Wood selling documents |
| Harvesting system | |||
| Felling and processing | Motor-manual | Motor-manual | Field observation |
| Extraction | Farm tractor equipped with a winch | Farm tractor equipped with a winch | Field observation |
| Landing operations | Farm tractor | Farm tractor | Field observation |
| Component | Measurement Unit | Values | Description |
|---|---|---|---|
| Base machine | - | - | Zetor Proxima HS |
| Engine power | kW | 86.4 | Model: Zetor; Type: turbodiesel; Displacement: 4156 cc; Tier: IV; Number of cylinders: 4; |
| Mass | kg | 4257 | |
| Transmission | - | - | Mechanical, four-wheel drive, powershift |
| Winch | - | - | Krpan 8.5 EH |
| Type | - | - | Single drum |
| Recommended power | kW | >59 | - |
| Average line speed | m/s | 0.6 | - |
| Tractive force | kN | 85 | - |
| Cable diameter | mm | 13 | - |
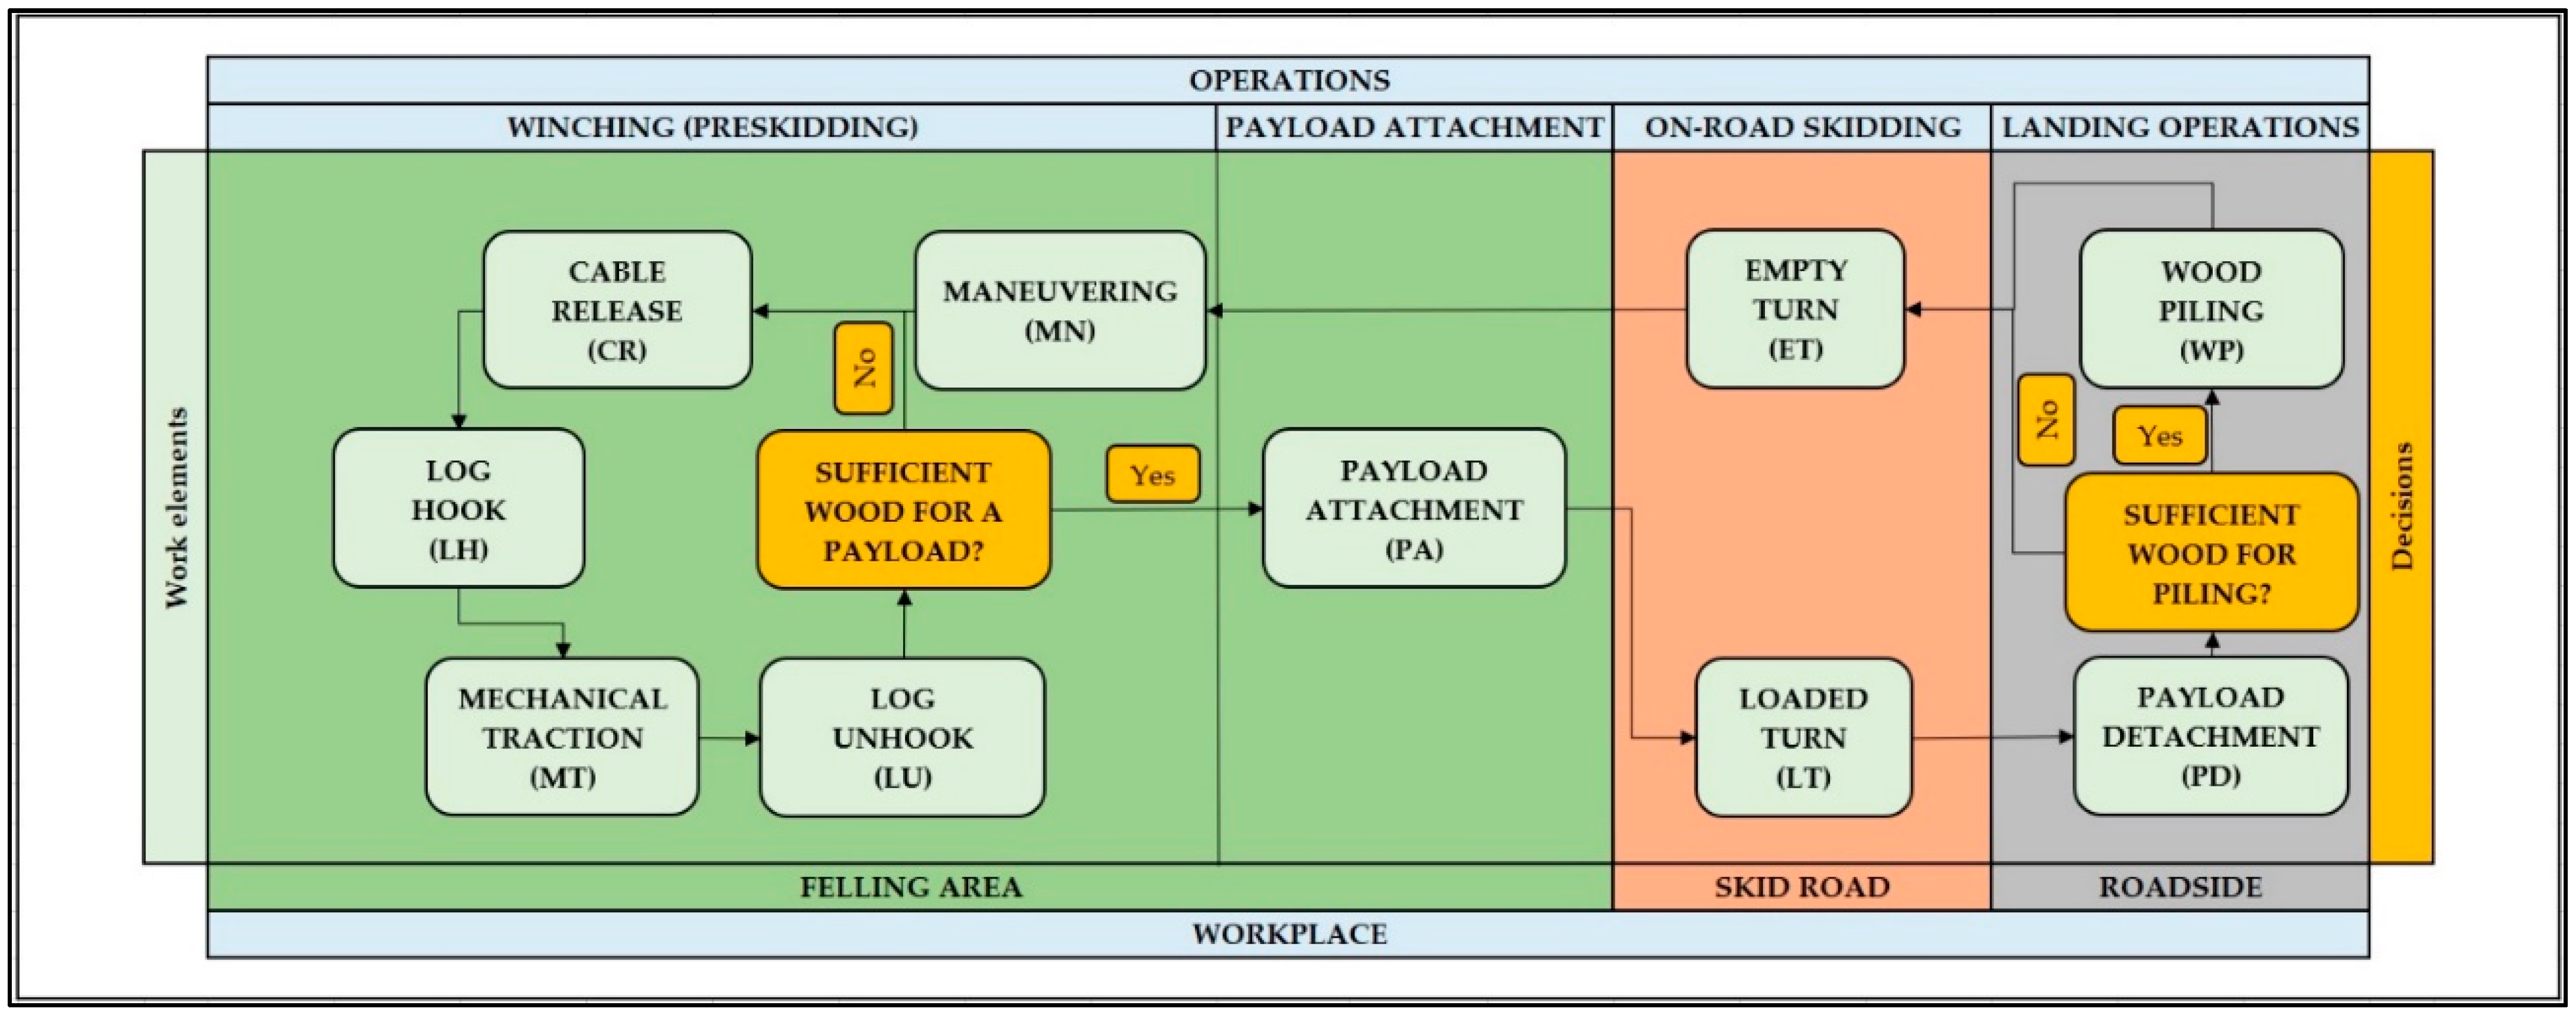
| Operations and Work Elements | Abbreviation | Description |
|---|---|---|
| Skidding (Operations) | SOP | Description: extracting and piling the wood at the roadside; Breakpoints: begins when the tractor leaves the forest road and ends when the payload was detached or the tractor has finished wood piling at the roadside; Component operations: Landing operations, On-road skidding, Winching, Payload forming; Workplaces: roadside, skid-road; felling area; Work object: payload. |
| Landing operations (Operation) | LOP | Description: transporting the wood along the piles, payload detachment and wood piling. Occurrence: cyclic, observed in most skidding cycles; Breakpoints: begins when the tractor entered the forest road and ends when it finished piling or when a payload was detached and the tractor begun an empty turn; Work elements: payload detachment and piling; Workplace: roadside; Work object: payload. |
| Load detachment (Work element) | LD | Description: the worker detaches a payload once the tractor arrived at the roadside; Occurrence: cyclic, observed in all cycles of landing operations; Breakpoints: begins when the tractor ended the empty turn and ends when the load was detached and the tractor engages either in piling or in a new empty turn; Workplace: skid road; Work object: payload. |
| Wood piling (Work element) | WP | Description: the tractor makes maneuvers to pile the wood; Occurrence: cyclic, observed in most of the cycles of landing operations; Breakpoints: begins when a payload was detached and ends when the tractor starts a new empty turn; Workplace: skid road; Work object: payload. |
| On-road skidding (Operation) | ORS | Description: moving empty on the skid road from the roadside to felling area and loaded back; Occurrence: cyclic, observed in all skidding cycles; Breakpoints: see the description of component work elements; Work elements: empty turn and loaded turn; Workplace: skid road; Work object: payload. |
| Empty turn (Work element) | ET | Description: moving empty on the skid road from the roadside to felling area; Occurrence: cyclic, observed in all on-road skidding cycles; Breakpoints: begins when a payload was left at the roadside or after piling and ends when the tractor reaches the felling area and starts to make positioning maneuvers; Workplace: skid road; Work object: payload. |
| Loaded turn (Work element) | LT | Description: moving loaded on the skid road from the felling area to roadside; Occurrence: cyclic, observed in all on-road skidding cycles; Breakpoints: begins when a payload was attached at the felling area and ends once the tractor has reached the roadside and starts to work at landing; Workplace: skid road; Work object: payload. |
| Winching (Operation) | WIN | Description: maneuvering the tractor to place it with the winch towards the logs to be extracted, releasing the cable, attaching the log, mechanical traction and detaching the log; Occurrence: cyclic, observed in all skidding work cycles; Breakpoints: begins when the tractor reached to the felling area and starts maneuvering to place the winch towards the logs and ends once the tractor was ready to attach a payload; Work elements: maneuvering, cable releasing, log hooking, mechanical traction, log unhooking; Workplace: felling area; Work object: payload. |
| Maneuvering (Work element) | MN | Description: maneuvering the tractor to place it with the winch towards the logs to be extracted; Occurrence: cyclic, observed in all of the winching work cycles; Breakpoints: begins when the tractor reached to the felling area and starts maneuvering to place the winch towards the logs and ends when the cable starts to be released; Workplace: felling area; Work object: payload. |
| Cable release (Work element) | CR | Description: the tractor driver unlocks the winch and a worker pulls the cable to a log; Occurrence: cyclic, observed in all of the winching work cycles; Breakpoints: begins when the worker grabs the cable and ends when the worker reaches to the log; Workplace: felling area; Work object: log. |
| Log hook (Work element) | LH | Description: the worker uses the cable to hookup a log; Occurrence: observed in all of the winching work cycles; Breakpoints: begins when the worker starts to hookup the log and ends when the log is attached to the cable; Workplace: felling area; Work object: log. |
| Mechanical traction (Work element) | MT | Description: the tractor driver operates the winch to move the log at the tractor while the worker tracks the log until the back of the tractor and releases it from obstacles when the case; Occurrence: observed in all of the winching work cycles; Breakpoints: begins when the tractor driver starts to operate the winch and ends once the log reached at the tractor; Workplace: felling area; Work object: log. |
| Log unhook (Work element) | LU | Description: the worker detaches the log at the back of the tractor; Occurrence: observed in all of the winching work cycles; Breakpoints: begins when the log reached the tractor and ends once the cable is free; Workplace: felling area; Work object: log. |
| Payload attachment (Operation) | PA | Description: the worker attaches several logs to the cable to form a payload for loaded turn once enough logs are available at the back of the tractor; Occurrence: observed in all of the skidding work cycles; Breakpoints: begins when the worker grabs the cable and ends when the payload is attached and suspended at one end; Workplace: felling area; Work object: payload. |
| Category and Variable | Descriptive Statistics | |||||
|---|---|---|---|---|---|---|
| Minimum Value | Maximum Value | Mean Value ± Standard Deviation | Median Value | Number of Observations | Sum | |
| Operational | ||||||
| Log length (LL, m) | 1.45 | 14.50 | 10.14 ± 2.26 | 10.50 | 278 | - |
| Log volume (LV, m3) a | 0.03 | 0.93 | 0.37 ± 0.17 | 0.37 | 278 | 101.52 |
| Winching distance (WD, m) | 1.00 | 32.50 | 14.13 ± 6.25 | 13.50 | 278 | - |
| Time consumption | ||||||
| Cable releasing time (TCRL, seconds) | 1.00 | 55.00 | 21.85 ± 9.73 | 21.00 | 278 | 6073.00 |
| Log hook time (TLHL, seconds) | 3.00 | 65.00 | 13.59 ± 8.90 | 11.00 | 278 | 3778.00 |
| Mechanical traction time (TMTL, seconds) | 6.00 | 81.00 | 25.49 ± 14.06 | 22.00 | 278 | 7087.00 |
| Log unhook time (TLHL, seconds) | 3.00 | 24.00 | 9.30 ± 4.74 | 8.00 | 278 | 2585.00 |
| Log-based winching cycle time (TWINL, seconds) | 14.00 | 159.00 | 70.23 ± 26.52 | 66.00 | 278 | 19,523.00 |
| Model | N | R2 | Predictor | α | p-Value |
|---|---|---|---|---|---|
| TCRL (seconds) = 1.26 × WD (m) + 4.01 | 278 | 0.66 | WD | 0.05 | <0.001 |
| TMTL (seconds) = 1.63 × WD (m) + 2.47 | 278 | 0.53 | WD | 0.05 | <0.001 |
| TWINL (seconds) = 3.27 × WD (m) + 24.07 | 278 | 0.59 | WD | 0.05 | <0.001 |
| Category and Variable | Descriptive Statistics | |||||
|---|---|---|---|---|---|---|
| Minimum Value | Maximum Value | Mean Value ± Standard Deviation | Median Value | Number of Observations | Sum | |
| Operational | ||||||
| Number of logs per payload (NL) | 2.00 | 8.00 | 4.96 ± 1.37 | 5.00 | 56 | 278.00 |
| Payload volume (PV, m3) a | 0.61 | 2.76 | 1.81 ± 0.36 | 1.81 | 56 | 101.52 |
| Average winching distance (AWD, m) | 8.00 | 26.00 | 14.43 ± 4.22 | 13.15 | 56 | - |
| Empty turn distance (ETD, m) | 69.00 | 359.00 | 160.34 ± 53.47 | 153.50 | 56 | 8979 |
| Loaded turn distance (LTD, m) | 123.00 | 429.00 | 194.27 ± 60.22 | 180.50 | 56 | 10,879 |
| Average extraction distance (AED, m) | 103.00 | 394.00 | 177.30 ± 53.66 | 165.25 | 56 | 9929 |
| Time consumption | ||||||
| Empty turn time (TET, seconds) | 62.00 | 199.00 | 105.82 ± 34.13 | 98.00 | 56 | 5926.00 |
| Maneuvering time (TMN, seconds) | 5.00 | 85.00 | 31.96 ± 17.29 | 30.00 | 56 | 1790.00 |
| Winching time (TWIN, seconds) | 204.00 | 792.00 | 380.59 ± 131.68 | 352.00 | 56 | 21,313.00 |
| Payload attachment time (TPA, seconds) | 22.00 | 142.00 | 58.70 ± 27.14 | 51.5 | 56 | 3287.00 |
| Loaded turn time (TLT, seconds) | 80.00 | 399.00 | 168.09 ± 78.88 | 144.00 | 56 | 9413.00 |
| Payload detachment time (TLD, seconds) | 3.00 | 32.00 | 13.64 ± 6.82 | 12.00 | 56 | 764.00 |
| Wood piling time (TWP, seconds) | 18.00 | 205.00 | 92.85 ± 45.43 | 75.00 | 52 | 4828.00 |
| On-road skidding time (TORS, seconds) | 144.00 | 559.00 | 273.91 ± 107.29 | 241.50 | 56 | 15,339.00 |
| Landing operations time (TLOP, seconds) | 3.00 | 218.00 | 99.86 ± 50.90 | 89.00 | 56 | 5592.00 |
| Skidding cycle time (TSOP, seconds) | 520.00 | 1524.00 | 813.05 ± 247.08 | 723.50 | 56 | 45,531.00 |
| Study delays (TSD, seconds) | - | - | - | - | - | 36,106.00 |
| Technical delays (TTD, seconds) | - | - | - | - | - | 11,688.00 |
| Total observed time (TOBS, seconds) | - | - | - | - | - | 93,325.00 |
| Model | N | R2 | Global Sig. | Predictor | α | p-Value |
|---|---|---|---|---|---|---|
| TSOP (seconds) = 90.09 × NL + 15.81 × AWD (m) + 2.24 × AED (m) − 259.20 | 56 | 0.75 | <0.001 | NL | 0.05 | <0.001 |
| AWD | 0.05 | <0.001 | ||||
| AED | 0.05 | <0.001 | ||||
| TORS (seconds) = 1.60 × AED (m) − 9.20 | 56 | 0.64 | <0.001 | AED | 0.05 | <0.001 |
| TET (seconds) = 0.44 × ETD (m) + 35.60 | 56 | 0.47 | <0.001 | ETD | 0.05 | <0.001 |
| TLT (seconds) = 1.06 × LTD (m) − 38.77 | 56 | 0.66 | <0.001 | LTD | 0.05 | <0.001 |
| TWIN (seconds) = 54.35 × NL + 17.20 × AWD (m) – 137.40 | 56 | 0.67 | <0.001 | NL | 0.05 | <0.001 |
| AWD | 0.05 | <0.001 |
| Category and Variable | Descriptive Statistics | |||||
|---|---|---|---|---|---|---|
| Minimum Value | Maximum Value | Mean Value ± Standard Deviation | Median Value | Number of Observations | Sum | |
| Operational | ||||||
| Number of logs (NL) | 4.00 | 8.00 | 6.58 ± 1.51 | 7.00 | 12 | 79.00 |
| Payload volume (PV, m3) a | 1.23 | 2.23 | 1.76 ± 0.33 | 1.74 | 12 | 21.123 |
| Average winching distance (AWD, m) a | 8.00 | 21.00 | 13.92 ± 4.08 | 14.00 | 12 | - |
| Empty turn distance (ETD, m) a | 89.00 | 288.00 | 185.58 ± 53.44 | 177.00 | 12 | 2227.00 |
| Loaded turn distance (LTD, m) a | 123.00 | 256.00 | 180.00 ± 44.83 | 170.00 | 12 | 2160.00 |
| Average extraction distance (AED, m) a | 112.00 | 272.00 | 182.79 ± 45.14 | 175.50 | 12 | 2193.50 |
| Fuel consumption | ||||||
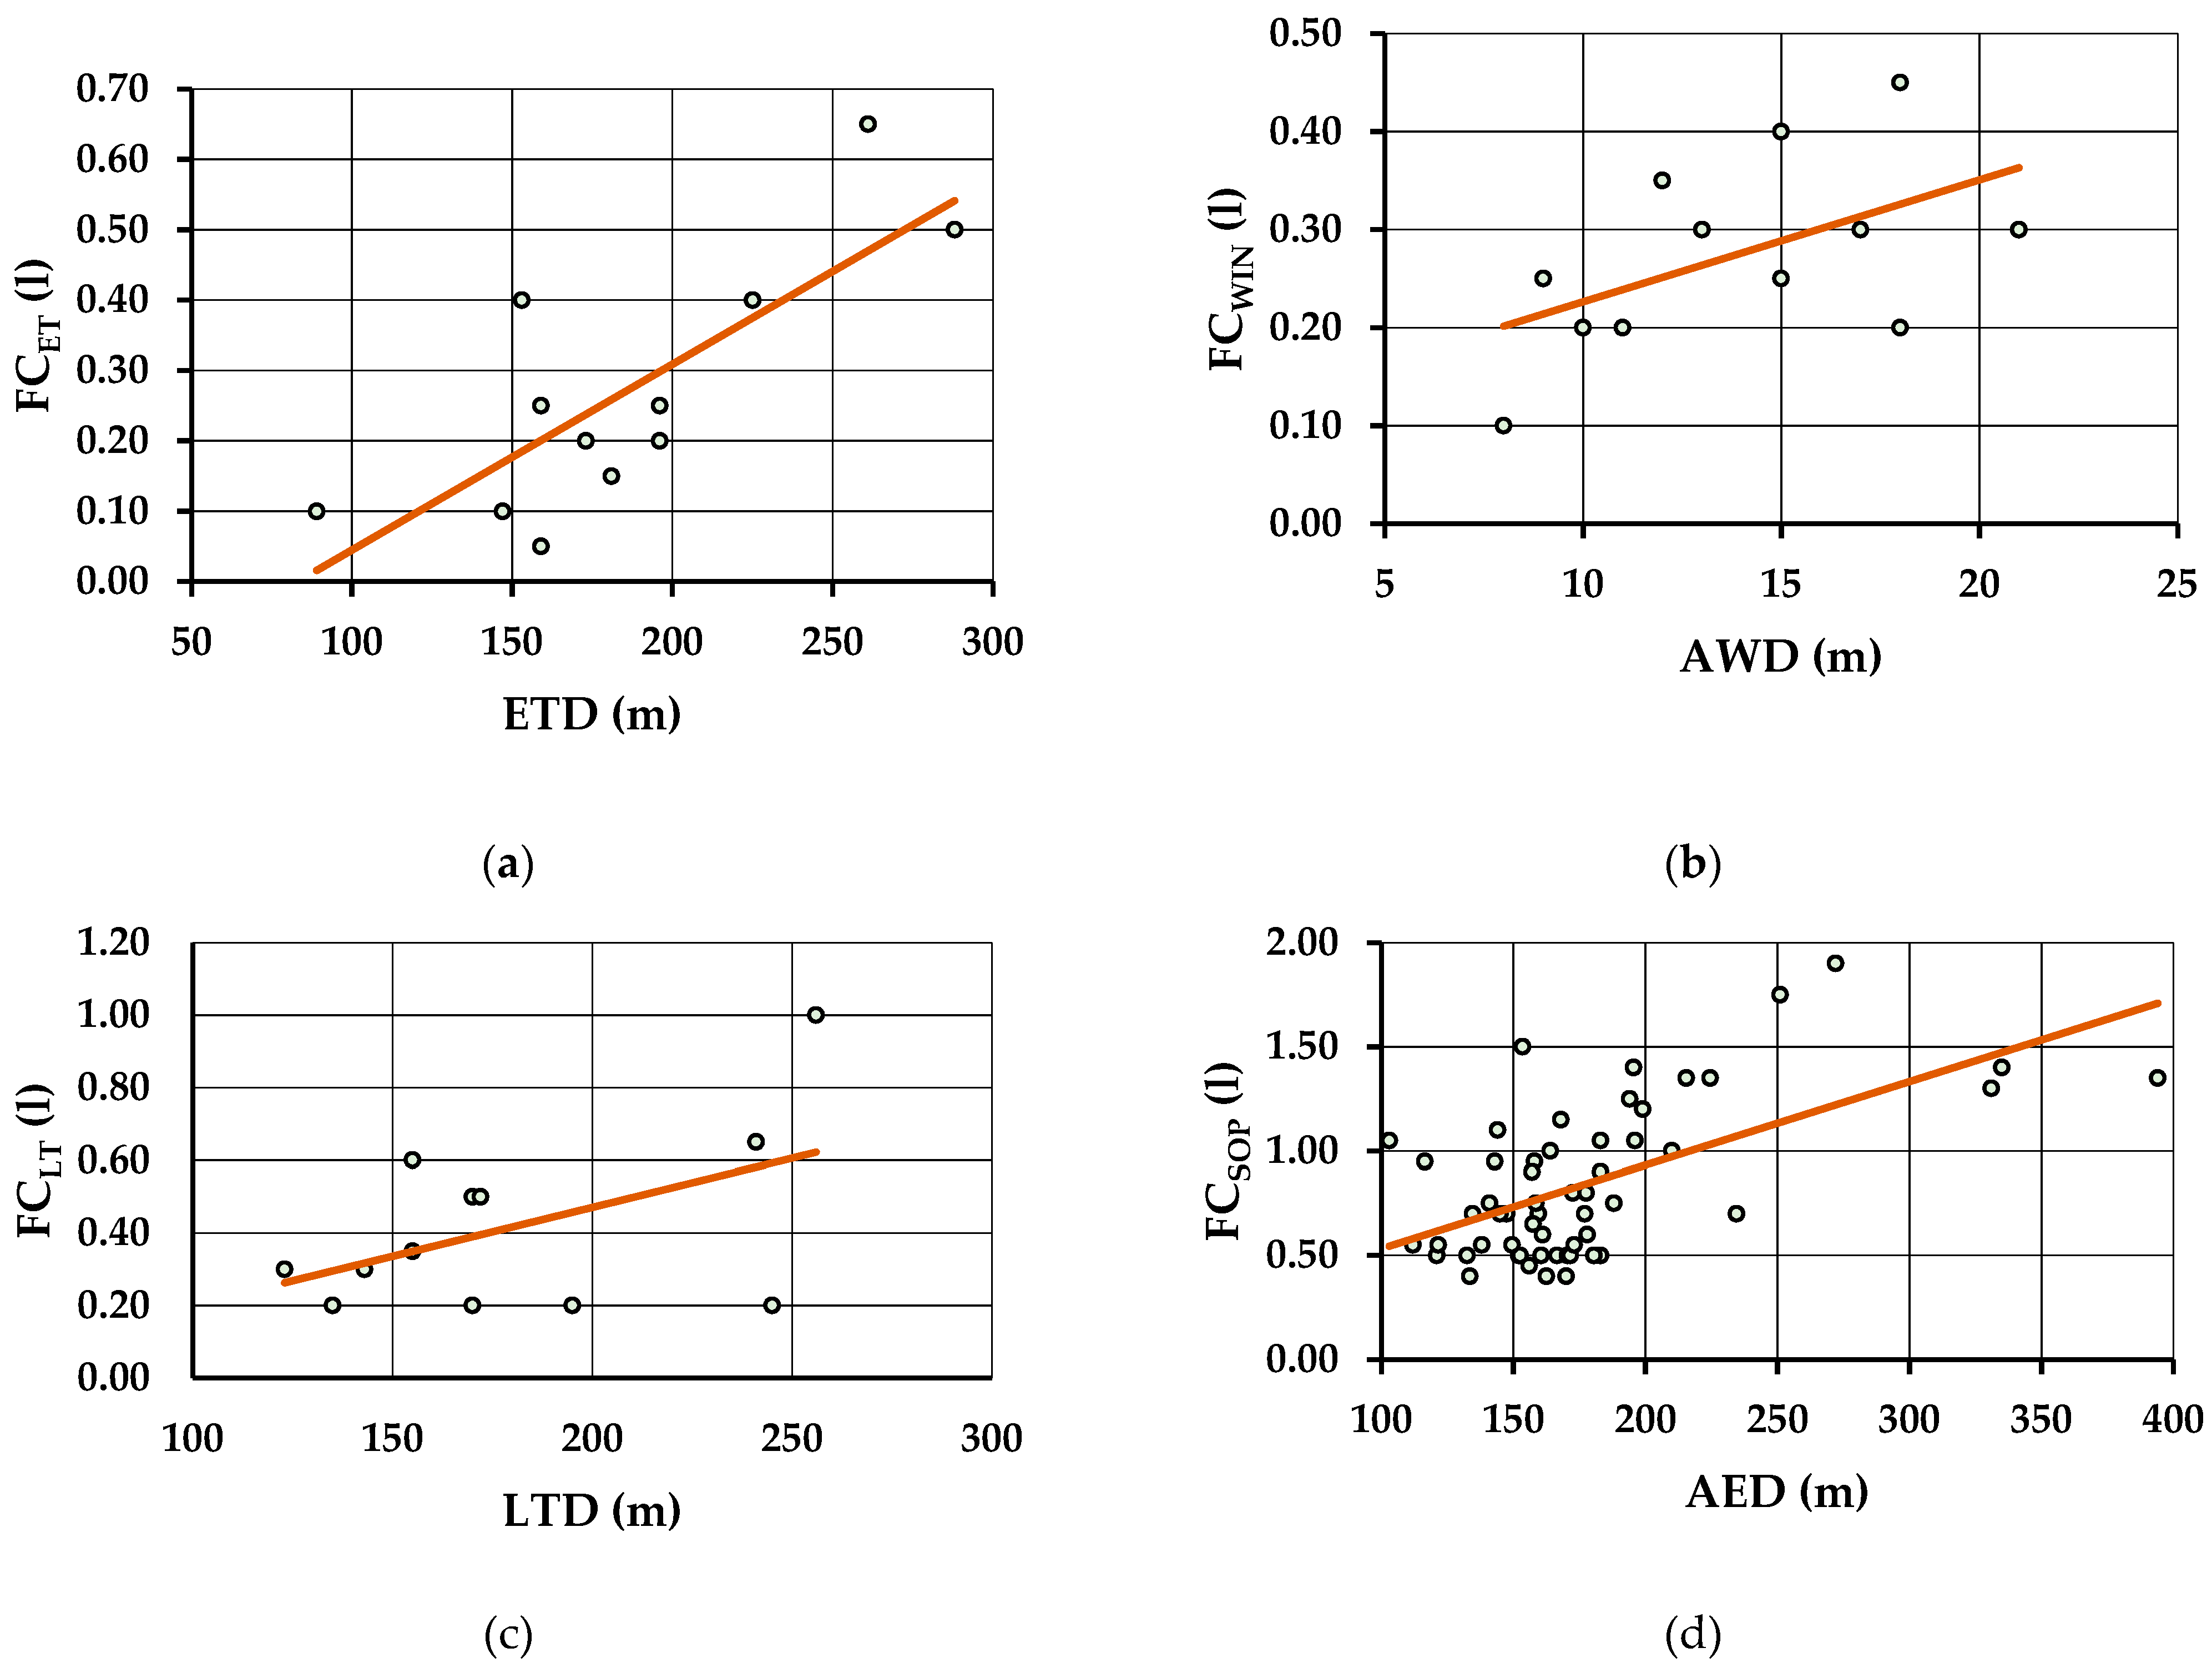
| Fuel consumption for empty turn (FCET, L) a | 0.05 | 0.65 | 0.27 ± 0.18 | 0.23 | 12 | 3.25 |
| Fuel consumption for winching and payload attachment (FCWIN, L) a | 0.10 | 0.45 | 0.28 ± 0.10 | 0.28 | 12 | 3.30 |
| Fuel consumption for loaded turn and payload detachment (FCLT, L) | 0.20 | 1.00 | 0.42 ± 0.25 | 0.33 | 12 | 5.00 |
| Fuel consumption for landing operations (FCLOP, L) | 0.10 | 0.40 | 0.18 ± 0.11 | 0.15 | 7 | 1.25 |
| Fuel consumption for skidding operations (FCSOP, L) | 0.40 | 1.90 | 0.84 ± 0.36 | 0.73 | 56 | 47.10 |
| Fuel consumption metrics | ||||||
| Hourly fuel consumption for empty turn (HFCET, L/h) | - | - | 7.07 | - | 12 | 3.25 |
| Hourly fuel consumption for winching and payload attachment (HFCWIN, L/h) | - | - | 2.04 | - | 12 | 3.30 |
| Hourly fuel consumption for loaded turn and payload detachment (HFCLT, L/h) | - | - | 7.44 | - | 12 | 5.00 |
| Hourly fuel consumption for landing operations (HFCLOP, L/h) | - | - | 4.50 | - | 7 | 1.25 |
| Hourly fuel consumption for skidding operations (HFCSOP, L/h) | - | - | 3.72 | - | 56 | 47.10 |
| Unit fuel consumption for empty turn (UFCET, L/m3) | - | - | 0.15 | - | 12 | 3.25 |
| Unit fuel consumption for winching and payload attachment (HFCWIN, L/m3) | - | - | 0.16 | - | 12 | 3.30 |
| Unit fuel consumption for loaded turn (HFCLT, L/m3) | - | - | 0.24 | - | 12 | - |
| Unit fuel consumption for landing operations (HFCLOP, L/m3) | - | - | 0.06 | - | 7 | - |
| Unit fuel consumption for skidding operations (HFCSOP, L/m3) | - | - | 0.46 | - | 56 | - |
| Model | N | R2 | Global Sig. | Predictor | α | p-Value |
|---|---|---|---|---|---|---|
| FCSOP (l) = 0.105 × NL + 0.017 × AWD (m) + 0.003 × AED (m) − 0.478 | 56 | 0.54 | <0.001 | NL | 0.05 | <0.001 |
| AWD | 0.05 | 0.049 | ||||
| AED | 0.05 | <0.001 | ||||
| FCET (l) = 0.003 × ETD (m) − 0.219 | 12 | 0.60 | 0.003 | ETD | 0.05 | 0.003 |
| Category, Performance Metric (Measurement Unit) | Production (m3) | Net Time (h) | Gross Time (h) | Values |
|---|---|---|---|---|
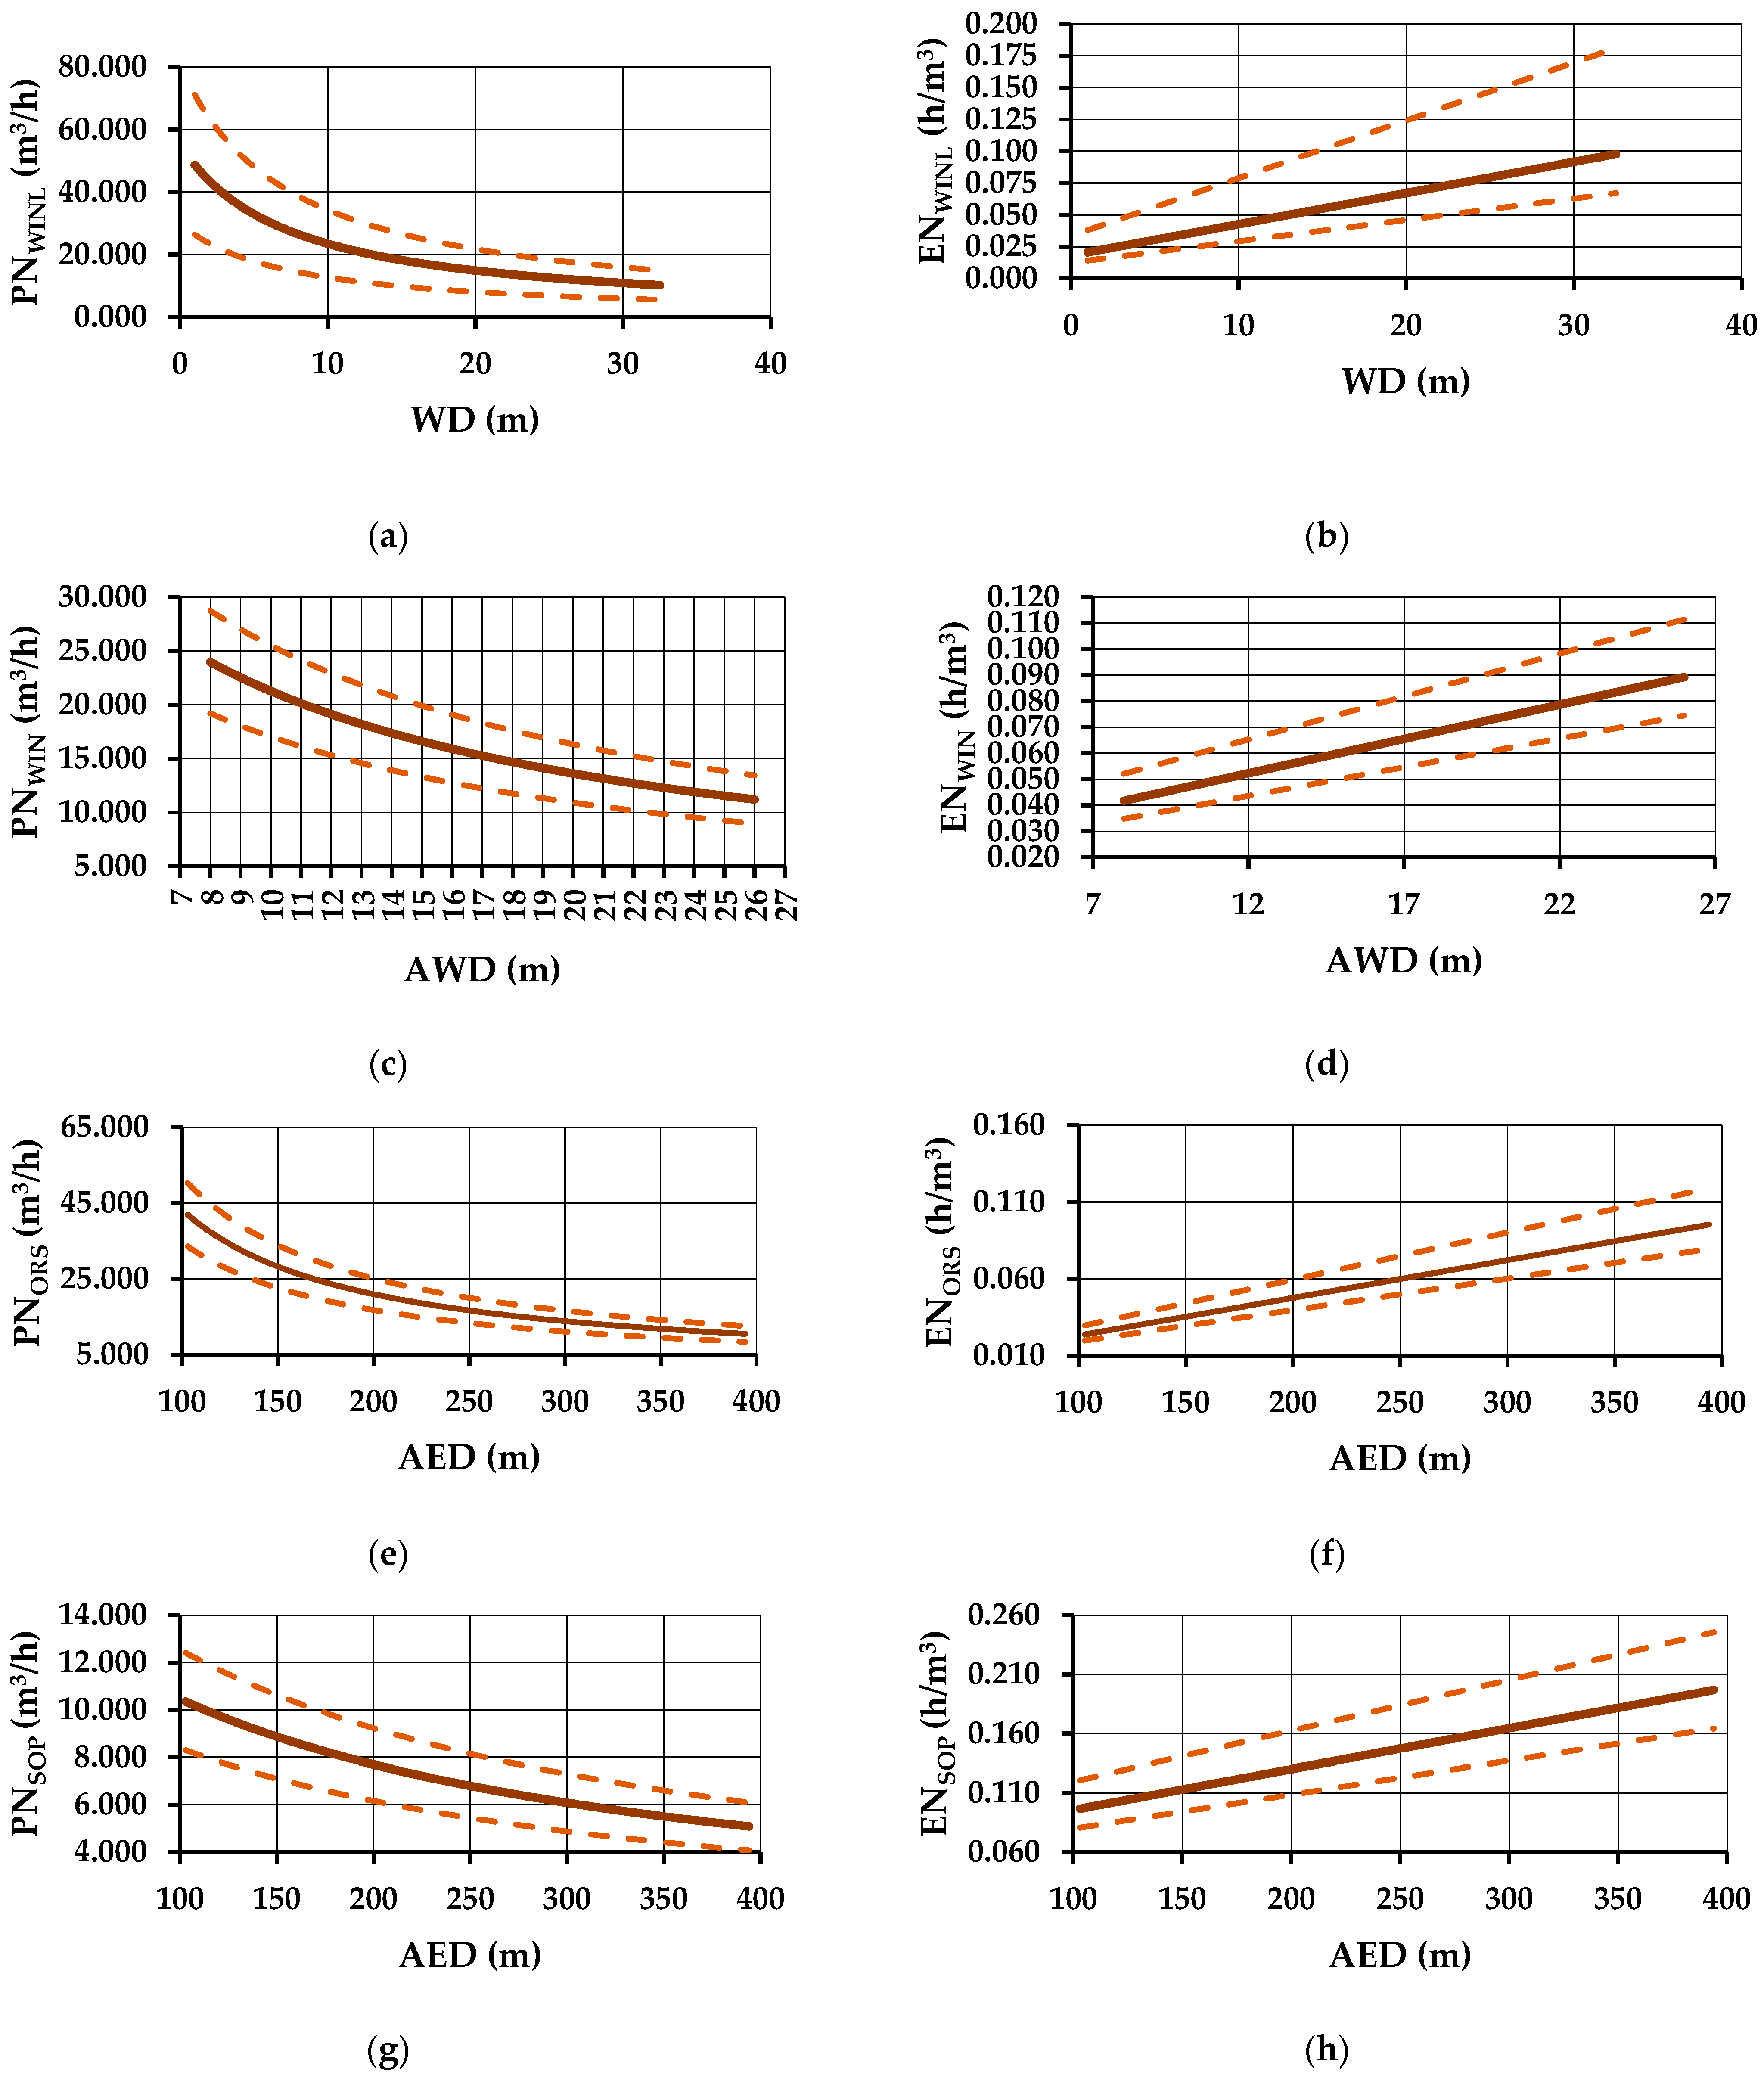
| ENSOP (h/m3) | 101.52 | 12.648 | - | 0.125 |
| ENWIN (h/m3) | 101.52 | 5.920 | - | 0.058 |
| ENORS (h/m3) | 101.52 | 4.261 | - | 0.042 |
| ENPA (h/m3) | 101.52 | 0.913 | - | 0.009 |
| ENLOP (h/m3) | 101.52 | 1.553 | - | 0.015 |
| EGSOP (h/m3) | 101.52 | - | 15.894 | 0.157 |
| PNSOP (m3/h) | 101.52 | 12.648 | - | 8.027 |
| PNWIN (m3/h) | 101.52 | 5.920 | - | 17.149 |
| PNORS (m3/h) | 101.52 | 4.261 | - | 23.825 |
| PNPA (m3/h) | 101.52 | 0.913 | - | 111.194 |
| PNLOP (m3/h) | 101.52 | 1.553 | - | 65.370 |
| PGSOP (m3/h) | 101.52 | - | 15.894 | 6.387 |
Publisher’s Note: MDPI stays neutral with regard to jurisdictional claims in published maps and institutional affiliations. |
© 2022 by the authors. Licensee MDPI, Basel, Switzerland. This article is an open access article distributed under the terms and conditions of the Creative Commons Attribution (CC BY) license (https://creativecommons.org/licenses/by/4.0/).
Share and Cite
Borz, S.A.; Mititelu, V.-B. Productivity and Fuel Consumption in Skidding Roundwood on Flat Terrains by a Zetor Farm Tractor in Group Shelterwood Cutting of Mixed Oak Forests. Forests 2022, 13, 1294. https://doi.org/10.3390/f13081294
Borz SA, Mititelu V-B. Productivity and Fuel Consumption in Skidding Roundwood on Flat Terrains by a Zetor Farm Tractor in Group Shelterwood Cutting of Mixed Oak Forests. Forests. 2022; 13(8):1294. https://doi.org/10.3390/f13081294
Chicago/Turabian StyleBorz, Stelian Alexandru, and Victor-Bogdan Mititelu. 2022. "Productivity and Fuel Consumption in Skidding Roundwood on Flat Terrains by a Zetor Farm Tractor in Group Shelterwood Cutting of Mixed Oak Forests" Forests 13, no. 8: 1294. https://doi.org/10.3390/f13081294
APA StyleBorz, S. A., & Mititelu, V.-B. (2022). Productivity and Fuel Consumption in Skidding Roundwood on Flat Terrains by a Zetor Farm Tractor in Group Shelterwood Cutting of Mixed Oak Forests. Forests, 13(8), 1294. https://doi.org/10.3390/f13081294