
Spatiotemporal Characteristics of Public Recreational Activity in Urban Green Space under Summer Heat

 ,
, 
Abstract
:1. Introduction
2. Materials and Methods
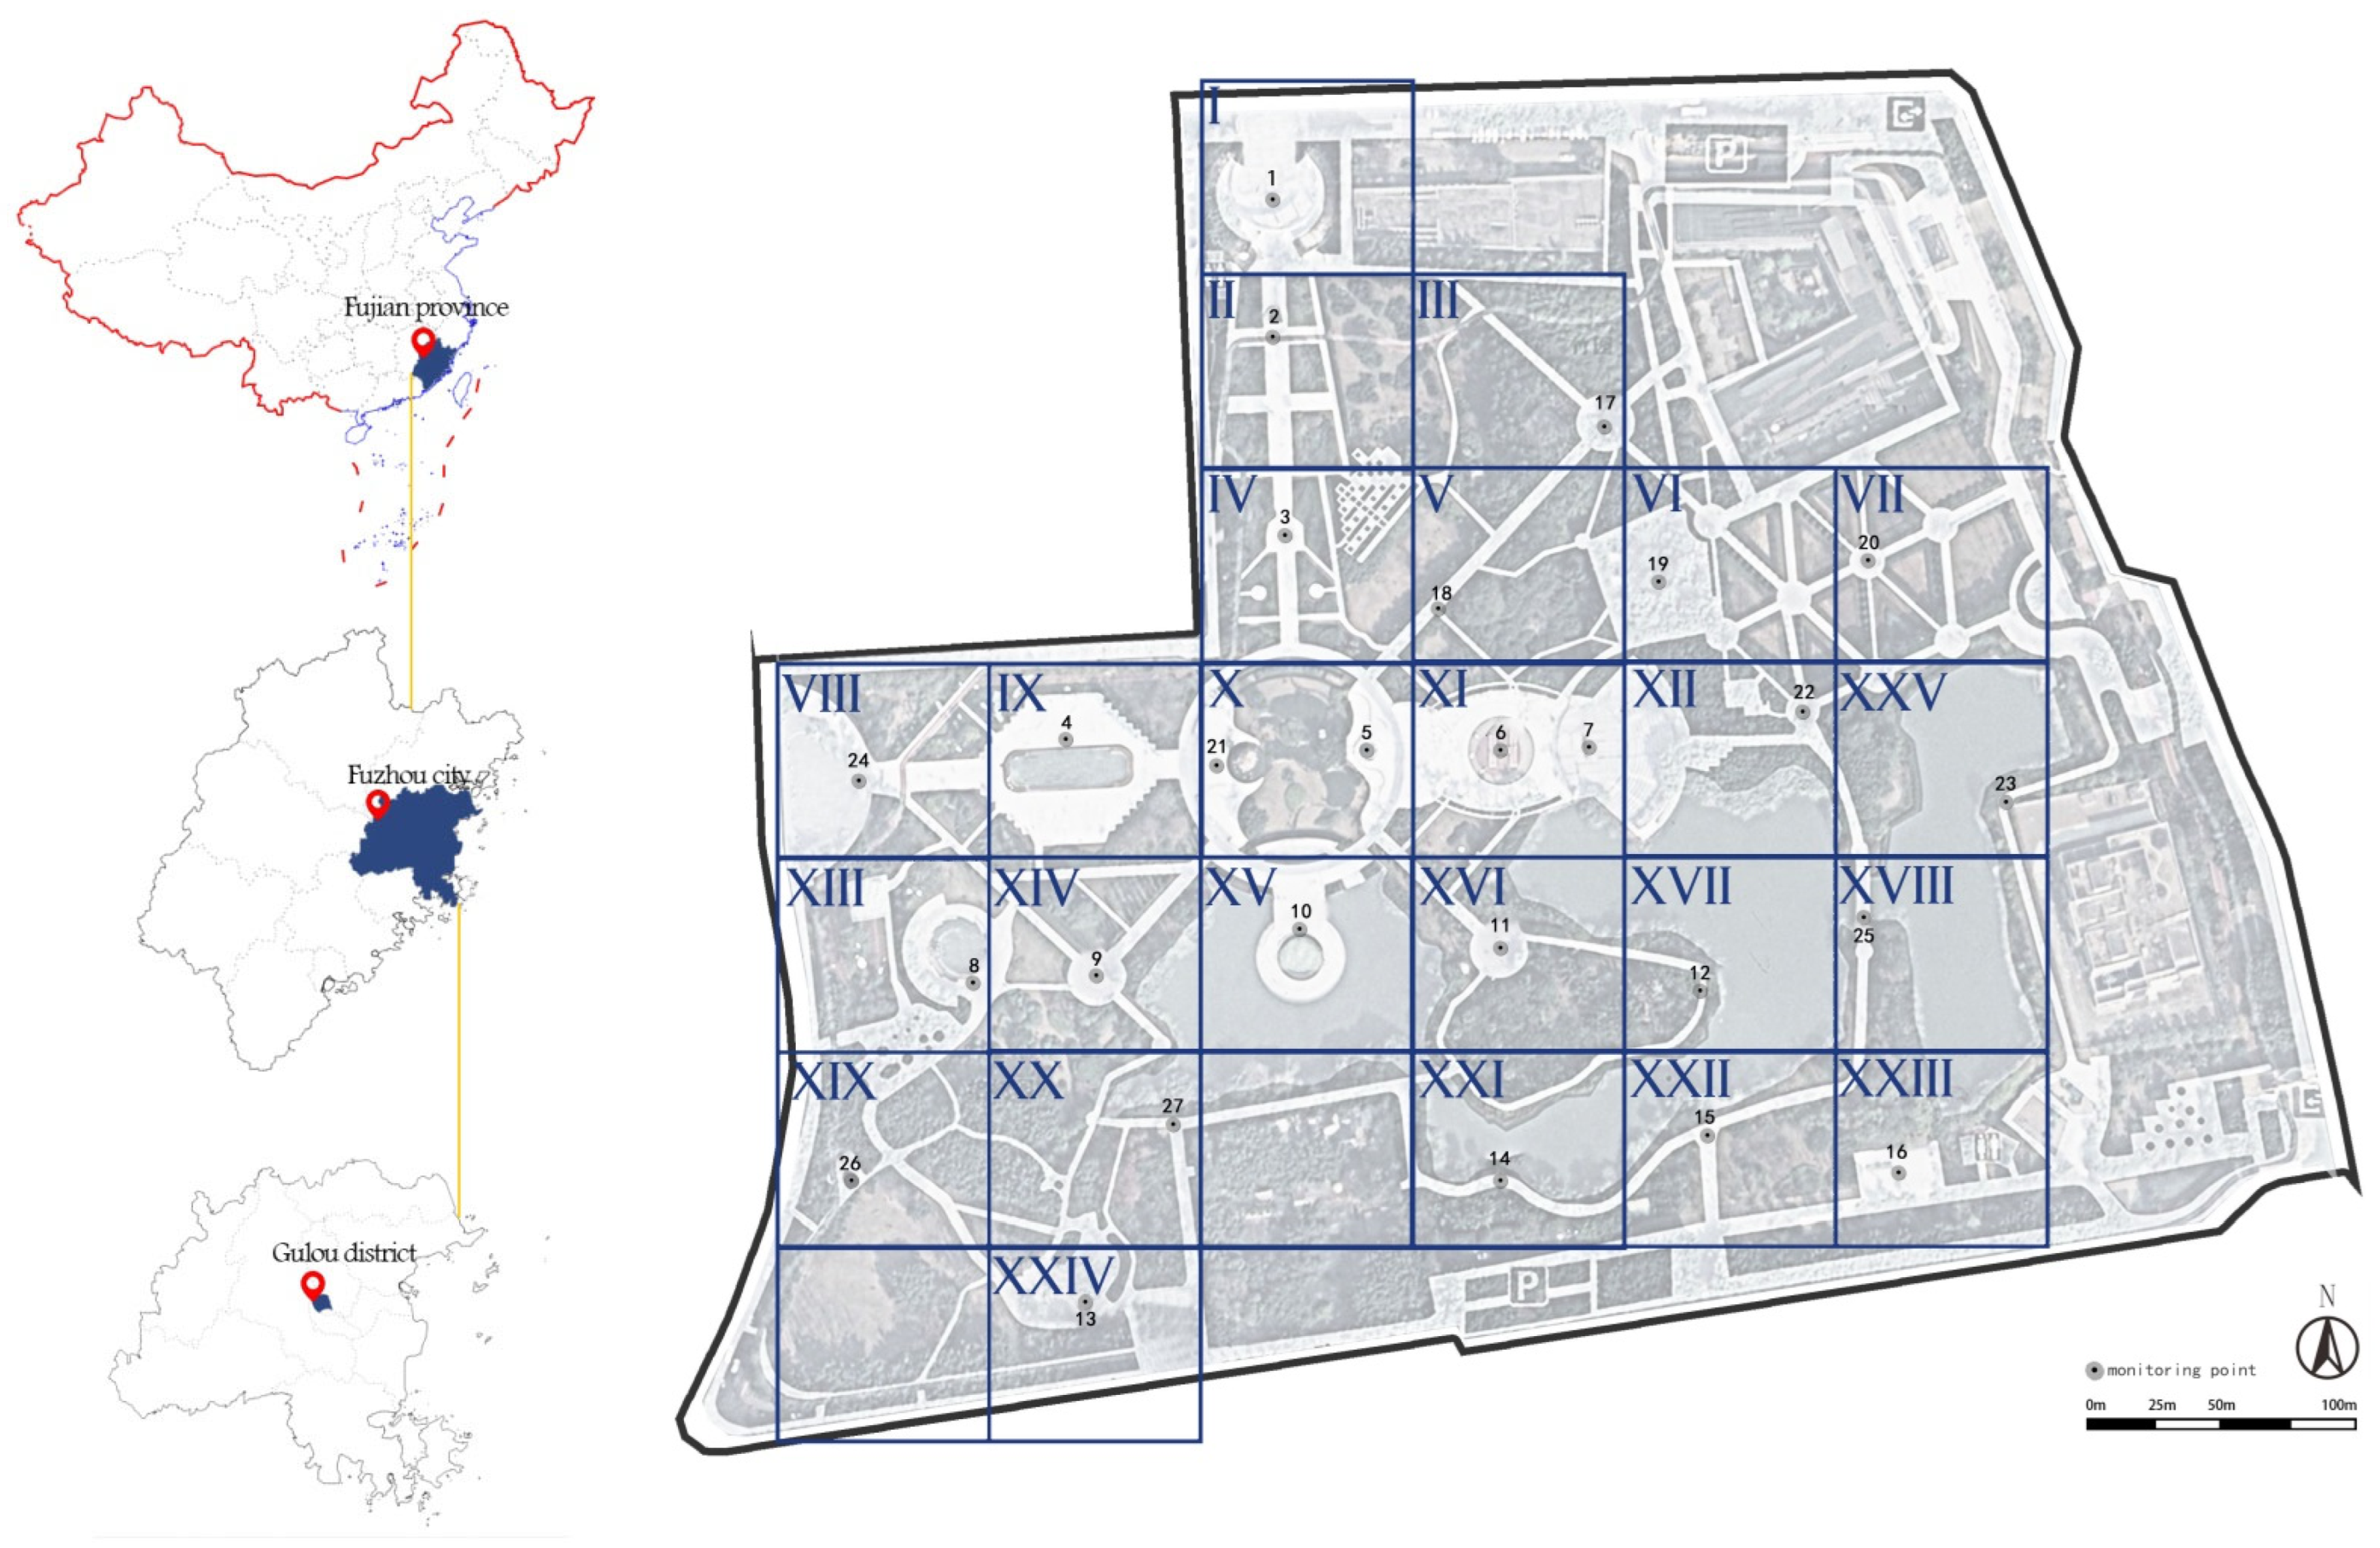
2.1. Study Sites
2.2. Data Collection
2.2.1. Temperature
2.2.2. Public Recreational Behaviors
2.2.3. Landscape Spatial Element Data
2.3. Data Analysis
3. Results
3.1. Temperature Characteristics of Urban Parks in Summer
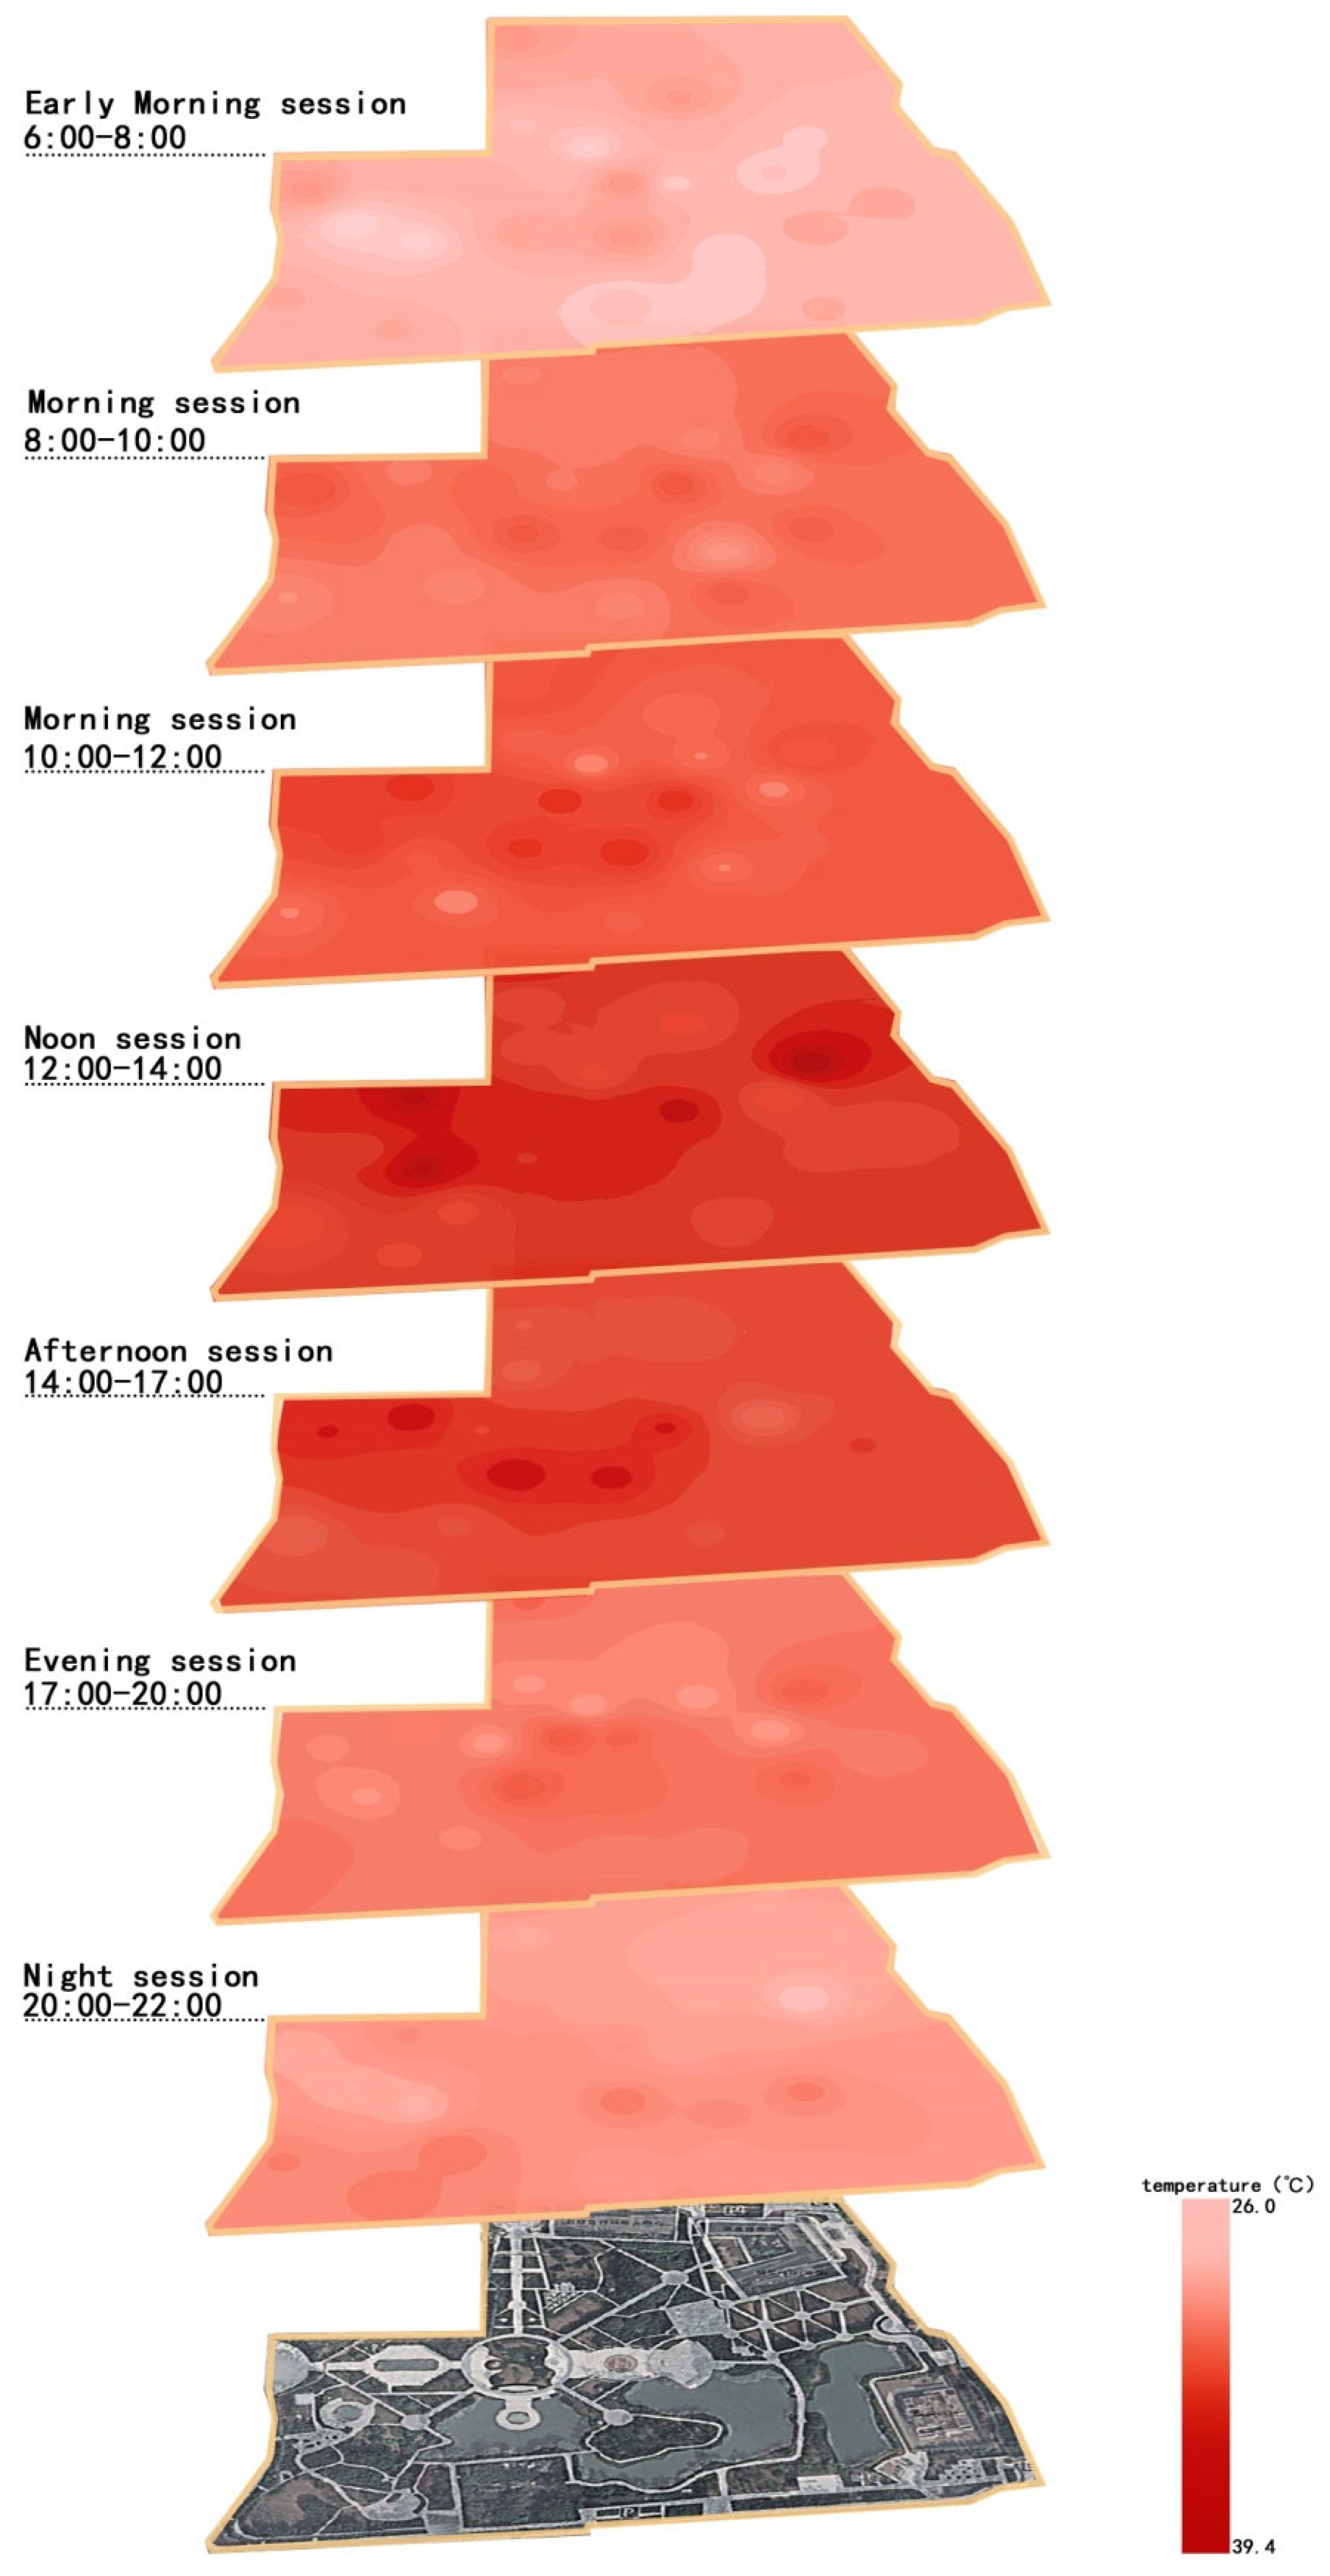
3.1.1. Temperature Temporal and Spatial Variation Characteristics
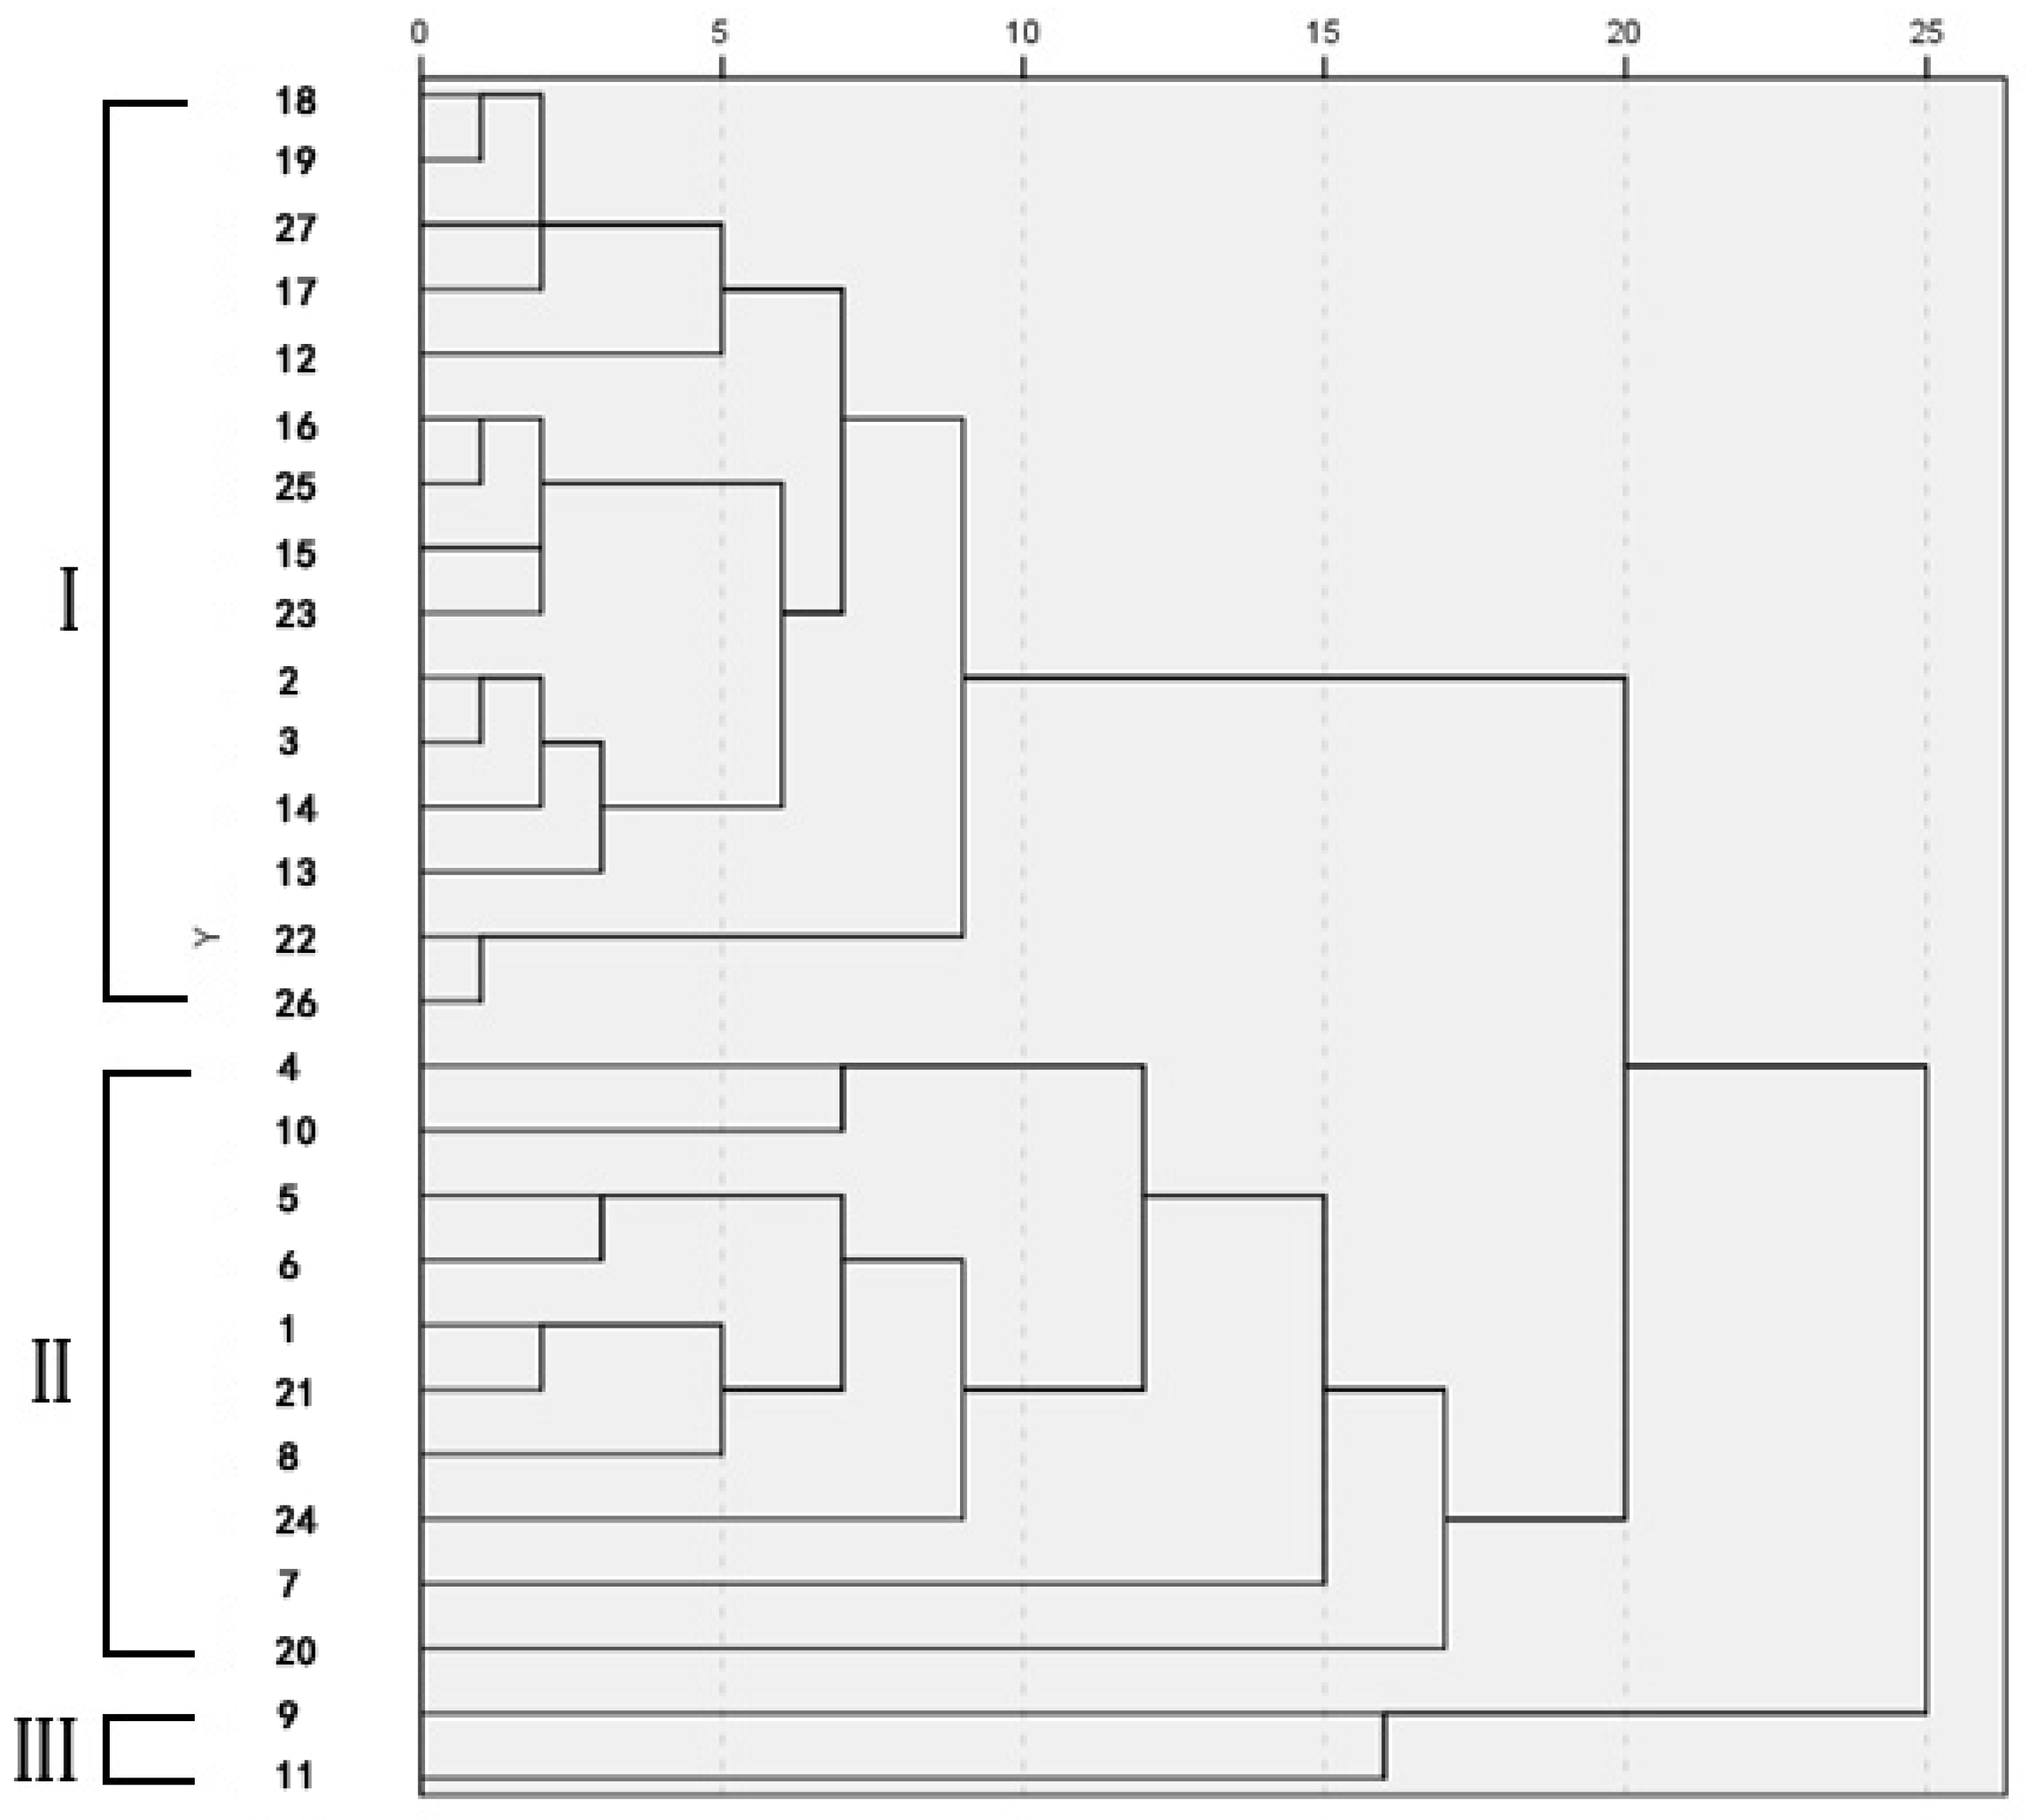
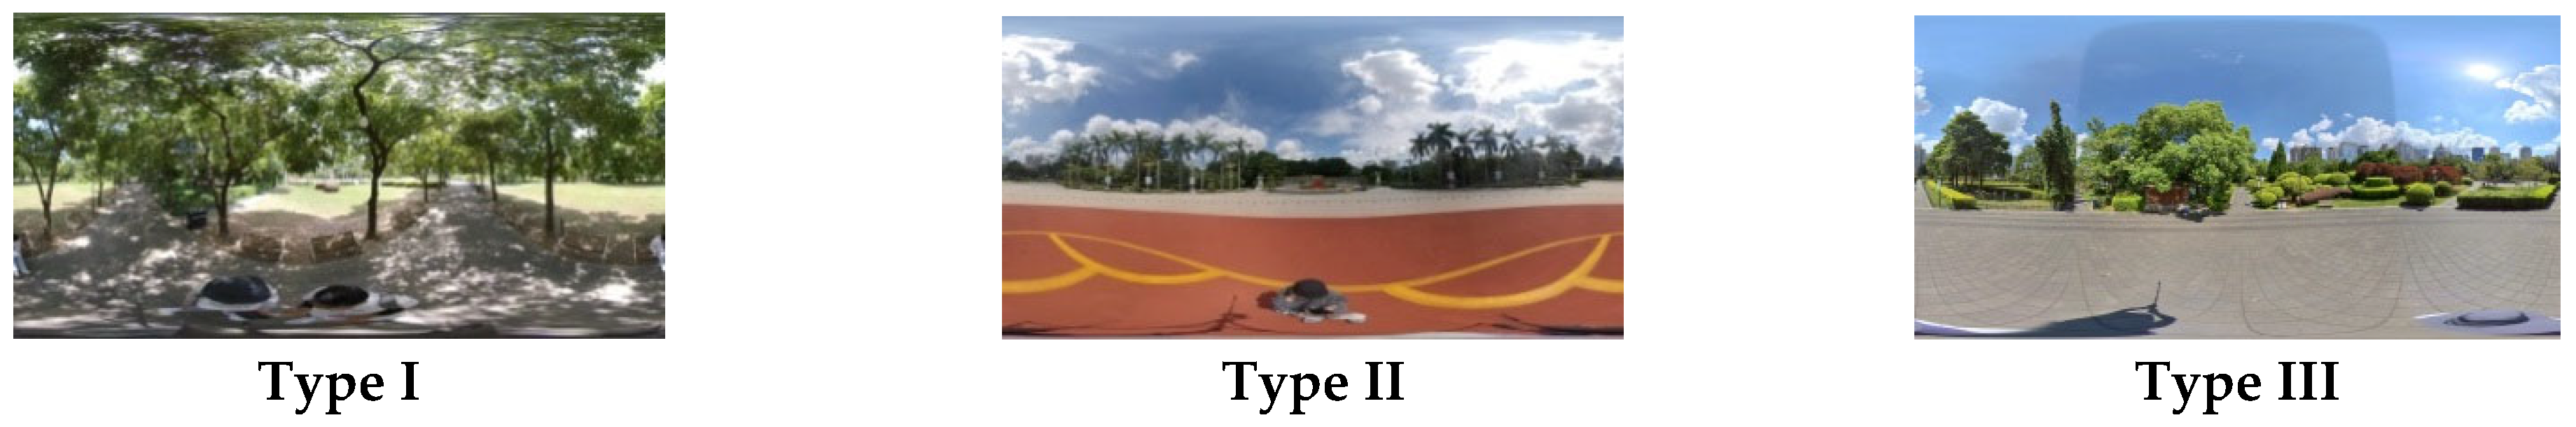
3.1.2. Thermal Environment and Landscape Element Association Characteristics
3.2. Recreational Behaviors of Urban Park Visitors in Summer
3.2.1. Demographic Characteristics of Park Visitors
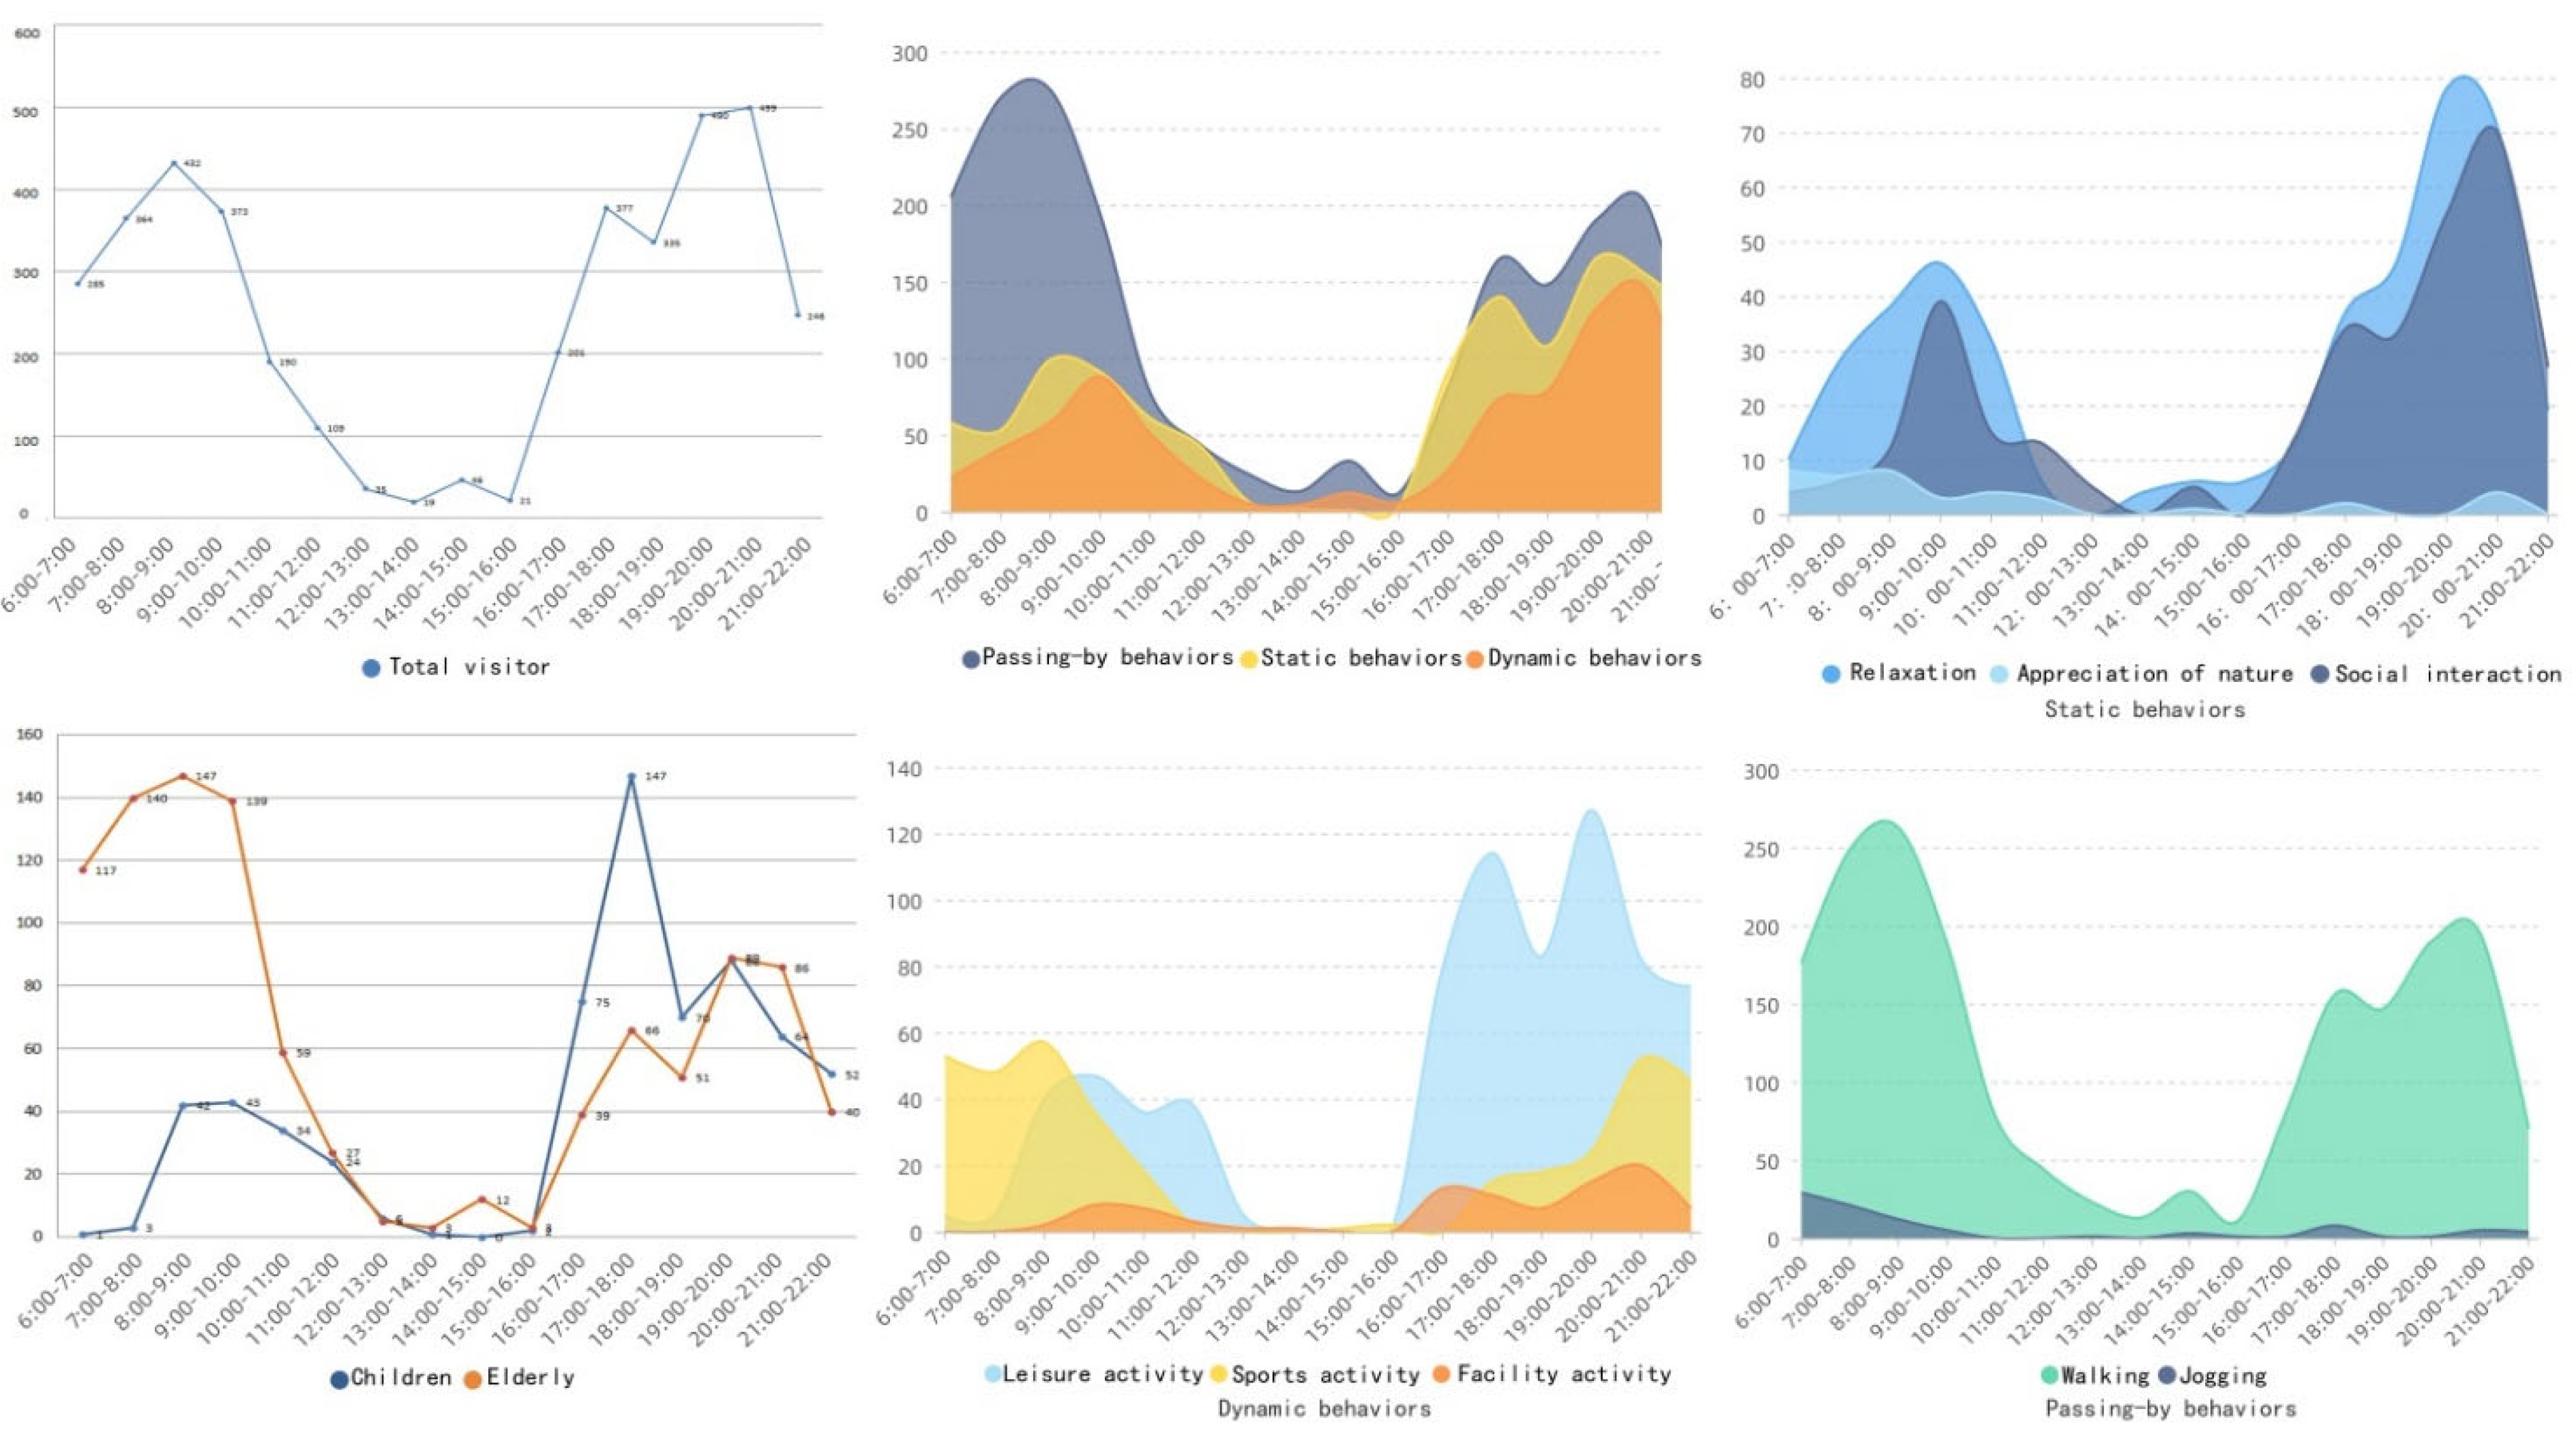
3.2.2. Temporal Characteristics of Park Visitors
3.2.3. Spatial Characteristics of Park Visitors
3.3. Temporal Association between the Recreational Behaviors of Park Visitors and Thermal Environment
4. Discussion
4.1. The Moderating Effect of Park Landscape Elements on Hot Environments
4.2. Recreational Behavior Patterns in Urban Parks
4.3. Effects of Summer Heat on Park Use Patterns
5. Conclusions
- Increasing canopy closure and turf coverage is the first option to alleviate the thermal environment for urban parks, which can be achieved by planting tall trees; this is critical to providing shade so as to prevent activities in direct sunlight.
- Developing and creating playgrounds and intriguing natural areas dedicated to children can attract them. Appropriate seats and benches can be installed at the margins of large point areas or trails to support older people sit, chat, and walk. Design some spaces where the elderly and children can play together and establish extra rest spots next to the children’s play areas.
- As more people prefer non-passing-by activities in the summer nights, it is very important to strengthen the construction of park security facilities at night, such as bright streetlights, waterside warning signs, etc. More shaded space during the day may stimulate healthy dynamic activities.
Author Contributions
Funding
Institutional Review Board Statement
Informed Consent Statement
Data Availability Statement
Conflicts of Interest
References
- Zhang, Y.; Murray, A.T.; Ii, B. Optimizing green space locations to reduce daytime and nighttime urban heat island effects in Phoenix, Arizona. Landsc. Urban Plan. 2017, 165, 162–171. [Google Scholar] [CrossRef]
- Singh, P.; Kikon, N.; Verma, P. Impact of land use change and urbanization on urban heat island in Lucknow city, Central India. A remote sensing based estimate. Sustain. Cities Soc. 2017, 32, 100–114. [Google Scholar] [CrossRef]
- He, B.J. Greening Building: A Comprehensive Solution to Urban Heat. Energy Build. 2022, 271, 112306. [Google Scholar] [CrossRef]
- Sultana, S.; Satyanarayana, A.N.V. Urban heat island intensity during winter over metropolitan cities of India using remote-sensing techniques: Impact of urbanization. Int. J. Remote Sens. 2018, 39, 6692–6730. [Google Scholar] [CrossRef]
- Zhao, M.; Cai, H.; Qiao, Z.; Xu, X. Influence of urban expansion on the urban heat island effect in Shanghai. Int. J. Geogr. Inf. Sci. 2016, 30, 2421–2441. [Google Scholar] [CrossRef]
- Qi, J.; Ding, L.; Lim, S. A Decision-Making Framework to Support Urban Heat Mitigation by Local Governments. Resour. Conserv. Recycl. 2022, 184, 106420. [Google Scholar] [CrossRef]
- Gill, S.E.; Handley, J.F.; Ennos, A.R.; Pauleit, S. Adapting Cities for Climate Change: The Role of the Green Infrastructure. Built Environ. 2007, 33, 115–133. [Google Scholar] [CrossRef] [Green Version]
- He, B.J.; Wang, J.; Zhu, J.; Qi, J. Beating the urban heat: Situation, background, impacts and the way forward in China. Renew. Sustain. Energy Rev. 2022, 161, 112340. [Google Scholar] [CrossRef]
- Wolf, T.; Lyne, K.; Martinez, G.S.; Kendrovski, V. The Health Effects of Climate Change in the WHO European Region. Climate 2015, 3, 901–936. [Google Scholar] [CrossRef]
- Bei, P.L.; Pan, Y.X.; Wang, Y.J.; Zhao, D.M.; Da-Wei, N.I.; Hai, Y.; Zhou, W.X.; Zhu, W.S.; Shang, Q. Survey on Relationship between Air Condition Using and Incidence of People’s Common Diseases in Summer. J. Labour Med. 2005, 2, 133–136. [Google Scholar]
- Sun, S. Research on the Design Strategy of Urban Parks Based on Hot Climatic Adaptability; Beijing Forestry University: Beijing, China, 2018. [Google Scholar]
- Kerse, N.M.; Flicker, L.; Jolley, D.; Arroll, B.; Young, D. Improving the health behaviours of elderly people: Randomised controlled trial of a general practice education programme. BMJ 1999, 319, 683–687. [Google Scholar] [CrossRef] [Green Version]
- Vutcovici, M.; Goldberg, M.S. Effects of diurnal variations in temperature on non-accidental mortality among the elderly population of Montreal, Québec, 1984–2007. Int. J. Biometeorol. 2014, 58, 843–852. [Google Scholar] [CrossRef] [Green Version]
- Leffers, J.M. Climate Change and Health of Children: Our Borrowed Future. J. Pediatr. Health 2022, 36, 12–19. [Google Scholar] [CrossRef]
- Xu, Z.; Etzel, R.A.; Su, H.; Huang, C.; Guo, Y.; Tong, S. Impact of ambient temperature on children’s health: A systematic review. Environ. Res. 2012, 117, 120–131. [Google Scholar] [CrossRef] [Green Version]
- Georgi, J.N.; Dimitriou, D. The contribution of urban green spaces to the improvement of environment in cities: Case study of Chania, Greece. Build. Environ. 2010, 45, 1401–1414. [Google Scholar] [CrossRef] [Green Version]
- Salmond, J. Towards an evaluation of the local scale health and climate related ecosystem services of street trees. In Proceedings of the 13th International Conference on Urban Health, San Francisco, CA, USA, 1–4 April 2016. [Google Scholar]
- Gn, A.; Dep, A.; Erp, B.; Drb, A. Effects of vegetation on the spatial and temporal variation of microclimate in the urbanized Salt Lake Valley. Agric. For. Meteorol. 2021, 296, 108211. [Google Scholar]
- Bowler, D.E.; Buyung-Ali, L.; Knight, T.M.; Pullin, A.S. Urban greening to cool towns and cities: A systematic review of the empirical evidence. Landsc. Urban Plan. 2010, 97, 147–155. [Google Scholar] [CrossRef]
- Hinkley, T.; Crawford, D.; Salmon, J.; Okely, A.D.; Hesketh, K. Preschool children and physical activity: A review of correlates. Am. J. Prev. Med. 2008, 34, 435–441. [Google Scholar] [CrossRef]
- Zheng, C.; Yu, M. Pro-health Landscape Experience and Recreational Activities in Urban Parks. Landsc. Archit. 2020, 27, 7. [Google Scholar]
- Kabisch, N.; Bosch, M.V.D.; Lafortezza, R. The health benefits of nature-based solutions to urbanization challenges for children and the elderly—A systematic review. Environ. Res. 2017, 159, 362–373. [Google Scholar] [CrossRef]
- Odgaard, A.J. Impacts of the Microclimate of a Large Urban Park on Its Surrounding Built Environment in the Summertime. Remote Sens. 2021, 13, 4703. [Google Scholar]
- Kong, H.; Choi, N.; Park, S. Thermal Environment Analysis of Landscape Parameters of an Urban Park in Summer—A Case Study in Suwon, Republic of Korea. Urban For. Urban Green. 2021, 65, 127377. [Google Scholar] [CrossRef]
- Wardoyo, J.; Suprapti, A.; Wediningsih, H. Vegetation configuration as microclimate control strategy in hot humid tropic urban park. J. Appl. Res. 2012, 8, 5306–5310. [Google Scholar]
- Feng, Y.; Hu, T.; Zhang, L. Impacts of structure characteristics on the thermal environment effect of city parks. Acta Ecol. Sin. 2014, 34, 9. [Google Scholar]
- Chibuike, E.M.; Ibukun, A.O.; Kunda, J.J.; Abbas, A. Assessment of green parks cooling effect on Abuja urban microclimate using geospatial techniques. Remote Sens. Appl. Soc. Environ. 2018, 11, 11–21. [Google Scholar] [CrossRef]
- Mike, R.; Valerie, G.; Daniel, G.; Jo, B. Influences of Green Outdoors versus Indoors Environmental Settings on Psychological and Social Outcomes of Controlled Exercise. Int. J. Environ. Res. Public Health 2016, 13, 363. [Google Scholar]
- Sarah, C.; Jenny, V.; David, C.; Alison, C.; Anna, T. A Cross-Sectional Investigation of the Importance of Park Features for Promoting Regular Physical Activity in Parks. Int. J. Environ. Res. Public Health 2017, 14, 1335. [Google Scholar]
- Zhongping, Z.; Yali, W.; Haoxuan, P. Research on Tourist Recreation Behavior Based on SOPARC and KDE activity in an urban environment in an Example. Chin. Landsc. Archit. 2019, 35, 5. [Google Scholar]
- Park, K. Park and Neighborhood Attributes Associated With Park Use: An Observational Study Using Unmanned Aerial Vehicles. Environ. Behav. 2019, 52, 82477237. [Google Scholar] [CrossRef]
- Wang, X.; Wu, C. An Observational Study of Park Attributes and Physical Activity in Neighborhood Parks of Shanghai, China. Int. J. Environ. Res. Public Health 2020, 17, 2080. [Google Scholar] [CrossRef] [Green Version]
- Arifwidodo, S.D.; Chandrasiri, O. Association between Park Characteristics and Park-Based Physical Activity Using Systematic Observation: Insights from Bangkok, Thailand. Sustainability 2020, 12, 2559. [Google Scholar] [CrossRef] [Green Version]
- Liu, R.; Xu, X.; Chen, L. Investigation of Plant Landscape Space in Urban Park Based on Users’ Behaviorant Landscape Space in Urban Park Ba. Chin. Landsc. Archit. 2019, 35, 6. [Google Scholar]
- Kaczynski, A.T.; Potwarka, L.R.; Saelens, B.E. Association of park size, distance, and features with physical activity in neighborhood parks. Am. J. Public Health 2008, 98, 1451–1456. [Google Scholar] [CrossRef] [PubMed]
- Chen, F. On How Fuzhou Became the “Hotest Place”—Xiamen as the Comparison Reference on Climatic Differences. Sci-Tech. Innov. Product. 2013, 8, 61–62. [Google Scholar]
- Ye, S.; Qi, X.; Chen, Y.; Lin, R. A study on the perception of heat waves among urban residents: Based on a survey in Fuzhou. Acta Ecol. Sin. 2015, 35, 6814–6820. [Google Scholar]
- Tan, H.; Cai, R. New Characteristics of Heat Extremes in Fuzhou Since 2000 and the Possible Causes. Chin. J. Atmos. Sci. 2015, 39, 12. [Google Scholar]
- Available online: http://ylj.fuzhou.gov.cn/zz/gyjq/201609/t20160912_353460.htm (accessed on 1 August 2022).
- Liu, Q.; You, D.; Pan, M.; Chi, M.; Huang, Q.; Lan, S. Tourist Place Perception and Restorative Perception: A Case Study of Fuzhou Hot Spring Park. Tour. Trib. 2017, 32, 12. [Google Scholar]
- Mckenzie, T.L.; Cohen, D.; Sehgal, A.; Williamson, S.; Golinelli, D. System for Observing Play and Recreation in Communities (SOPARC): Reliability and Feasibility Measures. J. Phys. Act. Health 2006, 3 (Suppl. 1), S208–S222. [Google Scholar] [CrossRef]
- Evenson, K.R.; Jones, S.A.; Holliday, K.M.; Cohen, D.A.; Mckenzie, T.L. Park characteristics, use, and physical activity: A review of studies using SOPARC (System for Observing Play and Recreation in Communities). Prev. Med. 2016, 86, 153–166. [Google Scholar] [CrossRef] [Green Version]
- Whiting, J.W.; Larson, L.R.; Green, G.T. Monitoring Visitation in Georgia State Parks Using the System for Observing Play and Recreation in Communities (SOPARC). J. Park Recreat. Adm. 2012, 30, 21–37. [Google Scholar]
- Ostermann, F.O. Digital representation of park use and visual analysis of visitor activities. Comput. Environ. Urban Syst. 2010, 34, 452–464. [Google Scholar] [CrossRef] [Green Version]
- Krishna, A. A Distributed Scheme for Accelerating and Scaling PSPNet. In Proceedings of the 23rd International Conference on Artificial Intelligence, Durham, UK, 27–31 July 2022. [Google Scholar]
- Zhao, H.; Shi, J.; Qi, X.; Wang, X.; Jia, J. Pyramid Scene Parsing Network. In Proceedings of the 2017 IEEE Conference on Computer Vision and Pattern Recognition, Honolulu, Hl, USA, 21–26 July 2017. [Google Scholar]
- Zhao, X.; Bian, Q.; Hou, Y.; Zhang, B. A Research on the Correlation between Physical Activity Performance and Thermal Comfortable of Urban Park in Cold Region. Chin. Landsc. Archit. 2019, 35, 80–85. [Google Scholar]
- Chen, J.; Run, L.; Gao, Y.; Qian, D.; Ma, A.; Huang, Z.; Wu, B. Temperature and Humidity Effects of Different Shading Environments and Their Effects on Human Comfort. J. Northw. For. Univ. 2022, 37, 8. [Google Scholar]
- Dong, Y. Evaluation and Predictiong of Microclimate and Thermal Comfort in Jinshan Lake Park in Huizhou City; Shenyang Agricultural University: Shenyang, China, 2020. [Google Scholar]
- Rupasinghe, H.T.; Galagoda, R.U.; Halwatura, R.U.; Perera, N. Implementation of Vertical Greening as a Double Skin Envelop: A Sustainable Approach in Tropical Climates. In Proceedings of the iiSBE Forum of Young Researchers in Sustainable Building, Prague, Czech Republic, 1 July 2019. [Google Scholar]
- Adams, J.; Veitch, J.; Barnett, L. Physical Activity and Fundamental Motor Skill Performance of 5–10 Year Old Children in Three Different Playgrounds. Int. J. Environ. Res. Public Health 2018, 15, 1896. [Google Scholar] [CrossRef] [Green Version]
- Cengiz, C.; Boz, A.Z. Biophilic Playgrounds as Playscapes in Child-Nature Interaction. Int. J. Sci. Technol. Res. 2019, 5, 216–226. [Google Scholar]
- Nka, B.; Rka, C. Physical activity patterns in two differently characterised urban parks under conditions of summer heat. Environ. Sci. Policy 2020, 107, 56–65. [Google Scholar]
- Cao, A.; Sga, C.; Mwa, B.; Mh, A.; Mka, C. “Benches become like porches”: Built and social environment influences on older adults’ experiences of mobility and well-being. Soc. Sci. Med. 2016, 169, 33–41. [Google Scholar]
- Veitch, J.; Flowers, E.; Ball, K.; Deforche, B.; Timperio, A. Designing parks for older adults: A qualitative study using walk-along interviews. Urban For. Urban Green. 2020, 54, 126768. [Google Scholar] [CrossRef]
- Zheng, Y.; Fang, K.; He, H.; Yuan, Y. Research on the Strategy of Healthy Community Micro-regeneration from the Perspectiveof Age-friendly and Child-friendly Community: A case Study of Sanyanjing Community in Guangzhou. Shanghai Urban Plan. Rev. 2021, 1, 31–37. [Google Scholar]
- Thorsson, S.; Lindqvist, M.; Lindqvist, S. Thermal bioclimatic conditions and patterns of behaviour in an urban park in Göteborg, Sweden. Int. J. Biometeorol. 2004, 48, 149–156. [Google Scholar] [CrossRef]
- Xu, L.; Yuan, W. A study on thermal environment effect of urban park landscape. Acta Ecol. Sin. 2008, 28, 1702–1710. [Google Scholar]
- Sharifi, E.; Boland, J. Heat Resilience in Public Space and Its Applications in Healthy and Low Carbon Cities. Procedia Eng. 2017, 180, 944–954. [Google Scholar] [CrossRef]
- Bian, Q. A Research on the Adaptability of Firness Activities and Microclimate of Urban Park in Cold Region-Taking Zhaolin Park in Harbin as an Example; Harbin Institute of Technology: Harbin, China, 2017. [Google Scholar]


| Record Content | ||||
|---|---|---|---|---|
| Gender |  Female | 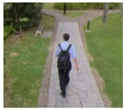 Male | ||
| Age | 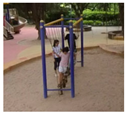 Children (0–17) | 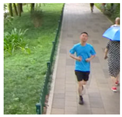 Young adult (18–44) |  Middle-aged adult (45–59) |  Elderly (up to 60) |
| Type of activity | Static behaviors |  Relaxation (sitting, reading, closing eyes during meditation, etc.) |  Contact with nature (enjoying the nature, listening to sounds such as birdsong and running water, etc.) |  Social interaction (drinking tea, chatting, partying, playing chess, etc.) |
| Dynamic behaviors |  Facility activities (activities dependent on various park facilities) |  Sports activities (sports-related activities such as ball games, dance, etc.) |  Leisure activities (chasing games, taking care of children, picnicking, etc.) | |
| Passing-by behaviors |  Walking |  Jogging |
| Landscape Spatial Characteristics | Type I | Type II | Type III | F | Sig. (p-Value) |
|---|---|---|---|---|---|
| rigid pavement area percentage X1 | 64.11 ± 20.64 | 89.61 ± 8.79 | 89.23 ± 0.53 | 3.670 | 0.087 |
| water surface area percentage X2 | 5.09 ± 10.39 | 3.54 ± 7.70 | 0.00 ± 0.00 | 0.233 | 0.634 |
| turf coverage X3 * | 30.81 ± 18.32 | 6.85 ± 7.54 | 10.75 ± 0.78 | 4.572 | 0.016 |
| canopy density X4 ** | 58.96 ± 29.25 | 15.64 ± 7.33 | 15.70 ± 3.54 | 11.042 | 0.003 |
| building vertical area X5 | 0.48 ± 1.16 | 2.11 ± 3.63 | 0.19 ± 0.28 | 1.517 | 0.634 |
| vegetation vertical area X6 *** | 32.45 ± 15.69 | 9.66 ± 2.58 | 11.45 ± 1.32 | 11.560 | 0.000 |
| Model | Unstandardized Coefficients | Standardized Coefficients | T | Sig. | |
|---|---|---|---|---|---|
| Coefficient B | Standard Error | Beta | |||
| (constant) | 31.456 | 0.048 | 652.188 | 0.000 | |
| X3 | −0.203 | 0.078 | −0.395 | −2.595 | 0.016 |
| X4 | −0.271 | 0.077 | −0.534 | −3.510 | 0.002 |
| Observed Place of Activity and Sun Exposure | Percentage of People (%) | Observed Place of Activity and Sun Exposure | Percentage of People (%) | ||||
|---|---|---|---|---|---|---|---|
| Static behaviors | Dynamic behaviors | Total | Static Behaviors | Dynamic Behaviors | Total | ||
| All | n = 861 | Children | n = 142 | ||||
| Activity in shade | 34.3 | 19.7 | 54 | 6.3 | 42.9 | 49.2 | |
| Activity in full sun | 0.2 | 18.6 | 18.8 | 0 | 23.2 | 23.2 | |
| Activity partly in sun and partly in shade | 8.2 | 18.8 | 27 | 0.7 | 26.8 | 27.5 | |
| Elderly | n = 232 | Adult | n = 487 | ||||
| Activity in shade | 44.4 | 12.9 | 57.3 | 24.6 | 31.8 | 56.4 | |
| Activity in full sun | 0.4 | 23.7 | 24.1 | 10.9 | 11.2 | 22.1 | |
| Activity partly in sun and partly in shade | 11.6 | 6.9 | 18.5 | 2.1 | 19.3 | 21.4 | |
| Early Morning | Morning | Noon | Afternoon | Evening | Night | |
|---|---|---|---|---|---|---|
| All | 0.091 | −0.482 * | −0.368 * | −0.528 * | −0.148 | 0.180 |
| Elderly | 0.207 | −0.489 * | −0.440 * | −0.501 * | 0.158 | 0.195 |
| Middle-aged adult | 0.017 | −0.391 * | −0.453 * | −0.316 * | −0.326 * | 0.081 |
| Young adult | 0.222 | −0.121 | −0.360 * | −0.187 * | −0.165 | 0.262 |
| Children | 0.084 | −0.007 | −0.577 * | −0.427 * | 0.222 | 0.205 |
| Static behaviors | 0.177 | −0.457 * | −0.387 * | −0.413 * | −0.092 | 0.160 |
| Dynamic behaviors | 0.000 | −0.292 * | −0.413 * | −0.426 * | 0.054 | 0.013 |
| Passing-by behaviors | 0.092 | −0.366 * | −0.099 | −0.193 | −0.182 | 0.142 |
| Morning | Noon | Afternoon | ||
|---|---|---|---|---|
| Mean Difference | ||||
| Elderly | Adult | −0.072 | −1.192 * | −0.285 |
| Children | −0.603 * | −0.022 | 0.346 | |
| Adult | Children | −0.531 * | 1.214 * | 0.631 * |
| Elderly | 0.072 | 1.192 * | 0.285 | |
| Children | Adult | 0.531 * | −1.214 * | −0.631 * |
| Elderly | 0.603 * | −0.022 | −0.346 | |
| Static behaviors | Dynamic behaviors | 0.163 | −0.208 | 0.421 * |
| Passing-by behaviors | −0.486 * | −1.852 * | −0.584 * | |
| Dynamic behaviors | Static behaviors | −0.163 | 0.208 | −0.421 * |
| Passing-by behaviors | −0.649 * | −1.644 * | −1.006 * | |
| Passing-by behaviors | Static behaviors | 0.486 * | 1.852 * | 0.584 * |
| Dynamic behaviors | 0.649 * | 1.644 * | 1.006 * | |
Publisher’s Note: MDPI stays neutral with regard to jurisdictional claims in published maps and institutional affiliations. |
© 2022 by the authors. Licensee MDPI, Basel, Switzerland. This article is an open access article distributed under the terms and conditions of the Creative Commons Attribution (CC BY) license (https://creativecommons.org/licenses/by/4.0/).
Share and Cite
Huang, Z.; Dong, J.; Chen, Z.; Zhao, Y.; Huang, S.; Xu, W.; Zheng, D.; Huang, P.; Fu, W. Spatiotemporal Characteristics of Public Recreational Activity in Urban Green Space under Summer Heat. Forests 2022, 13, 1268. https://doi.org/10.3390/f13081268
Huang Z, Dong J, Chen Z, Zhao Y, Huang S, Xu W, Zheng D, Huang P, Fu W. Spatiotemporal Characteristics of Public Recreational Activity in Urban Green Space under Summer Heat. Forests. 2022; 13(8):1268. https://doi.org/10.3390/f13081268
Chicago/Turabian StyleHuang, Ziluo, Jiaying Dong, Ziru Chen, Yujie Zhao, Shanjun Huang, Weizhen Xu, Dulai Zheng, Peilin Huang, and Weicong Fu. 2022. "Spatiotemporal Characteristics of Public Recreational Activity in Urban Green Space under Summer Heat" Forests 13, no. 8: 1268. https://doi.org/10.3390/f13081268
APA StyleHuang, Z., Dong, J., Chen, Z., Zhao, Y., Huang, S., Xu, W., Zheng, D., Huang, P., & Fu, W. (2022). Spatiotemporal Characteristics of Public Recreational Activity in Urban Green Space under Summer Heat. Forests, 13(8), 1268. https://doi.org/10.3390/f13081268