Article

Improving a Process-Based Model to Simulate Forest Carbon Allocation under Varied Stand Density

1
Co-Innovation Center for Sustainable Forestry in Southern China, College of Biology and the Environment, Nanjing Forestry University, Nanjing 210037, China
2
Department of Biology Sciences, Institute of Environment Sciences, University of Quebec at Montreal, Montreal, QC H3C 3P8, Canada
3
College of Geographic Science, Hunan Normal University, Changsha 410081, China
4
Institute of Forest Resource Information Techniques, Chinese Academy of Forestry, Beijing 100091, China
5
Institute of Physicochemical and Biological Problems in Soil Science, Pushchino Scientific Center for Biological Research of the Russian Academy of Sciences, 142290 Pushchino, Russia
*
Author to whom correspondence should be addressed.
Forests 2022, 13(8), 1212; https://doi.org/10.3390/f13081212
Submission received: 22 May 2022 / Revised: 15 July 2022 / Accepted: 22 July 2022 / Published: 1 August 2022
(This article belongs to the Section Forest Inventory, Modeling and Remote Sensing)

Abstract

:
Carbon allocation is an important mechanism through which plants respond to environmental changes. To enhance our understanding of maximizing carbon uptake by controlling planting densities, the carbon allocation module of a process-based model, TRIPLEX-Management, was modified and improved by introducing light, soil water, and soil nitrogen availability factors to quantify the allocation coefficients for different plant organs. The modified TRIPLEX-Management model simulation results were verified against observations from northern Jiangsu Province, China, and then the model was used to simulate dynamic changes in forest carbon under six density scenarios (200, 400, 600, 800, 1000, and 1200 stems ha−1). The mean absolute errors between the predicted and observed variables of the mean diameter at breast height, mean height, and estimated aboveground biomass ranged from 15.0% to 26.6%, and were lower compared with the original model simulated results, which ranged from 24.4% to 60.5%. The normalized root mean square errors ranged from 0.2 to 0.3, and were lower compared with the original model simulated results, which ranged from 0.3 to 0.6. The Willmott index between the predicted and observed variables also varied from 0.5 to 0.8, indicating that the modified TRIPLEX-Management model could accurately simulate the dynamic changes in poplar (Populus spp.) plantations with different densities in northern Jiangsu Province. The density scenario results showed that the leaf and fine root allocation coefficients decreased with the increase in stand density, while the stem allocation increased. Overall, our study showed that the optimum stand density (approximately 400 stems ha−1) could reach the highest aboveground biomass for poplar stands and soil organic carbon storage, leading to higher ecological functions related to carbon sequestration without sacrificing wood production in an economical way in northern Jiangsu Province. Therefore, reasonable density control with different soil and climate conditions should be recommended to maximize carbon sequestration.

1. Introduction

Forests are important carbon sinks that contribute to slowing global climate change. Stand density regulation is a key forest management measure that affects the carbon cycle [1]. Stand density regulation is widely used to improve the growth environment of planted trees [2]. Changes in competition conditions affect the carbon and nitrogen allocation modes of stands [3]. It is necessary to conduct a modeling study to explore the impact of stand density on carbon allocation and stand growth, so as to develop planted forest managing techniques to improve ecological function and wood production.
Functional balance is commonly used to explain carbon allocation [4]. If growth is limited by underground resources, such as water and nutrients, plants allocate more carbon to their root systems to absorb more resources [5]. In contrast, if growth is limited by aboveground resources (such as light and spots), plants allocate more carbon to aboveground parts [5], especially the foliage [3]. A meta-analysis on the responses of even-aged mono-specific stands to population density revealed that with an increase in stand density, the mean size of the individuals decreased, but the tree height remained similar [6]. Through studying five sets of premature and mature pine stands, Wertz et al. [3] found that stand density only affected branch allocation and had no effect on the stems and foliage. In current studies, the experimental design, choice of research object, and calculation method of the selected variables led to different results [3,5]. Few studies could explain the influence of stand density on carbon allocation, as carbon allocation is a dynamic process, and biomass partitioning could not fully explain the flux allocation at planting density trails. In addition, the research duration in previous studies was generally short [4], and there are a lack of studies on long-term carbon allocation dynamics. Modelling studies can be conducted to study carbon allocation at different climate and soil conditions.
In general, because of a lack mechanistic understanding regarding carbon allocation at an individual or stand level, models use either a static or a dynamic allocation scheme [7,8]. Static allocation models such as CABLE [9] and CLM4 [10] are practically unable to capture the changes in allocation with changing water and nutrient availability at seasonal to interannual timescales. Some models such as ED [11], LPJ-GUESS [12], and ISAM [13] use a dynamic allocation scheme to regulate carbon allocation, owing to functional relationships and resource limitations, which can change allocation coefficients based on individual development, the environment, and resource availability [4]. Trugman et al. [14] developed an optimization-based model to explore a leaf allocation strategy and to explain the patterns in leaf allocation across CO2 fertilization. Merganicova et al. [8] analyzed 31 contrasting models to identify the major forest carbon allocation modeling approaches and provided examples regarding how to improve C allocation modelling in the context of climate change. Using the 3-PG model with GIS, Prilepova et al. [15] predicted the biomass of poplars under different management and climate conditions in the Pacific Northwest of the United States. To evaluate the importance of the modulations of tree carbon allocation by water and low-temperature stress for the prediction of forest growth, a new carbon allocation scheme was implemented in the CASTANEA model, which accounted for lagged and directed environmental controls of carbon allocation [16]. The coupled eco-hydrological model based on the process model was applied to study the change in forest carbon under different allocation methods, which indicated that the influence of uncertainty regarding the allocation strategy or parameters on carbon estimation varies depending on location [17]. However, few studies have used a process-based model with a dynamic carbon allocation scheme to test the growth response of forest management practices such as density regulation.
The objective of this study was to adjust the carbon allocation module of an existing model, TRIPLEX-Management [18], in a different way that depends on light, water availability, and nitrogen to make it more flexible for simulating stand growth and the dynamics of planted forests with different planting densities. The performance of the modified model was tested using the stand characteristics of poplar (Populus spp.) plantations with different densities and climatic conditions in northern Jiangsu Province. We also experimentally simulated the dynamic carbon allocation and stand growth between poplar plantations with diverse suggested planting densities in the region. We hypothesized that with an increase in stand density, the carbon allocated to the stems would decrease while that allocated to the leaves and roots would increase, resulting in a lower diameter at breast height (DBH).

2. Materials and Methods

2.1. The Model

2.1.1. Model Description

TRIPLEX, originally designed by Peng et al. [19], integrates three well-established models: the model of tree biomass production, 3-PG [20]; the model of forest stand dynamics, TREEDYN3.0 [21]; and the model of soil organic matter dynamics, CENTURY4.0 [22]. Wang et al. [18] modified the original TRIPLEX model and developed a new version, TRIPLEX-Management, that can simulate the effects of thinning on forest growth, carbon, and nitrogen cycling at the stand level.
The climate driving forces included in the model are the monthly average temperature, precipitation, and relative humidity. Moreover, the gross primary productivity (GPP) in the model is calculated by photosynthetically active radiation, leaf area index, and conversion constant, as well as modifiers that are limited by forest age, temperature, soil water, nitrogen, and frost duration. Respiration includes both autotrophic (including growing and maintaining respiration) and heterotrophic respiration. The maintenance of respiration is the product the carbon content of each plant component (foliage, roots, and wood) and the temperature sensitivity of respiration (Q10) [23]. Growth respiration is assumed to be one-fifth of the difference of maintaining respiration and GPP [19]. Net primary productivity (NPP) is allocated to the stems, leaves, and roots according to the allocation parameters. The stand structure is simulated using an empirical Weibull diameter distribution model. Forest thinning is driven by thinning time, thinning type, and thinning intensity [18]. Previously, Peng et al. [19] and Wang et al. [18] described the characteristics, structure, mathematical algorithms, sensitivity analysis, and development strategies of this model in detail.

2.1.2. Modification of the Carbon Allocation Module

The TRIPLEX-Management model uses a fixed proportion as the allocation coefficient [24]. This study developed and tested a different method that depended on light, water availability, and nitrogen (W, L, and N, respectively) [4] for improving carbon allocation in the TRIPLEX-Management model:
E t a S = 3 S 0 min ( W , N ) 2 L + min ( W , N )
E t a F R = 3 R 0 L L + 2 min ( W , N )
E t a F = 1 E t a S E t a F R
where EtaS, EtaFR, and EtaF are the allocation coefficients for the stems, roots, and leaves, respectively; L is the light availability factor; W is the water availability factor; min (W, N) is the minimum availability of water and nitrogen; R 0 and S 0 are the allocation fractions for roots and stems under non-limiting conditions, respectively, and R 0 = S 0 = 0.3 [25].

2.1.3. Calculation of the Water, Light, and Nitrogen Availability Factors

The light availability factor was calculated using the leaf area index [26]:
L = exp ( k n L A I )
where L A I is the leaf area index and k n is the light extinction coefficient.
The water availability factor was used to adjust the allocation to roots:
W = max [ 0 , min ( 1 , θ i θ w i l t θ f i e l d θ w i l t ) ]
where θ i is the actual soil moisture, θ f i e l d is the soil water content at field capacity, and θ w i l t is the soil moisture at the wilting point.
The nitrogen availability factor was calculated by combining the temperature ( T s ) and moisture ( W s ) limitations. The temperature limitation was calculated based on a standard Q10 equation and the moisture limitation was modeled using the following equations [27]:
N = T s × W s
W s = 1 ( 1 + 30 × e 8.5 × ( P P T P E T ) )
T s = Q 10 T 15 10
where T is the monthly mean air temperature, P P T is the monthly precipitation, P E T is the potential evapotranspiration, and Q10 = 2.92.

2.2. Study Sites

We used published poplar (dominated by Populus deltoids) plantation data for the sites in northern Jiangsu Province to validate the modified model (Table 1). The soils that dominated a fluvisol, according to the World Reference Base (WRB), at the sites were mostly alkaline and sandy, and they were planted with Populus section Aigioros clones during 1996 to 2007. The planted densities across these sites were from 200 to 1000 trees ha−1. These sites were mostly located in subtropical and warm temperate transition zones. The mean annual temperature and precipitation ranged from 14.5–16 ℃ and 972.5–1069 mm, respectively. Site climate data were obtained from the China Meteorological Data Service Center (http://data.cma.cn/, accessed on 20 July 2021).

2.3. Simulations

2.3.1. Parameterization and Initialization

The TRIPLEX-Management model was parameterized and verified for jack pine (Pinus banksiana Lamb.) and trembling aspen (Populus tremuloides Michx.) using the growth and yield data in Canada from several previous studies [18,19]. It was also parameterized for subtropical forest regions in southeastern China [36] and temperate forest ecosystems in northeastern China [24]. In this study, we maintained the most general and non-species or site-specific parameters, including the radiation extinction coefficient, soil water depth, and lignin–nitrogen ratio. We updated some species-specific parameters retrieved from the literature (Table 2). Site-specific parameters were estimated using the site and stand characteristics of the sampling plots (e.g., environmental or site conditions, stand stock, and growth characteristics of tree species). The site-specific parameters included species, renewal year, latitude, site type, soil organic carbon, and stocking level. We modified the initial stocking level using the planting density.

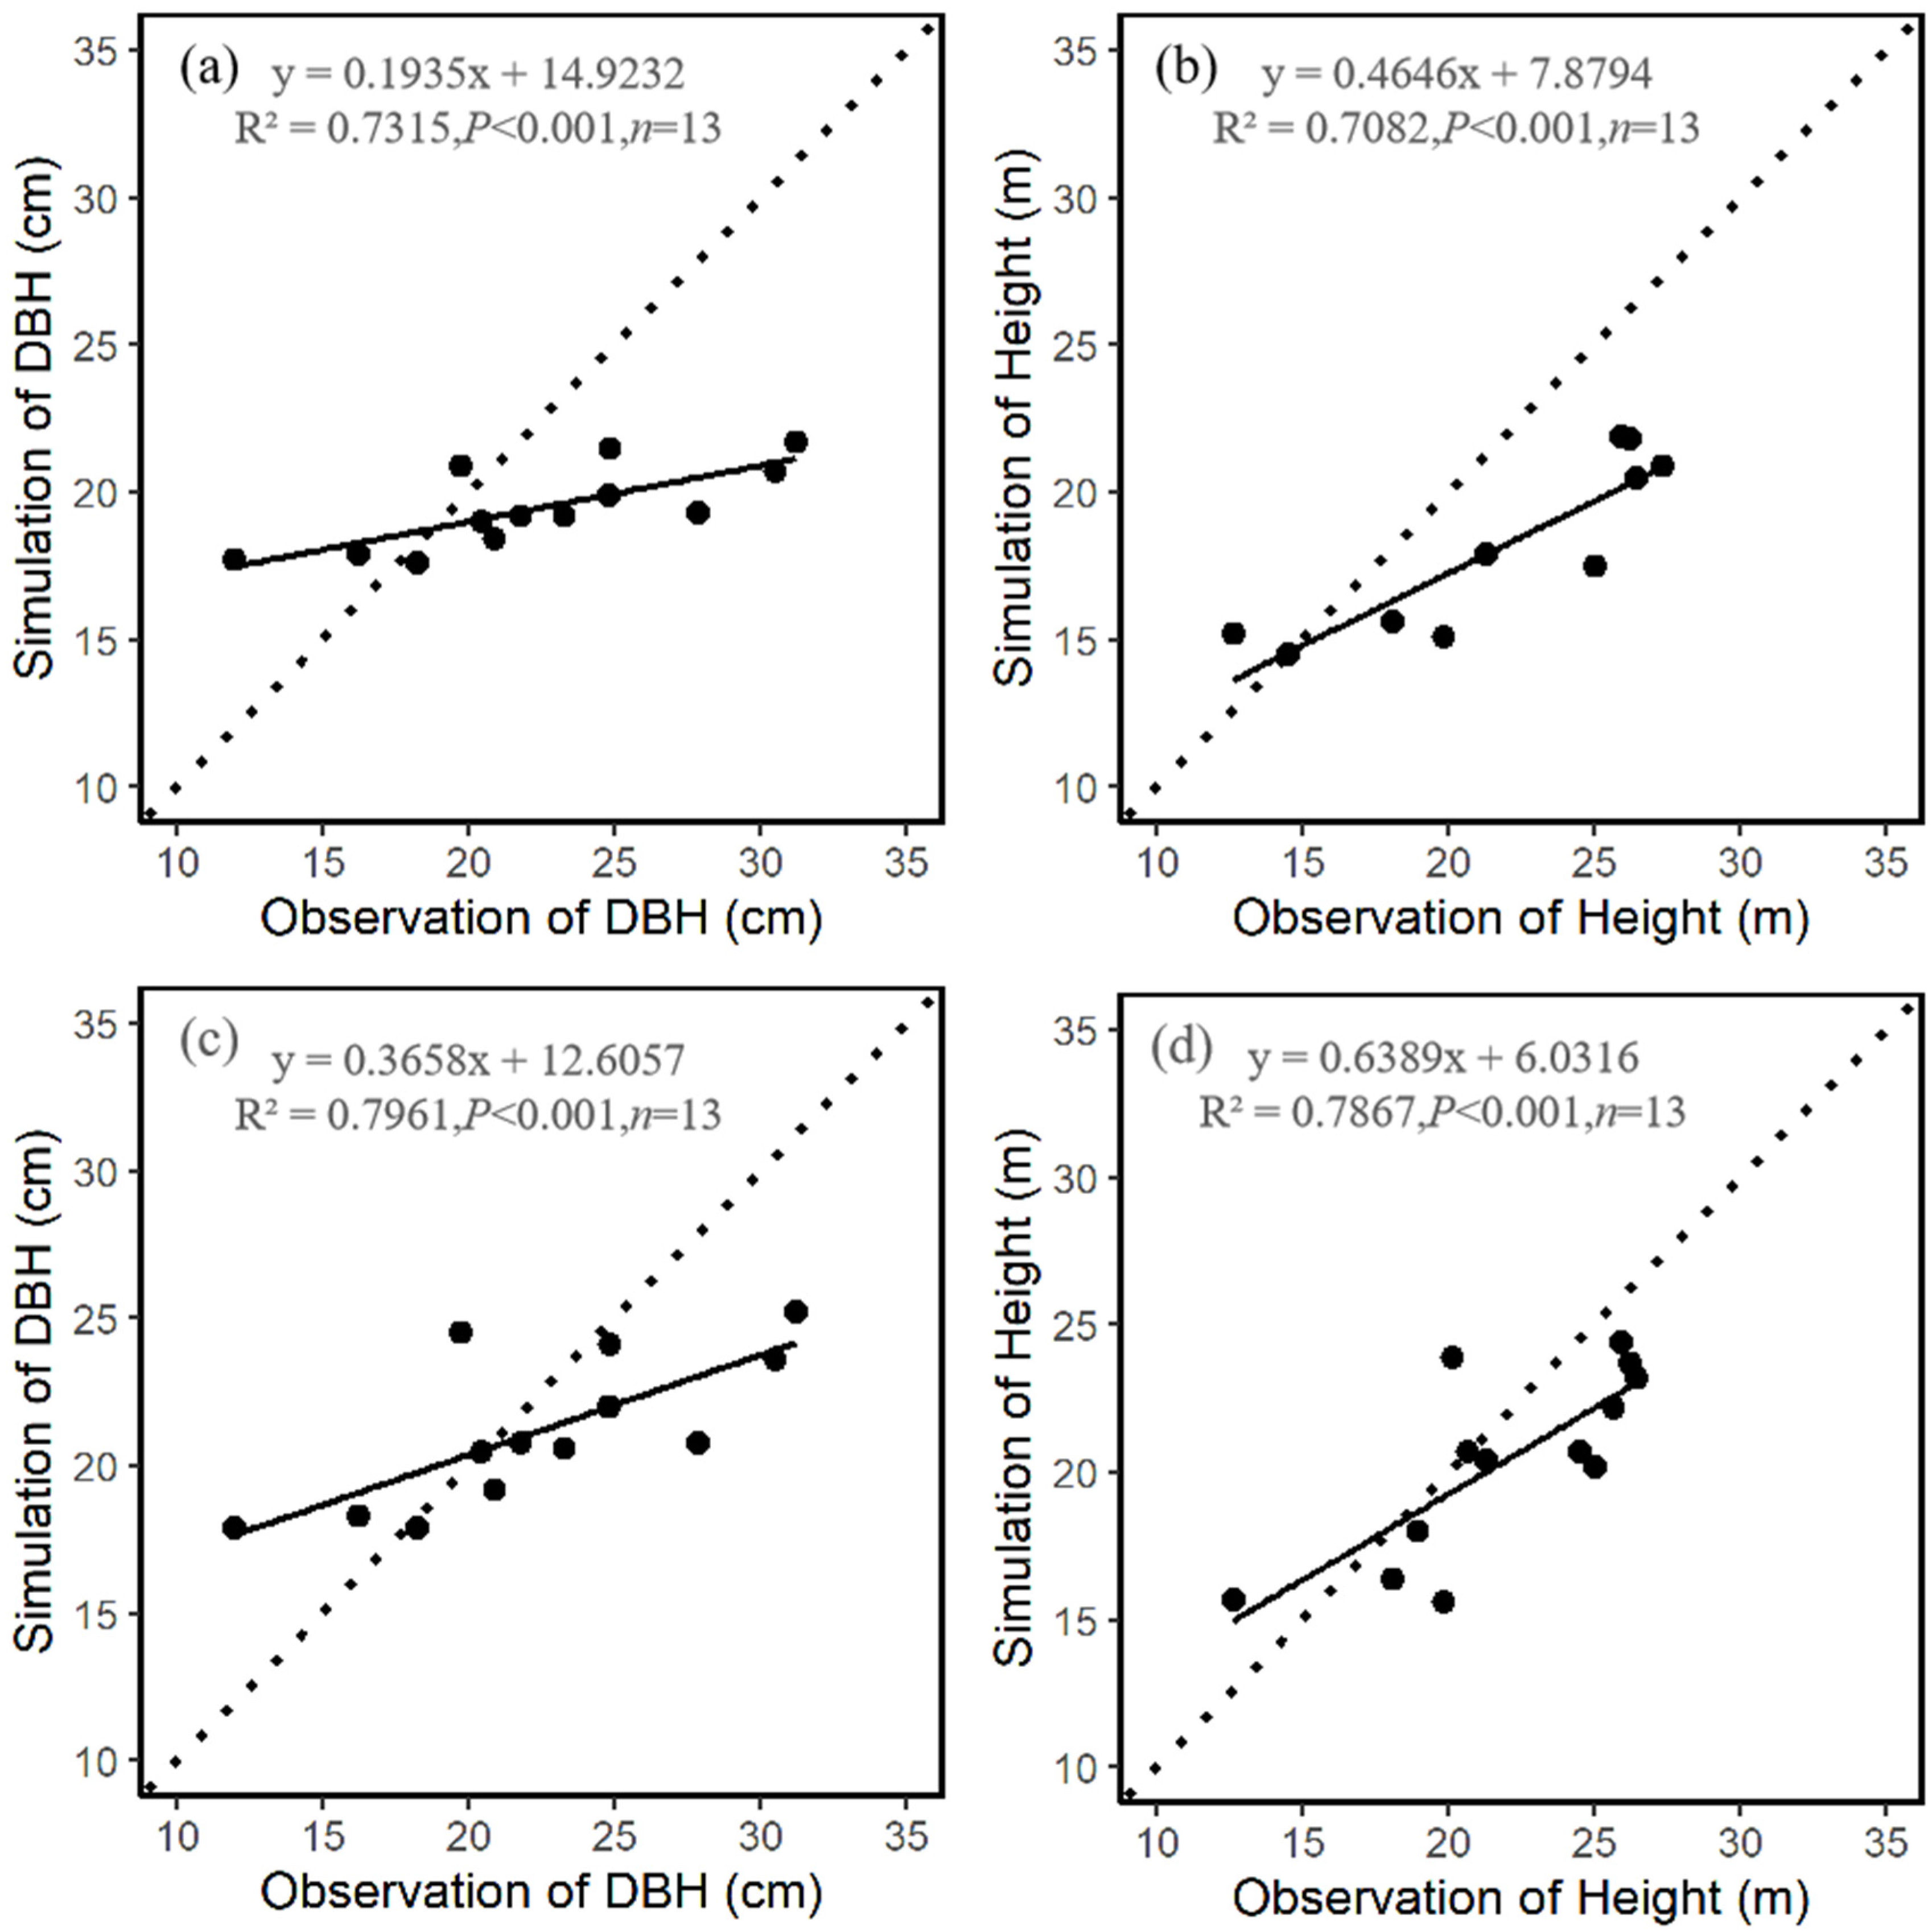
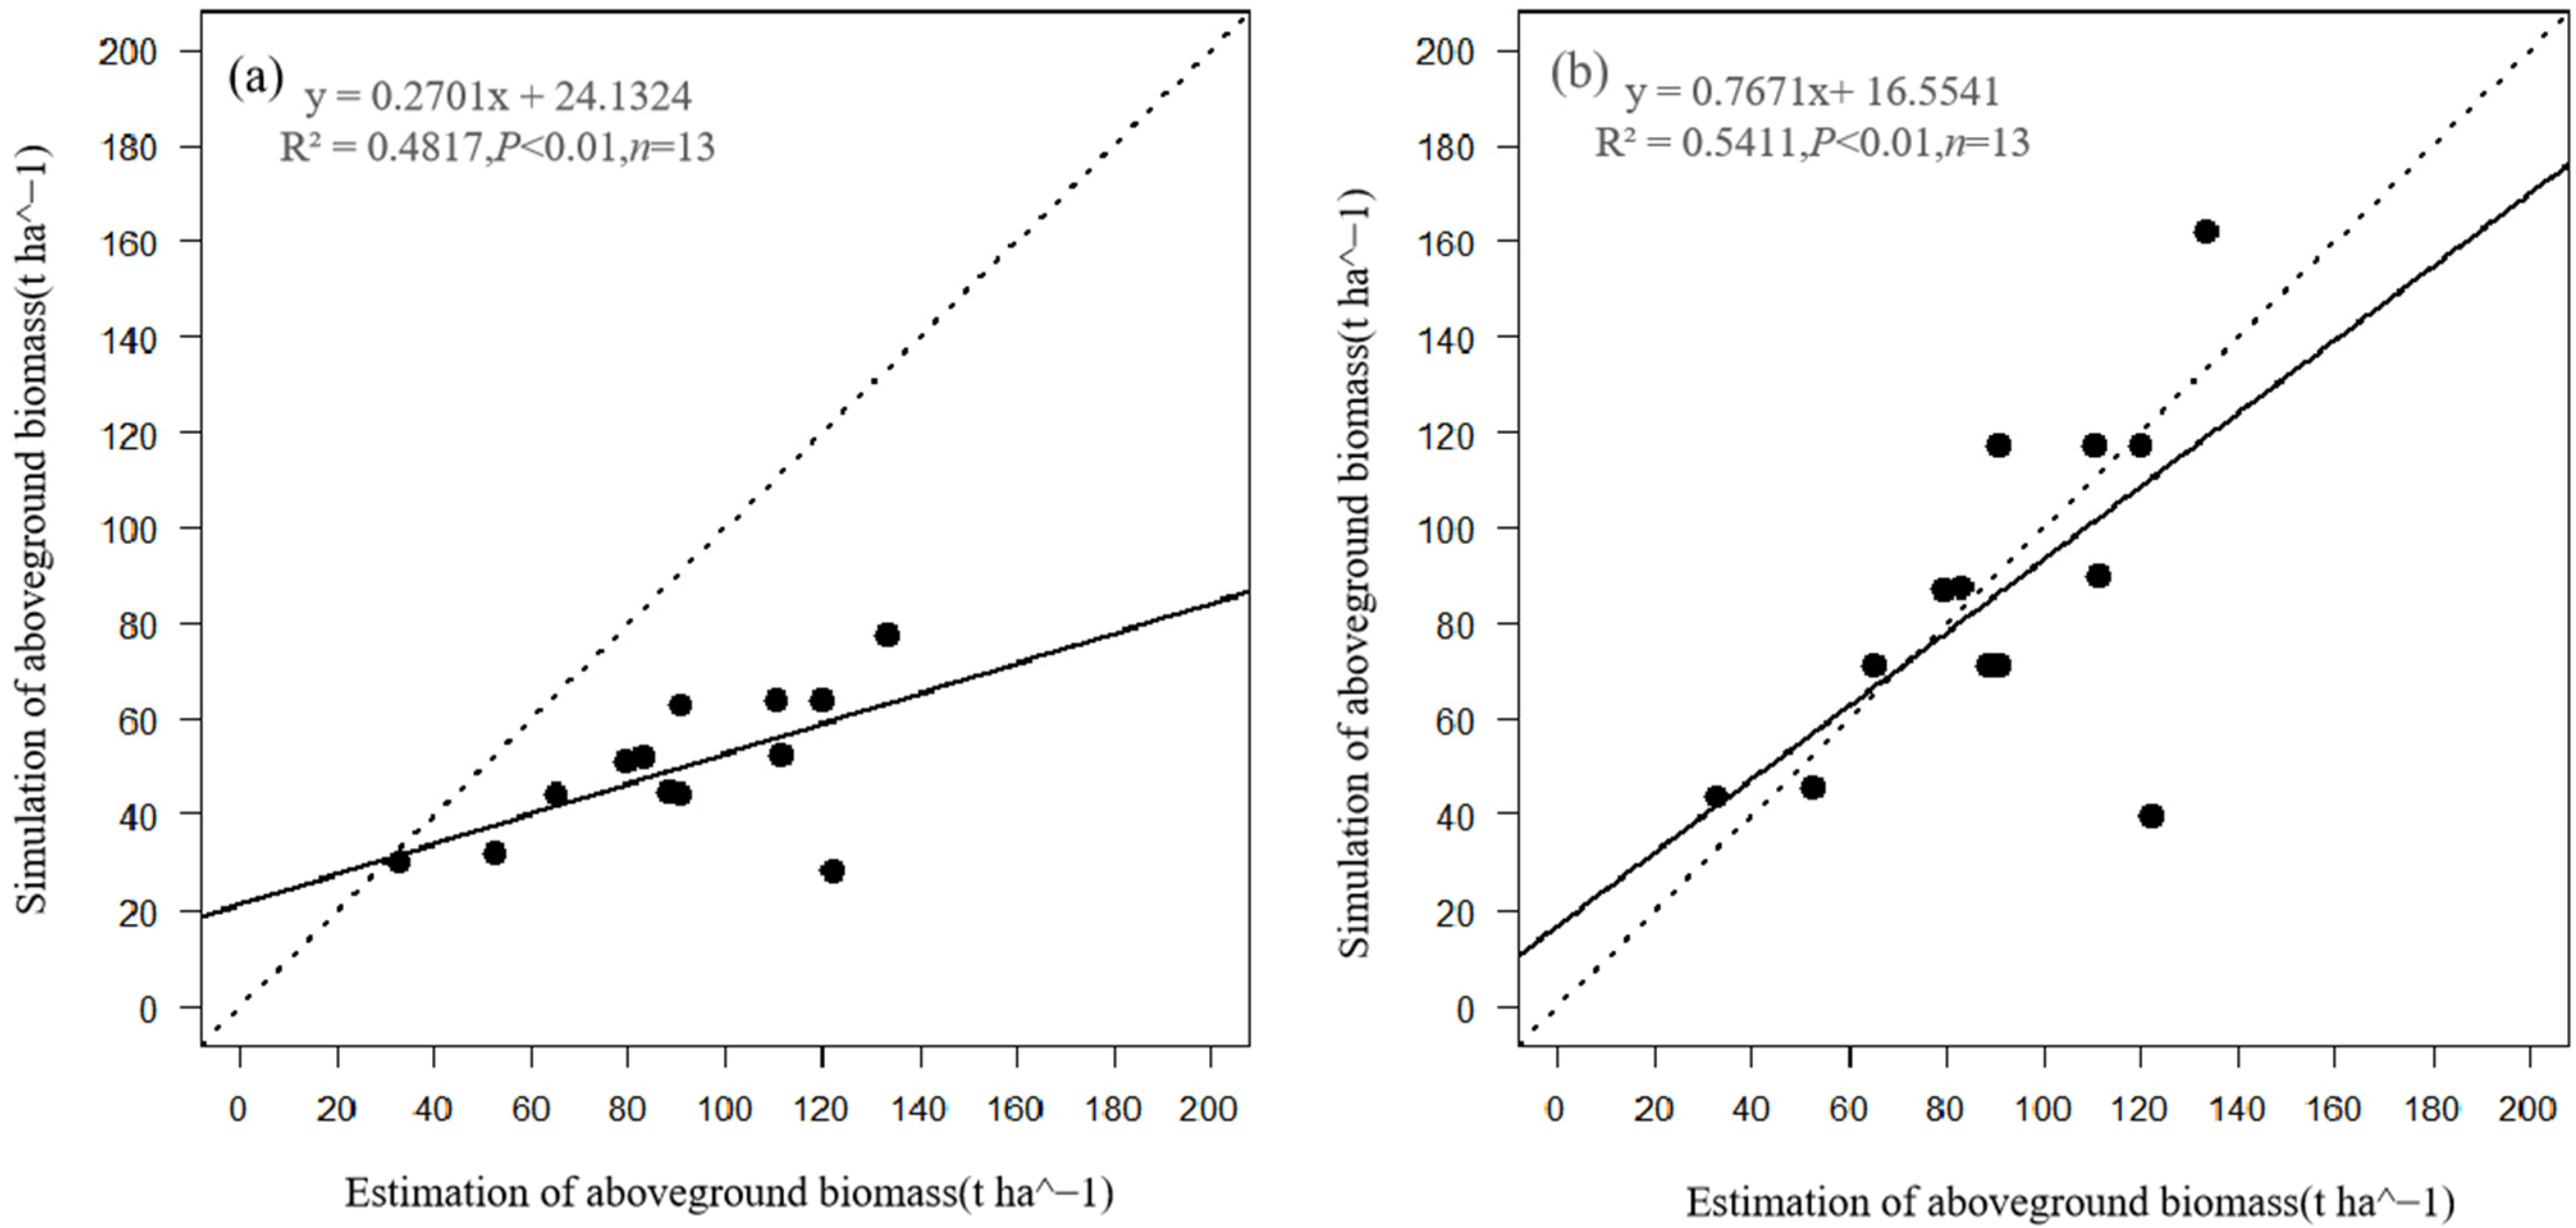
2.3.2. Model Evaluation

The mean absolute error (MAE) and normalized root mean square error (NRMSE) were used to evaluate the differences between the predicted and observed values.
M A E = 100 i = 1 n | P i O i | n O ¯
N R M S E = ( O m a x O m i n ) 1 [ i = 1 n ( P i O i ) 2 n ] 0.5
where Pi is the ith predicted value; O i is ith the observed value; O ¯ is the mean observed value; O m a x and O m i n are the maximum and minimum observed values, respectively; and n is the number of observations. The lower the value of the two indicators, the smaller the difference between the model predictions and observations, indicating a more accurate simulation.
The Willmott index of agreement (d) was used as an indicator of modeling efficiency, with values ranging from 0 to 1.0, with 1.0 indicating perfect agreement; it is expressed as follows [41]:
d = 1 [ i = 1 n | P i O i | 2 i = 1 n ( | P i O ¯ | + | O i O ¯ | ) 2 ]

2.3.3. Simulation Experiments

According to the planted density of the stand in the study area, the densities were adjusted to 200, 400, 600, 800, 1000, and 1200 stems ha−1. Under the same climate and soil conditions, the growth status of the poplars began from the regeneration year of each stand to the end of 20 years of growth. Variables such as DBH, height, and biomass were simulated.

3. Results

3.1. Comparison of Stand Characteristics

A comparison of the observed and predicted DBH and heights showed good consistency (Figure 1a–d). The determination coefficient (R2) of the mean DBH and mean height ranged from 0.7 to 0.8 (p < 0.001, Figure 1), and the modified model by W, L, and N had higher regression coefficients than the original model. The MAE range of the mean DBH and mean height was 15.4%–24.8% and the NRMSE range of all of the stand variables was 0.2–0.4 (Table 3). The Willmott indices of agreement between the observed and simulated basic stand variables were 0.6–0.8 (Table 3). In the modified model, the MAE, NRMSE, and Willmott index were better than the original model.
The coefficient of determination between the simulated and estimated aboveground biomass in the modified version (RW,L,N2 = 0.54) was better than in the original model (Roriginal2 = 0.48, Figure 2). For the modified model, the slope was 0.8 and the intercept was 16.6 t ha−1 (Figure 2b). The MAE and NRMSE for the modified model were lower than these for the original model, and the Willmott index was higher than for the original model (Table 3).

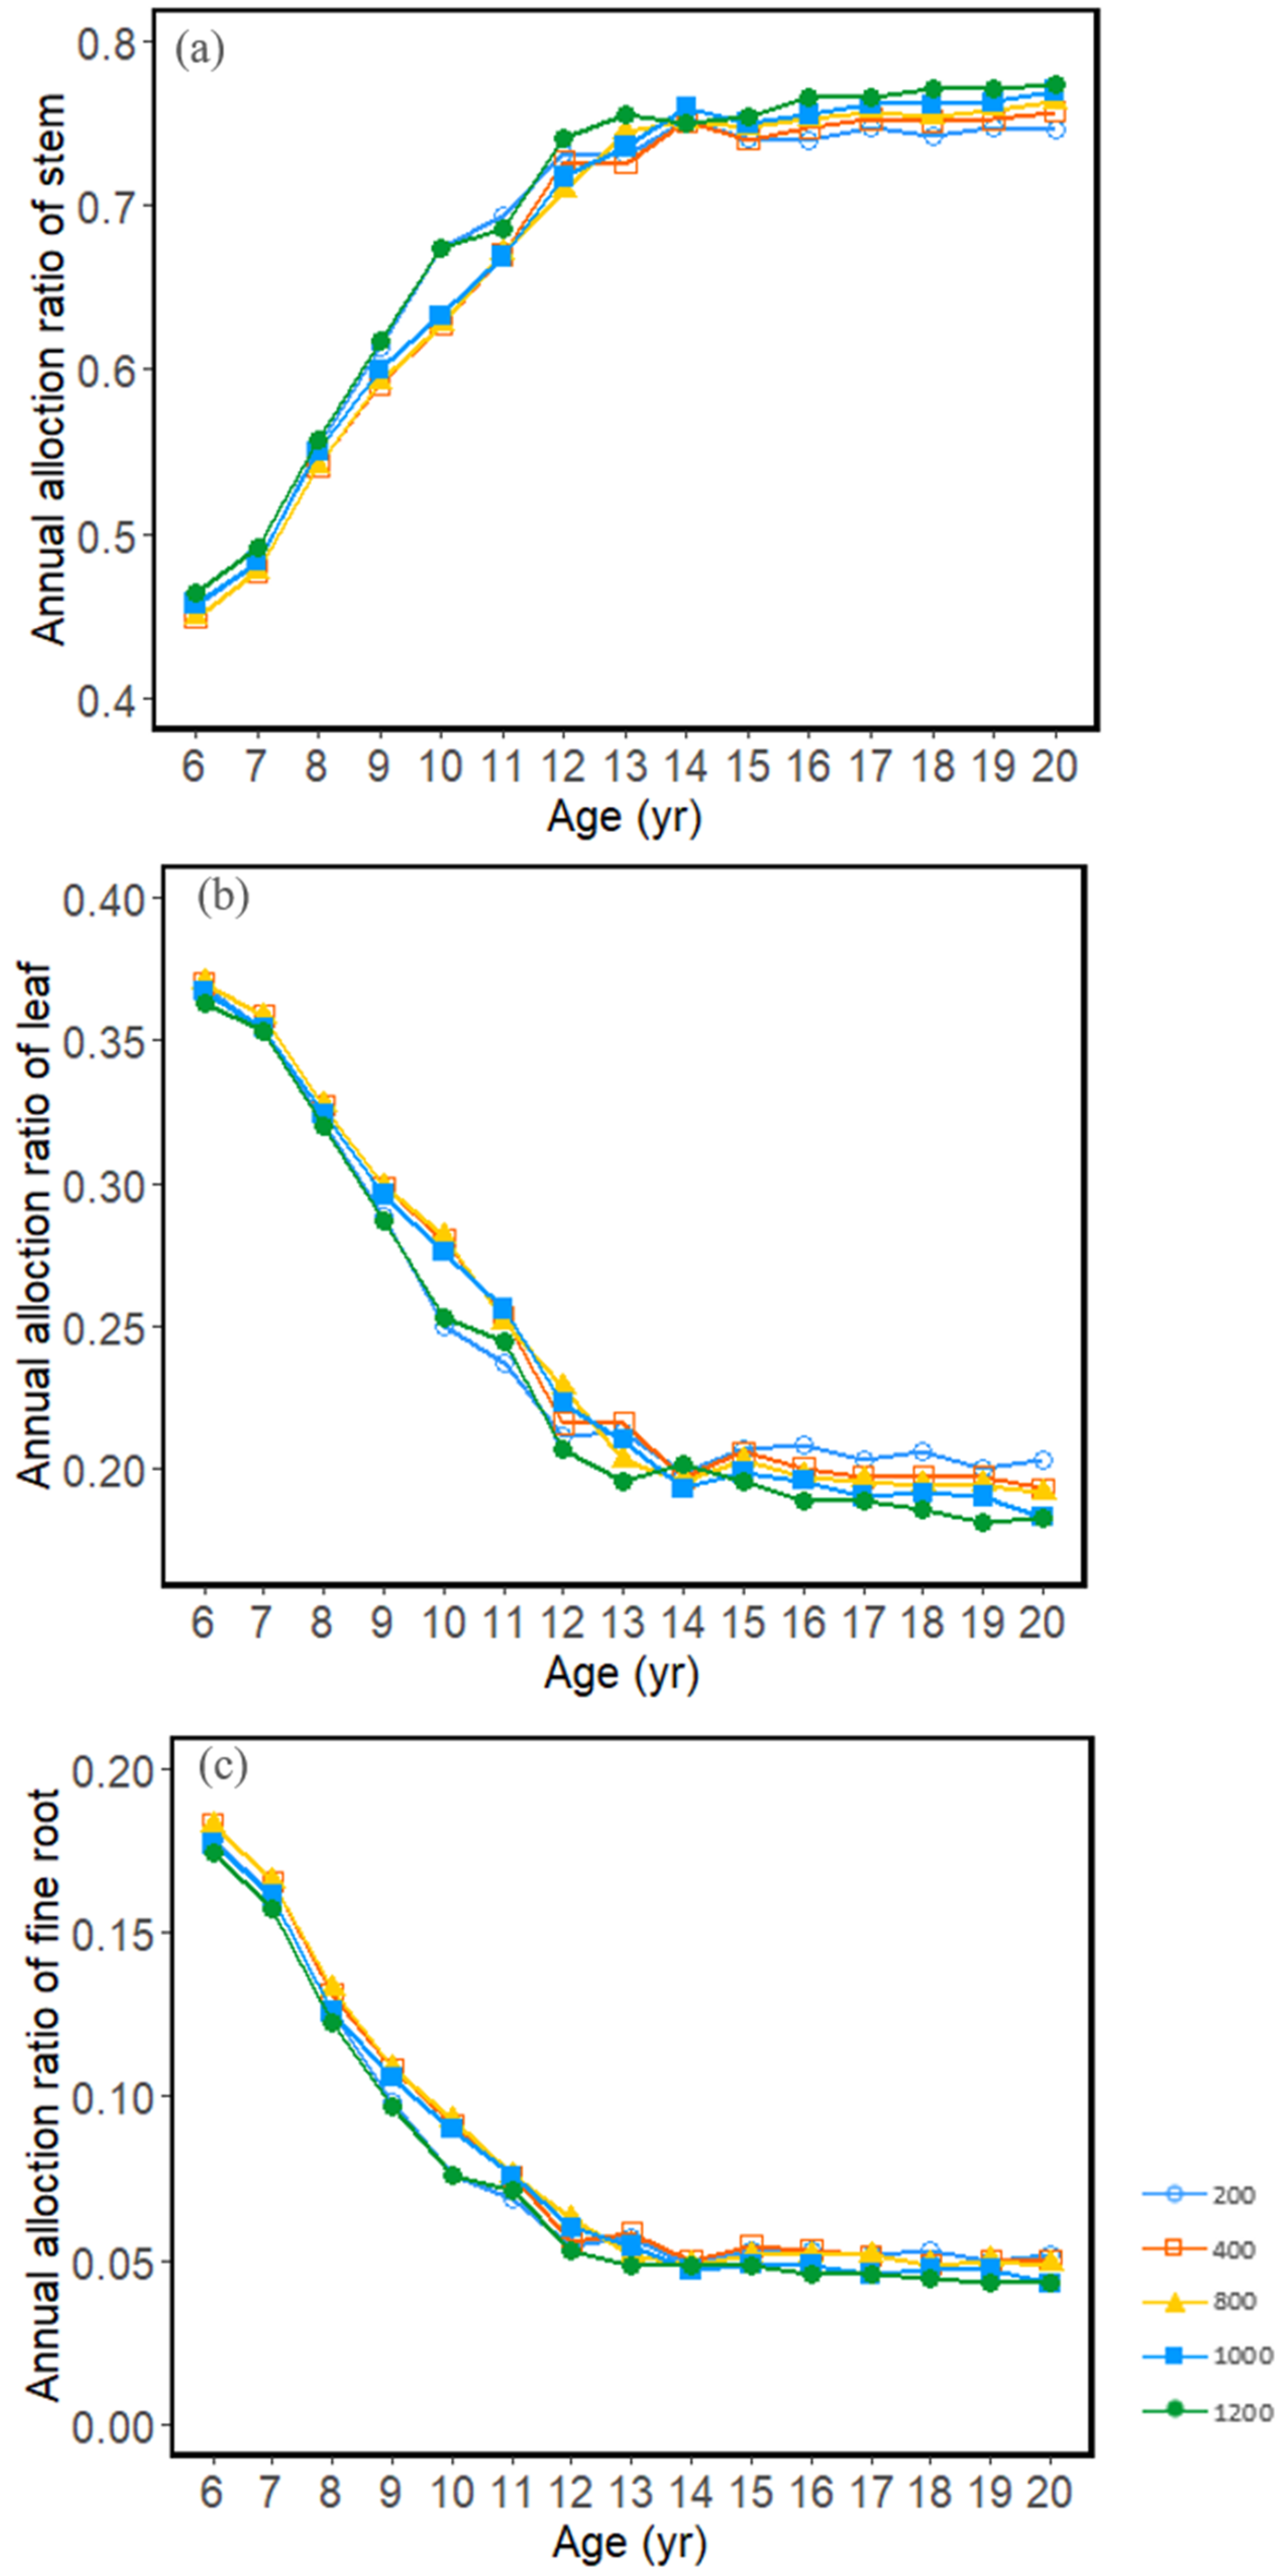
3.2. Carbon Allocation and Growth Change with Stand Density

Overall, EtaS was higher than EtaFR and EtaF (Figure 3). Stands with a high density generally allocated more carbon to the stem for the tree architecture, while stands with a low density allocated more carbon to the nutrient organs, such as the foliage and fine roots, for the improved allocation method (Figure 3 and Figure 4). The effect of density on EtaS and EtaF was obvious, especially at the late growth stage of the stand, while the effect on EtaFR was not large (Figure 3).
The average DBH decreased from 31.7 to 21.5 cm and the average tree height decreased from 26.9 to 21.9 m with the increasing stand density for the improved method (Table 4). The aboveground biomass increased with density until 400 stems ha−1, and then became relatively stable thereafter.

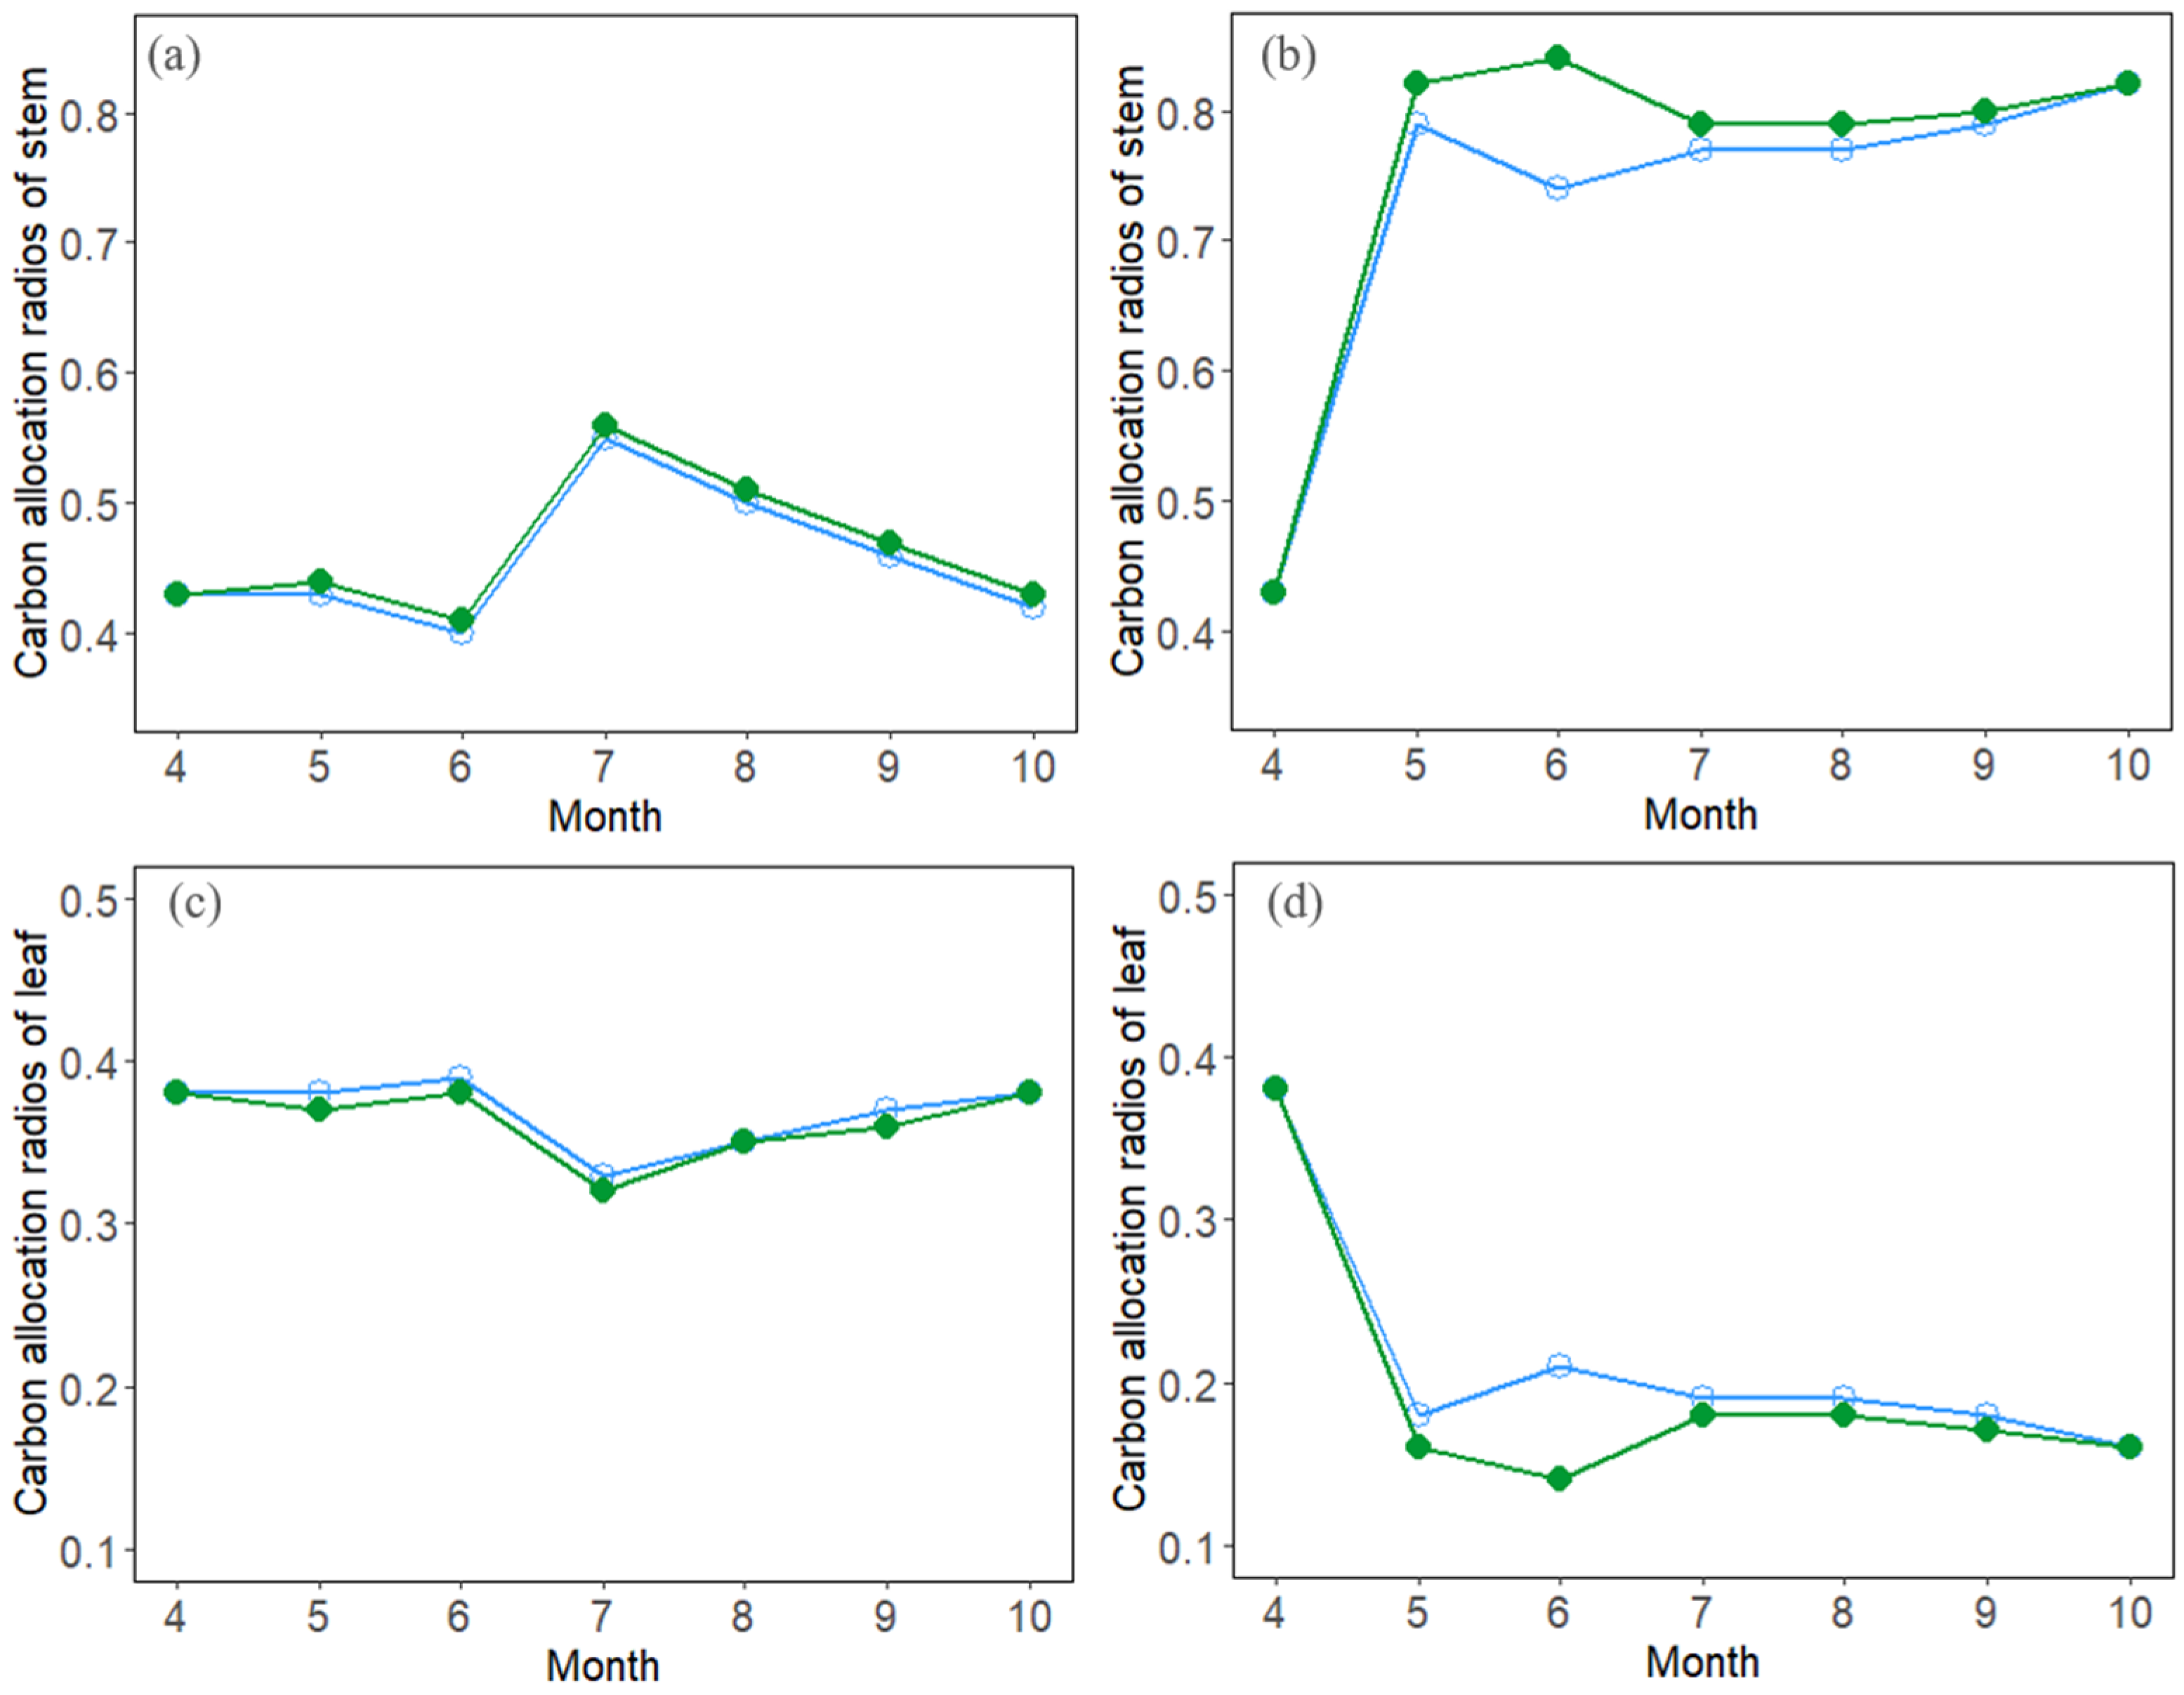
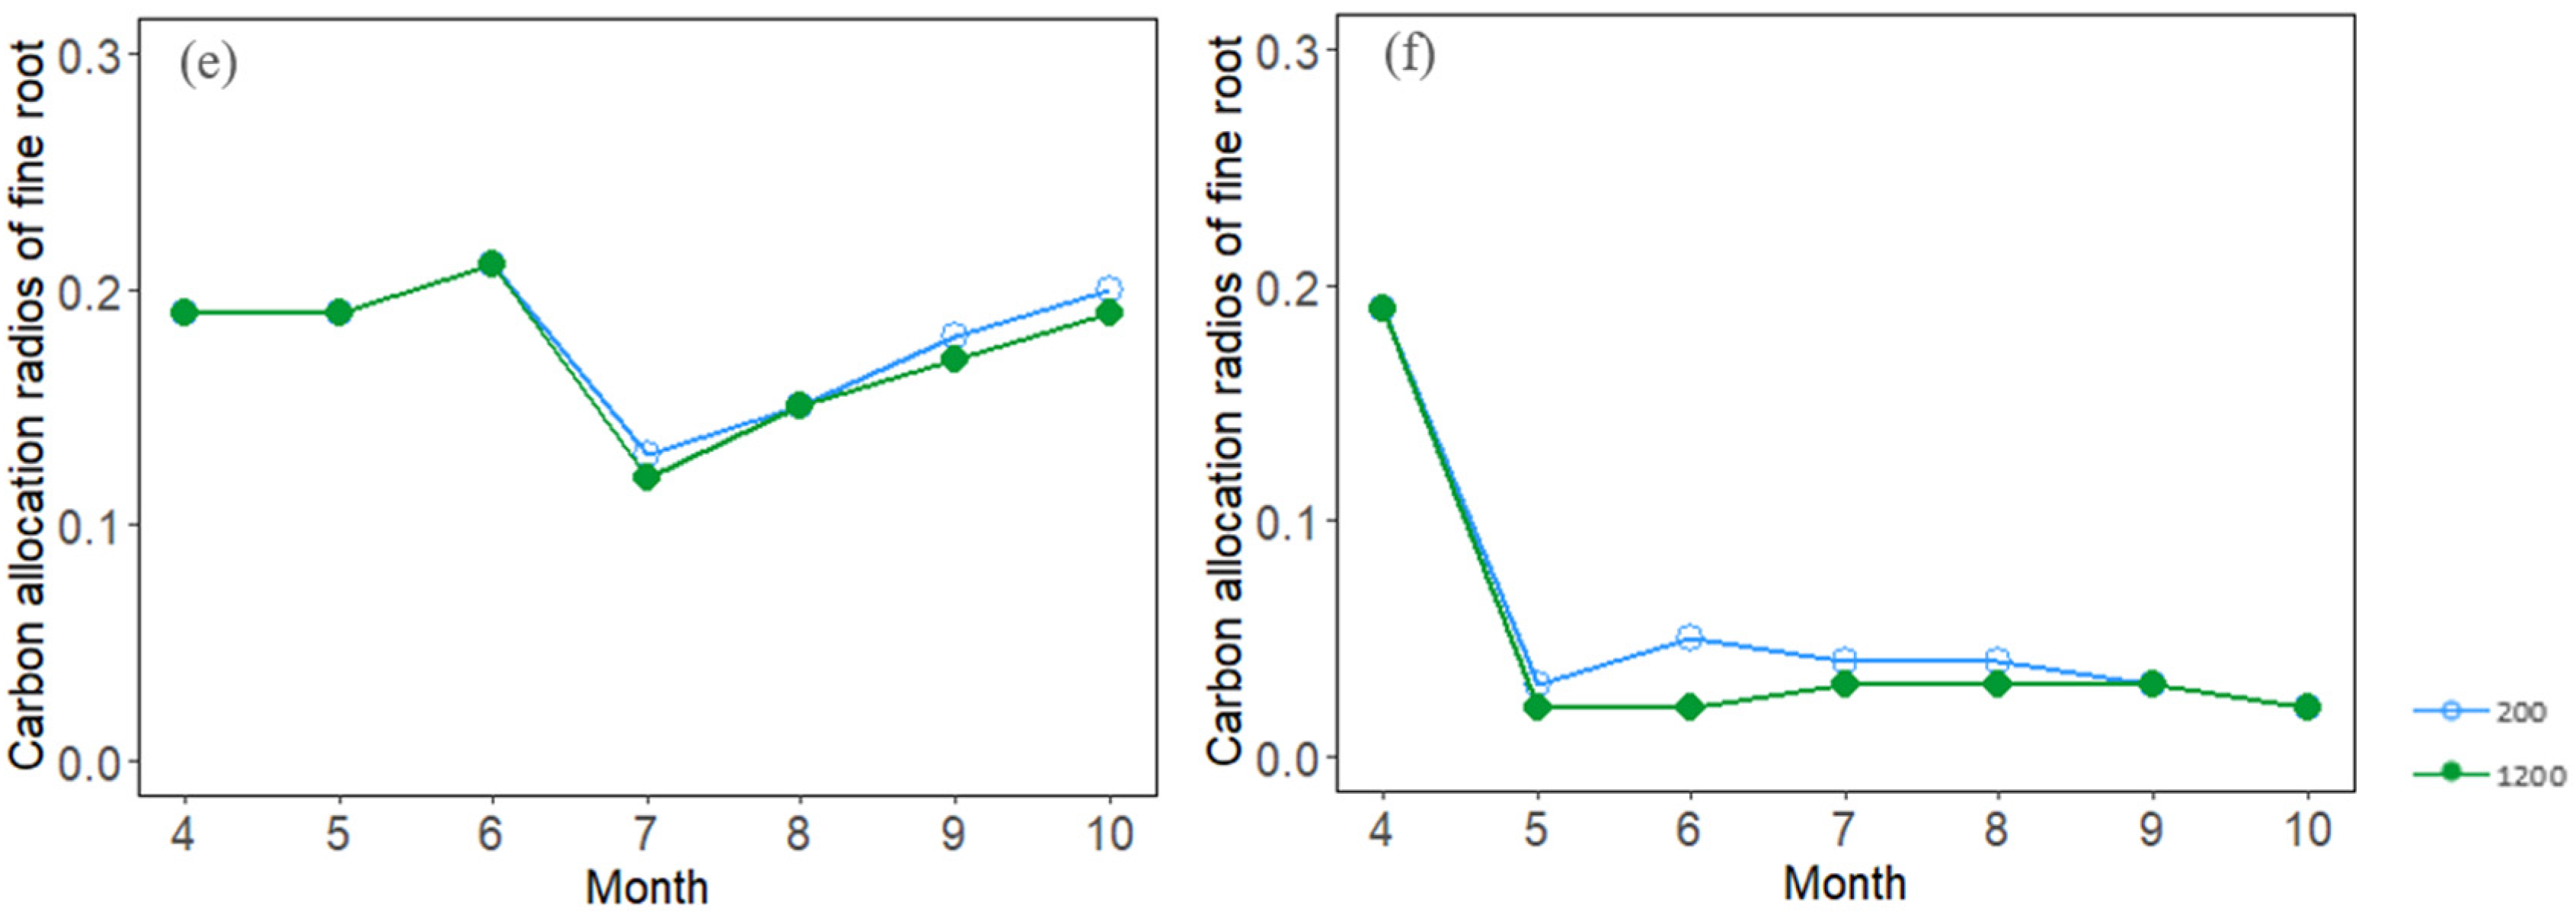
3.3. Seasonal Dynamics of Carbon Allocation

There were obvious seasonal dynamics for the three allocation ratios in the growth stage. When the stand was in the 6-year-old stage, EtaS reached its peak in July and then began to decline for the simulated densities (200 vs. 1200 stems ha−1), while those in the 13-year-old stage peaked in May (Figure 4a,b). In the 6-year-old stage of stand development, EtaF and EtaFR remained relatively consistent across the growing season (Figure 4c,e), while in the 13-year-old stand, carbon allocation to foliage and fine roots generally decreased (Figure 4d,f).

4. Discussion

4.1. Module Improvement

The method of determining the allocation ratio according to the relative intensity of the water, light, and nutrient constraints (W, L, and N) was better than for the method that used a fixed proportion in the original model. Nutrition (such as nitrogen and phosphorus) plays an important role in the carbon cycle and plant growth. Previous field measurements and theoretical studies have shown that nitrogen limitation has a significant effect on the response of the carbon cycle to a change in stand density [42]. When the stand density is too high or during the rapid growth stage of trees, nutrition is a limiting factor for growth, and the impact of water and light on plants is lower. The allocation of carbon in plants, especially the allocation to stems owing to nutrition, cannot be fully determined without considering nutrition-limiting factors [43]. The soil in the study area is often heavily weathered, and nutrients, such as N, are low in concentration and availability. The W, L, and N module, where nitrogen limitation is roughly controlled by the temperature and water availability [44], can better simulate the allocation change constrained by the nutrient availability. Furthermore, there was one stand that underestimated the biomass using W, L, and N model; this could have been caused by soil texture factors. The particle composition and total porosity of different texture soils are different. These factors affect the distribution of the plant biomass by affecting water, gas, heat, and nutrition.

4.2. Effects of Stand Density on Carbon Allocation and Stand Growth

In our study, more carbon was allocated to the stems, and less was allocated to the nutritional organs, especially the fine roots, as the density increased. With the increase in density, the percentage change of the stem carbon allocation was from −0.9% to 1.9%, the change in leaf allocation was from 1.0% to −3.3%, and the change in fine root allocation was from 4.0% to −5.2%. With the increase in density, the leaf and root allocation slightly decreased and the stem allocation slightly increased, because the near-unidirectional nature of the light in the closed canopy was related to the position of the leaves at the top of the canopy, which are crucial for light interception [5]. However, other studies have reported contradictory results. For example, stem growth has been shown to increase significantly under uninhibited conditions and is the highest under medium shade conditions [45]. With an increase in competitive pressure, trees invest more carbon in their photosynthetic organs to compete for limited light resources [3]. In stands with a low stand density, trees are usually not inhibited by light, water, or nutrition conditions. Under these conditions, trees allocate more resources to nutritional organs for increasing photosynthesis and absorbing more nutrients in order to grow fast. When the forest cover rate or density is high, the competition for resources such as light, water, and nutrients restricts tree growth. Under these conditions, to better collect light, trees allocate more NPP to the stems for achieving the highest canopy. During water or nutrient stress, the allocation of carbon to fine roots increases to maintain water absorption and growth [4]. Therefore, competition for light under high density conditions increases the proportion of stem carbon allocation.
We found that competition induced by a high stand density negatively affected DBH growth. The growth range of DBH decreased with the increase in stand density. Our results are consistent with those of previous studies [46,47,48]. Most previous surveys of other tree species found similar results [49]. This occurs because, under the condition of canopy closure, the competition between individual trees for nutrition restricts the growth of DBH. To compete for more nutrients, nutrient organs such as foliage and fine roots grow fast, while the stems grow relatively slowly. In accordance with previous studies, we also found that density had little effect on height. According to a study on the impacts of different planting densities on growth factors and the physical and mechanical properties of Populus wood, Liu et al. [46] found that planting density had no significant effect on height growth. After a 7-year study on the effects of density on the growth of self-thinning Eucalyptus urophylla stands, Xue et al. [50] found that density had a smaller effect on tree height than that on DBH. A study on eight different afforestation densities of southern type clones of Aigeiros poplars showed that there was no significant difference in tree height among poplar stands with different densities before 7 years of age; however, there were significant differences when the stand age was more than 8 years old [51]. At lower densities, trees grow faster to dominate at the stand. As the density increases, trees compete for more sunlight by increasing their height. Therefore, regardless of a high density or low density, trees need to increase their height for better survival. The results of this study show that the biomass of poplar stands first increased and then decreased with the stand density, and the growth rate of the biomass slowed. Unlike our results, Alatan [52] found that the biomass decreased with the increase in density. This discrepancy may be attributed to the low density (severe thinning) and lack of competition between trees. The yield increased rapidly with the increase in density. At an intermediate density, owing to the increasing competition between trees, the yield increased at a decreasing rate with higher densities (lightly thinned or controlled).

4.3. Uncertainties of Model Simulation and Future Work

Differences between simulated and observed results may have occurred because of the low sampling frequency of typical fieldwork. A low sampling frequency leads to low field data, which makes it impossible to carry out more comprehensive comparisons and verification. In our study, the observed stand growths that were used to test the model were from relatively young (7–11 years old) poplar plantations, resulting in uncertainties for simulating 20-year-old stands. Another source of uncertainty is attributed to the lack of soil and local meteorological data. For some sites, climate data were obtained from the nearest weather station. In future studies, more observation data, especially soil organic matter, should be collected to reduce model uncertainty.
Regarding carbon allocation, further refinements are still required. With ongoing climate change, severe and extensive droughts are expected to occur in many regions in the future [53]. An increase in nitrogen deposition can significantly change the soil nitrogen availability. Changes in drought and nitrogen deposition directly affect the terrestrial carbon cycle and indirectly affect the allocation of assimilated carbon among plant components [7,25]. Therefore, uncertainty over nitrogen availability may lead to uncertainties in the model performance of allocation. In addition, there have only been a few experiments on carbon allocation [45]. The model simulation cannot be corrected by experimental data and an accurate allocation mode cannot be obtained for model improvement and parameter design. More empirical studies on carbon allocation are thus needed to reduce the uncertainty surrounding the carbon allocation patterns and carbon utilization efficiency of woody plants.
The tree DBH growth differed significantly between stands with different densities, but the relationship between stand density and height was not significant. Therefore, according to management purposes, directional cultivation could be realized through density control in order to achieve the highest yield. In the early stages, afforestation areas should be increased appropriately. When trees grow to maturity, density should be reduced to provide sufficient growth space for trees. Our study showed that increasing the planted density could increase the biomass of poplar stands and improve the ecological function related to biomass, possibly achieving increased carbon sequestration without sacrificing wood production. Therefore, it is necessary to select suitable afforestation densities or implement thinning measures according to the forest management objectives.

5. Conclusions

By introducing light, water, and nitrogen availability factors to the carbon allocation module, the TRIPLEX-Management model was modified to simulate the growth response of poplar plantation forests to density change. The stem allocation coefficients rose with increase in density due to competition for light. The optimum poplar planting density in northern Jiangsu Province could be approximately 400 stems ha−1, which could have higher ecological functions related to carbon sequestration, without sacrificing wood production. Reasonable stand density regulation should thus be performed depending on the climate and site conditions. The modified process-based model might be a useful tool for predicting the response of forest growth and carbon sequestration to stand density change in different climate and soil conditions.

Author Contributions

W.J.: conceptualization, methodology, formal analysis, writing—original draft. W.W.: supervision, conceptualization, methodology, writing—review and editing, funding acquisition, project administration. C.P.: writing—review and editing. X.L.: writing—review and editing. H.R.: writing—review and editing. H.L.: writing—review and editing. Y.Y.: writing—review and editing. P.G.: writing—review and editing. V.S.: writing—review and editing. All authors have read and agreed to the published version of the manuscript.

Funding

This study was supported by the National Key Research and Development Program of China (grant no. 2021YFD2200404) and the National Natural Science Foundation of China (grant no: 31700555).

Acknowledgments

The authors thank Shengzuo Fang for his comments on the previous manuscript and for the suggestions regarding planting density trial.

Conflicts of Interest

The authors declare no conflict of interest.

References

  1. Lin, B.; Ge, J. To harvest or not to harvest? Forest management as a trade-off between bioenergy production and carbon sink. J. Clean. Prod. 2020, 268, 122219. [Google Scholar] [CrossRef]
  2. Liu, Q.; Cai, H.; Jin, G. Effects of selective cutting on the carbon density and net primary productivity of a mixed broadleaved-Korean pine forest in Northeast China. Chin. J. Appl. Ecol. 2013, 24, 2709–2716, (In Chinese with English Abstract). [Google Scholar]
  3. Wertz, B.; Bembenek, M.; Karaszewski, Z.; Ochal, W.; Skorupski, M.; Strzelinski, P.; Wegiel, A.; Mederski, P.S. Impact of stand density and tree social status on aboveground biomass allocation of Scots Pine Pinus sylvestris L. Forests 2020, 11, 765. [Google Scholar] [CrossRef]
  4. Xia, J.Z.; Yuan, W.P.; Lienert, S.; Joos, F.; Ciais, P.; Viovy, N.; Wang, Y.P.; Wang, X.F.; Zhang, H.C.; Chen, Y.; et al. Global patterns in net primary production allocation regulated by environmental conditions and forest stand age: A model-data comparison. J. Geophys. Res. Biogeosci. 2019, 124, 2039–2059. [Google Scholar] [CrossRef] [Green Version]
  5. Poorter, H.; Niklas, K.J.; Reich, P.B.; Oleksyn, J.; Poot, P.; Mommer, L. Biomass allocation to leaves, stems and roots: Meta-analyses of interspecific variation and environmental control. New Phytol. 2012, 193, 30–50. [Google Scholar] [CrossRef] [PubMed]
  6. Postma, J.A.; Hecht, V.L.; Hikosaka, K.; Nord, E.A.; Pons, T.L.; Poorter, H. Dividing the pie:a quantitative review on plant density responses. Plant Cell Environ. 2021, 44, 1072–1094. [Google Scholar] [CrossRef]
  7. De Kauwe, M.G.; Medlyn, B.E.; Zaehle, S.; Walker, A.P.; Dietze, M.C.; Wang, Y.P.; Luo, Y.; Jain, A.K.; El-Masri, B.; Hickler, T.; et al. Where does the carbon go? A model-data intercomparison of vegetation carbon allocation and turnover processes at two temperate forest free-air CO2 enrichment sites. New Phytol. 2014, 203, 883–899. [Google Scholar] [CrossRef] [Green Version]
  8. Merganicova, K.; Merganic, J.; Lehtonen, A.; Vacchiano, G.; Sever, M.Z.O.; Augustynczik, A.L.D.; Grote, R.; Kyselova, I.; Makela, A.; Yousefpour, R.; et al. Forest carbon allocation modelling under climate change. Tree Physiol. 2019, 39, 1937–1960. [Google Scholar] [CrossRef] [PubMed]
  9. Wang, Y.P.; Law, R.M.; Pak, B. A global model of carbon, nitrogen and phosphorus cycles for the terrestrial biosphere. Biogeosci. 2010, 7, 2261–2282. [Google Scholar] [CrossRef] [Green Version]
  10. Thornton, P.E.; Lamarque, J.F.; Rosenbloom, N.A.; Mahowald, N.M. Influence of carbon-nitrogen cycle coupling on land model response to CO2 fertilization and climate variability. Glob. Biogeochem. Cycles 2007, 21, Gb4018. [Google Scholar] [CrossRef]
  11. Medvigy, D.; Wofsy, S.C.; Munger, J.W.; Hollinger, D.Y.; Moorcroft, P.R. Mechanistic scaling of ecosystem function and dynamics in space and time: Ecosystem Demography model version 2. J. Geophys. Res. Biogeosci. 2009, 114, G01002. [Google Scholar] [CrossRef] [Green Version]
  12. Smith, B.; Warlind, D.; Arneth, A.; Hickler, T.; Leadley, P.; Siltberg, J.; Zaehle, S. Implications of incorporating N cycling and N limitations on primary production in an individual-based dynamic vegetation model. Biogeosciences 2014, 11, 2027–2054. [Google Scholar] [CrossRef] [Green Version]
  13. Song, Y.; Jain, A.K.; McIsaac, G.F. Implementation of dynamic crop growth processes into a land surface model: Evaluation of energy, water and carbon fluxes under corn and soybean rotation. Biogeosciences 2013, 10, 8039–8066. [Google Scholar] [CrossRef] [Green Version]
  14. Trugman, A.T.; Anderegg, L.D.L.; Wolfe, B.T.; Birami, B.; Ruehr, N.K.; Detto, M.; Bartlete, M.K.; Anderegg, W.R.L. Climate and plant trait strategies determine tree carbon allocation to leaves and mediate future forest productivity. Glob. Chang. Biol. 2019, 25, 3395–3405. [Google Scholar] [CrossRef] [PubMed] [Green Version]
  15. Prilepova, O.; Hart, Q.; Merz, J.; Parker, N.; Bandaru, V.; Jenkins, B. Design of a GIS-based web application for simulating biofuel feedstock yields. ISPRS Int. J. Geo-Inf. 2014, 3, 929–941. [Google Scholar] [CrossRef] [Green Version]
  16. Guillemot, J.; Francois, C.; Hmimina, G.; Dufrene, E.; Martin-StPaul, N.K.; Soudani, K.; Marie, G.; Ourcival, J.M.; Delpierre, N. Environmental control of carbon allocation matters for modelling forest growth. New Phytol. 2017, 214, 180–193. [Google Scholar] [CrossRef] [Green Version]
  17. Garcia, E.S.; Tague, C.L.; Choate, J.S. Uncertainty in carbon allocation strategy and ecophysiological parameterization influences on carbon and streamflow estimates for two western US forested watersheds. Ecol. Model. 2016, 342, 19–33. [Google Scholar] [CrossRef] [Green Version]
  18. Wang, W.; Peng, C.; Zhang, S.Y.; Zhou, X.; Larocque, G.R.; Kneeshaw, D.D.; Lei, X. Development of TRIPLEX-Management model for simulating the response of forest growth to pre-commercial thinning. Ecol. Model. 2011, 222, 2249–2261. [Google Scholar] [CrossRef]
  19. Peng, C.H.; Liu, J.X.; Dang, Q.L.; Apps, M.J.; Jiang, H. TRIPLEX: A generic hybrid model for predicting forest growth and carbon and nitrogen dynamics. Ecol. Model. 2002, 153, 109–130. [Google Scholar] [CrossRef]
  20. Landsberg, J.J.; Waring, R.H. A generalised model of forest productivity using simplified concepts of radiation-use efficiency, carbon balance and partitioning. For. Ecol. Manag. 1997, 95, 209–228. [Google Scholar] [CrossRef]
  21. Bossel, H. Treedyn3 forest simulation model. Ecol. Model. 1996, 90, 187–227. [Google Scholar] [CrossRef]
  22. Parton, W.J.; Scurlock, J.M.O.; Ojima, D.S.; Gilmanov, T.G.; Scholes, R.J.; Schimel, D.S.; Kirchner, T.; Menaut, J.C.; Seastedt, T.; Garcia Moya, E.; et al. Observations and modeling of biomass and soil organic matter dynamics for the grassland biome worldwide. Glob. Biogeochem. Cycles 1993, 7, 785–809. [Google Scholar] [CrossRef] [Green Version]
  23. Meyer, N.; Welp, G.; Amelung, W. The temperature sensitivity (Q10) of soil respiration: Controlling factors and spatial prediction at regional scale based on environmental soil classes. Glob. Biogeochem. Cycles 2018, 32, 306–323. [Google Scholar] [CrossRef]
  24. Peng, C.; Zhou, X.; Zhao, S.; Wang, X.; Zhu, B.; Piao, S.; Fang, J. Quantifying the response of forest carbon balance to future climate change in Northeastern China: Model validation and prediction. Glob. Planet. Chang. 2009, 66, 179–194. [Google Scholar] [CrossRef]
  25. Xia, J.; Chen, Y.; Liang, S.; Liu, D.; Yuan, W. Global simulations of carbon allocation coefficients for deciduous vegetation types. Tellus B 2015, 67, 28016. [Google Scholar] [CrossRef] [Green Version]
  26. Malhi, Y.; Doughty, C.; Galbraith, D. The allocation of ecosystem net primary productivity in tropical forests. Philos. Trans. R. Soc. B Biol. Sci. 2011, 366, 3225–3245. [Google Scholar] [CrossRef] [PubMed] [Green Version]
  27. Xia, J.; Yuan, W.; Wang, Y.-P.; Zhang, Q. Adaptive carbon allocation by plants enhances the terrestrial carbon sink. Sci. Rep. 2017, 7, 3341. [Google Scholar] [CrossRef] [PubMed] [Green Version]
  28. Zhang, W.; Yang, B.; Dong, K.; Zhang, Y.; Peng, S.; Ruan, H.; Zheng, A.; Cao, G. Effect of soil fauna on organic nitrogen mineralization under different land use patterns in a coastal area of northern Jiangsu Province, China. J. Nanjing For. Univ. 2016, 40, 1–9. [Google Scholar]
  29. Xu, W.; Zhang, Y.; Wang, G.; Ruan, H. Response of carbon metabolism by soil microbes to different fertilization regimes in a poplar plantation in coastal area of northern Jiangsu, China. Chin. J. Ecol. 2015, 34, 1791–1797, (In Chinese with English abstract). [Google Scholar]
  30. Xie, T.; Zhang, A.; Wang, G.; Ruan, H.; Xu, Y.; Xu, C.; Ge, Z. Seasonal variation patterns of soil labile organic carbon in poplar plantations with different ages in northern Jiangsu. Chin. J. Ecol. 2012, 31, 1171–1178. [Google Scholar]
  31. Guo, J.; Wang, B.; Wang, G.B.; Myo, S.T.Z.; Cao, F.L. Effects of three cropland afforestation practices on the vertical distribution of soil organic carbon pools and nutrients in eastern China. Glob. Ecol. Conserv. 2020, 22, e009913. [Google Scholar] [CrossRef]
  32. Xue, L.; Jacobs, D.F.; Zeng, S.; Yang, Z.; Guo, S.; Liu, B. Relationship between above-ground biomass allocation and stand density index in Populus x euramericana stands. Forestry 2012, 85, 611–619. [Google Scholar] [CrossRef] [Green Version]
  33. Ge, X.; Tian, Y.; Tang, L. Nutrient distribution indicated whole-tree harvesting as a possible factor restricting the sustainable productivity of a poplar plantation system in China. PLoS ONE 2015, 10, e0125303. [Google Scholar] [CrossRef] [PubMed]
  34. Zhang, Y.; Tian, Y.; Ding, S.; Lv, Y.; Samjhana, W.; Fang, S. Growth, carbon storage, and optimal rotation in poplar plantations: A case study on clone and planting spacing effects. Forests 2020, 11, 842. [Google Scholar] [CrossRef]
  35. Ai, P.; Hu, H.; Lu, X.; Yang, J.; Zhao, Y.; Wang, L.; Wang, D. Soil characteristics of shelter forests in Lianyungang coastal sandy land. J. Northeast. For. Univ. 2012, 40, 65–69, (In Chinese with English abstract). [Google Scholar] [CrossRef]
  36. Zhang, J.; Ge, Y.; Chang, J.; Jiang, B.; Jiang, H.; Peng, C.H.; Zhu, J.R.; Yuan, W.G.; Qi, L.Z.; Yu, S.Q. Carbon storage by ecological service forests in Zhejiang Province, subtropical China. For. Ecol. Manag. 2007, 245, 64–75. [Google Scholar] [CrossRef]
  37. Zhang, J.; Chu, Z.; Ge, Y.; Zhou, X.; Jiang, H.; Chang, J.; Peng, C.; Zheng, J.; Jiang, B.; Zhu, J.; et al. TRIPLEX model testing and application for predicting forest growth and biomass production in the subtropical forest zone of China’s Zhejiang Province. Ecol. Model. 2008, 219, 264–275. [Google Scholar] [CrossRef]
  38. Zhao, M.; Xiang, W.; Deng, X.; Tian, D.; Huang, Z.; Zhou, X.; Yu, G.; He, H.; Peng, C. Application of TRIPLEX model for predicting Cunninghamia lanceolata and Pinus massoniana forest stand production in Hunan Province, southern China. Ecol. Model. 2013, 250, 58–71. [Google Scholar] [CrossRef]
  39. Zhang, X.; Zang, R.; Li, C. Population differences in physiological and morphological adaptations of Populus davidiana seedlings in response to progressive drought stress. Plant Sci. 2004, 166, 791–797. [Google Scholar] [CrossRef]
  40. Zhou, X.L.; Peng, C.H.; Dang, Q.L.; Chen, J.X.; Parton, S. Predicting forest growth and yield in northeastern Ontario using the process-based model of TRIPLEX1.0. Can. J. For. Res. 2005, 35, 2268–2280. [Google Scholar] [CrossRef] [Green Version]
  41. Wang, W.; Peng, C.; Kneeshaw, D.D.; Larocque, G.R.; Song, X.; Zhou, X. Quantifying the effects of climate change and harvesting on carbon dynamics of boreal aspen and jack pine forests using the TRIPLEX-Management model. For. Ecol. Manag. 2012, 281, 152–162. [Google Scholar] [CrossRef]
  42. Luo, Y.; Su, B.; Currie, W.S.; Dukes, J.S.; Finzi, A.C.; Hartwig, U.; Hungate, B.; McMurtrie, R.E.; Oren, R.; Parton, W.J.; et al. Progressive nitrogen limitation of ecosystem responses to rising atmospheric carbon dioxide. Bioscience 2004, 54, 731–739. [Google Scholar] [CrossRef] [Green Version]
  43. Makela, A.; Valentine, H.T.; Helmisaari, H.S. Optimal co-allocation of carbon and nitrogen in a forest stand at steady state. New Phytol. 2008, 180, 114–123. [Google Scholar] [CrossRef] [PubMed] [Green Version]
  44. Friedlingstein, P.; Joel, G.; Field, C.B.; Fung, I.Y. Toward an allocation scheme for global terrestrial carbon models. Glob. Chang. Biol. 1999, 5, 755–770. [Google Scholar] [CrossRef]
  45. Ise, T.; Litton, C.M.; Giardina, C.P.; Ito, A. Comparison of modeling approaches for carbon partitioning: Impact on estimates of global net primary production and equilibrium biomass of woody vegetation from MODIS GPP. J. Geophys. Res. Biogeosci. 2010, 115, 11. [Google Scholar] [CrossRef]
  46. Liu, X.; Wang, Y.; Xu, B.; Zhang, Q. Effects on growth factors and wood physical and mechanical properties of populus × xiaohei in different planting densities. J. Anhui Agric. Univ. 2007, 34, 226–231. [Google Scholar]
  47. Wang, Y.; Wu, Q. Study on density configuration of poplar afforestation in Barren Site. Beijing Agric. 2013, 6, 69–70, (In Chinese with English Abstract). [Google Scholar]
  48. Zhang, Q.; Zhi, E.; Gu, X.; Li, X.; Wang, H. Effects of afforestation density on poplar growth. J. Hebei For. Sci. Technol. 2010, 5, 1–3, (In Chinese with English Abstract). [Google Scholar]
  49. Mäkinen, H.; Isomäki, A. Thinning intensity and long-term changes in increment and stem form of Scots pine trees. For. Ecol. Manage. 2004, 203, 21–34. [Google Scholar] [CrossRef]
  50. Xue, L.; Pan, L.; Zhang, R.; Xu, P.-b. Density effects on the growth of self-thinning Eucalyptus urophylla stands. Trees 2011, 25, 1021–1031. [Google Scholar] [CrossRef]
  51. Wu, M.; Wu, L.; Tang, Y.; Xu, S.; Peng, L.; Huang, F. Effects of density on growth of poplar and its quantitative maturity research. Hunan For. Acad. 2010, 37, 36–39, (In Chinese with English Abstract). [Google Scholar]
  52. Alatan, H. The effect of different planting density to growth of poplar plantation in Horqin Sand Land. For. Sci. Technol. 2015, 40, 34–37. [Google Scholar]
  53. Allen, C.D.; Macalady, A.K.; Chenchouni, H.; Bachelet, D.; McDowell, N.; Vennetier, M.; Kitzberger, T.; Rigling, A.; Breshears, D.D.; Hogg, E.H.; et al. A global overview of drought and heat-induced tree mortality reveals emerging climate change risks for forests. For. Ecol. Manag. 2010, 259, 660–684. [Google Scholar] [CrossRef] [Green Version]
Figure 1. Comparisons between simulations for the original model (a,b) and modified model (c,d), and the observed diameter at breast height (DBH, cm) and tree height (m), respectively, for 10 poplar stands with different densities in northern Jiangsu Province. The solid line represents the fitting line and the diagonal line represents the 1:1 line.
Forests 13 01212 g001
Figure 2. Comparisons between simulations for the original model (a) and modified model (b), and the estimated aboveground biomass (t ha−1), respectively, for 10 poplar stands with different stand densities in northern Jiangsu Province. The solid line represents the fitting line, and the diagonal line represents the 1:1 line.
Forests 13 01212 g002
Figure 3. Changes in the annual carbon allocation ratios to the stem (a), foliage (b), and fine root (c) with age under different stand densities (200, 400, 800, 1000, and 1200 stems ha−1) using the modified model.
Forests 13 01212 g003
Figure 4. Simulated seasonal dynamics of the carbon allocation ratio to stems (a,b), foliage (c,d), and fine roots (e,f) for the 6-year-old (a,c,e) and 13-year-old (b,d,f) stands with different densities (200 vs. 1200 stems ha−1) using the modified model.
Forests 13 01212 g004aForests 13 01212 g004b
Table 1. Stand, climate, and soil characteristics of the sampling sites in northern Jiangsu Province.
SiteLocationPlanting YearMATMAPSoil TypeSoil TextureAgeSDDBHHReference
Dongtai1120°49′ E, 33°05′ N200614.61069Desalted meadow Sandy loam933323.2321.28[28]
Dongtai2120°49′ E, 33°05′ N200614.61069Desalted meadowSandy loam766716.2118.08[29]
Dongtai3120°49′ E, 33°05′ N199614.61069Desalted meadowSandy loam1533333.227.3[30]
Dongtai4120°49′ E, 33°05′ N200614.61069Desalted meadowSandy loam1060720.8518.91[31]
Dongtai5120°49′ E, 33°05′ N200614.61069Desalted meadowSandy loam1031227.8220.63[31]
Suining1118°04′ E, 33°53′ N1998161300Alluvial sandy Sandy loam920431.225.9[32]
Suining2118°04′ E, 33°53′ N1998161300Alluvial sandySandy loam927830.526.4[32]
Suining3118°04′ E, 33°53′ N1998161300Alluvial sandySandy loam940024.826.2[32]
Suining4118°04′ E, 33°53′ N1998161300Alluvial sandySandy loam962520.425[32]
Zhoushan 119°40′ E, 32°20′ N200214.51000Lacustrine sedimentsClay texture10111119.818.2[33]
Sihong1118°36′ E, 33°28′ N200714.4972.5Deposited soilSandy black 1340021.7524.48[34]
Sihong2118°36′ E, 33°28′ N200714.4972.5Deposited soilSandy black 1327824.7925.62[34]
Ganyu119°07′ E, 34°50′ N200213.2976.4Tibba sandySandy loam8111111.9612.6[35]
MAT: mean annual temperature (°C); MAP: mean annual precipitation (mm); SD: stand density (stems ha−1); DBH: diameter at breast height (cm); H: tree height (m).
Table 2. Parameters used within the model simulations.
ParameterDescriptionNote
Absorb = 0.15Atmospheric absorption factor[37]
Cloud = 0.45Time fraction of cloudy daysThis study
PAR factor = 0.65Solar radiation fractionThis study
BlCond = 0.12Canopy boundary layer conductance (mL m−2 s−1)This study
MaxCond = 0.26Max. canopy conductance (mL m−2 s−1)This study
StomCond = 0.012Stomata conductance (mL m−2 s−1)This study
ExtCoef = 0.46Radiation extinction coefficient[38]
TaMin = 7Min. temperature for growth (°C)This study
TaMax = 40Max. temperature for growth (°C)This study
Topt = 25Optimum temperature for growth (°C)This study
N factor = 0.2N factor for tree growth[38]
Na = 3Effects of age on GPP[38]
Sla = 13Specific leaf area (m2 kg−1)[39]
GamaF = 1Leaf turnover per yearThis study
GamaR = 0.21Fine root turnover per yearThis study
Lnr = 26Lignin–N ratio[38]
Ls = 0.215, 0.215, 0.2351, 0.255, 0.255Lignin in leaf, fine root, coarse root, branch, and wood[38]
A1, A2, A3 = 15, 45, 125Soil water depth of layer 1, 2, and 3 (cm)[38]
AWL1, 2, 3 = 0.5, 0.3, 0.2Relative root density for layer 1, 2, and 3[38]
KF = 0.5Fraction of H2O flow to stream[40]
KD = 0.5Fraction of H2O flow to deep storage[40]
KX = 0.3Fraction of deep storage water to stream[40]
AWater = 250Max. soil water (mm)[40]
MiuNorm = 0Normal mortalityThis study
CSP = 0.26Wood C density (t C m−3)This study
CD = 20Crown to stem diameter ratioThis study
AlphaC = 0.08Canopy quantum efficiencyThis study
MaxHeight = 30Max. height (m)This study
AgeMax = 100Max. stand age (year)This study
Table 3. Performance of the original and modified TRIPLEX-Management model.
VariableMAENRMSEd
Original model
Mean DBH (cm)24.80.30.6
Mean height (m)24.40.40.7
Aboveground biomass (t ha−1)60.50.60.5
Modified model
Mean DBH (cm)18.70.20.7
Mean height (m)15.40.20.8
Aboveground biomass (t ha−1)26.60.30.8
MAE is the mean absolute error, NRMSE is the normalized root mean square error, and d is the refined Willmott index.
Table 4. Simulated effects of the planting density on the stand characteristics at a stand age of 20 years old using the modified model.
PoplarDensity (Stems ha−1)
20040060080010001200
Site 9 (Age = 20 years)
D ¯ 31.726.62422.72221.5
H ¯ 26.925.323.622.722.321.9
AGB246.9261.2252.9231.9221.9217.1
SC124.5124.7124.8126.4127.3127.5
D ¯ is the mean diameter at breast height (cm), H ¯ is the mean tree height (m), AGB is the aboveground biomass (t ha−1), and SC is soil carbon (t C ha−1).
Publisher’s Note: MDPI stays neutral with regard to jurisdictional claims in published maps and institutional affiliations.

