Abstract
We studied the genetic differentiation, structure, and diversity of Scots pine populations in Lithuania based on nuclear, chloroplast microsatellite, and mitochondrial DNA markers. We focused on revealing evolutionary history, country-wide geneflow patterns, and structuring among the Scots pine populations. We genotyped 439 Scots pine individuals of mature age from 23 natural Scots pine stands in Lithuania and used the AMOVA and a set of genetic-clustering methods. The among-population differentiation was weak for nuclear microsatellite loci (nSSRs) (FST = 0.005) but much stronger for cpSSRs (PhiST = 0.240). The populations were structured into highland and lowland populations based on cpSSRs and eastern highland versus the rest for nSSRs. We detected two mtDNA mitotypes—the universal type A and northeastern type B, and the latter occurred at a markedly higher frequency in eastern Lithuania. Within-population genetic diversity was higher in large pine-dominated forest tracts in the eastern highlands than in fragmented forests in the western highlands. We concluded that phenology-based genetic networks following the temperature climate gradients have a strong effect on shaping the genetic structure of otherwise rather homogeneous gene pools of Scots pine populations in Lithuania. The possible effects of human interference with forests on genetic diversity of Scots pine populations in Lithuania are discussed.
Keywords:
SSR; microsatellites; geographic variation; gene conservation; Baltic region; geneflow; phenology 1. Introduction
Being the most widespread forest tree species in Eurasia, Scots pine is not currently in the first ranks of endangered species due to global warming threats [1,2]. However, Scots pine, as a species with large population sizes that is tolerant to a wide range of ecological niches, plays an important economic and ecological role in European forest ecosystems [2,3,4,5]. Genomic understanding of its genetic mode of evolution, stress tolerance, and structuring of genetic diversity is very important for sustainable species use and development [6]. Scots pine exhibits high genetic variation in quantitative, qualitative, and adaptive traits such as phenology and frost hardiness [7,8,9,10]. However, so far, few genomic signatures were found to be associated with this vast phenotypic variation, even in range-wide genotyping studies [6,11]. Another approach to investigate the genetic structuring relies on the shared gene pool presumption. Namely, stronger intermating populations are likely to be more similar to each other than those with a weaker genetic exchange. Consequently, neutral DNA markers could be helpful in revealing geneflow patterns among populations, which indirectly may reflect whole-genome structuring (compare the associations among neutral and functional SNPs in Ulaszewski [12]). There also is a fundamental interest to reveal phenology-driven genetic clusters and the geneflow patterns in wind-pollinated conifers such as Scots pine [13,14].
In the last two decades, neutral DNA markers such as microsatellites (SSRs) have been widely used in genetic studies, with applications in numerous areas, including population and conservation genetics, landscape genetics, maternity and paternity analysis, and forest reproductive material (FRM) traceability [15,16,17,18,19]. Microsatellites (nuclear SSR markers) are co-dominant, multi-allelic, and highly reproducible and have high resolution and enable us to infer the genotypes of seeds, seedlings, single adult trees, and populations [19,20,21]. Another advantage of microsatellites is exploiting the polymorphism in the organelle genomes, which are haploid, uniparentally inherited, and non-recombinant and show a lower mutation rate than the nuclear DNA; thus, they are perfect indicators of historical bottlenecks, founder effects, genetic drift, and other evolutionarily events [22,23,24,25,26,27]. In coniferous trees, mitochondrial DNA is maternally inherited and spreads via the seed. This allows exploring the history and recolonization roots from possible refugee areas after the last glaciation [28,29,30,31,32,33,34,35]. Earlier studies based on the mitochondrial DNA markers in northeastern Europe identified representatives of several glacial refugia of Scots pine [33,35,36]. The type A mitotype was believed to originate from multiple southern refugia in the Balkans and Italy, while the type B mitotype originated from a more concentrated refugium somewhere in present-day eastern Ukraine [34]. The frequency of the type B mitotype is high along the pathway from eastern Ukraine toward Finland, passing eastern Lithuania [37]. It would be interesting to assess how these mitotypes are distributed over an area along their post-glacial-migration route. If a geographical structuring of the mitotypes is still preserved, then the long-term post-glacial-migration odyssey of Scots pine still has not been ended. In contrast to mitochondrial DNA, chloroplast (cpDNA) markers are paternally inherited are suitable for studying geneflow patterns [38,39]. Moreover, cpDNA markers are more polymorphic than mtDNA but show a lower mutation rate than nuclear DNA, so they are powerful tools for Scots pine population differentiation and evolution studies [40,41,42,43].
In brief, the present-day genomic competence for Scots pine revealed that despite of its vast distribution range and diverse local adaptation, among-population differentiation is very low (in most cases insignificant), while within-population diversity is high [11,44,45,46,47]. This result is true despite the presence of strong temperature and photoperiodic gradients in the ranges studied [6]. Evidently, Scots pine is a peculiar species for mapping relevant genetic markers, because of the strong geneflow homogenizing the population structures in the pool of its 22Gbp genome, large population sizes, and comparably shorter genomic linkage groups [11,45]. Therefore, revealing the genetic structures with relatively cheaper and less complex markers such as SSRs may help the genome-wide genic genotyping by dissecting the genetic variation into zones of shared gene pools and different evolutionary backgrounds [11].
The range-wide common garden tests with Scots pine provenances revealed a strong clinal variation in the adaptive trials, such as phenology and frost hardiness, along the temperature and photoperiodic gradients [9,48,49,50]. Here, it is important to differentiate between the geographical temperature gradients affecting all the phenology traits (longitude, latitude, and altitude) and the photoperiodic gradient affecting the cessation of active growth only (latitude) [51]. On the other hand, phenotyping of natural stands of Scots pine revealed large within-population variation in adaptive traits, explained by the strong outcrossing capacity of Scots pine [52]. These studies established the clinally overlapping population-structure model for Scots pine. The common garden-based studies showed that Scots pine trees possess tight genetic correlations not only among the phenology traits within the annual cycle, but also between a set of morphometric traits indirectly associated with phenology—wood yield, latewood proportion, branch thickness, angle-crown shape, needle-stomata density, and more [10,48,52]. Another set of studies focused on the reproductive biology of Scots pine, as one of the main forest tree species requiring reliable seed supply for forestry [53]. These studies reported 2-to-5-day sexual asymmetry in Scots pine seed orchard clones, high outcrossing rates, and long-distance pollen dispersal capability in Scots pine [54,55,56,57]. Several studies, especially in eastern Europe, reported vast and seemingly neutral variation in cone and seed morphology of Scots pine (reviewed by Sirgėdienė [58]).
Scots pine forests have been intensively used and altered by forest management in Europe due to increasing logging, selection for cultivation, untraceable seed trade, air pollution, new pests, diseases, and climate and environmental change [3,59,60,61,62,63,64,65,66,67]. The seed of Scots pine has been traded and planted across Europe for a long time [65,68]. Knowledge of the variation and diversity of Scots pine mitochondrial, chloroplast, and nuclear DNA could provide us important and practically applicable information about country, region, and other levels, for the traceability and certification of forest reproductive material and the identification of plant populations for conservation [69]. The genetic fingerprints of European Scots pine genetic reserves could serve as a reference database for establishment of an FRM traceability system based on DNA markers.
Lithuania lies at the center of the vast natural range of Scots pine at the eastern shores of the Baltic Sea in central Europe. Based on Metzger et al. [70], the transient temperate to boreal forests of Lithuania are within the nemoral pedo-climatic zone common in southern Scandinavia and Belarus. The woodedness of Lithuania is 33.7%. Scots pine is a dominant forest tree species in Lithuania, dominating in 34.5% of forest stands, followed by Norway spruce (21.1%, Lithuanian State Forest Service yearbook [71]). In Lithuania, Scots pine dominates in large forest tracts on the poor, dry, sandy sites, especially in the eastern highlands. It also grows all over the country on richer soils in scattered forest tracts, often mixed with Norway spruce and occasionally with birch. Most of the Scots pine forests in Lithuania are of natural origin, with a low likelihood of artificial establishment, especially in large forest tracts on poor sandy soils in the eastern highlands. The genetic studies focusing on Scots in Lithuania began with phenotyping the natural stands in various forest types, by focusing on the tree height and crown properties of local pines [72]. These studies reported high variation in wood yield and height to living branch among the Scots pine stands within a single forest type, attributing these differences as due to the genetic properties. Later, the progeny tests were followed, where large genetic variation in wood yield, stem branching, crown width, and onset of active growth among the Lithuanian Scots pine clones and populations was reported [72]. In the 1970s, four large field tests as series of the Soviet Union wide networks of Scots pine provenance tests were established in Lithuania. The provenances originated from all over the former Soviet Union, including origins from as far as the Amur region near Japan. These tests showed that (a) provenances moved over large distances from cold continental Siberian climate had low survival and poor wood yield and vitality; (b) northwestward transfer provenances had high wood yield, but curvy stems, thick branches, and large crowns; (c) origins moved for several degrees southward were most superior in stem quality and thin and sparse branches and were not markedly inferior in wood yield to the local populations [72]. Ramanauskas et al. [73] reported a two-week flowering asynchrony between the pollen-shedding peaks in natural stands of Scots pine in western and northeastern Lithuania. In the latter study, the periods of mass pollen shedding were of 3 to 5 days within a stand, but the duration stretched over a three-week period, allowing some overlapping among the tree locations studied [72]. These results indicate a possibility for a non-random mating among the Scots pine gene pools within Lithuania, which could be tested with microsatellite markers.
Considering the points raised above, we address the problem of detecting the genetic structure and geographical variation of genetic diversity among natural Scots pine populations in Lithuania by using DNA markers. Our idea is focusing on country-wide tendencies rather than local-scale adaption such as site type. The objectives of our study were to assess genetic diversity and structure of Lithuanian Scots pine populations based in mitochondrial, chloroplast, and nuclear DNA markers.
2. Materials and Methods
2.1. Study Sites and Sampling
We sampled needles for DNA extraction from 456 overstory Scots pine trees in 23 mature stands (populations) of natural origin, most of which are set aside of commercial management as genetic reserves in Lithuania (Figure 1 and Figure 2). The PCR quality allowed to analyze 439 trees from 22 populations at nuclear SSR loci and 426 trees from 23 populations at the organelle loci. Population sample size varied from 17 to 22. The sampled stands were in large Scots pine dominated forest tracts, most 80–100 years old of strictly natural origin, with no records of artificial establishment (the oldest Scots pine stands were PUNI (150–200 years), KURT (100–120), DRUS (102–150), and JUOD (150–200)). The sampled stands were Scots pine dominated with over 70%, often admixed with Norway spruce, except for the southeastern-highland forest natural region (FNR) no. 6, where Scots pine dominates in the overstory with over 90% in the poorest sandy soils. Most of the stands are on normally irrigated sites on poor to medium rich sandy soils (Figures S1 and S2). The needles for DNA extraction were sampled by shooting with a hunting rifle from ca. 20 trees per stand, by selecting the trees randomly at least 20 m apart from each other following a zigzag sampling path within a 2–4 ha core of a pine-dominated stand. The sampled stands represent six forest eco-climatic regions of Lithuania (forest natural regions, FNR based on Karazija [74], Figure 1, Figure S1 and Table S1):
FNR 1, the western highlands, common altitude of 150–200 m a. s. l., the dominant forest tree species are Norway spruce, Scots pine, and birch; medium-rich albeluvisols prevail, it has the highest annual precipitation amount in the country (Table S1, moist sea air mass formations blown eastwards cool dawn and precipitate rapidity while elevating from sea level up to 150–200 m in the western highlands), and forest tracts are smaller spruce dominated, fragmented by agriculture with occasional scattered interruptions of Scots pine on poor sites.
FNR 2, the northern part of midland lowland, common altitude of 50–70 m a. s. l., dominant forest tree species are Norway spruce, birch, and Scots pine, the latter mainly in two medium-sized pine-dominated forest tracts of Zalioji giria (pop. 6 PANE) and Simoniu silas (pop. 5 MIKE), where rich cambisols prevail.
FNR 3, the northeastern highlands, the coolest region in the country (the lowest winter temperature minimal and the lowest mean winter temperatures), common altitude of 150–200 m a. s. l., dry and poor abeluvisols, dominant species—Scots pine, Norway spruce, and birch in large continuous along entire FNR 3 pine dominated forest tracts (Azvintis is the core of the tracts (pop. 11 AZVI) near Utena).
FNR 4, the seaside lowlands with the mildest winters and the highest average wind speed, common altitude of 10–50 m a. s. l., the dominant tree species are Scots pine, Norway spruce, and birch, and the forest tracts are smaller and fragmented.
FNR 5, the southern part of the midland lowlands, is the least-forested region, in the richest soils in the country (cleared for agriculture already 18–19th centuries), except three pine-dominated medium-sized forest tracts of Kalzu Ruda (pop. 17 BRAZ), Prienai (pop. 18 PUNI) and Dubrava (pop. 16 VAIS), with common altitude of 50–70 m a. s. l.
FNR 6, southeastern highlands, dominated by pure Scots pine stands on sandy soils forming the largest continuous forest tract in the country (pops. 19 ANCI and pop. VEIS 20), with common altitude of 150–220 m a. s. l.
2.2. DNA Analysis
DNA was extracted from Scots pine needles according to adjusted ATMAB DNA extraction model [41]. For Scots pine DNA analysis, we used 12 nuclear, 3 chloroplast microsatellite loci, and one mitochondrial DNA marker (nSSR: psyl2; psyl16; psyl18; psyl25; psyl42; psyl44; psyl57 [75]; SPAC7.14; SPAC11.4; SPAC12.5 [76]; PtTX4001; PtTX4011 [77]; cpSSR: pt15169, pt30204, pt71963 [42]; mtDNA marker: NAD7-1 [34].
The nuclear microsatellite loci (nSSR) were amplified and analyzed as described in Danusevičius et al. [66]. The three chloroplast microsatellites (cpSSR) were amplified in single multiplex PCR reaction in a total volume of 15 µL, containing 5 µL H2O RNase free water, 7.5 µL Qiagen Multiplex PCR Master Mix 2×, 1.5 µL 10× Primer mix, and 1 µL of DNA. We used ABI thermal cycler (from GeneAmp® PCR System 9700, Applied Biosystems, Foster City, CA, USA), with the following PCR program: initial denaturation at 95 °C for 5 min, followed by 20 cycles of 1 min at 94 °C, 45 s at 55 °C, 1 min at 72 °C, and a final extension step of 8 min at 72 °C. Detailed information on the nSSR and cpSSR loci used in our study is presented in Supplementary Material Table S2.
For the mitochondrial DNA (mtDNA) Nad7-1 locus, we made an adjustment to avoid the restriction step in the laboratory analyses described by Naydenov et al. [34]. We have used the GeneBank deposited sequences of the Naydenov et al. [34] mtDNA Nad7-1 haplotypes (DQ665913 to DQ665915) to design the primers flanking the 5 bp deletion and 32 bp deletion, so that the PCR products would result in the following three segments fragments [34]: 300 bp (the universal A haplotype), 295 bp (the northern B haplotype), and 268 bp (the C haplotype found in Turkish populations only) to be resolved in on a DNA analyzer. The primers were designed with the BLAST primer designing tool: the forward primer sequence is 5′-6FAM-ATACCGTCTGGCGAAAACGCCG-3′ (6FAM dye to be resolved in the Applied Biosystems sequencer); and the reverse primer sequence was 5′-GGCCTCTCCATTTCCAATGACCCG-3′ (no dye) (Table S2). PCR reaction for the mtDNA locus was performed with ABI PCR thermocycler. We carried out the PCR reaction in a total volume of 15 µL, containing 5 µL H2O RNase free water, 7.5 µL Qiagen Multiplex PCR Master Mix 2×, 1 µL 10× Primer, and 1 µL of DNA. We used ABI thermal cycler, with the following program: initial denaturation at 95 °C for 12 min, followed by 10 cycles of 30 s at 94 °C, 45 s at 60 °C, and 60 s at 72 °C, then 20 cycles of 30 s at 94 °C, 45 s at 55 °C, 60 s at 72 °C, and final extension step of 10 min at 72 °C. The capillary electrophoresis of all DNA loci was carried out with a genetic analyzer ABI PRISMTM 310 Genetic Analyzer (Applied Biosystems, Foster City, CA, USA); with standard GeneScan500 LIZ (Applied Biosystems), allele sizing was performed on a binset by using the program GeneMapper (Applied Biosystems version 4.0, Foster City, CA, USA).
2.3. Molecular Data Analysis
Null alleles, stuttering, and large allele dropout were assessed for each locus with MICROCHECKER software ver. 2.2.3. [78]. The genetic diversity parameters were calculated using GenAlEx 6.5 [79,80]. Polymorphisms of cpSSRs were scored and used to define chloroplast haplotypes according to different combinations of length variants. Observed number of haplotypes (Nh,a), number of private haplotypes (Nh,p), unbiased effective number of haplotypes (Nh,e), and unbiased haplotype diversity (uH) [81] as well as the mean genetic distance among individual haplotypes following a stepwise mutation model (SMM) approach (Dsh 2), as described in Vendramin et al. [82], were calculated using Haplotype Analysis version 1.05 [83]. The AMOVA was performed with GenAlEx 6.5 software [79,80] (for significance test we used 9999 random permutations). Allelic richness (Ar) was estimated with Fstat 2.9.3. software [84].
The population structure was estimated by using several approaches:
- (a)
- The UPGMA clustering based on Nei’s genetic distance [85] with 10,000 bootstrap replicates (POPTREE2 software [86]).
- (b)
- The Bayesian clustering approach as the model-based clustering algorithm implemented in STRUCTURE 2.3.3 software [87] and the empirical statistic DeltaK [88] implemented in STRUCTURE HARVESTER [89] to determine the number of clusters/distinct populations (K), from which samples have been drawn based on microsatellite genotypes at multiple loci. STRUCTURE parameters were: the burn-in period of 100,000, 100,000 replications, 20 runs for each the clusters, and with the LOCPRIOR function, allele frequencies were assumed to be correlated, while no admixture model was assumed. The most likely number of clusters (1 to 3) was estimated by submitting the STRUCTURE output to the STRUCTURE HARVESTER [89].
- (c)
- The software BARRIER 2.2 [90] used the Monmonier’s algorithm applied on a Delanaunay triangulation to identify the barriers along which a significant change in the population allele frequency occurs within the investigated geographical range. The statistical confidence of the predicted barriers was tested by bootstrapping over individuals and submitting the 1000 bootstrapped matrices of Goldstein’s pairwise genetic distances (dm2) calculated with the MSA software.
- (d)
- Finally, we used the ALLELES IN SPACE (AiS) software ver. 1.0 [91] to obtain a surface plot of the interpolated Nei et al.’s [92] genetic distances among studies Scots pine populations in Lithuania.
The effective population size (Neff) was calculated for each population and region based on maximum likelihood method (Hastings-Metropolis Markov Chain Monte Carlo algorithm) and coalescent theory using MIGRATE_N software [93]. The program returns the theta (ϴ) value, which was used to calculate the effective population size Neff = 4ϴ/×10−3, where 10−3 is assumed mean microsatellite mutation rate per locus and generation. We also use MIGRATE_N to calculate the number of inward and outward migrants per generation between the FNRs, to obtain an estimate of Scots pine geneflow pattern in Lithuania.
3. Results
3.1. Characteristics of the Microsatellite Loci
No evidence of scoring errors due to stuttering or large allele dropout were found at any of the nuclear microsatellite loci. The null allele frequency for all the loci varied within the range of 0 to 0.1, except for the locus Psyl44, with a null allele frequency of 0.15 (Table 1). Psyl44 was basically fixed at a single allele (Table S1). The total allele number amplified by the 12 loci was 181, from which 132 were rare alleles occurring below the frequency of <0.05. The number of alleles per locus varied from 6 (at locus Psyl42 and Psyl44) to 36 (at locus Spac7.14). The EST-SSR Psyl series loci were the least polymorphic with the lowest expected and observed heterozygosity and allele diversity indexes. The lowest uHe index was obtained for the EST-SSR loci Pyl25, Psyl18, and Psyl44, indicating prevalence of several dominant alleles at these loci. Seven loci were highly polymorphic, with the uHe values exceeding 0.65. Whereas, the Spac series loci amplified from 19 to 36 alleles with the uHe values ranging between 0.87–0.95 (Table 1 and Table S1). Especially helpful for the among-population discrimination were the EST loci Psyl2 and Psyl44, with significant Dest differentiation indexes among the populations (Table 1).

Table 1.
The genetic diversity indexes for each locus. p-value Dest is the significance of the Dest values for differentiation among the populations. Sample size 439 trees (nSSRs) and 426 tees cpSSRs. Null allele freq. is the allele frequency by Van Oosterhout et al. [78] (no large allele dropouts detected). Na—number of alleles; Ho—observed heterozygosity; uHe—unbiased genetic diversity; FIS—inbreeding coefficient.
As the organelle DNA markers, the chloroplast SSR loci were highly polymorphic with 7 to 9 alleles, combining into 113 haplotypes (Table 1). The genetic diversity index for all three cpSSR loci exceeded 0.7 (Table 1). Two of the three cpSSR loci were well-discriminated among the populations (Table 1). At the mtDNA locus, we succeeded to amplify two alleles: the 300 bp allele corresponding to the type A universal mitotype that spread northwards from southern glacial refugia (Balkans and Italy) and the type B allele of 295 bp that represents northeastern refugium located in present-day eastern Ukraine [37].
3.2. Genetic Differentiation and Structure
3.2.1. nSSR Loci
The nSSR-based locus-wise Dest differentiation indexes between the populations were significant for 2 out of 12 loci only (Table 1, FST = 0.005 **, Table 2). The differentiation among the regions was even lower and not significant (FST = 0.001 n.s., Table 2). The AMOVA revealed that most of the molecular variation at the nSSR loci was within populations (99.5%), with the remaining 0.5% portion of variation shared by among-region and among-population variance components (Table 2). Based on the pairwise Dest differentiation indexes, the populations in FNR 6 (southeastern highlands) were mostly differentiated from the adjacent FNR 5 (southern part of midland lowlands) and the seaside lowlands in FNR 4, whereas the Dest differentiation indexes between FNR 6 and FNR 3 and 2 were not significant (lower left table in Figure 2).
Table 2.
AMOVA analysis for the nSSR and cpSSR datasets. Phi is the differentiation index based on FST-like genetic distances for haploid data.
The STRUCTURE Bayesian clustering analysis based on the nSSR loci revealed three genetic clusters as the most likely genetic structure of Scots pine populations in Lithuania (the highest delta K value was obtained for the K = 3 structure). The three STRUCTURE genetic clusters were highly shared among the populations (Figure 1). However, there was a weak geographical trend of relatively greater frequency of clusters 2 and, especially, 3 in the eastern part of the country (Figure 1). In a similar fashion, the BARRIER analysis for identifying the barriers along the significant change in the nSSR allele frequencies has split the country into its eastern and the western parts, with the reliability of 67% of the bootstraps (Figure 1). Finally, the landscape-shape interpolation of the Nei’s [85] among-population genetic distances for the nSSR loci clearly separated the populations in the eastern highlands from the populations in the adject midland lowlands (Figure 1, lower-right plot).

Figure 1.
Scots pine population genetic structure in Lithuanian based on nuclear microsatellite (nSSR) markers. The pie charts indicate the location of the Scots pine populations studied as well as the population proportions of the genetic clusters identified by the STRUCTURE Bayesian clustering of the populations based on the nSSR data. The BARRIER-based modeling with Nei’s [85] among-population genetic distances of the two major boundaries (with highest number of bootstraps) for a significant change in the nSSR allele frequencies are shown as solid red lines, with the % out of the 1000 bootstraps returning these barriers shown at the barriers. The dashed lines and large numbers 1 to 6 indicate the six forest natural regions (FNR). The dominant forest tree species is shown at the FNR ids. (pine = Scots pine, spruce = Norway spruce). The lower-right map shows genetic structure as revealed by landscape-shape interpolation of genetic distances among populations (midpoints of edges by Delaunay triangulation, AiS software). The upper-right map shows the main climatic gradient for frost hardiness (averages of the daily indexes over the period of 1981–2011, Galvonaitė et al. [94]). More details on climate in Lithuania in Figure S1 and Table S1.

The coalescence-based analysis of geneflow patterns with the software MIGRATE_N revealed two major gene exchange networks among the Scots pine populations in the country (Figure 2 and Figure S1 for interpreting the forest natural regions, FNR):
- (1)
- The cooler part of the country: the eastern highlands (FNRs 6 and 3) and the northern part of the midland lowlands (FNR 2); a bilateral exchange of similar magnitude between the largest pine-dominated forest tracts in the country in the eastern highlands of FNRs 6 and 3 and strong flow from northeastern highlands (FNR 3) into the adjacent midland lowland (FNR 2).
- (2)
- The milder part of the country, where major flow is directed out of the seaside lowlands (FNR 4) into the southern part of the midland lowlands (FNR 5), with a weaker genetic exchange between the FNRs 4, 5, and 1. The lowlands in FNRs 4 and 2 represent the warmest part of the country (Figure S1).

Figure 2.
Geneflow patters among Scots pine populations in different FNRs for the nSSR data, based on the coalescence algorithm implemented in MIGRATE_N software. In Map 1, the arrows show incoming/outgoing migrant ratios per generation (the red numbers at the arrow basis) and strength (arrow width and color saturation) among the FNR (ratio = number of incoming/outgoing migrants, whereby the ratios close to 1 indicate a balance among out-and-in-going migrants, ratios >1 indicate more incoming migrants than outgoing into the FNR pointed by the arrow, e.g., ratio of 2.1 means there were twice as many incoming than outgoing migrants from FNR 4 to 5). The black numbers at the arrow tips are migrant numbers per generation. Map 2. A simplified gene-flow pattern from map 1 indicates the trends, where the ratios of effective population size of whole FNR over the census number in each FNR are given as well. Map 3. The main Scots pine forest tracts and sample populations are marked by dots (sample size in each FNR at the bottom of map 3). The tables below Map 1 shows the pairwise p-values for the Dest differentiation test among FNR (left) and sample size in each FNR (right).

3.2.2. The Chloroplast SSR Loci
For the cpSSR loci, the among-population differentiation index PhiPT was strong and highly significant (0.24 ***, Table 2). The among-region differentiation was weaker but significant (PhiRT = 0.065 ***, Table 2). The STRUCTURE Bayesian clustering returned a two-cluster structure as the most likely in Lithuania (the DeltaK values for K2, K3, and K4 cluster structures were 2.0, 1.3, and 0.2, respectively). One of the STRUCTURE clusters was clearly dominant in the lowlands (seaside FNR 4 and midland FNRs 2 and 5) and another in the highlands (western FNR 1 and eastern FNRs 3 and 6, Figure 3). In agreement with the Bayesian cluster, the UPGMA clustering of the FNRs grouped the highlands FNRs 1, 3, and 6 and the lowlands FNRs 2, 4, and 5 into two separate clusters, with the bootstrap percentage over 70% (Figure 3 upper right). The landscape shape interpolation of the Nei’s [85] among-population genetic distances for the cpSSR loci distinguished the populations in the southeastern highlands (FNR 6) and the seaside lowlands (FNR 4, Figure 3, lower-right plot). The Dest differentiation indexes among the populations indicate significant differences between the eastern-highland populations (FNRs 3 and 6) and the adjacent west-lowland populations (FNRs 2 and 5). For the populations in the western highlands (FNR 1), a significant Dest differentiation index was obtained with the seaside-lowland populations (FNR 4) but not with the midland-lowland populations (FNR 2 and 5, Figure 3). The BARRIER analysis identified the barrier for a significant shift in allele frequencies between the northeastern highlands (FNR 3) and the northern part of the midland lowlands (FNR 2) and between the western highlands (FNR 1) and the midland lowlands (FNRs 2 and 5, Figure 3). Interestingly, the populations of 12 (JUOD in the sea-side Curonian spit of Neringa) and its immediate neighbor in the mainland population 12 (SVEK) were outstanding compared to the remaining populations in the seaside lowlands for both nuclear and chloroplast SSR markers (the landscape-shape interpolation plots in Figure 1 and Figure 3).
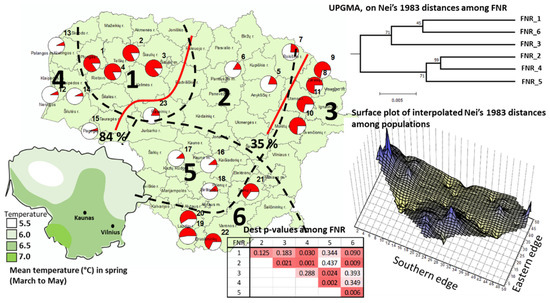
Figure 3.
Population genetic structure based on STRUCTURE2.3.3 software Bayesian clustering and BARRIER boundaries of significant change in the allele frequency for the three cpSSR pt series loci. The pie charts show the relative proportions of the two STRUCTURE genetic clusters. The red solid lines indicate significant change in allele frequency modeled with Nei et al.’s [92] genetic distances among populations for two boundaries with the BARRIER software. The percentage of 1000 bootstraps returning these barriers is given at the BARRIER. The table below the main map shows the p-values of the pairwise differentiation indexes among the six forest natural regions (FNR, shown in large numbers on the main map). The lower-right map shows genetic structure as revealed by landscape shape interpolation of genetic distances among populations for the cpSSR loci (midpoints of edges by Delaunay triangulation, AiS software). The lower-left map shows the geographical variation in climatic index for spring phenology affecting the distribution of paternally inherited cpSSR haplotypes: mean daily air temperature during spring season (average for 1981–2011).
3.2.3. The Mitochondrial DNA Locus
Out of the total of 456 individuals in 23 populations, 176 individuals (39%) contained the B mitotype (the northern refugium in eastern Ukraine), and 280 (61%) contained the A mitotype (universal from the southern refugia, Figure 4, Table S3.). The proportion of the type B mitotype varied from 0% (pop. 23, central Lithuania) to 90% (pop. 11, northeastern Lithuania, Figure 4). Both the mitotypes were detected in the whole territory of the country. However, the type B mitotype occurred at a markedly higher frequency in the eastern Lithuanian populations (especially high in the northeastern highlands) and gradually decreased westwards (Figure 4).
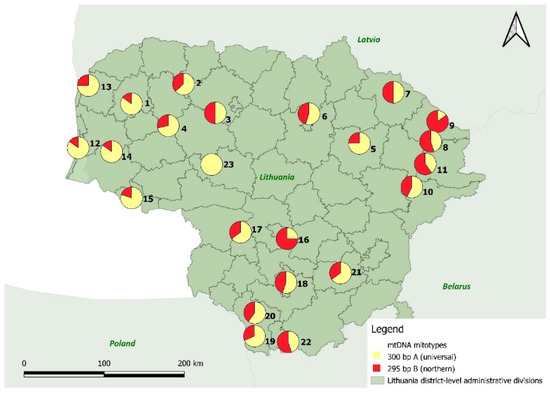
Figure 4.
Geographical distribution of the mtDNA haplotypes (mitotypes) in natural Scots pine populations within Lithuania. The colors red and yellow correspond to the mitotypes A (universal, yellow) and B (northern, red). The size of the pie charts is proportional to the relative frequency of mitotypes.
3.3. Within-Population Genetic Diversity
The genetic diversity parameters varied markedly among the Scots pine populations in Lithuania for both nSSR and cpSSR loci (Figure 5, Table 3). For the nSSR loci, seven of nine northwestern Lithuanian populations (FNRs 1 and 4) contained relatively lower observed heterozygosity, indicating stronger mating among relatives (Ho, Figure 5, Table 3). In the remaining regions of Lithuania, the populations with relatively lower Ho values seemed to scatter randomly. The expected heterozygosity (He) was relatively lower in populations from western Lithuania but not in the seaside-lowland populations (Figure 5). Whereas the populations from northeastern highlands possessed the highest He and Ho values for the nSSR loci (Figure 5).
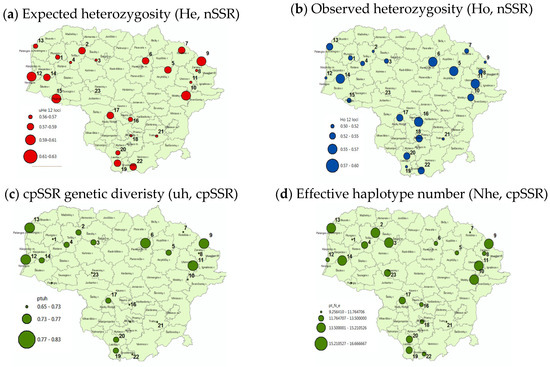
Figure 5.
Geographical distribution of the main within-population genetic-diversity parameters for nuclear SSR (upper (a,b)) and cpSSR (lower (c,d)) loci. The population locations are marked by the cycles scaled by the parameter values. For cpSSR, uh is diversity measure on allelic level corresponding to He for nSSR data; the effective haplotype number is genetic-diversity measure at haplotype corresponding to He for nSSR. Higher genetic diversity of northeastern and northwestern populations is observed for both nuclear and chloroplast DNA loci.
Table 3.
The within-population genetic diversity parameters estimated for 12 nSSR loci and 3 cpSSR loci of the pt series. N is the sample size, Na is allele number, Ar is allelic richness (based on 17 individuals), He and Ho are expected and observed heterozygosity, respectively, and FIS inbreeding coefficient. For cpSSR: Nh—number of different alleles, Nhr—number of rare alleles (freq. < 0.05), uh—unbiased genetic diversity (He for haplotype data), A—number of different haplotypes, Rh—haplotypic richness, Nhe—effective haplotype number, Fpr—frequency of population private haplotypes, FNR—forest natural region where mean and standard error is given.
For the cpSSR loci, we analyzed two indexes based on allele (uh, genetic diversity corresponding to He) and haplotype diversity (Nhe, reflecting number and frequency homogeneity of haplotypes). The allelic diversity (uh) exhibited similar geographical pattern as the He for the nSSR loci (two leftmost plots in Figure 5): high diversity of the northeastern and low diversity of the western populations. At the chloroplast-haplotype level, the geographical patterns of diversity variation were less evident, perhaps, with a slight tendency of higher variation in northern Lithuania (lower-right plot, Figure 5). In general, the cpSSR-based genetic diversity was slightly higher in the northern than in southern populations. Such south–north diversity variation tendency was less notable with the nSSR markers.
4. Discussion
Scots pine is a wide-spread, wind-pollinated conifer dominating in the forests of Lithuania. Given the species biology, we do not expect strong genetic differentiation within such a comparably small area as studied here [11,36,45,57,95,96]. It is likely that common evolutionary background and lack of significant barriers for genetic exchange are the main reasons for the low population differentiation, based on neutral genomic variants such as the ones studied here (e.g., [47,55,97]). Instead, we suggest focusing on the factors that despite of the strong within-species panmixia in absence of sharp environmental gradients could have influenced the genetic structure and diversity of Scots pine populations Lithuania. Such factors are the evolutionary history, human interferences, geneflow or variation in phenology, and winter frost hardiness when moving from the mild seaside toward harsher climate in the continent [52].
4.1. Evolutionary Origin
The higher share of the northeastern European mitotype B in eastern Lithuania agrees well with the evolutionary migration scenario of Scots pine [34,37,45]. Pyhäjärvi et al. [35] reported an elevated share of the type B mitotype in Scots pine populations from the Baltic States, Finland, and northern Sweden than in other European populations. After the last glaciation, the mitotype A reached Lithuania via various southern migration routes east of the Alps. Whereas, the type B mitotype approached Lithuania from the southeast [37]. Interesting is the finding that even after some 11 K years of migration, the seed-dispersed-mitotype structure is still not random within such a small territory as Lithuania. An interpretation of this result could be that the A mitotype spread in Lithuania first [98], followed by a later approach of the mitotype B from the southeast, which has not yet reached the western Lithuania at its high frequency.
4.2. Population Genetic Structure
The low among-population FST value from our study (0.005) is in a good agreement with the earlier studies of Scots pine with nuclear DNA markers (e.g., GST < 0.02, [99,100,101,102]. In a range-wide study, Pyhäjärvi et al. [45], and recently Tyrmi et al. [6], reported weak genetic differentiation in nucleotide sequences at the genome-wide SNP variants among rather distant populations of Scots pine. At a narrower geographical scale in Poland, a nuclear SSR study by Hebda et al. [47] failed to reveal significant structures of Polish Scots pine populations, occupying a several-times-greater geographical range than in our study. It seems that we need to purify more of the relevant genomic signatures to understand the local adaptation, by studying as large as a 22 Gbp genome of Scots pine [6]. In our study, however, despite the narrow geographical range and strong outcrossing rate expected for Scots pine, we found weak but consistent genetic differentiation of Scots pine populations in the eastern highlands based on both organelle and nuclear DNA markers. This differentiation was confirmed by several statistical algorithms of genetic clustering (Table 2, Figure 1 and Figure 3). The differentiation was especially strong for paternally inherited cpSSRs (PhiPT = 0.24), likely strongly reflecting the genetic exchange among populations rather than the neutral nSSR markers. Here, genetic drift is likely to be of little importance for Scots pine in large natural woodlands at the center of the distribution range, such as in Lithuania. Low genetic differentiation based on neutral markers for an outcrossing conifer usually indicates strong genetic exchange, homogenizing the gene pools (e.g., Pyhäjärvi et al. [11]). However, as strongly supported by differentiation and structuring based on the paternally inherited cpSSRs, this genetic exchange is not completely random. It is likely to follow a region-wide phenology-based networks, which in turn depend on the geographical variation in temperature climate (e.g., Robledo-Arnuncio et al. [57]).
Pollen dispersal distance and flowering synchrony play an important role for an efficient genetic exchange among trees. With respect to the latter, most of the Scots pine pollen comes from the surrounding stands, however, long-distance pollen dispersal for several hundreds of kilometers was reported in northern Europe, when the male flowers were closed locally [54,56]. Populations of outcrossing species in northern Europe usually exhibit clinal variation over the adaptive gradients (e.g., [103,104]), where the overlapping population structures may pass over the geneflow in a steppingstone manner with no necessity of pollen dispersal over particularly large distances for efficient homogenizing geneflow. It is possible that occasionally Scots pine flowering in the mildest southern part of Lithuania may differ for a week from that in the coldest northeastern part of Lithuania (Figure S1). However, considering the well-known large within-population variation in phenology [105] and the occasional years of prompt heat release in spring, mating is possible over distances among pollutions, such as in our study. Nevertheless, the topography and maritime climate may influence the phenology timing of the Scots pine populations. The timing of spring phenology of trees mainly depends on effective temperature requirement for budburst [106,107,108,109,110,111,112,113]. The territory of Lithuania occupies 65,300 km2 of a rather flat surface, with the altitude ranging from an average ca. 30–70 m a. s. l. in the lowlands to 150–200 m a. s. l. in the highlands (Figure S1). Spring phenology variation studies of northerly conifers in provenance common gardens approximated that a 100 m shift in altitude roughly corresponds to a 1-degree shift in latitude [114]. The temperature climate over the cold period in Lithuania gradually changes from mild maritime at the seaside to a harsher climate when moving eastwards (Figure S1). The lowest winter temperature extremes occur in the northeastern highlands (Figure S1). Such climatic variation is assumed to induce a stronger winter frost hardiness of the Scots pine populations in the highlands, especially in the northeastern part of Lithuania. Phenology traits constitute a well correlated set of transient physiological stages of a tree within the annual cycle [115,116]. Thus, the geographical variation in local temperature leads to regional differences in flowering time, in this way creating local zones of more frequent gene-pool sharing [104], as confirmed by an in situ follow-up on the spring flowering of Scots pine natural stands in Lithuania (the northeastern populations of PABR and DUKS in map 7 of Figure S1). The genetic structure studies with microsatellite markers on small leaf lime in Lithuania also found significant differentiation of populations in the eastern highlands [117]. This strengthens the assumption of phenology-based differentiation of the forest tree populations in the cooler eastern highlands in Lithuania.
In this study, we focused on the country-wide trends in genetic structuring by choosing to sample more populations with less samples per population. However, it is likely that larger population sample sizes and genomic variants are needed to capture fine-scale genetic structures due to local phenology networks or site-specific adaptations [11,66]. It also should be considered that we studied predominantly neutral genetic markers, which may vary independently of the variation in adaptive traits for which much wide genomic sampling is required [11]. However, there is an indirect association between neutral and functional markers via phenology-driven gene-pool-sharing zones. Namely, freely intermating populations exchange both neutral and functional genomic variants, leading to similar genetic structures for both neutral and functional genetic markers (e.g., European beech in Ulaszewski [12]). However, in such a case, neutral markers are expected to display more of random noise and fuzzier structures than genomic markers [11]. In addition, more recent events such as forest management and human interferences with provenance transfer may also contribute to the structuring observed in our study (discussion on within-population diversity below).
The coalescence estimates of geneflow have revealed two major gene exchange networks among Scots pine populations, which agrees well with the phenology-based differentiation hypothesis discussed above (Figure 2). One network is among the populations in the eastern highlands and the northern part of midland lowlands (FNRs 2, 3, 6). Another network is between the seaside and midland lowlands (FNR 4 and 5) with some infusion into the western highlands (FNR 1) (Figure 2). The pairwise genetic-differentiation test among the populations confirmed the above gene-exchange tendencies (Figure 2). Another observation is that the gene flow tends to be directed into the regions with lower areas of Scots pine stands. Namely, from the eastern highlands (FNR 3) into the southern part of the midland lowlands (FNR 2, with richer soils dominating deciduous), or from the seaside lowlands (FNR 4) to the southern part of the lowlands of FNR 5. Here, the reason could be a tendency of geneflow from high- to low-diversity zones (discussion below on within-population genetic diversity).
In our study, the eastern-highland populations contained a relatively higher frequency of the northerly type B mitotype. Hence, there is a possibility that evolutionary origin may still have preserved distinct genetic variants at the neutral part of the chloroplast and nuclear genomes. Here, a morphologic examination of the two mitotypes for selectively neutral morphological traits may provide an answer [58].
The cold sea water of the Baltic over winter serves as a cooling reservoir for the population phenology in the seaside region (FNR 4). This cooling source is expected to cause deviations of spring phenology in Scots pine populations at the sea, in this way, distorting the smooth clinal gradient of spring phenology from the sea toward the continent. This presumption was confirmed by the in situ phenology tracking of Scots pine in a study in the late 1970s in Lithuania (see the late flowering of the seaside PALA population in map 7 of Figure S1). In our study, the cpSSR-based clustering assigned the lowland and highland populations into two separate groups (both Bayesian and UPGMA clustering, Figure 3). Hebda et al. [47] failed to find any structuring of Polish Scots pine populations based on chloroplast SSR makers. Sheller et al. [118] found three STRUCTURE genetic groups for Scots pine populations, based on cpSSRs within a latitudinal range of ca. 1000 km in southern Siberia. In the latter study, the haplotypes were highly shared as in our study (shared haplotype frequency > 70%, as in Figure S4) and a territory in the Romanian Carpathians being of a comparable size to Lithuania contained two STRUCTURE groups, again similar to our study. Urbaniak et al. [119] revealed a very high and significant genetic differentiation based on eight cpSSR markers between 14 analyzed populations, as well as between the three analyzed regions (four Western Carpathian, five Baltic, and four Russian populations) (PhiPT = 8%). Moreover, four Western Carpathian Scots pine populations from the same region showed higher differentiation (PhiPT = 5%) compared to the northern and more distant Russian and Baltic populations [119]. These results are comparable with the cpSSR genetic structures obtained in our study. Owing to paternal inheritance, cpSSR loci are expected to be more sensitive to the pollen-mediated geneflow patterns than nuclear neutral markers (e.g., [118]). Therefore, our study based on cpSSR markers found significant differentiation between the seaside (FNR 4) and the adjacent western-highland (FNR 1) populations, which was not supported by the nSSR data. In May, the prevailing winds blow southward via the midland lowland by turning southwestward in southern Lithuania (Figure S1). Such a prevailing wind pattern corresponds well with the geographical distribution of the cpSSR STRUCTURE groups (Figure 3) and may be another factor homogenizing the genetic composition of Scots pine populations [120].
4.3. Within-Population Genetic Diversity
There were tendencies in geographical variation of genetic diversity parameters that seemed to be of a non-random nature. Perhaps, the most evident was the higher genetic diversity of the northeastern populations: (a) equal shares of the two mitotypes (Figure 4) and (b) the highest within-population genetic diversity based on both chloroplast and nuclear DNA markers (Figure 5). The northeastern pines occur in three overlapping large continuous forest tracts (totaling 3500 km2, the largest being ca. 1500 km2 of continuous pine-dominated forests) on poor dry soils, which are well-suited for pines and less-suited for agriculture, aside from major cities, main rivers, and seaside ports. Here, human interventions with historical agriculture-to-forest turnovers and with large-scale forest felling for wood trade are the least expected. Hence, the northeastern woods are likely to represent natural autochthonous forests to a higher degree than in other parts of the country. Developing this discussion further, all four populations in the western highlands were relatively less diverse (populations 1 PLUN, 2 TRYS, 3 KURT, and 4 VARN, Figure 5). When both observed and expected heterozygosities are low, it is likely that the problems are not due to deviations from random mating, due to closed within-population clusters of relatives. Such a “closed within-stand mating group” hypothesis is unlikely for Scots pine to be able to disperse seeds and pollen over large distances. A more realistic scenario could be the low diversity of the maternal populations [63]. Such a situation may be a consequence of more fragmented Scots pine populations and relatively stronger human interference with forests in western Lithuania: close to the main seaport, small, fragmented forests, and richer soils for agriculture, leaving a greater chance for converting forests to agriculture fields and back [59,63]. For instance, in otherwise seemingly natural Scots pine stand of KURT (No. 3 in Figure 5), we noted occasional stone piles covered by moss, remaining from non-recent stone picking to facilitate ploughing of agricultural fields. KURT was one of the populations with the lowest diversity (No. 3, northwest, Figure 5). Rare allele frequencies tended to be higher in the western part than in the eastern part of Lithuania (Figure S3). It is possible that rare alleles may occur more often in artificially established populations from non-local sources [121,122,123].
5. Conclusions
The geographical distribution of the maternally inherited mitochondrial DNA markers indicates that the evolutionary background of Scots pine populations in Lithuania has a non-random geography, even after thousands of years of stochastic demography. This indicates that the post-glacial migration of populations and species is a continuous process, even active at present, which requires more attention by studying the genetic associations with the present-day morphology and designing the gene conservation of forest tree species.
There is a strong genetic exchange among Scots pine populations in Lithuania. However, this genetic exchange is not random and follows a geographical pattern, likely, via phenology-driven large-scale regional networks. One such genetic-exchange networks, which we observed, is among the Scots pine populations in the large continuous forest tracts in the eastern highlands of Lithuania. The eastern-highland populations contain distinct genetic signatures based on chloroplast, mitochondrial, and nuclear DNA markers. To return finer-graded genetic structures of local phenology networks, morphology variation, or site adaptions, we need studies designed for specific targets with larger within-population sample sizes.
Human activities and forest fragmentation may affect genetic diversity even of such widespread forest tree species such as Scots pine, as indicated by the higher Scots pine within-population genetic diversity in the large forest tracts in the Lithuanian eastern highlands compared to the more fragmented populations in western Lithuania.
Supplementary Materials
The following supporting information can be downloaded at: https://www.mdpi.com/article/10.3390/f13081179/s1. Table S1: Brief characteristics of climate and soils of the six forest natural regions in Lithuania based on Galvonaite et al. [94]; Table S2: Molecular characteristics of the nuclear and chloroplast microsatellite loci used for the Scots pine DNA analysis. The repeat motive size is given in bp after the slash. For allele size, the range and the most frequent alleles are given; Table S3: Proportion of mitochondrial DNA mitotypes A and B in natural Scots pine populations within Lithuania; Figure S1: The main climatic characteristics regarding frost hardiness and timing of spring budburst for Scots pine in Lithuania; Figure S2: Actual view of the sampled stands in various eco-climatic zones of Lithuania (forest natural regions, FNR); Figure S3: Population frequency of rare alleles (alleles with frequency < 0.01 in whole material); Figure S4: Geographical distribution of four most frequent clusters making up to 61% of all haplotypes, private and shared, based on three cpSSR loci of pt series. Paternally inherited haplotypes are highly shared among the populations studied (compare common haplotypes in white).
Author Contributions
Conceptualization, D.D., V.B. and D.K.; methodology, D.D. and V.B.; formal analysis, D.K. and D.D.; writing—original draft preparation, D.K. and D.D.; visualization, D.D. and D.K.; supervision, D.D.; funding acquisition, D.K. All authors have read and agreed to the published version of the manuscript.
Funding
This research is funded by the European Social Fund under grant agreement with the Research Council of Lithuania (LMTLT) Project No. 09.3.3-LMT-K-712-19-0007 “Development of Competences of Scientists, other Researchers and Students through Practical Research Activities”, in the frame of the project “Development of DNA marker-based origin traceability system for forest reproductive material in Lithuania”.
Institutional Review Board Statement
Not applicable.
Informed Consent Statement
Not applicable.
Data Availability Statement
The data underlying this article will be shared on reasonable request to the corresponding author.
Conflicts of Interest
The authors declare no conflict of interest.
References
- Gardner, M. Pinus sylvestris. In The IUCN Red List of Threatened Species; IUCN: Gland, Switzerland, 2013; E. T42418A2978732. [Google Scholar]
- Durrant, T.H.; De Rigo, D.; Caudullo, G. Pinus sylvestris in Europe: Distribution, habitat, usage and threats. Eur. Atlas For. Tree Spec. 2016, 132–133. [Google Scholar]
- Mason, W.L.; Alía, R. Current and future status of Scots pine (Pinus sylvestris L.) forests in Europe. For. Syst. 2000, 9, 317–335. [Google Scholar]
- Högberg, P.; Nordgren, A.; Buchmann, N.; Taylor, A.F.S.; Ekblad, A.; Högberg, M.N.; Read, D.J. Large-scale forest girdling shows that current photosynthesis drives soil respiration. Nature 2001, 411, 789–793. [Google Scholar] [CrossRef]
- Lindén, A.; Heinonsalo, J.; Buchmann, N.; Oinonen, M.; Sonninen, E.; Hilasvuori, E.; Pumpanen, J. Contrasting effects of increased carbon input on boreal SOM decomposition with and without presence of living root system of Pinus sylvestris L. Plant Soil. 2014, 377, 145–158. [Google Scholar] [CrossRef]
- Tyrmi, J.S.; Vuosku, J.; Acosta, J.J.; Li, Z.; Sterck, L.; Cervera, M.T.; Pyhäjärvi, T. Genomics of clinal local adaptation in Pinus sylvestris under continuous environmental and spatial genetic setting. Genes Genomes Genet. 2020, 10, 2683–2696. [Google Scholar] [CrossRef]
- Pravdin, L.F. Scots Pine: Variation, Intraspecific Taxonomy and Selection; Annarbor Humphrey Science Publishers Ltd.: London, UK, 1969. [Google Scholar]
- Giertych, M.; Giertych, M.; Mátyás, C. Inheritance of Tree Form; Elsevier: Amsterdam, The Netherlands, 1991; pp. 243–254. [Google Scholar]
- Shutyaev, A.M.; Giertych, M. Genetic subdivisions of the range of Scots pine (Pinus sylvestris L.). Silvae Genet. 2000, 3, 137–151. [Google Scholar]
- Danusevičius, D. Hybrid vigour from intra-specific crosses of Scots pine. Balt. For. 2008, 14, 2–6. [Google Scholar]
- Pyhäjärvi, T.; Kujala, S.T.; Savolainen, O. 275 years of forestry meets genomics in Pinus sylvestris. Evol. Appl. 2020, 13, 11–30. [Google Scholar] [CrossRef]
- Ulaszewski, B.K. Neutralna i Adaptacyjna Zmienność Genetyczna Buka Zwyczajnego Fagus sylvatica L. na Podstawie Analiz Genomowych (Neutral and Adaptive Genetic Diversity of European Beech Fagus sylvatica L. Based on Genomic Analyses). Master’s Thesis, Kazimierz the Great University, Bydgoszcz, Poland, 2018; 185p. (In Polish with extended English summary). [Google Scholar]
- Gugerli, F.; Parducci, L.; Petit, R.J. Ancient plant DNA: Review and prospects. New Phytol. 2005, 166, 409–418. [Google Scholar] [CrossRef]
- Gutaker, R.M.; Burbano, H.A. Reinforcing plant evolutionary genomics using ancient DNA. Curr. Opin. Plant Biol. 2017, 36, 38–45. [Google Scholar] [CrossRef]
- Hattemer, H.H. Concepts and requirements in the conservation of forest genetic resources. For. Genet. 1995, 2, 125–134. [Google Scholar]
- Petit, R.J.; Elmousadik, A.; Pons, O. Identifying populations for conservation on the basis of genetic markers. Conserv. Biol. 1998, 12, S844–S855. [Google Scholar] [CrossRef]
- Rajora, O.P.; Mosseler, A. Challenges and opportunities for conservation of forest genetic resources. Euphytica 2001, 118, 197–212. [Google Scholar] [CrossRef]
- Zhang, D.X.; Hewitt, G.M. Nuclear DNA analyses in genetic studies of populations: Practice, problems and prospects. Mol. Ecol. 2003, 12, 563–584. [Google Scholar] [CrossRef]
- Oliveira, E.J.; Pádua, J.G.; Zucchi, M.I.; Vencovsky, R.; Vieira, M.L.C. Origin, evolution and genome distribution of microsatellites. Genet. Mol. Biol. 2006, 29, 294–307. [Google Scholar] [CrossRef]
- Selkoe, K.A.; Toonen, R.J. Microsatellites for ecologists: A practical guide to using and evaluating microsatellite markers. Ecol. Lett. 2006, 9, 615–629. [Google Scholar] [CrossRef] [PubMed]
- Wang, L.M.; Barkley, A.N.; Jenkins, M.T. Microsatellite Markers in Plants and Insects. In Part I: Applications of Biotechnology. Genes, Genomes and Genomics; Global Science Books: Kagawa ken, Japan, 2009. [Google Scholar]
- Ennos, R.A.; Sinclair, W.T.; Hu, X.S.; Langdon, A. Using organelle markers to elucidate the history, ecology and evolution of plant populations. Mol. Syst. Plant Evolut. 1999, 57, 1–19. [Google Scholar]
- Petit, R.J.; Kremer, A.; Wagner, D.B. Geographic structure of chloroplast DNA polymorphisms in European oaks. Theor. Appl. Genet. 1993, 87, 122–128. [Google Scholar] [CrossRef]
- Hipkins, V.D.; Krutovskii, K.V.; Strauss, S.H. Organelle genomes in conifers: Structure, evolution, and diversity. For. Genet. 1994, 1, 179–189. [Google Scholar]
- Provan, J.; Soranzo, N.; Wilson, N.J.; McNicol, J.W.; Forrest, G.I.; Cottrell, J.; Powell, W. Gene-pool variation in Caledonian and European Scots pine (Pinus sylvestris L.) revealed by chloroplast simple-sequence repeats. Proc. R. Soc. Lond. Ser. B Biol. Sci. 1998, 265, 1697–1705. [Google Scholar] [CrossRef]
- Provan, J.; Powell, W.; Hollingsworth, P.M. Chloroplast microsatellites: New tools for studies in plant ecology and evolutions. Trends Ecol. Evol. 2001, 16, 142–147. [Google Scholar] [CrossRef]
- Petit, R.J.; Aguinagalde, I.; de Beaulieu, J.L.; Bittkau, C.; Brewer, S.; Cheddadi, R.; Ennos, R.; Fineschi, S.; Grivet, D.; Lascoux, G.; et al. Glacial refugia: Hotspots but not melting pots of genetic diversity. Science 2003, 300, 1563–1565. [Google Scholar] [CrossRef] [PubMed]
- Dong, J.S.; Wagner, D.B. Taxonomic and Population differentiation of mitochondrial diversity in Pinus banksiana and Pinus contorta. Theor. Appl. Genet. 1993, 86, 573–578. [Google Scholar] [CrossRef]
- Taberlet, P.; Fumagalli, L.; Wust-Saucy, A.G.; Cosson, J.F. Comparative phylogeography and postglacial colonization routes in Europe. Mol. Ecol. 1998, 7, 453–464. [Google Scholar] [CrossRef] [PubMed]
- Wu, J.; Krutovskii, K.V.; Strauss, S.H. Abundant mitochondrial genome diversity, population differentiation and convergent evolution in pines. Genetics 1998, 150, 1605–1614. [Google Scholar] [CrossRef]
- Jeandroz, S.; Bastien, D.; Chandelier, A.; Du Jardin, P.; Favre, J.M. A set of primers for amplification of mitochondrial DNA in Picea abies and other conifer species. Mol. Ecol. Notes 2002, 2, 389–392. [Google Scholar] [CrossRef]
- Godbout, J.; Jaramillo-Correa, J.P.; Beaulieu, J.; Bousquet, J. A mitochondrial DNA minisatellite reveals the postglacial history of jack pine (Pinus banksiana), a broad-range North American conifer. Mol. Ecol. 2005, 14, 3497–3512. [Google Scholar] [CrossRef]
- Soranzo, N.; Alia, R.; Provan, J.; Powell, W. Patterns of variation at a mitochondrial sequence-tagged-site locus provides new insights into the postglacial history of European Pinus sylvestris populations. Mol. Ecol. 2000, 9, 1205–1211. [Google Scholar] [CrossRef]
- Naydenov, K.; Senneville, S.; Beaulieu, J.; Tremblay, F.; Bousquet, J. Glacial vicariance in Eurasia: Mitochondrial DNA evidence from Scots pine for a complex heritage involving genetically distinct refugia at mid-northern latitudes and in Asia Minor. BMC Evol. Biol. 2007, 7, 233. [Google Scholar] [CrossRef]
- Pyhäjärvi, T.; Salmela, M.J.; Savolainen, O. Colonization routes of Pinus sylvestris inferred from distribution of mitochondrial DNA variation. Tree Genet. Genomes 2008, 4, 247–254. [Google Scholar] [CrossRef]
- Dering, M.; Kosinski, P.; Wyka, T.P.; Pers-Kamczyc, E.; Boratynski, A.; Boratynska, K.; Reich, P.B.; Romo, A.; Zadworny, M.; Zytkowiak, R.; et al. Tertiary remnants and Holocene colonizers: Genetic structure and phylogeography of Scots pine reveal higher genetic diversity in young boreal than in relict Mediterranean populations and a dual colonization of Fennoscandia. Divers. Distrib. 2017, 23, 540–555. [Google Scholar] [CrossRef]
- Buchovska, J.; Danusevičius, D.; Stanys, V.; Šikšnianienė, J.B.; Kavaliauskas, D. The location of the northern glacial refugium of Scots pine based on mitochondrial DNA markers. Balt. For. 2013, 19, 2–12. [Google Scholar]
- Neale, D.B.; Sederoff, R.R. Paternal inheritance of chloroplast DNA and maternal inheritance of mitochondrial DNA in loblolly pine. Theor. Appl. Genet. 1989, 77, 212–216. [Google Scholar] [CrossRef] [PubMed]
- Csaikl, U.M.; Glaz, I.; Baliuckas, V.; Petit, R.J.; Jensen, J.S. Chloroplast DNA variation of white oak in the Baltic countries and Poland. For. Ecol. Manag. 2002, 156, 211–222. [Google Scholar] [CrossRef]
- Powell, W.; Morgante, M.; McDevitt, R.; Vendramin, G.G.; Rafalski, J.A. Polymorphic simple sequence repeat regions in chloroplast genomes: Applications to the population genetics of pines. Proc. Natl. Acad. Sci. USA 1995, 92, 7759–7763. [Google Scholar] [CrossRef]
- Dumolin, S.; Demesure, B.; Petit, R.J. Inheritance of chloroplast and mitochondrial genomes in pedunculate oak investigated with an efficient PCR method. Theor. Appl. Genet. 1995, 91, 1253–1256. [Google Scholar] [CrossRef] [PubMed]
- Vendramin, G.G.; Lelli, L.; Rossi, P.; Morgante, M. A set of primers for the amplification of 20 chloroplast microsatellites in Pinaceae. Mol. Ecol. 1996, 5, 595–598. [Google Scholar] [CrossRef]
- Kavaliauskas, D.; Danusevičius, D.; Baliuckas, V.; Baranov, O. Paprastosios pušies populiacijų genetinė struktūra Lietuvoje pagal chloroplastų DNR žymenis. [Genetic structure of Scots pine populations in Lithuania according to chloroplast DNA markers]. Miškininkystė 2015, 1, 45–55. [Google Scholar]
- Belletti, P.; Ferrazzini, D.; Piotti, A.; Monteleone, I.; Ducci, F. Genetic variation and divergence in Scots pine (Pinus sylvestris L.) within its natural range in Italy. Eur. J. For. Res. 2012, 131, 1127–1138. [Google Scholar] [CrossRef]
- Pyhäjärvi, T.; Garcia-Gil, M.R.; Knürr, T.; Mikkonen, M.; Wachowiak, W.; Savolainen, O. Demographic history has influenced nucleotide diversity in European Pinus sylvestris populations. Genetics 2007, 177, 1713–1724. [Google Scholar] [CrossRef]
- Wachowiak, W.; Wόjkiewicz, B.; Cavers, S.; Lewandowski, A. High genetic similarity between Polish and North European Scots pine (Pinus sylvestris L.) populations at nuclear gene loci. Tree Genet. Genom. 2014, 10, 1015–1025. [Google Scholar] [CrossRef][Green Version]
- Hebda, A.; Wójkiewicz, B.; Wachowiak, W. Genetic characteristics of Scots pine in Poland and reference populations based on nuclear and chloroplast microsatellite markers. Silva Fenn. 2017, 51, 1721. [Google Scholar] [CrossRef][Green Version]
- Langlet, O. Two hundred years genecology. Taxon 1971, 20, 653–721. [Google Scholar] [CrossRef]
- Persson, B.; Beuker, E. Distinguishing between the effects of changes in temperature and light climate using provenance trials with Pinus sylvestris in Sweden. Can. J. For. Res. 1997, 27, 572–579. [Google Scholar] [CrossRef]
- Persson, B. Will climate change affect the optimal choice of Pinus sylvestris provenances? Silva Fenn. 1998, 32, 121–128. [Google Scholar] [CrossRef][Green Version]
- Clapham, D.H.; Ekberg, I.; Eriksson, G.; Norell, L.; Vince-Prue, D. Requirement for far-red light to maintain secondary needle extension growth in northern but not southern populations of Pinus sylvestris (Scots pine). Physiol Plant. 2002, 114, 207–212. [Google Scholar] [CrossRef] [PubMed]
- Eriksson, G. Evolutionary forces influencing variation among populations of Pinus sylvestris. Silva Fenn. 1998, 32, 694. [Google Scholar] [CrossRef]
- Sarvas, R. Investigations on the flowering and seed crop of Pinus silvestris. Metsat. Tutk. Julk. 1962, 53, 198. [Google Scholar]
- Koski, V. A study of pollen dispersal as a mechanism of gene flow in conifers. Commun. Inst. Fenn. 1970, 70, 1–78. [Google Scholar]
- Varis, S.; Pakkanen, A.; Galofré, A.; Pulkkinen, P. The extent of south-north pollen transfer in finnish Scots pine. Silva Fenn. 2009, 43, 717–726. [Google Scholar] [CrossRef]
- Torimaru, T.; Wang, X.R.; Fries, A.; Andersson, B.; Lindgren, D. Evaluation of pollen contamination in an advanced scots pine seed orchard. Silvae Genet. 2009, 58, 262–269. [Google Scholar] [CrossRef]
- Robledo-Arnuncio, J.J.; Collada, C.; Alia, R.; Gil, L. Genetic structure of montane isolates of Pinus sylvestris L. in a Mediterranean refugial area. J. Biogeogr. 2005, 32, 595–605. [Google Scholar] [CrossRef]
- Sirgėdienė, M.; Danusevičius, D. Morphological differences of cones of Scots pine populations growing in bogs and dry sites [Pelkinių ir normalaus drėgnumo augaviečių paprastųjų pušų kankorėžių morfologiniai skirtumai]. Miškininkystė 2019, 1, 49–67. [Google Scholar]
- Ledig, F.T. Human Impacts on Genetic Diversity in Forest Ecosystems. Oikos 1992, 63, 87–108. [Google Scholar] [CrossRef]
- Lefèvre, F. Human impacts on forest genetic resources in the temperate zone: An updated review. For. Ecol. Manag. 2004, 197, 257–271. [Google Scholar] [CrossRef]
- Finkeldey, R.; Ziehe, M. Genetic implications of silvicultural regimes. For. Ecol. Manag. 2004, 197, 231–244. [Google Scholar] [CrossRef]
- Naydenov, K.D.; Naydenov, M.K.; Tremblay, F.; Alexandrov, A.; Aubin-Fournier, L.D. Patterns of genetic diversity that result from bottlenecks in Scots Pine and the implications for local genetic conservation and management practices in Bulgaria. New For. 2011, 42, 179–193. [Google Scholar] [CrossRef]
- Ratnam, W.; Rajora, P.O.; Finkeldey, R.; Aravanopoulos, F.; Bouvet, J.M.; Vaillancourt, R.E.; Kanashiro, M.; Fady, B.; Tomita, M.; Vinson, C. Genetic effects of forest management practices: Global synthesis and perspectives. For. Ecol. Manag. 2014, 333, 52–65. [Google Scholar] [CrossRef]
- Gil, M.R.G.; Floran, V.; Östlund, L.; Gull, B.A. Genetic diversity and inbreeding in natural and managed populations of Scots pine. Tree Genet. Genomes 2015, 11, 28. [Google Scholar]
- Myking, T.; Rusanen, M.; Steffenrem, A.; Kjær, E.D.; Jansson, G. Historic transfer of forest reproductive material in the Nordic region: Drivers, scale and implications. Forestry 2016, 89, 325–337. [Google Scholar] [CrossRef]
- Danusevičius, D.; Kavaliauskas, D.; Fussi, B. Optimum Sample Size for SSR-based Estimation of Representative Allele Frequencies and Genetic Diversity in Scots Pine Populations. Balt. For. 2016, 22, 194–202. [Google Scholar]
- Aravanopoulos, F.A. Do silviculture and forest management affect the genetic diversity and structure of long-impacted forest tree populations? Forests 2018, 9, 355. [Google Scholar] [CrossRef]
- Mátyás, C.; Ackzell, L.; Samuel, C.J.A. EUFORGEN Technical Guidelines for Genetic Conservation and Use for Scots pine (Pinus sylvestris); International Plant Genetic Resources Institute: Rome, Italy, 2004. [Google Scholar]
- Floran, V.; Sestras, R.E.; Gil, M.R.G. Organelle genetic diversity and phylogeography of Scots pine (Pinus sylvestris L.). Not. Bot. Horti. Agrobot. Cluj Nap. 2011, 39, 317–322. [Google Scholar] [CrossRef][Green Version]
- Metzger, M.J.; Bunce, R.G.H.; Jongman, R.H.; Mücher, C.A.; Watkins, J.W. A climatic stratification of the environment of Europe. Glob. Ecol. Biogeogr. 2005, 14, 549–563. [Google Scholar] [CrossRef]
- Lithuanian State Forest Service Yearbook. 2020. Available online: https://amvmt.lrv.lt/uploads/amvmt/documents/files/Statistika/MiskuStatistika/2020/01%20Misku%20ukio%20statistika%202020_m.pdf (accessed on 1 February 2022).
- Danusevičius, J. Genetics and Breeding of Pine in Lithuania (Monograph); Lithuanian Forest Research Institute: Kaunas, Lithuania, 2001; 234p, (in Lithuanian with English headings of tables and figures). [Google Scholar]
- Ramanauskas, V. Lietuvos pušynų kankorėžiai ir sėklos. Girios 1978, 3, 3–5. [Google Scholar]
- Karazija, S. Lietuvos Miškų Tipai; Mokslas: Vilnius, Lithuania, 1998. [Google Scholar]
- Sebastiani, F.; Pinzauti, F.; Kujala, S.T.; González-Martínez, S.C.; Vendramin, G.G. Novel polymorphic nuclear microsatellite markers for Pinus sylvestris L. Conserv. Genet. Resour. 2012, 4, 231–234. [Google Scholar] [CrossRef]
- Soranzo, N.; Provan, J.; Powell, W. Characterization of microsatellite loci in Pinus sylvestris L. Mol. Ecol. 1998, 7, 1260–1261. [Google Scholar]
- Auckland, L.D.; Bui, T.; Zhou, Y.; Shepherd, M.; Williams, C.G. Conifer Microsatellite Handbook; A&M University: College Station, TX, USA, 2002; 57p. [Google Scholar]
- Van Oosterhout, C.; Hutchinson, W.F.; Wills, D.P.; Shipley, P. MICRO-CHECKER: Software for identifying and correcting genotyping errors in microsatellite data. Mol. Ecol. Notes 2004, 4, 535–538. [Google Scholar] [CrossRef]
- Nei, M. Estimation of average heterozygosity and genetic distance from a small number of individuals. Genetics 1978, 89, 583–590. [Google Scholar] [CrossRef] [PubMed]
- Vendramin, G.G.; Anzidei, M.; Madaghiele, A.; Bucci, G. Distribution of genetic diversity in Pinus pinaster Ait. as revealed by chloroplast microsatellites. Theor. Appl. Genet. 1998, 97, 456–463. [Google Scholar] [CrossRef]
- Eliades, N.G.; Eliades, D.G. HAPLOTYPE ANALYSIS: Software for Analysis of Haplotype Data; Genetics and Forest Tree Breeding, Georg-August University: Goettingen, Germany, 2009. [Google Scholar]
- Goudet, J. FSTAT, a Program to Estimate and Test Gene Diversities and Fixation Indices (Version 2.9.3). 2001. Available online: http://www.unil.ch/izea/softwares/fstat.html. (accessed on 12 October 2021).
- Nei, M. Genetic polymorphism and the role of mutation in evolution. Evol. Genes Prot. 1983, 71, 165–190. [Google Scholar]
- Peakall, R.O.D.; Smouse, P.E. GENALEX 6: Genetic analysis in Excel. Population genetic software for teaching and research. Mol. Ecol. Notes. 2006, 6, 288–295. [Google Scholar] [CrossRef]
- Takezaki, N.; Nei, M.; Tamura, K. POPTREE2: Software for constructing population trees from allele frequency data and computing other population statistics with Windows interface. Mol. Biol. Evol. 2010, 27, 747–752. [Google Scholar] [CrossRef] [PubMed]
- Pritchard, J.K.; Stephens, M.; Donnelly, P. Inference of population structure using multilocus genotype data. Genetics 2000, 155, 945–959. [Google Scholar] [CrossRef] [PubMed]
- Evanno, G.; Regnaut, S.; Goudet, J. Detecting the number of clusters of individuals using the software STRUCTURE: A simulation study. Mol. Ecol. 2005, 14, 2611–2620. [Google Scholar] [CrossRef] [PubMed]
- Earl, D.A.; Von Holdt, B.M. STRUCTURE HARVESTER: A website and program for visualizing STRUCTURE output and implementing the Evanno method. Conserv. Genet. Resour. 2012, 4, 359–361. [Google Scholar] [CrossRef]
- Manni, F.; Guérard, E.; Heyer, E. Geographic patterns of (genetic, morphologic, linguistic) variation: How barriers can be detected by using Monmonier’s algorithm. Hum. Biol. 2004, 76, 173–190. [Google Scholar] [CrossRef]
- Miller, M.P. Alleles in Space (AIS): Computer software for the joint analysis of interindividual spatial and genetic information. J. Hered. 2005, 96, 722–724. [Google Scholar] [CrossRef]
- Peakall, R.; Smouse, P. GenAlEx 6.5: Genetic analysis in Excel. Population genetic software for teaching and research—an update. Bioinformatics 2012, 28, 2537–2539. [Google Scholar] [CrossRef]
- Nei, M.; Tajima, F.; Tateno, Y. Accuracy of estimated phylogenetic trees from molecular data. II. Gene frequency data. J. Mol. Evol. 1983, 19, 153–170. [Google Scholar] [CrossRef]
- Beerli, P. How to use MIGRATE or why are Markov chain Monte Carlo programs difficult to use. Popul. Genet. Anim. Conserv. 2009, 17, 42–79. [Google Scholar] [CrossRef]
- Galvonaitė, A.; Valiukas, D.; Kilpys, J.; Kitrienė, Z.; Misiūnienė, M. Climate Atlas of Lithuania; Lithuanian Hydrometeorological Service under Ministry of Environment: Vilnius, Lithuania, 2013. [Google Scholar]
- Kujala, S. Dissecting genetic variation in European Scots pine (Pinus sylvestris L.): Special emphasis on polygenic adaptation. Acta Univ. Oul. A 2015, 661, 75. [Google Scholar]
- Tóth, E.G.; Vendramin, G.G.; Bagnoli, F.; Cseke, K.; Höhn, M. High genetic diversity and distinct origin of recently fragmented Scots pine (Pinus sylvestris L.) populations along the Carpathians and the Pannonian Basin. Tree Genet. Genomes 2017, 13, 1–12. [Google Scholar] [CrossRef]
- Nowakowska, J.A. ZmiennoÊç genetyczna polskich wybranych populacji sosny zwyczajnej (Pinus sylvestris L.) na podstawie analiz polimorfizmu DNA. Rozpr. I Monogr. 2007, 9, 1–118. [Google Scholar]
- Danusevičius, D.; Buchovska, J.; Žulkus, V.; Daugnora, L.; Girininkas, A. DNA Markers Reveal Genetic Associations among 11,000-Year-Old Scots Pine (Pinus sylvestris L.) Found in the Baltic Sea with the Present-Day Gene Pools in Lithuania. Forests 2021, 12, 317. [Google Scholar] [CrossRef]
- Karhu, A.; Hurme, P.; Karjalainen, M.; Karvonen, P.; Kärkkäinen, K.; Neale, D.; Savolainen, O. Do molecular markers reflect patterns of differentiation in adaptive traits of conifers? Theor. Appl. Genet. 1996, 93, 215–221. [Google Scholar] [CrossRef]
- Kujala, S.T.; Savolainen, O. Sequence variation patterns along a latitudinal cline in Scots pine (Pinus sylvestris): Signs of clinal adaptation? Tree Genet. Genomes 2012, 8, 1451–1467. [Google Scholar] [CrossRef]
- Prus-Głowacki, W.; Urbaniak, L.; Bujas, E.; Curtu, A.L. Genetic variation of isolated and peripheral populations of Pinus sylvestris (L.) from glacial refugia. Flora: Morphol. Distrib. Funct. Ecol. Plants 2012, 207, 150–158. [Google Scholar] [CrossRef]
- Bilgen, B.B.; Kaya, N. Genetic diversity among Pinus sylvestris L. populations and its implications for genetic conservation: Comparison of nuclear and chloroplast microsatellite markers. Fresenius Environ. Bull. 2017, 26, 6873. [Google Scholar]
- Persson, A.; Persson, B. Survival, Growth and Quality of Norway Spruce (Picea abies (L.) Karst.) Provenances at the Three Swedish Sites of the IUFRO 1964/68 Provenance Experiment; Rapport-Sveriges Lantbruksuniversitet: Uppsala, Sweden, 1992; Report 29; p. 67. [Google Scholar]
- Danusevičius, D.; Gabrilavičius, R. Variation in juvenile growth rhythm among Picea abies provenances from the Baltic states and adjacent regions. Scand. J. For. Res. 2001, 16, 305–317. [Google Scholar] [CrossRef]
- Eriksson, G. Pinus sylvestris Recent Genetic Research; Department of Plant Biology and Forest Genetics, SLU: Uppsala, Sweden, 2008; 111p, ISBN 978-91-85911-90-5. [Google Scholar]
- Baskerville, G.L.; Emin, P. Rapid estimation of heat accumulation from maximum and minimum temperatures. Ecology 1969, 50, 514–517. [Google Scholar] [CrossRef]
- Sarvas, R. Investigations on the annual cycle of development of forest trees. Autumn dormancy and winter dormancy. Commun. Linstinstituti For. Fenn. 1974, 84, 1–101. [Google Scholar]
- Lechowicz, M.J. Why do temperate deciduous trees leaf out at different times? Adaptation and ecology of forest communities. Am. Nat. 1984, 124, 821–842. [Google Scholar] [CrossRef]
- Badeck, F.W.; Bondeau, A.; Böttcher, K.; Doktor, D.; Lucht, W.; Schaber, J.; Sitch, S. Responses of spring phenology to climate change. New Phytol. 2004, 162, 295–309. [Google Scholar] [CrossRef]
- Antonucci, S.; Rossi, S.; Deslauriers, A.; Lombardi, F.; Marchetti, M.; Tognetti, R. Synchronisms and correlations of spring phenology between apical and lateral meristems in two boreal conifers. Tree Physiol. 2015, 35, 1086–1094. [Google Scholar] [CrossRef]
- Fu, Y.H.; Liu, Y.; De Boeck, H.J.; Menzel, A.; Nijs, I.; Peaucelle, M.; Janssens, I.A. Three times greater weight of daytime than of night-time temperature on leaf unfolding phenology in temperate trees. New Phytol. 2016, 212, 590–597. [Google Scholar] [CrossRef]
- Dai, W.; Jin, H.; Zhang, Y.; Liu, T.; Zhou, Z. Detecting temporal changes in the temperature sensitivity of spring phenology with global warming: Application of machine learning in phenological model. Agric. For. Meteorol. 2019, 279, 107702. [Google Scholar] [CrossRef]
- Wang, H.; Wu, C.; Ciais, P.; Penuelas, J.; Dai, J.; Fu, Y.; Ge, Q. Overestimation of the effect of climatic warming on spring phenology due to misrepresentation of chilling. Nat. Commun. 2020, 11, 1–9. [Google Scholar] [CrossRef]
- Hannerz, M. Genetic and Seasonal Variation in Hardiness and Growth Rhythm in Boreal and Temperate Conifers; Skogforsk: Uppsala, Sweden, 1998; Report No. 2; pp. 1–140. [Google Scholar]
- McKown, A.D.; Guy, R.D.; Azam, M.S.; Drewes, E.C.; Quamme, L.K. Seasonality and phenology alter functional leaf traits. Oecologia 2013, 172, 653–665. [Google Scholar] [CrossRef] [PubMed]
- Delpierre, N.; Guillemot, J.; Dufrêne, E.; Cecchini, S.; Nicolas, M. Tree phenological ranks repeat from year to year and correlate with growth in temperate deciduous forests. Agric. For. Meteorol. 2017, 234, 1–10. [Google Scholar] [CrossRef]
- Danusevičius, D.; Kembrytė, R.; Buchovska, J.; Baliuckas, V.; Kavaliauskas, D. Genetic signature of the natural genepool of Tilia cordata Mill. in Lithuania: Compound evolutionary and anthropogenic effects. Ecol. Evol. 2021, 11, 6260–6275. [Google Scholar] [CrossRef]
- Sheller, M.; Ciocîrlan, E.; Mikhaylov, P.; Kulakov, S.; Kulakova, N.; Ibe, A.; Sukhikh, T.; Curtu, A.L. Chloroplast DNA Diversity in Populations of P. sylvestris L. from Middle Siberia and the Romanian Carpathians. Forests 2021, 12, 1757. [Google Scholar] [CrossRef]
- Urbaniak, L.; Wojnicka-Półtorak, A.; Celiński, K.; Lesiczka, P.; Pawlaczyk, E.; Aučina, A. Genetic resources of relict populations of Pinus sylvestris (L.) in Western Carpathians assessed by chloroplast microsatellites. Biologia 2019, 74, 1077–1086. [Google Scholar] [CrossRef]
- Kling, M.M.; Ackerly, D.D. Global wind patterns shape genetic differentiation, asymmetric gene flow, and genetic diversity in trees. Proc. Natl. Acad. Sci. USA 2021, 118, e2017317118. [Google Scholar] [CrossRef] [PubMed]
- Slatkin, M. Rare alleles as indicators of gene flow. Evolution 1985, 39, 53–65. [Google Scholar] [CrossRef]
- Helenurm, K.; Parsons, L.S. Genetic Variation and the Reproduction of Cordylanthus maritimus ssp. maritimus to Sweetwater Marsh, California. Restor. Ecol. 1997, 5, 236–244. [Google Scholar] [CrossRef]
- Menges, E.S. Restoration demography and genetics of plants: When is a translocation successful? Aust. J. Bot. 2008, 56, 187–196. [Google Scholar] [CrossRef]


Publisher’s Note: MDPI stays neutral with regard to jurisdictional claims in published maps and institutional affiliations. |
© 2022 by the authors. Licensee MDPI, Basel, Switzerland. This article is an open access article distributed under the terms and conditions of the Creative Commons Attribution (CC BY) license (https://creativecommons.org/licenses/by/4.0/).