
Variation of Selected Macrostructure Features and Density Wood of the European Spruce (Picea abies (L.) Karst.) in the Cross-Section of Trees over 90-Years-Old in Poland


Abstract
:1. Introduction
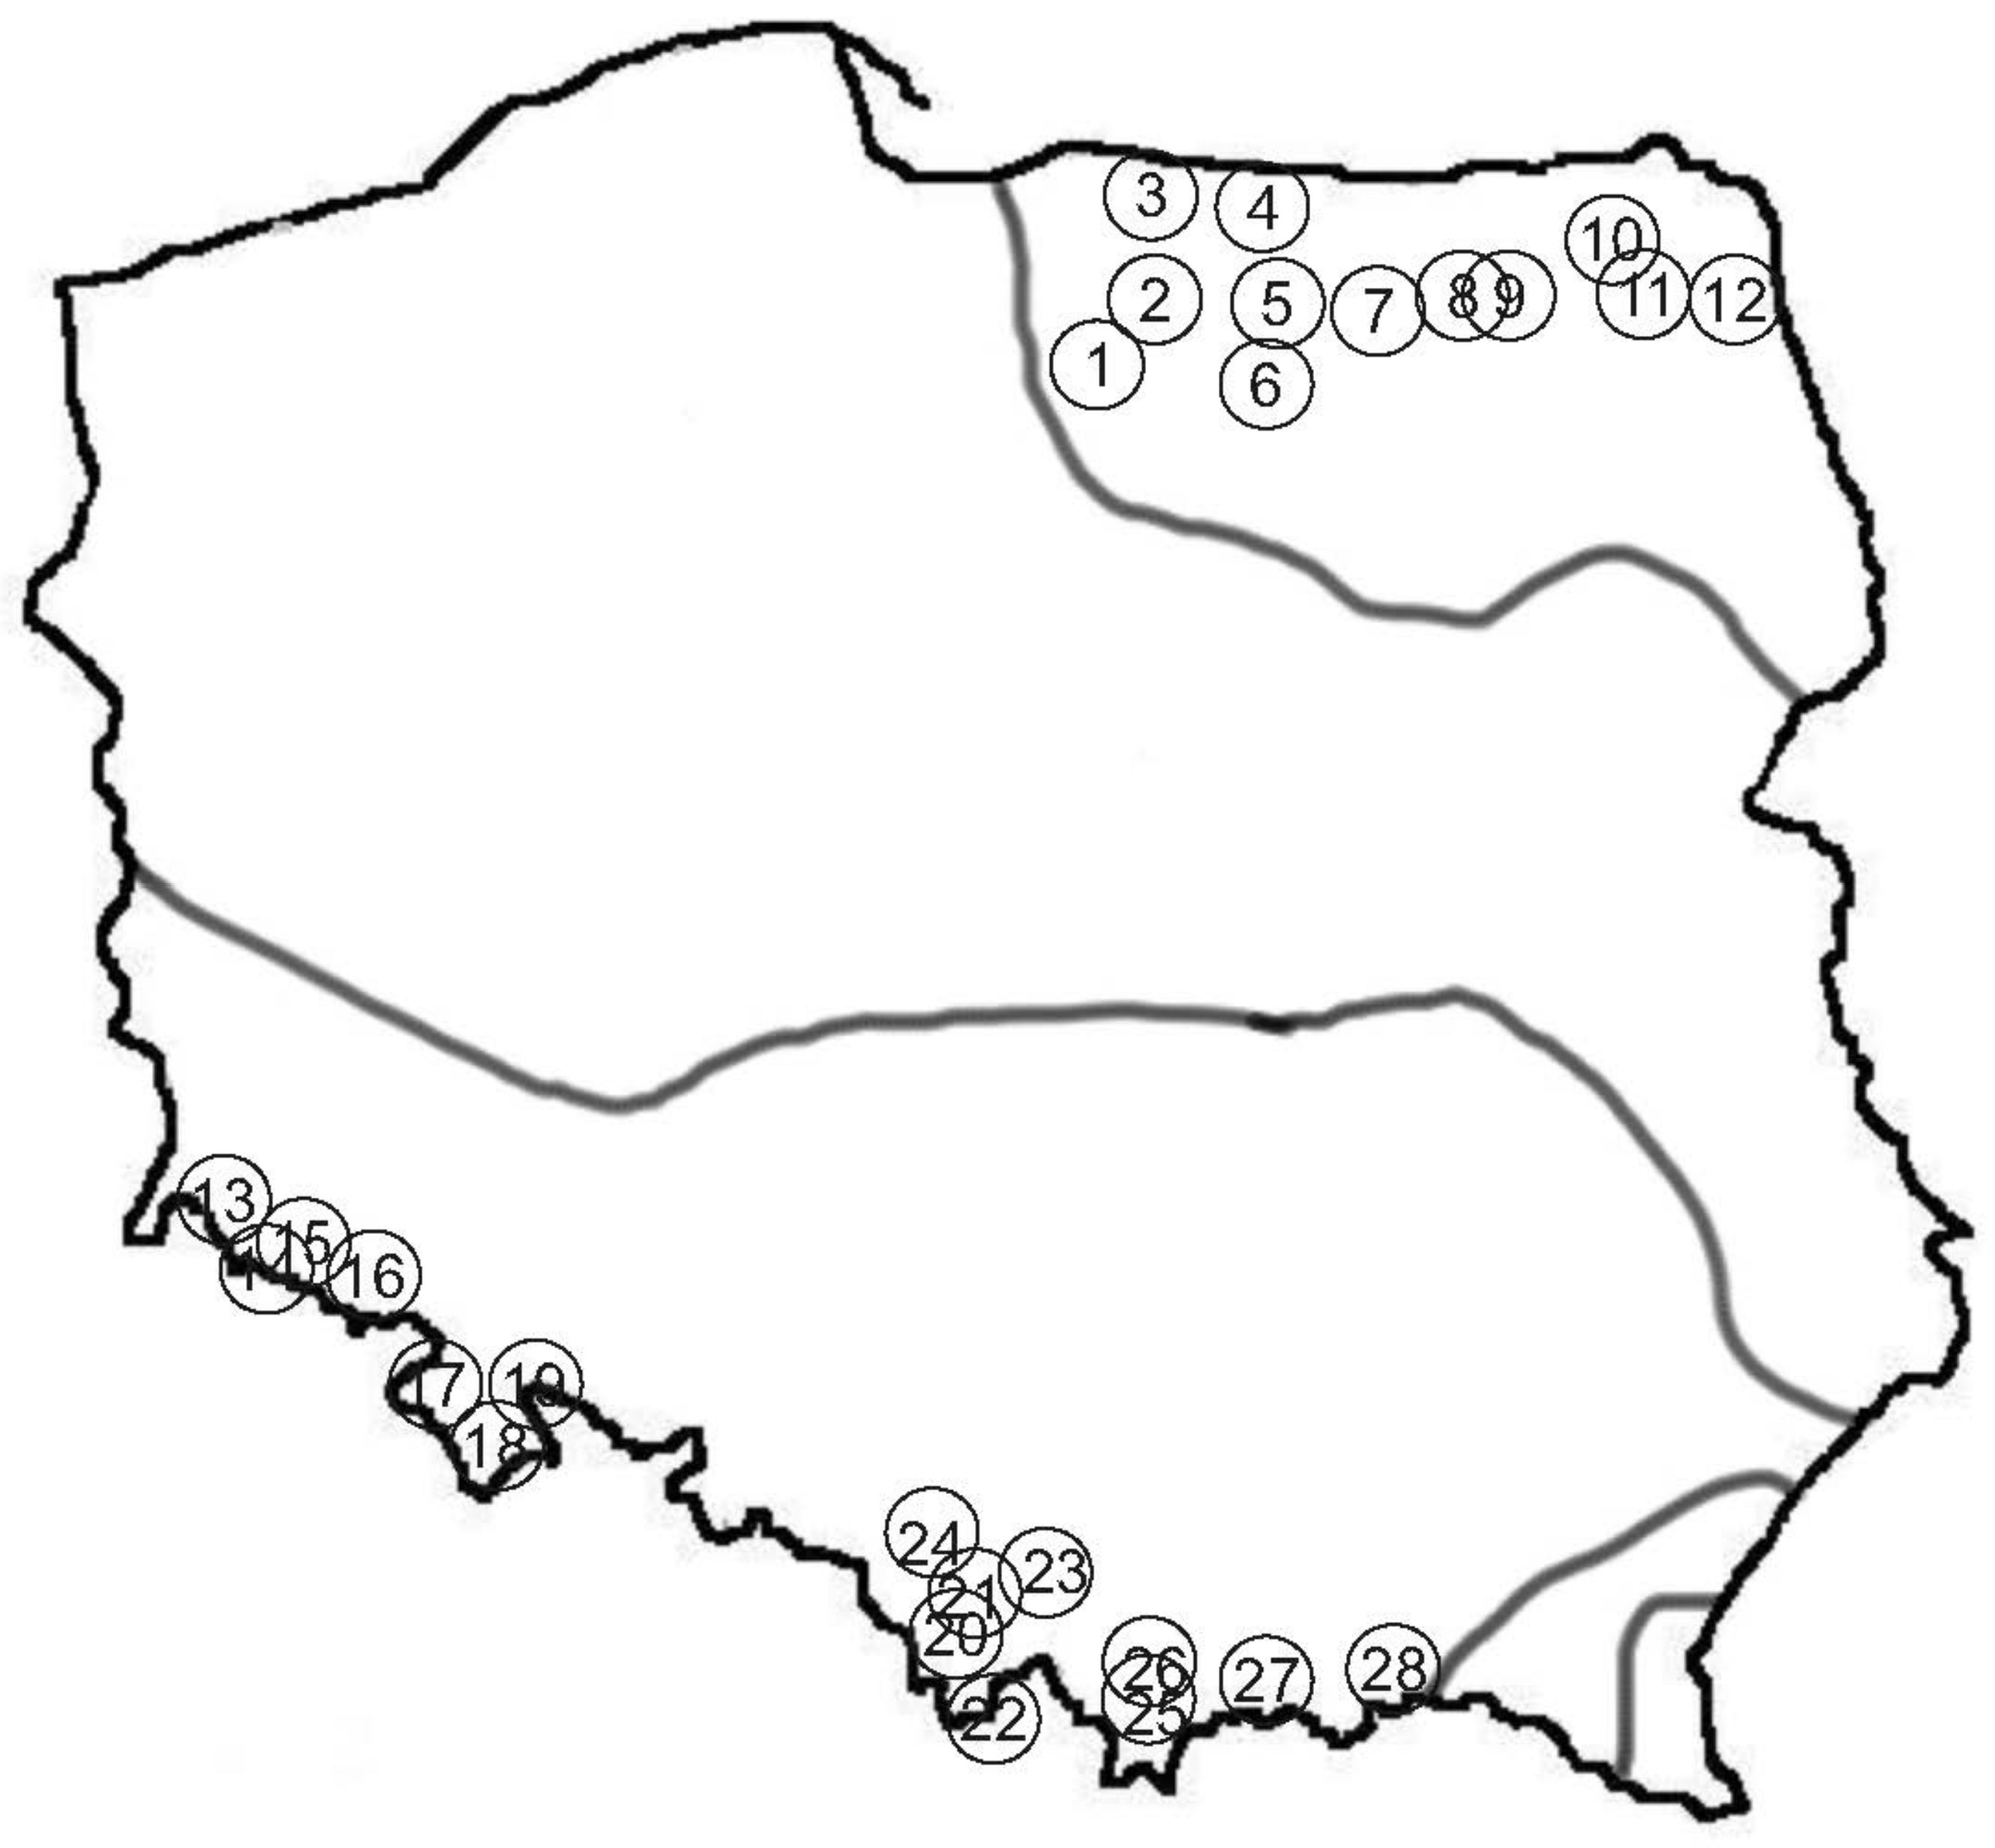
2. Materials and Methods
3. Results
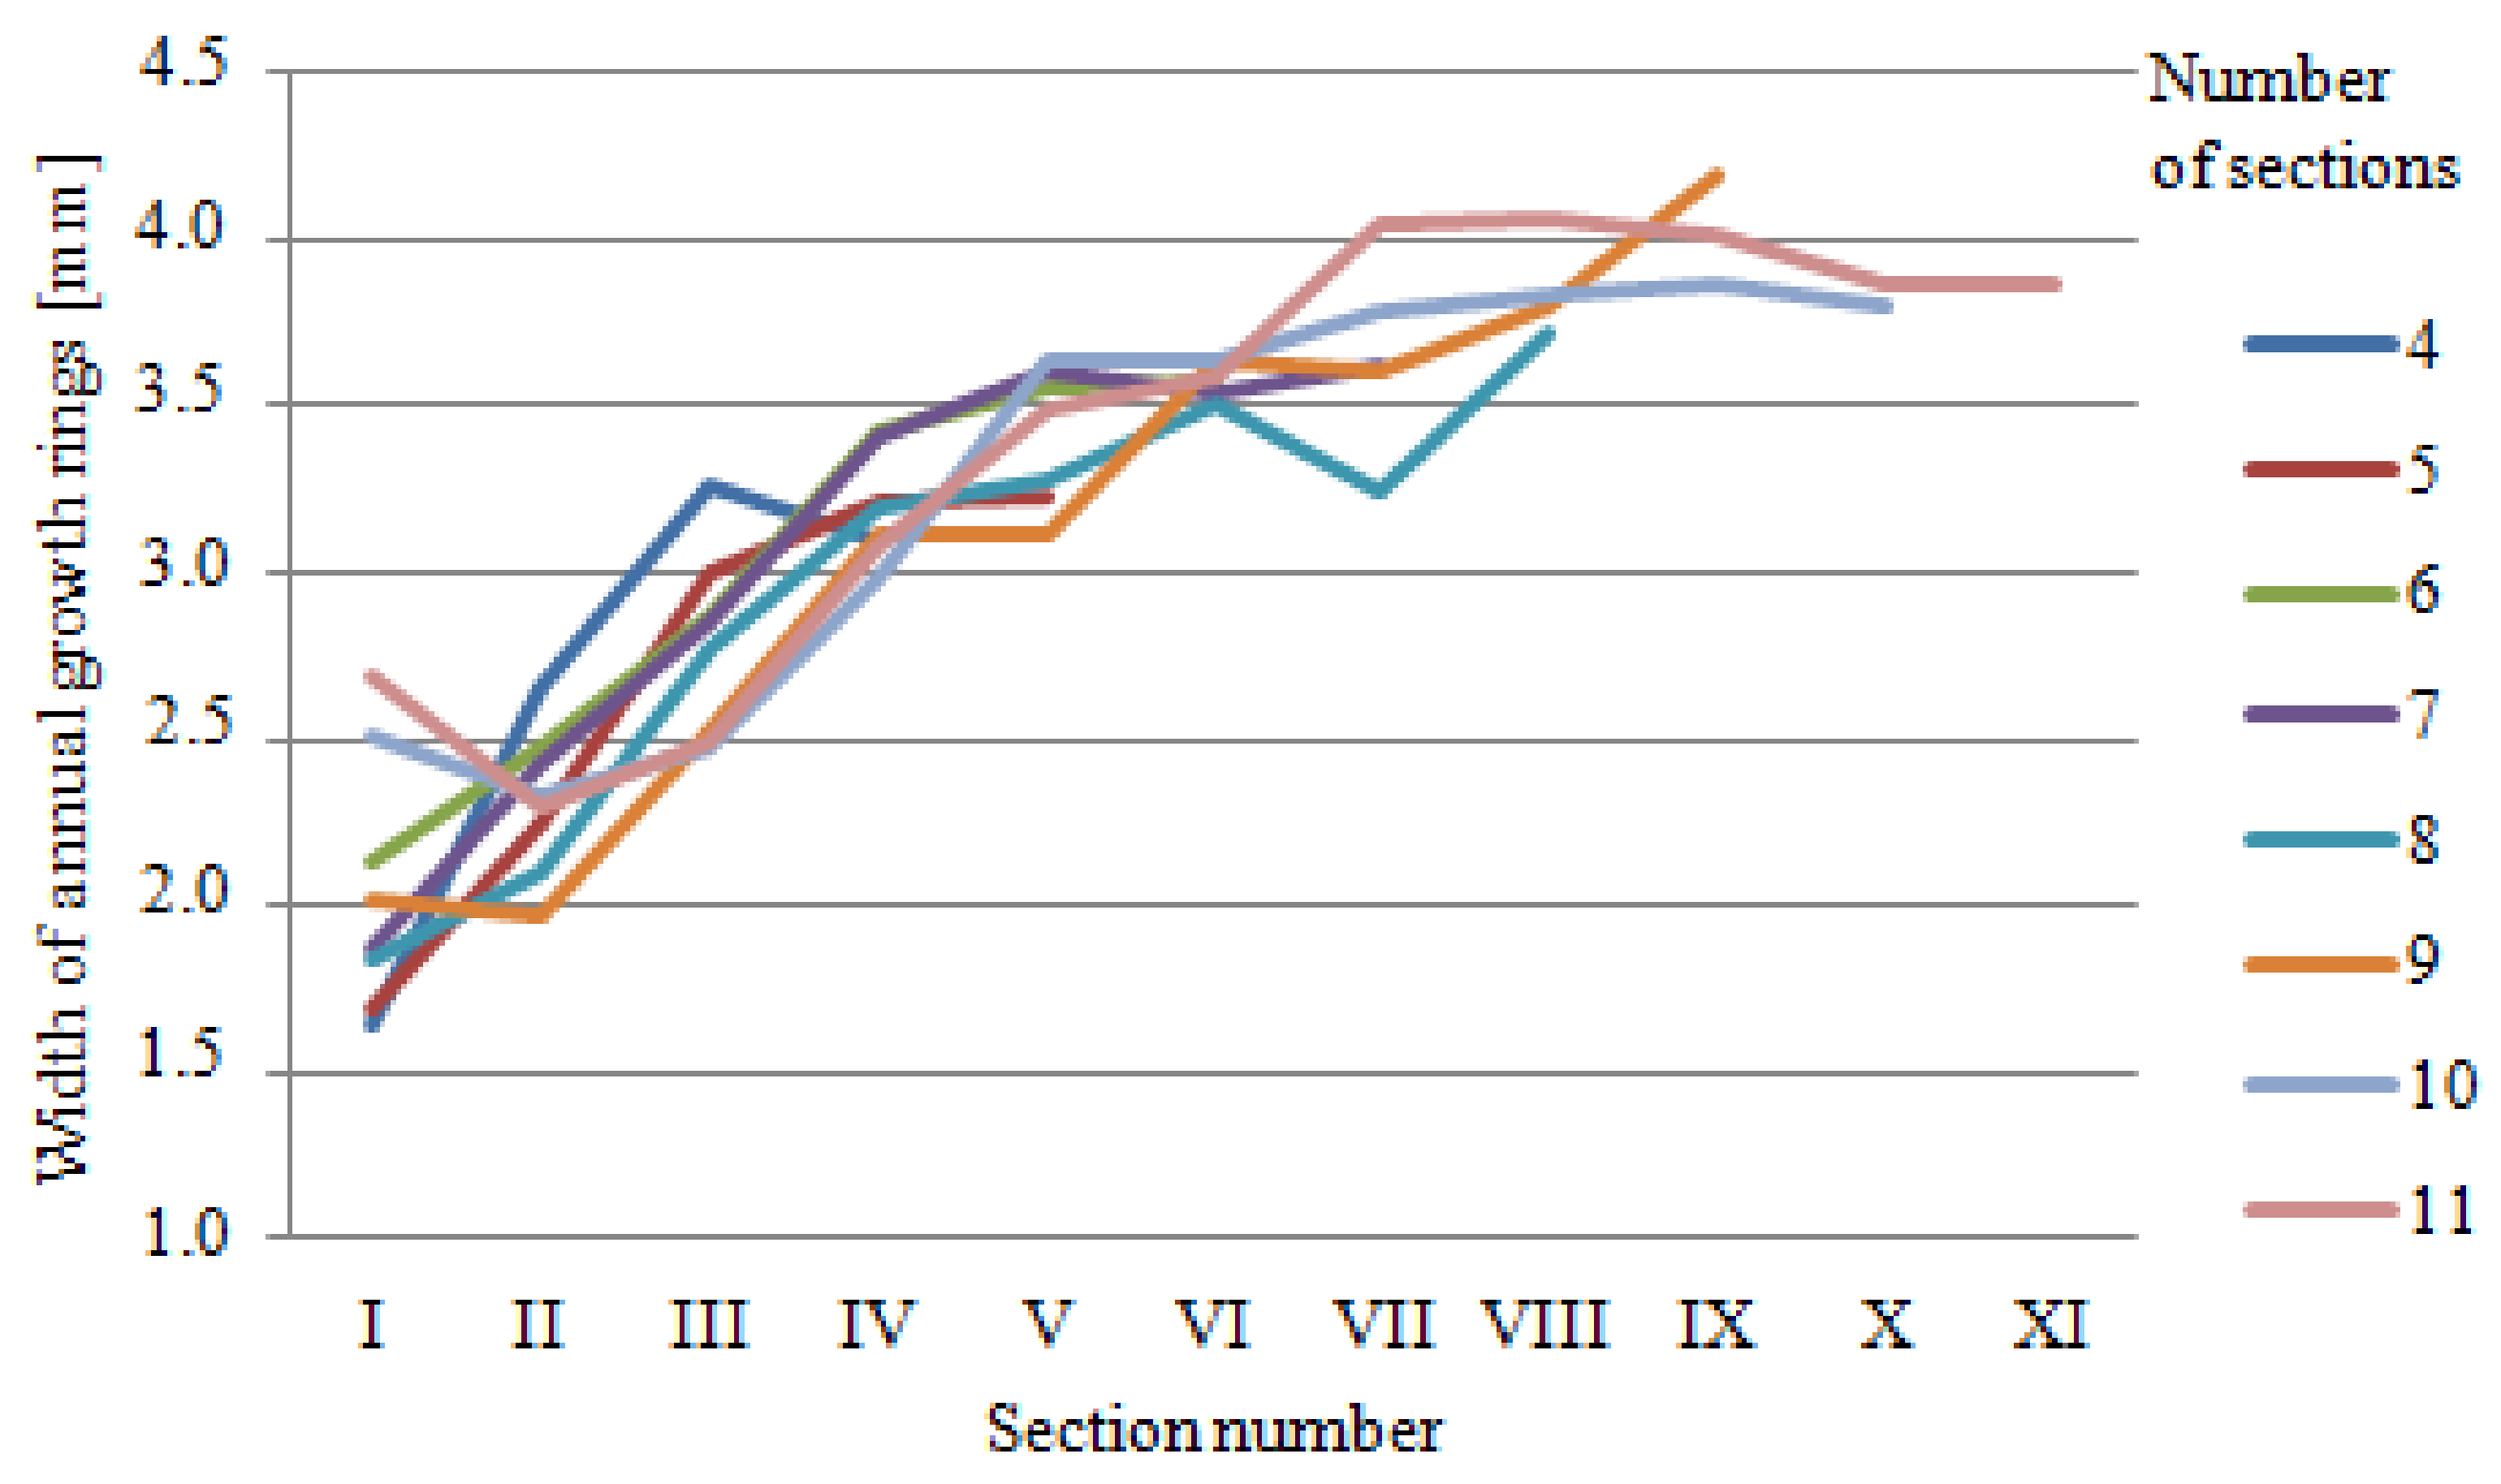
3.1. The Widths of Annual Growth Rings
3.2. The Share of Latewood
3.3. Wood Density
3.4. Correlations
4. Discussion
5. Conclusions
- The width of the annual growth rings in the tested material was constantly increasing from the outer circumference towards the pith.
- The greatest share of latewood was found not only in the perimeter zones of the trunk but also in the zones immediately adjacent to the pith.
- It was found that the highest wood densities occur in the perimeter zones and that these densities decrease towards the pith. Only in the sections immediately at the pith, was an increase in wood density noted.
- Having analysed the correlations between the examined features, it was found that the width of annual growth rings affects both the share of latewood and the wood density. Furthermore, these were negative correlations, whereas the increase in the share of latewood affected the increase in wood density, exhibiting a positive correlation.
Author Contributions
Funding
Data Availability Statement
Conflicts of Interest
References
- GUS. Leśnictwo 2021. (Forestry 2021); GUS: Warsaw, Poland, 2021; p. 40. [Google Scholar]
- Jaworski, A. Hodowla Lasu. Charakterystyka Hodowlana Drzew i Krzewów Leśnych. (Silviculture. Silvicultural Characteristics of Forest Trees and Shrubs) T. 3; PWRiL: Warsaw, Poland, 2011; pp. 26–51. [Google Scholar]
- Michalec, K. Jakość surowca świerkowego (Picea abies (L.) Karst.) pochodzącego z głównych ośrodków i zasięgów jego występowania w Polsce. (Quality of spruce raw material (Picea abies [L.] Karst.) from main centers and ranges of spruce distribution in Poland). Drew. Pr. Nauk. Donies. Komun. 2007, 177, 57–78. [Google Scholar]
- Krzysik, F. Nauka o Drewnie. (Wood Science); PWN: Warsaw, Poland, 1974; pp. 44–56. [Google Scholar]
- Petty, J.A.; Macmillan, D.C.; Teward, C.M. Variation of density and growth ring width in stems of Sitka and Norway spruce. Forestry 1990, 63, 39–49. [Google Scholar] [CrossRef]
- Wąsik, R. Zmienność wybranych cech makrostruktury i gęstości drewna daglezji zielonej (Pseudotsuga menziesii var. viridis Franco) na terenie Polski. (Variability of the features of macrostructure and wood density of Douglas fir (Pseudotsuga menziesii var. viridis Franco) in Poland). Drew. Pr. Nauk. Donies. Komun. 2007, 178, 57–85. [Google Scholar]
- Jyske, T.; Mäkinen, H.; Saranpää, P. Wood density within Norway spruce stems. Silva Fenn. 2008, 42, 439–455. [Google Scholar] [CrossRef] [Green Version]
- Tomczak, A.; Pazdrowski, W.; Jelonek, T.; Grzywiński, W. Jakość drewna sosny zwyczajnej (Pinus sylvestris L.). Część I. Charakterystyka wybranych cech i właściwości drewna wpływających na jego jakość. (Quality of Scots pine (Pinus sylvestris L.) wood. Part I. Characteristics of selected wood traits and properties affecting its quality). Sylwan 2009, 153, 363–372. [Google Scholar]
- Franceschini, T.; Longuetaud, F.; Bontemps, J.D.; Bouriaud, O.; Caritey, J.D.; Leban, J.M. Effect of ring width, cambial age, and climatic variables on the within-ring wood density profile of Norway spruce Picea abies (L.) Karst. Trees 2013, 27, 913–925. [Google Scholar] [CrossRef]
- Barzdajn, W. Zmienność gęstości drewna świerka pospolitego (Picea abies (L.) Karst.) w Polsce. (Variability of Norway spruce wood density in Poland). PTPN. Pr. Kom. Nauk. Rol. I Kom. Nauk. Leśn. 1996, 82, 7–14. [Google Scholar]
- Matras, J. Zróżnicowanie gęstości drewna populacji świerka na powierzchni doświadczalnej w Knyszynie w relacji do zróżnicowania populacji matecznych. (Variability of wood specific gravity among Norway spruce populations and the heritability of this feature for populations from the Knyszyn experimental plot). Pr. Inst. Badaw. Leśn. Ser. A 2002, 2, 21–33. [Google Scholar]
- Szaban, J.; Kowalkowski, W.; Karaszewski, Z.; Jakubowski, M. Effect of tree provenance on basic wood density of Norway spruce (Picea abies (L.) Karst.) grown on an experimental plot at Siemianice forest experimental station. Drew. Pr. Nauk. Donies. Komun. 2014, 191, 135–143. [Google Scholar]
- Tomášková, I.; Pokorný, R.; Marek, M.V. Influence of stand density, thinning and elevated CO2 on stem wood density of spruce. J. For. Sci. 2007, 53, 400–405. [Google Scholar] [CrossRef] [Green Version]
- Wąsik, R.; Michalec, K.; Barszcz, A.; Mudryk, K. Variability of selected macrostructure features, density and compression strength along the grain of the “Tabórz” Scots pine wood (Pinus sylvestris L.). Drew. Pr. Nauk. Donies. Komun. 2020, 205, 171–182. [Google Scholar]
- Sander, C.; Eckstein, D.; Kyncl, J.; Dobry, J. The growth of spruce (Picea abies (L.) Karst.) in the Karkonoše-(Giant) Mountains as indicated by ring width and wood density. Ann. Sci. For. 1995, 52, 401–410. [Google Scholar] [CrossRef] [Green Version]
- Grabczyński, S. Przyrost pierśnicy drzew w sześćdziesięcioletnich drzewostanach świerkowych Beskidów Zachodnich. (The growth in diameter at breast height in 60-year-old spruce stands in the Western Beskids). Sylwan 1998, 142, 13–17. [Google Scholar]
- Ochał, W. Struktura i dynamika przyrostu grubości drzew w drzewostanach świerkowych masywu Skrzyczne. (Structure and dynamic of diameter increment spruce forest of Skrzyczne range). Sylwan 2000, 144, 75–85. [Google Scholar]
- Van der Maaten-Theunissen, M.; Boden, S.; van der Maaten, E. Wood density variations of Norway spruce (Picea abies (L.) Karst.) under contrasting climate conditions in southwestern Germany. Ann. For. Res. 2013, 56, 91–103. [Google Scholar]
- Michalec, K.; Wąsik, R.; Barszcz, A. Zmienność wybranych cech makrostruktury i gęstości drewna świerkowego (Picea abies (L.) Karst.) z regla dolnego i górnego. (Variability of selected macrostructural features and density of Picea abies (L.) Karst. wood from lower and upper subalpine forest zones). Sylwan 2016, 160, 855–860. [Google Scholar]
- Michalec, K.; Wąsik, R.; Barszcz, A.; Sowa, J.M. The effect of stand origin on the wood structure of Norway spruce. Drew. Pr. Nauk. Donies. Komun. 2020, 206, 137–146. [Google Scholar]
- Michalec, K.; Wąsik, R.; Barszcz, A. Zmienność wybranych cech makrostruktury i gęstości drewna świerkowego (Picea abies (L.) Karst.) pochodzącego z drzewostanów rosnących na różnych siedliskowych typach lasu. (Variability of selected features of macrostructure and density of Norway spruce wood (Picea abies (L.) Karst.) from stands growing in different forest habitats). Sylwan 2019, 163, 209–215. [Google Scholar]
- Jaakkola, T.; Mäkinen, H.; Saranpää, P. Wood density in Norway spruce: Changes with thinning intensity and tree age. Can. J. For. Res. 2005, 35, 1767–1778. [Google Scholar] [CrossRef]
- Cao, T.; Valsta, L.; Härkönen, S.; Saranpää, P.; Mäkelä, A. Effects of thinning and fertilization on wood properties and economic returns for Norway spruce. For. Ecol. Manag. 2008, 256, 1280–1289. [Google Scholar] [CrossRef]
- Michalec, K. Wpływ wskaźnika zadrzewienia drzewostanu na wybrane cechy makrostruktury i gęstość drewna świerkowego (Picea abies (L.) Karst.). (Effect of stand density index on selected features of macrostructure and density of Norway spruce (Picea abies (L.) Karst.) wood). Sylwan 2020, 164, 719–725. [Google Scholar]
- Michalec, K.; Wąsik, R.; Pająk, M.; Sikora, F. Zmienność wybranych cech makrostruktury i gęstości drewna świerkowego pochodzącego z drzewostanów gospodarczych i terenów pogórniczych. (Variability of selected features of macrostructure and density of spruce wood from commercial stands and post−mining areas). Sylwan 2020, 164, 10–15. [Google Scholar]
- Nabais, C.; Hansen, J.K.; David-Schwartz, R.; Klisz, M.; López, R.; Rozenberg, P. The effect of climate on wood density: What provenance trials tell us? For. Ecol. Manag. 2018, 408, 148–156. [Google Scholar] [CrossRef]
- Grochowski, J. Dendrometria. (Forest Mensuration); PWRiL: Warsaw, Poland, 1973; pp. 342–349. [Google Scholar]
- Biotronik. Przyrostomierz SGM wp. (SGM wp Increment Meter); Biotronik: Warsaw, Poland, 2001. [Google Scholar]
- Olesen, P.O. The Water Displacement Method; The Royal Veterinary and Agricultural University of Copenhagen: Copenhagen, Denmark, 1971; pp. 1–57. [Google Scholar]
- Kot, S.M.; Jakubowski, J.; Sokołowski, A. Statystyka. (Statistics); Difin: Warsaw, Poland, 2007; pp. 299–315. [Google Scholar]
- Stat Soft. Statistica, version 12; TIBCO Software Inc.: Palo Alto, CA, USA, 2016. [Google Scholar]
- Wąsik, R.; Michalec, K.; Barszcz, A. The variability of certain macrostructural features and the density of grand fir (Abies grandis Lindl.) wood from selected stands in southern Poland. Drew. Pr. Nauk. Donies. Komun. 2015, 195, 45–58. [Google Scholar]
- Hapla, F.; Kubalek, S.; Bak, M.; Németh, R. Timber grade oriented analysis of Abies grandis trees’ ovendry density with different growth rates, part II.: Effect of the trees’ social position in the forest on the variability of ovendry density. Wood Res. 2014, 59, 273–282. [Google Scholar]
- Alteyrac, J.; Zhang, S.Y.; Cloutier, A.; Ruel, J.-C. Influence of stand density on ring width and wood density at different sampling heights in black spruce (Picea mariana (MILL.) B.S.P.). Wood Fiber Sci. 2005, 37, 83–94. [Google Scholar]
- Gryc, V.; Horáček, P. Variability in density of spruce (Picea abies (L.) Karst.) wood with the presence of reaction wood. J. For. Sci. 2007, 53, 129–137. [Google Scholar] [CrossRef] [Green Version]


| Regional Directorate of the State Forests, Forest District, Subdistrict, Number of Plot | Forest Site | Species Composition | Age (Year) | Stocking Index | Regional Directorate of the State Forests, Forest District, Subdistrict, Number of Plot | Forest Site | Species Composition | Age (Year) | Stocking Index |
|---|---|---|---|---|---|---|---|---|---|
| Olsztyn Młynary Srebrny Potok No 1 | Lsw | 7 Spruce 1 Beech 1 Spruce 1 Beech | 101 101 76 76 | 0.7 | Wrocław Śnieżka Karpacz No 15 | BG | 10 Spruce | 128 | 0.7 |
| Olsztyn Wichrowo Piotraszewo No 2 | LMsw | 6 Spruce 2 Pine 2 Spruce | 120 120 83 | 0.6 | Wrocław Kamienna Góra Jarkowice No 16 | BMG | 10 Spruce | 114 | 1.0 |
| Olsztyn Zaporowo Borek No 3 | BMw | 7 Spruce 1 Birch 1 Spruce 1 Pine | 93 73 53 133 | 0.4 | Wrocław Zdroje Piekiełko No 17 | LG | 9 Spruce 1 Larch | 128 128 | 0.9 |
| Olsztyn Górowo Iławeckie Gałajny No 4 | BMsw | 6 Spruce 2 Birch 1 Pine 1 Oak | 95 70 70 95 | 0.9 | Wrocław Lądek Zdrój Kamienica No 18 | BMG | 10 Spruce | 106 | 0.9 |
| Olsztyn Bartoszyce Kamieniec No 5 | Lsw | 6 Spruce 3 Spruce 1 Birch | 96 66 66 | 0.6 | Wrocław Lądek Zdrój Kamienica No 19 | BMG | 10 Spruce | 101 | 1.1 |
| Olsztyn Mrągowo Dębowo No 6 | Lsw | 9 Spruce 1 Birch | 98 98 | 0.9 | Katowice Wisła Przysłup No 20 | BWG | 7 Spruce 3 Spruce | 90 70 | 0.9 |
| Olsztyn Srokowo Kronowo No 7 | LMsw | 7 Spruce 2 Pine 1 Birch | 100 100 100 | 0.7 | Katowice Węgierska Górka Zielona No 21 | LMG | 10 Spruce | 120 | 0.9 |
| Białystok Giżycko Zielony Dwór No 8 | Lsw | 6 Spruce 2 Oak 2 Hornbeam | 94 94 94 | 0.9 | Katowice Węgierska Górka Skrzyczne No 22 | LMG | 5 Spruce 4 Fir 1 Beech | 90 60 30 | 0.8 |
| Białystok Borki Diabla Góra No 9 | BMw | 10 Spruce | 107 | 0.5 | Katowice Jeleśnia Ślemień No 23 | LG | 6 Spruce 3 Fir 1 Beech | 90 60 40 | 0.8 |
| Białystok Olecko Dąbrówki No 10 | BMsw | 9 Spruce 1 Oak | 100 100 | 0.5 | Katowice Bielsko Biła No 24 | BMG | 6 Spruce 3 Spruce 1 Beech | 111 91 61 | 1.3 |
| Białystok Suwałki Pijawne No 11 | BMsw | 7 Spruce 1 Pine 2 Spruce | 120 120 94 | 0.5 | Tatrzański Park Narodowy Morskie Oko No 25 | BWG | 10 Spruce | 125 | 1.2 |
| Białystok Augustów Zyliny No 12 | BMw | 6 Spruce 4 Spruce | 120 76 | 0.3 | Tatrzański Park Narodowy Łysa Polana No 26 | LG | 7 Spruce 2 Spruce 1 Spruce | 110 85 130 | 0.8 |
| Wrocław Szklarska Poręba Szronowiec No 13 | LMG | 9 Spruce 1 Birch | 94 94 | 0.8 | Kraków Krościenko Czarna Woda No 27 | LMG | 7 Spruce 1 Fir 1 Beech 1 Beech | 105 105 105 75 | 0.7 |
| Wrocław Śnieżka Karpacz No 14 | BWG | 10 Spruce | 128 | 0.8 | Kraków Gorlice Małastów No 28 | LG | 5 Spruce 4 Fir 1 Pine | 92 92 92 | 0.3 |
| Number of Sections | Section Number | I | II | III | IV | V | VI | VII | VIII | IX | X | XI |
|---|---|---|---|---|---|---|---|---|---|---|---|---|
| Statistics | ||||||||||||
| 4 | Average | 1.64 | 2.65 | 3.27 | 3.09 | |||||||
| Median | 1.44 | 2.52 | 2.98 | 2.92 | ||||||||
| Min | 0.34 | 0.58 | 0.46 | 0.90 | ||||||||
| Max | 3.86 | 5.76 | 6.98 | 6.14 | ||||||||
| Standard deviation | 0.89 | 1.34 | 1.67 | 1.32 | ||||||||
| Coefficient of variation | 54.50 | 50.65 | 51.22 | 42.80 | ||||||||
| Significant differences | a | a | a | a | ||||||||
| 5 | Average | 1.69 | 2.24 | 3.00 | 3.21 | 3.22 | ||||||
| Median | 1.14 | 1.96 | 2.75 | 2.97 | 3.08 | |||||||
| Min | 0.38 | 0.64 | 0.63 | 1.13 | 0.71 | |||||||
| Max | 7.37 | 6.01 | 6.35 | 8.02 | 11.89 | |||||||
| Standard deviation | 1.37 | 1.30 | 1.40 | 1.45 | 1.65 | |||||||
| Coefficient of variation | 80.56 | 58.08 | 46.58 | 45.21 | 51.10 | |||||||
| Significant differences | a | b | ab | ab | ab | |||||||
| 6 | Average | 2.13 | 2.47 | 2.87 | 3.43 | 3.56 | 3.57 | |||||
| Median | 1.79 | 2.24 | 2.62 | 3.05 | 3.19 | 3.17 | ||||||
| Min | 0.37 | 0.50 | 0.82 | 0.65 | 1.25 | 1.20 | ||||||
| Max | 6.53 | 7.64 | 6.86 | 7.96 | 7.70 | 7.98 | ||||||
| Standard deviation | 1.43 | 1.43 | 1.47 | 1.63 | 1.43 | 1.61 | ||||||
| Coefficient of variation | 67.23 | 57.84 | 51.30 | 47.64 | 40.23 | 44.99 | ||||||
| Significant differences | a | b | a | ab | ab | ab | ||||||
| 7 | Average | 1.88 | 2.43 | 2.86 | 3.41 | 3.61 | 3.54 | 3.62 | ||||
| Median | 1.48 | 2.08 | 2.69 | 3.01 | 3.46 | 3.23 | 3.32 | |||||
| Min | 0.34 | 0.56 | 0.64 | 1.08 | 1.11 | 0.92 | 0.82 | |||||
| Max | 7.29 | 8.14 | 7.42 | 11.45 | 10.64 | 12.43 | 13.10 | |||||
| Standard deviation | 1.36 | 1.39 | 1.47 | 1.78 | 1.73 | 1.85 | 2.07 | |||||
| Coefficient of variation | 72.50 | 57.35 | 51.49 | 52.22 | 47.99 | 52.12 | 57.26 | |||||
| Significant differences | a | b | a | ab | ab | ab | ab | |||||
| 8 | Average | 1.84 | 2.10 | 2.77 | 3.20 | 3.28 | 3.51 | 3.25 | 3.72 | |||
| Median | 1.46 | 1.88 | 2.18 | 2.81 | 3.00 | 3.48 | 3.19 | 3.45 | ||||
| Min | 0.49 | 0.48 | 0.89 | 1.03 | 0.80 | 1.10 | 0.57 | 0.50 | ||||
| Max | 5.06 | 4.35 | 9.52 | 8.25 | 7.05 | 8.11 | 8.18 | 15.78 | ||||
| Standard deviation | 1.19 | 0.99 | 1.73 | 1.85 | 1.69 | 1.74 | 1.55 | 2.33 | ||||
| Coefficient of variation | 64.88 | 47.16 | 62.43 | 57.76 | 51.58 | 49.72 | 47.73 | 62.62 | ||||
| Significant differences | a | b | - | a | ab | ab | ab | ab | ||||
| 9 | Average | 2.01 | 1.97 | 2.52 | 3.11 | 3.12 | 3.64 | 3.61 | 3.51 | 3.70 | ||
| Median | 1.61 | 1.72 | 2.29 | 2.73 | 2.95 | 3.52 | 3.38 | 3.27 | 3.31 | |||
| Min | 0.52 | 0.69 | 0.91 | 0.79 | 0.71 | 0.84 | 0.88 | 1.17 | 1.56 | |||
| Max | 9.44 | 4.96 | 5.43 | 8.86 | 7.12 | 7.61 | 7.90 | 6.20 | 7.96 | |||
| Standard deviation | 1.65 | 0.96 | 1.09 | 1.67 | 1.28 | 1.55 | 1.57 | 1.46 | 1.57 | |||
| Coefficient of variation | 81.98 | 48.74 | 43.44 | 53.64 | 40.94 | 42.65 | 43.53 | 41.59 | 42.45 | |||
| Significant differences | a | b | c | ab | ab | abc | ab | ab | abc | |||
| 10 | Average | 2.51 | 2.34 | 2.48 | 2.99 | 3.64 | 3.64 | 3.79 | 3.83 | 3.87 | 3.79 | |
| Median | 2.30 | 2.06 | 1.96 | 2.32 | 3.27 | 3.08 | 3.68 | 3.94 | 3.83 | 3.48 | ||
| Min | 0.43 | 0.77 | 1.04 | 1.14 | 1.06 | 1.19 | 1.68 | 2.25 | 2.38 | 0.99 | ||
| Max | 6.46 | 4.92 | 5.68 | 6.97 | 9.60 | 8.55 | 6.93 | 5.79 | 6.37 | 7.41 | ||
| Standard deviation | 1.42 | 1.25 | 1.28 | 1.67 | 1.81 | 1.72 | 1.43 | 1.08 | 1.05 | 1.61 | ||
| Coefficient of variation | 56.58 | 53.48 | 51.53 | 55.75 | 49.63 | 47.15 | 37.66 | 28.21 | 27.12 | 42.53 | ||
| Significant differences | a | b | c | - | - | - | b | abc | abc | b | ||
| 11 | Average | 2.68 | 2.29 | 2.49 | 3.09 | 3.50 | 3.60 | 4.04 | 4.06 | 4.01 | 3.86 | 3.86 |
| Median | 2.77 | 1.89 | 2.17 | 2.67 | 3.01 | 2.91 | 3.59 | 3.69 | 3.46 | 3.60 | 3.56 | |
| Min | 0.41 | 0.72 | 1.04 | 1.36 | 1.30 | 1.38 | 1.63 | 1.81 | 2.05 | 1.43 | 0.70 | |
| Max | 7.84 | 5.58 | 5.19 | 6.42 | 10.16 | 9.02 | 9.92 | 10.54 | 9.45 | 11.08 | 11.74 | |
| Standard deviation | 1.80 | 1.16 | 1.14 | 1.40 | 1.83 | 1.86 | 2.03 | 1.83 | 1.83 | 1.76 | 1.93 | |
| Coefficient of variation | 66.89 | 50.68 | 45.75 | 45.25 | 52.29 | 51.74 | 50.26 | 45.03 | 45.59 | 45.69 | 50.07 | |
| Significant differences | a | b | c | - | - | - | bc | bc | bc | abc | - |
| Number of Sections | Section Number | I | II | III | IV | V | VI | VII | VIII | IX | X | XI |
|---|---|---|---|---|---|---|---|---|---|---|---|---|
| Statistics | ||||||||||||
| 4 | Average | 28.89 | 23.34 | 24.11 | 27.44 | |||||||
| Median | 27.33 | 21.43 | 23.41 | 28.01 | ||||||||
| Min | 10.57 | 8.90 | 8.60 | 11.87 | ||||||||
| Max | 51.63 | 56.47 | 43.74 | 51.86 | ||||||||
| Standard deviation | 9.15 | 10.17 | 8.64 | 10.64 | ||||||||
| Coefficient of variation | 31.68 | 43.59 | 35.82 | 38.78 | ||||||||
| Significant differences | a | a | - | - | ||||||||
| 5 | Average | 28.02 | 23.83 | 22.42 | 21.96 | 26.29 | ||||||
| Median | 27.68 | 22.63 | 21.93 | 21.31 | 26.65 | |||||||
| Min | 8.05 | 7.59 | 7.43 | 3.90 | 5.15 | |||||||
| Max | 64.95 | 57.57 | 51.60 | 49.79 | 56.73 | |||||||
| Standard deviation | 8.81 | 9.37 | 8.84 | 9.70 | 10.69 | |||||||
| Coefficient of variation | 31.43 | 39.31 | 39.44 | 44.19 | 40.67 | |||||||
| Significant differences | a | a | a | a | - | |||||||
| 6 | Average | 26.10 | 24.24 | 21.66 | 20.34 | 20.15 | 25.80 | |||||
| Median | 27.02 | 23.97 | 21.30 | 20.93 | 19.96 | 25.92 | ||||||
| Min | 7.64 | 7.20 | 4.70 | 2.97 | 3.17 | 5.80 | ||||||
| Max | 47.38 | 58.14 | 58.44 | 42.65 | 70.28 | 74.80 | ||||||
| Standard deviation | 8.55 | 10.30 | 9.72 | 9.63 | 9.75 | 11.41 | ||||||
| Coefficient of variation | 32.75 | 42.48 | 44.88 | 47.35 | 48.42 | 44.21 | ||||||
| Significant differences | a | - | a | ab | ac | bc | ||||||
| 7 | Average | 25.87 | 23.42 | 21.45 | 17.67 | 17.15 | 19.54 | 24.58 | ||||
| Median | 26.01 | 23.54 | 20.48 | 17.69 | 17.35 | 19.24 | 24.73 | |||||
| Min | 9.47 | 11.00 | 6.42 | 3.85 | 5.36 | 3.83 | 3.37 | |||||
| Max | 44.54 | 43.79 | 44.86 | 36.58 | 32.93 | 44.98 | 56.82 | |||||
| Standard deviation | 7.72 | 7.31 | 8.72 | 8.05 | 7.30 | 9.05 | 11.15 | |||||
| Coefficient of variation | 29.83 | 31.24 | 40.64 | 45.58 | 42.56 | 46.31 | 45.37 | |||||
| Significant differences | a | b | a | abc | abd | a | cd | |||||
| 8 | Average | 26.68 | 23.71 | 21.88 | 19.98 | 21.49 | 21.00 | 21.70 | 24.60 | |||
| Median | 25.01 | 24.21 | 22.36 | 18.81 | 21.98 | 21.27 | 20.10 | 25.20 | ||||
| Min | 10.43 | 12.79 | 4.00 | 4.33 | 4.25 | 4.30 | 7.23 | 5.17 | ||||
| Max | 45.68 | 43.71 | 53.37 | 46.15 | 45.88 | 57.02 | 36.68 | 47.90 | ||||
| Standard deviation | 8.06 | 7.52 | 9.74 | 9.63 | 9.25 | 10.85 | 8.69 | 10.73 | ||||
| Coefficient of variation | 30.23 | 31.71 | 44.52 | 48.18 | 43.04 | 51.67 | 40.07 | 43.60 | ||||
| Significant differences | a | - | - | a | - | - | - | - | ||||
| 9 | Average | 26.05 | 24.78 | 24.87 | 22.33 | 19.90 | 18.68 | 20.09 | 19.91 | 23.14 | ||
| Median | 26.07 | 24.62 | 22.22 | 21.46 | 19.72 | 17.76 | 18.15 | 19.12 | 21.53 | |||
| Min | 8.50 | 6.74 | 8.89 | 4.62 | 5.22 | 4.73 | 5.67 | 6.15 | 6.20 | |||
| Max | 43.91 | 47.79 | 49.20 | 40.03 | 35.29 | 38.43 | 34.50 | 37.55 | 49.85 | |||
| Standard deviation | 7.14 | 8.49 | 8.85 | 9.50 | 7.36 | 8.70 | 7.58 | 8.32 | 10.58 | |||
| Coefficient of variation | 27.42 | 34.26 | 35.59 | 42.56 | 36.98 | 46.59 | 37.73 | 41.78 | 45.70 | |||
| Significant differences | a | - | - | - | a | a | a | a | - | |||
| 10 | Average | 24.34 | 25.17 | 27.29 | 24.55 | 24.22 | 21.40 | 17.87 | 17.92 | 21.20 | 21.91 | |
| Median | 23.47 | 23.32 | 25.32 | 22.68 | 19.23 | 18.13 | 17.93 | 16.24 | 16.90 | 18.90 | ||
| Min | 12.38 | 9.70 | 7.55 | 11.10 | 8.10 | 5.40 | 4.88 | 3.45 | 5.12 | 6.90 | ||
| Max | 48.06 | 57.12 | 77.49 | 71.86 | 64.92 | 59.26 | 43.71 | 45.22 | 49.48 | 44.10 | ||
| Standard deviation | 8.14 | 11.23 | 14.05 | 13.20 | 14.10 | 13.14 | 9.66 | 10.54 | 12.09 | 10.39 | ||
| Coefficient of variation | 33.45 | 44.63 | 51.51 | 53.76 | 58.22 | 61.38 | 54.07 | 58.80 | 57.02 | 47.42 | ||
| Significant differences | - | - | - | - | - | - | - | - | - | - | ||
| 11 | Average | 23.61 | 25.27 | 23.36 | 20.75 | 20.80 | 19.51 | 18.21 | 17.32 | 18.45 | 17.86 | 22.65 |
| Median | 23.37 | 25.76 | 24.78 | 23.76 | 20.61 | 17.99 | 17.00 | 15.95 | 18.63 | 17.68 | 18.16 | |
| Min | 10.23 | 10.45 | 7.88 | 3.43 | 2.60 | 4.17 | 2.70 | 2.35 | 4.25 | 7.05 | 3.40 | |
| Max | 31.49 | 43.91 | 34.83 | 37.62 | 44.72 | 41.54 | 44.14 | 35.52 | 36.56 | 28.42 | 69.06 | |
| Standard deviation | 5.69 | 6.89 | 7.24 | 8.13 | 8.53 | 8.86 | 8.68 | 8.22 | 7.24 | 5.31 | 13.17 | |
| Coefficient of variation | 24.12 | 27.26 | 30.97 | 39.18 | 40.99 | 45.42 | 47.67 | 47.48 | 39.21 | 29.72 | 58.14 | |
| Significant differences | a | b | - | - | - | - | b | ab | - | b | - |
| Number of Sections | Section Number | I | II | III | IV | V | VI | VII | VIII | IX | X | XI |
|---|---|---|---|---|---|---|---|---|---|---|---|---|
| Statistics | ||||||||||||
| 4 | Average | 0.380 | 0.343 | 0.326 | 0.359 | |||||||
| Median | 0.371 | 0.335 | 0.323 | 0.350 | ||||||||
| Min | 0.270 | 0.254 | 0.248 | 0.235 | ||||||||
| Max | 0.530 | 0.522 | 0.486 | 0.569 | ||||||||
| Standard deviation | 0.051 | 0.053 | 0.044 | 0.059 | ||||||||
| Coefficient of variation | 13.43 | 15.53 | 13.61 | 16.54 | ||||||||
| Significant differences | a | a | ab | b | ||||||||
| 5 | Average | 0.389 | 0.353 | 0.336 | 0.344 | 0.377 | ||||||
| Median | 0.395 | 0.345 | 0.332 | 0.331 | 0.364 | |||||||
| Min | 0.271 | 0.254 | 0.261 | 0.240 | 0.251 | |||||||
| Max | 0.535 | 0.593 | 0.519 | 0.602 | 0.659 | |||||||
| Standard deviation | 0.058 | 0.055 | 0.058 | 0.062 | 0.075 | |||||||
| Coefficient of variation | 14.95 | 15.47 | 17.28 | 18.07 | 19.89 | |||||||
| Significant differences | a | a | ab | ac | bc | |||||||
| 6 | Average | 0.386 | 0.366 | 0.346 | 0.339 | 0.350 | 0.365 | |||||
| Median | 0.379 | 0.356 | 0.335 | 0.322 | 0.334 | 0.351 | ||||||
| Min | 0.267 | 0.255 | 0.252 | 0.252 | 0.265 | 0.271 | ||||||
| Max | 0.532 | 0.650 | 0.536 | 0.524 | 0.575 | 0.587 | ||||||
| Standard deviation | 0.058 | 0.064 | 0.059 | 0.060 | 0.065 | 0.059 | ||||||
| Coefficient of variation | 14.98 | 17.50 | 16.94 | 17.64 | 18.44 | 16.29 | ||||||
| Significant differences | a | b | a | abc | a | c | ||||||
| 7 | Average | 0.376 | 0.352 | 0.340 | 0.325 | 0.319 | 0.333 | 0.385 | ||||
| Median | 0.378 | 0.347 | 0.324 | 0.314 | 0.311 | 0.326 | 0.372 | |||||
| Min | 0.283 | 0.247 | 0.225 | 0.239 | 0.222 | 0.263 | 0.266 | |||||
| Max | 0.516 | 0.574 | 0.631 | 0.608 | 0.487 | 0.512 | 0.628 | |||||
| Standard deviation | 0.054 | 0.059 | 0.065 | 0.063 | 0.051 | 0.046 | 0.080 | |||||
| Coefficient of variation | 14.43 | 16.79 | 19.26 | 19.40 | 15.85 | 13.72 | 20.84 | |||||
| Significant differences | a | b | ac | abd | abe | af | cdef | |||||
| 8 | Average | 0.381 | 0.362 | 0.354 | 0.349 | 0.342 | 0.339 | 0.355 | 0.370 | |||
| Median | 0.371 | 0.349 | 0.334 | 0.337 | 0.322 | 0.327 | 0.341 | 0.359 | ||||
| Min | 0.258 | 0.285 | 0.275 | 0.258 | 0.251 | 0.238 | 0.260 | 0.262 | ||||
| Max | 0.524 | 0.530 | 0.491 | 0.520 | 0.524 | 0.451 | 0.526 | 0.636 | ||||
| Standard deviation | 0.058 | 0.055 | 0.056 | 0.056 | 0.064 | 0.052 | 0.068 | 0.079 | ||||
| Coefficient of variation | 15.21 | 15.12 | 15.73 | 16.13 | 18.75 | 15.20 | 19.28 | 21.23 | ||||
| Significant differences | a | - | - | - | a | a | - | - | ||||
| 9 | Average | 0.378 | 0.364 | 0.358 | 0.348 | 0.337 | 0.321 | 0.322 | 0.335 | 0.351 | ||
| Median | 0.370 | 0.351 | 0.350 | 0.329 | 0.326 | 0.316 | 0.317 | 0.316 | 0.348 | |||
| Min | 0.307 | 0.266 | 0.278 | 0.254 | 0.264 | 0.260 | 0.242 | 0.281 | 0.262 | |||
| Max | 0.455 | 0.456 | 0.459 | 0.648 | 0.447 | 0.416 | 0.391 | 0.465 | 0.459 | |||
| Standard deviation | 0.041 | 0.044 | 0.047 | 0.068 | 0.042 | 0.041 | 0.040 | 0.043 | 0.049 | |||
| Coefficient of variation | 10.95 | 12.15 | 13.10 | 19.38 | 12.50 | 12.69 | 12.30 | 12.84 | 13.83 | |||
| Significant differences | a | b | c | a | a | abc | abc | a | - | |||
| 10 | Average | 0.366 | 0.363 | 0.358 | 0.346 | 0.341 | 0.328 | 0.331 | 0.328 | 0.335 | 0.346 | |
| Median | 0.354 | 0.364 | 0.351 | 0.338 | 0.331 | 0.318 | 0.322 | 0.322 | 0.315 | 0.333 | ||
| Min | 0.286 | 0.290 | 0.280 | 0.277 | 0.277 | 0.253 | 0.263 | 0.265 | 0.287 | 0.276 | ||
| Max | 0.507 | 0.524 | 0.502 | 0.443 | 0.502 | 0.460 | 0.441 | 0.424 | 0.506 | 0.437 | ||
| Standard deviation | 0.052 | 0.048 | 0.051 | 0.040 | 0.050 | 0.047 | 0.049 | 0.047 | 0.051 | 0.045 | ||
| Coefficient of variation | 14.28 | 13.33 | 14.37 | 11.48 | 14.71 | 14.49 | 14.77 | 14.29 | 15.10 | 13.05 | ||
| Significant differences | - | - | - | - | - | - | - | - | - | - | ||
| 11 | Average | 0.362 | 0.355 | 0.344 | 0.334 | 0.331 | 0.328 | 0.321 | 0.320 | 0.321 | 0.328 | 0.368 |
| Median | 0.358 | 0.357 | 0.348 | 0.330 | 0.338 | 0.320 | 0.309 | 0.324 | 0.319 | 0.326 | 0.339 | |
| Min | 0.285 | 0.274 | 0.275 | 0.257 | 0.263 | 0.261 | 0.260 | 0.232 | 0.251 | 0.255 | 0.234 | |
| Max | 0.465 | 0.426 | 0.408 | 0.398 | 0.401 | 0.447 | 0.426 | 0.424 | 0.427 | 0.396 | 0.637 | |
| Standard deviation | 0.042 | 0.042 | 0.037 | 0.040 | 0.042 | 0.046 | 0.043 | 0.040 | 0.038 | 0.034 | 0.086 | |
| Coefficient of variation | 11.56 | 11.83 | 10.69 | 11.91 | 12.71 | 14.11 | 13.51 | 12.38 | 11.87 | 10.45 | 23.32 | |
| Significant differences | a | - | - | - | - | - | a | a | a | - | - |
| Features of Wood | R (Spearmann) | t (N-2) | p | Equations of Regression Models |
|---|---|---|---|---|
| Annual growth rings and share of latewood | −0.618 | −41.400 | 0.000 | y = 31.6972 − 2.9754xx |
| Annual growth rings and wood density | −0.507 | −31.028 | 0.000 | y = 0.3908 − 0.0133xx |
| Share of latewood and wood density | 0.603 | 39.893 | 0.000 | y = 0.2757 + 0.0033xx |
Publisher’s Note: MDPI stays neutral with regard to jurisdictional claims in published maps and institutional affiliations. |
© 2022 by the authors. Licensee MDPI, Basel, Switzerland. This article is an open access article distributed under the terms and conditions of the Creative Commons Attribution (CC BY) license (https://creativecommons.org/licenses/by/4.0/).
Share and Cite
Michalec, K.; Wąsik, R. Variation of Selected Macrostructure Features and Density Wood of the European Spruce (Picea abies (L.) Karst.) in the Cross-Section of Trees over 90-Years-Old in Poland. Forests 2022, 13, 1116. https://doi.org/10.3390/f13071116
Michalec K, Wąsik R. Variation of Selected Macrostructure Features and Density Wood of the European Spruce (Picea abies (L.) Karst.) in the Cross-Section of Trees over 90-Years-Old in Poland. Forests. 2022; 13(7):1116. https://doi.org/10.3390/f13071116
Chicago/Turabian StyleMichalec, Krzysztof, and Radosław Wąsik. 2022. "Variation of Selected Macrostructure Features and Density Wood of the European Spruce (Picea abies (L.) Karst.) in the Cross-Section of Trees over 90-Years-Old in Poland" Forests 13, no. 7: 1116. https://doi.org/10.3390/f13071116
APA StyleMichalec, K., & Wąsik, R. (2022). Variation of Selected Macrostructure Features and Density Wood of the European Spruce (Picea abies (L.) Karst.) in the Cross-Section of Trees over 90-Years-Old in Poland. Forests, 13(7), 1116. https://doi.org/10.3390/f13071116