Abstract
Forestlands not only provide the conditions that support forested environments, but they also generate natural resources and ecosystem services that support human survival and social development. Using benchmark price to evaluate the economic value of forests is fast and efficient, which can function as an important tool for the improvement of forest resources management. However, information remains limited on how to establish a unified and complete benchmark price for forestland resources in China. Therefore, this study aimed to grade the forestlands and formulate the corresponding benchmark price to improve the statistical management efficiency of forestlands resources. We conducted our study in Longquan County, Zhejiang Province, where we implemented a survey and collected data focusing on forest resources planning. We classified forest resources in this area to establish a benchmark price using geographic information system (GIS) spatial analysis technology. Based on the characteristics of the survey data and the local economic and social situation, the correction coefficient of forestland price was formulated, and the economic value of forestlands resource assets was calculated accordingly. Results indicate that: (1) the forestland can be divided into five grades. The number and area of forestland increased firstly and then decreased from Grade I to Grade V. Forestland resources were concentrated in Grade II and Grade III, accounting for 62.0% of the total area. (2) The benchmark price of forestland in Longquan County was 10380, 9493, 8708, 7827 and 6771 Chinese Yuan (CNY)·hm−2 from Grade I to Grade V, respectively. The benchmark price of forestland in different grades could reflect the quality of forestland. (3) The price correction coefficient was formulated to match the benchmark price of forestland according to the forestland particularity and the external embodiment of forestland productivity level, and then, the economic value of forestland resource assets in the study area was calculated to be 22.48 million CNY accordingly. The method used in this study has the advantages of simple operation, high efficiency and a low cost. This study can provide methods for the evaluation and accounting of forestland resources, give technical support for the audit of natural resource assets of government departments, help to prepare the balance sheet of natural resources, and further prompt references for the statistical management of forest resources in similar regions and countries.
1. Introduction
Forestland is a material carrier, which is the material basis for supporting a wide range of biological resources including trees, shrubs, herbaceous plants, animals, and microorganisms. Additionally, economic, ecological, and social values are highly influenced by forest resources and forest ecosystem services [1]. Forests not only play a role in regulating the climate, purifying air, protecting soil and maintaining biodiversity, but it also provides the main raw materials used in the manufacturing industry [2,3]. Approximately 25% of the world’s population relies on forests for sustaining livelihoods, employment and food production [4]. Additionally, forests are home to more than 80% of terrestrial biodiversity and they generate biomass that aids in reducing the impacts of climate change and environmental degradation [5]. However, with the rapid development of a global social economy, the demand for forest resources is increasing, which has resulted in increased damage to forestland, where the quality of forestland has decreased significantly [6,7]. Therefore, promoting the rational utilization and asset management of forestland resources is not only helpful to protect forest land resources and improve the quality of forestland, but is also an important measure to guarantee people’s lives and maintain social harmony.
China’s forest resources are rich, diverse and extensive. However, since China’s reform and opening in 1978, a vast area of forest lands has become urbanized and converted into farmland following the drastic increase in China’s population. This rapid development of China’s social economy has led to the sharp and alarming decline in forests and forestland resources. In order to strengthen the protection and promote the rational utilization of forestland, the State Council of China issued the Outline of National Forestland Protection and Utilization Plan (2010–2020) in 2010, emphasizing the vital role that forests play in reducing impacts from climate change, maintaining the ecological environment and promoting the construction of ecological civilization [8]. According to the Ninth Forest Resources Inventory Report of China (2014–2018) [9], China’s forest coverage rate is 22.96%, forest stock is 1.756 billion m3, and the forestland area is 324 million ha. Although China’s forestland area has increased in the past 10 years, and the total area ranks among the top in the world, the forestland area per capita is only 0.61 ha, lower than one-third of the world’s average [10]. Meanwhile, the area of forest fires in China has reached 225.600 ha in the past 10 years, accounting for 0.07% of the total forest area [11], which has not only caused huge losses to the social economy, but also has caused the direct degradation of forest ecosystems. Indirectly, the sustainable development of forests and national ecological security are affected [12]. In addition, climate change affects the quality of forestland through its impacts on the circulation of nitrogen and carbon in forest soil and the emission process of various gases [13]. It is considered that there is a coupling relationship between global climate change and forestland quality degradation, and an effective response to forestland quality degradation and improvement of forest land quality is the key to cope with global climate change. Therefore, a comprehensive understanding of the quality of forestland, curbing land degradation and improving the quality of forestland are conducive to mitigating climate change and playing an important role in safeguarding national ecological security.
The forestland quality should effectively reflect the land condition, which is not only significantly influenced by the natural environment factors, but also the macro environment of social development [14]. The scientific evaluation of forestland quality and reasonable hierarchies can help forestland evaluation and management, revitalize forestland stock, promote the usufruct circulation and make the economical and intensive management of forestland resources possible [15]. This is beneficial to ensure the forestland quality and better serve the practice of forest conservation and management. Nonetheless, research that focuses on forest grading and evaluation is limited and would improve with a more thorough and detailed investigation.
At present, the studies on forest resource grading and economic evaluation mainly focus on the following aspects. One aspect is to evaluate forestland quality with the help of sub-class factors, such as topographical features and the soil conditions of forestland, and conduct graded evaluation [16,17,18]. Another aspect is the classification of forestland quality based on natural characteristics and location factors [19,20,21,22]. Methods involved in the classification of forestland quality grade include fuzzy comprehensive evaluation method [23], entropy weight method (EW) [17], analytic hierarchy process (AHP) [24], and grey correlation analysis method (TOPSIS) [25]. Forestland grading is associated with a large subject area, various influencing factors and a large amount of spatial data. The method combining computer remote sensing with geographic information systems (GIS) and other new technologies can ensure scientific and practical grading results and greatly reduce the workload. Commonly used system software related to geospatial analysis includes ArcGIS, QGIS and SAGA [26]. Among them, Arcgis is a software with multiple functions such as mapping, spatial analysis, advanced data editing and so on. The advantage of QGIS is that its mapping effect is relatively simple and easy to operate, but its function and performance are far less emphasized than Arcgis. For example, QGIS can only process spatial analysis such as the combination of two layers at the same time. Arcgis can process dozens of layers at a time. SAGA’s advantage lies in terrain analysis, but its data editing calculations and spatial analysis are not as convenient as in ArcGIS. At the same time, in the application research of GIS in forestland, it has been used in investigations about forest coverage rate, forestland degradation and the modeling of forest fire hazards [27]. Nonetheless, GIS is seldom used in the field of forestland quality classification, although it is mostly used in land use classification [28], land cover grade and the detection of surface temperature change [29], and land use and cover change assessment of the forest ecosystem [30]. In summary, although existing research on forestland classification process is well documented, most of it has emphasized the natural factors, ignoring the comprehensive consideration of location and socioeconomic factors. Besides, the research on the benchmark price of forestland is also limited, whereas previous explorations on forestland value evaluation laid a solid foundation, with a detailed investigation of forestland benchmark price.
Forestland value evaluation mainly adopts the sales comparison method (SCA), cost method and income method (IA) proposed by the International Evaluation Standard (IVS) [31,32]. Kalle et al. (2018) obtained several characteristics related to value volume by using the sales comparison method combined with specific sales curves, constructing a market price prediction model of forestland assets, and promoting the study on the value evaluation of forestland assets [33]. Marcio et al. (2011) conducted a comparative study on the three evaluation methods of forestland and discussed their advantages, disadvantages and applicability in detail [34]. In a study conducted by Kennedy et al. (2011), the impact of location and accessibility on the value of backwoods in Louisiana was analyzed through modeling with the hedonistic method and GIS [35]. Zhang et al. (2013) used the spatial feature pricing model to conduct matching analysis with forestland sales data from 2001 to 2007, and determined the main determinants of forestland price [36]. Some scholars used multiple linear regression to establish a land price model and fit the optimal benchmark forestland price model [20]. Besides, the Analytic Hierarchy Process (AHP) and Delphi method (expert opinion consulting method) are used to construct THE AHP–Delphi evaluation model of the benchmark price of forestland usufruct [24]. Although these evaluation methods have high accuracy and reliability, these processes are too complicated in the evaluation practice; especially, they are not suitable for mass evaluation business and cannot meet the service administrative management requirements.
The purpose of this study was to determine the grade of the forestland resources and establish the benchmark price system, so as to improve the efficiency of the statistical management of forestland resources. Thus, this study collected the survey data of forest resource planning and design in 2016 in Longquan county, Zhejiang province, China, and determined the grade of forestland resource and the forestland benchmark price through the combination of the factor analysis and ArcGIS spatial analysis technology. Then, the economic value of Longquan forestland resource assets were accounted for based on the forestland benchmark price. This study is helpful to implement the paid use of forestland, provide a price reference for forestland transfer and the batch evaluation business of mortgage loans, promote economical and intensive management of forestland resources, improve the quality of forestland, strengthen the sustainable utilization of forestland resources, affect climate change, and further effectively guarantee national ecological security. This study not only introduced the factor analysis and ArcGIS spatial analysis technology to explore the new method of forestland quality evaluation, but also determined the hierarchy and benchmark price based on the differences of the forestland quality, which expands the tools for the forestland value evaluation, and provides scientific evidence and methodological reference for the reasonable development and utilization of forestland policy.
2. Materials and Methods
2.1. Research Area
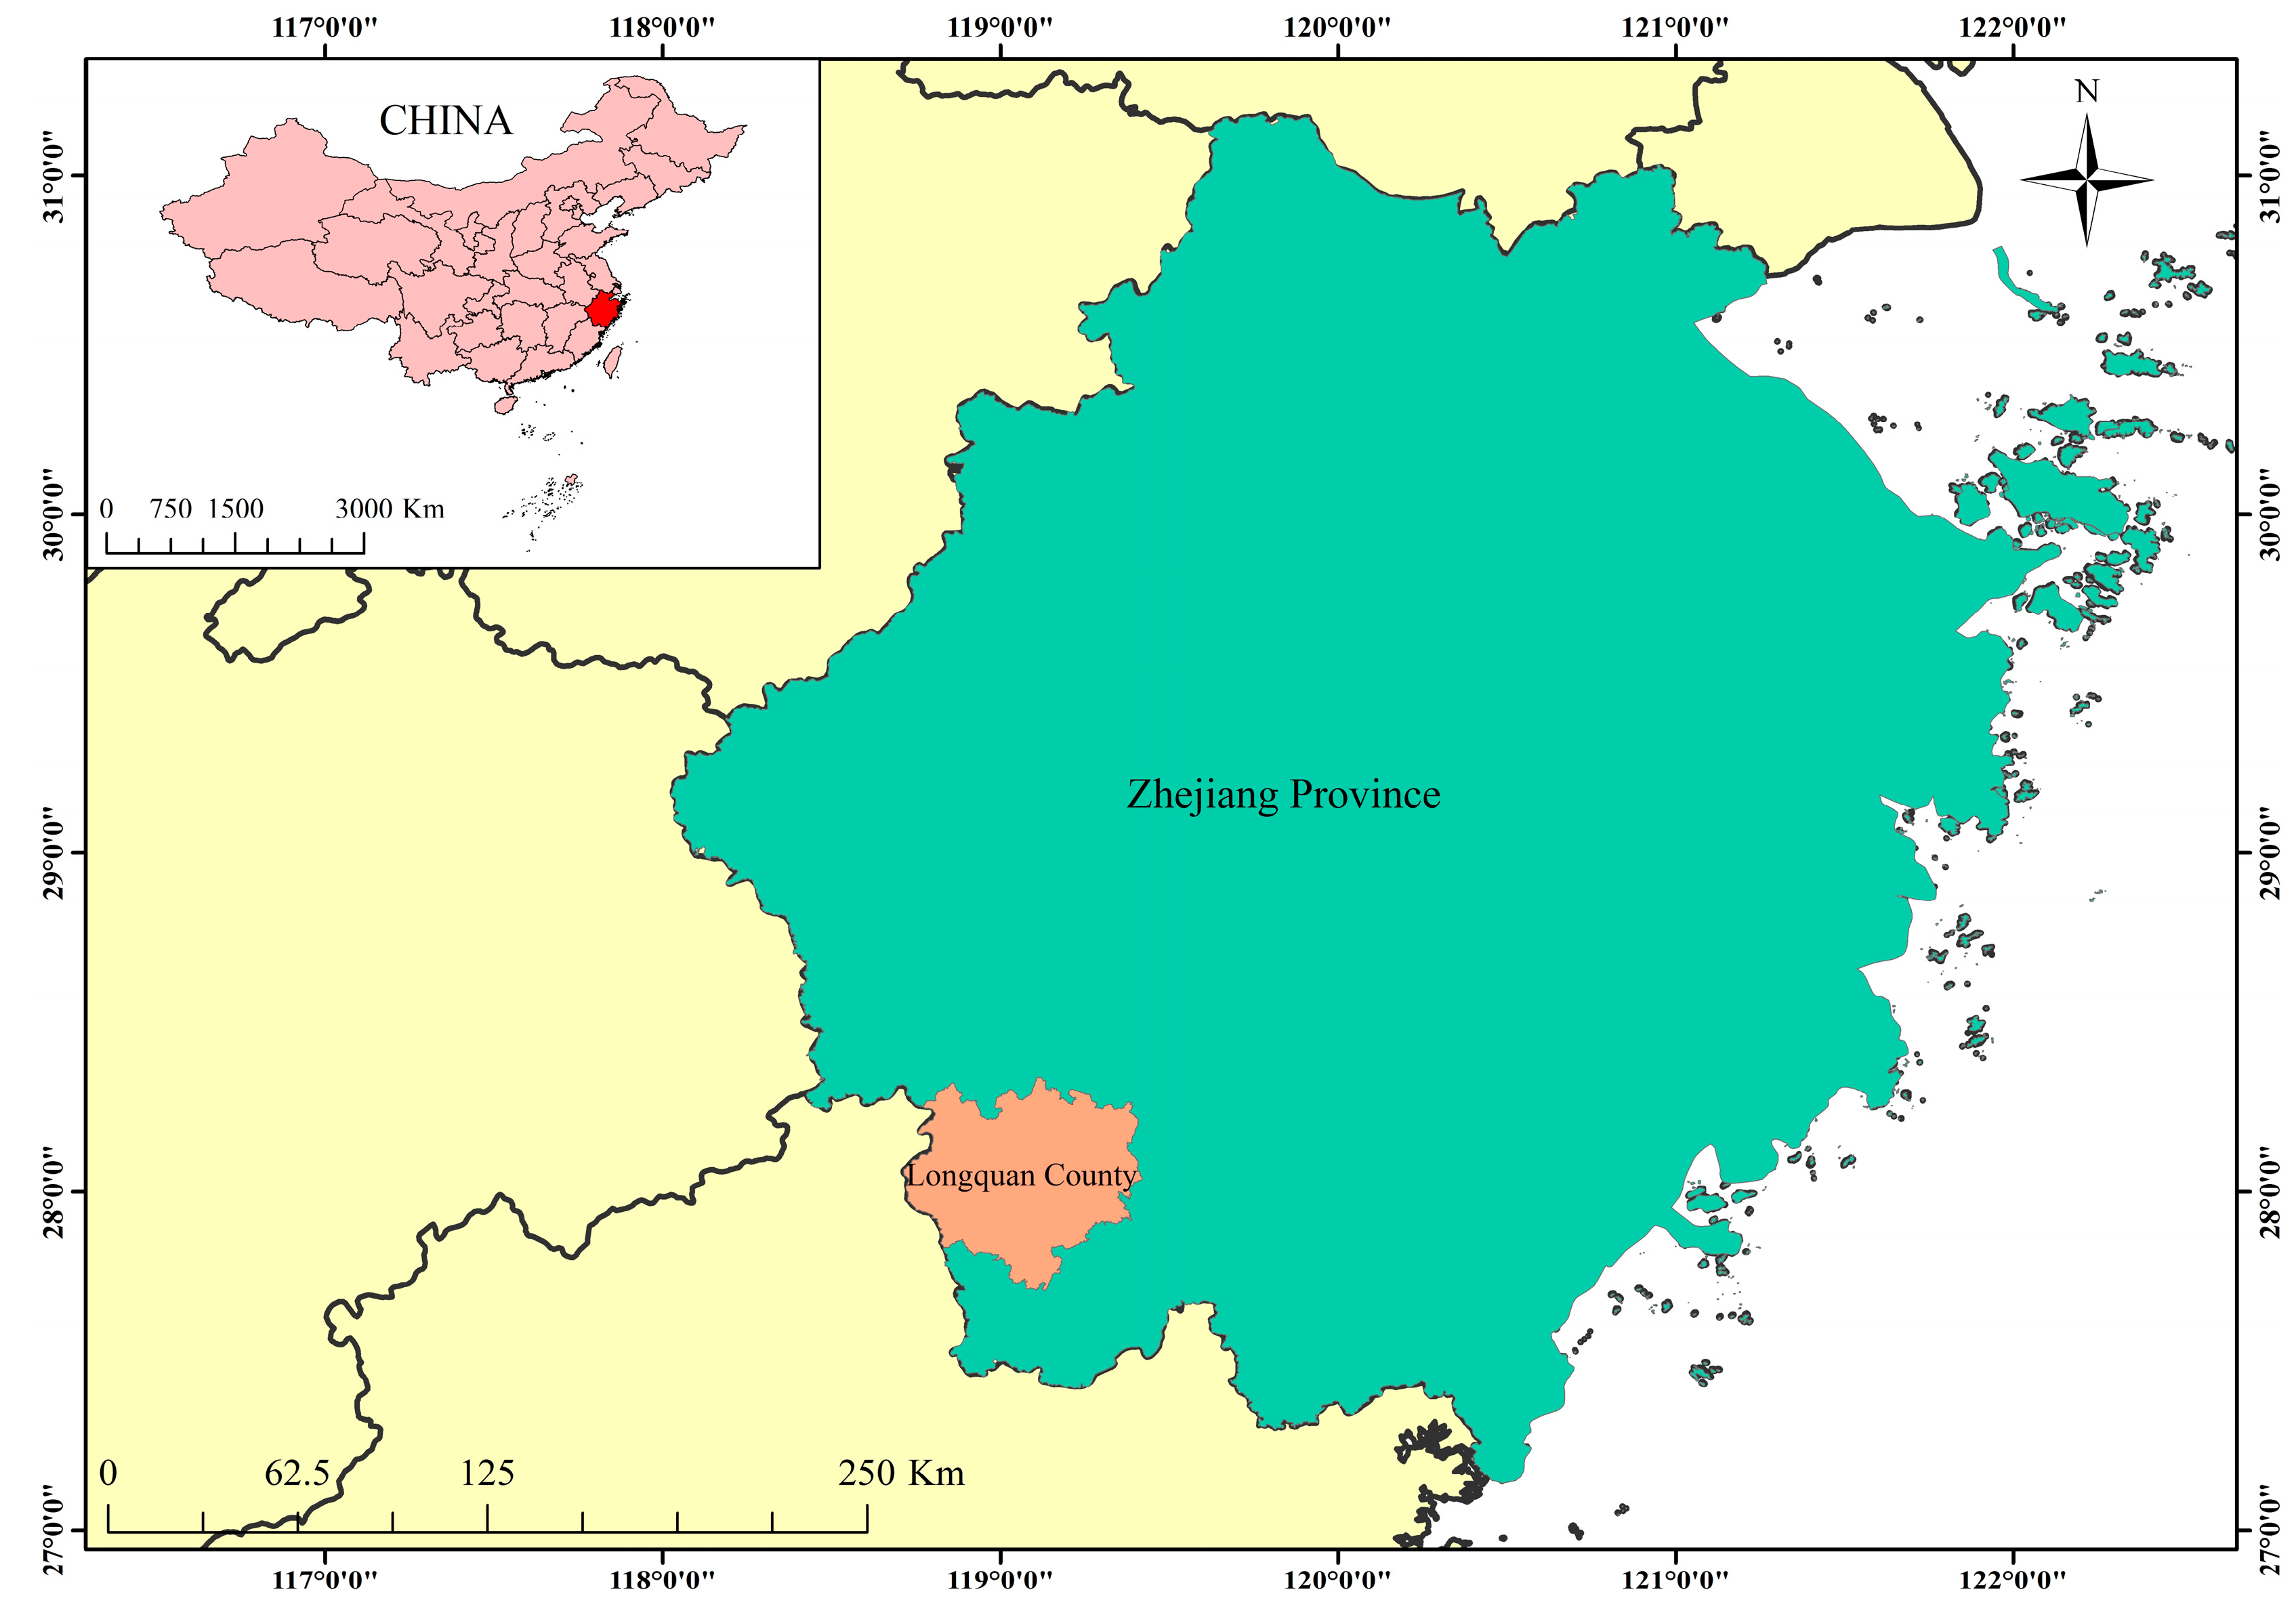
Longquan County is one of the key forest counties (cities) in south China, located in Lishui City, Zhejiang Province, known as the “Forest sea in south Zhejiang” (Figure 1). The County has 265,000 ha of land for forestry, among which forest farmers own 1.2 ha of forestland per capita, 16 times of the area for arable land. According to Zhejiang Natural Resources and Environment Statistics Yearbook, the forest coverage rate of the County is 84.38%, and the forest stock is as high as 19.87 million m3. In recent years, Longquan County continues to deepen the reform of the forest rights system, and has made remarkable achievements in cultivating forestry reform, transferring the system of forest rights and promoting a forestry information integration system. However, most of the rights to use collective forestland are concentrated in the hands of forest farmers, and the economical and intensive management of forestland is not efficient, leading to low forestland quality. This is not conducive to the sustainable management of forestland.

Figure 1.
Map of the location of the study area.
2.2. Data Collection and Processing
The benchmark price of each grade of forestland was calculated based on the expected value of forestland. At present, Cunninghamia lanceolata (Chinese fir) forests have the greatest economic benefit to Longquan County because of their high-quality wood. Cunninghamia lanceolata is subsequently the most heavily harvested of all tree species growing in this region, so Cunninghamia lanceolata was taken as the dominant tree species. According to the One-yuan Volume Table of Living Cunninghamia Lanceolata in Zhejiang Province, the timber rate is 70.0%. The basic data involved in this study contain: (1) the 2016 forest resource planning and design survey data of Longquan County, which are the latest data related to the forest resource, considering the survey is conducted once every 10 years. (2) The average sales price of Chinese fir wood was determined after a comprehensive analysis of the sales price determined for the local and surrounding areas. Logs: 1000 CNY /m3 when cutting, 0 CNY /m3 for the first thinning, 950 CNY /m3 for the second thinning; composite materials: 900 CNY /m3 for primary cutting, 850 CNY /m3 for the first thinning, 900 CNY /m3 for the second thinning. (3) The production cost of the forest operation was determined according to the local forestry production reality and the nearby state-owned forest farm. The annual cost of forest operations in the first three years was 700, 260 and 260 CNY/mu, respectively; the annual cost of forest management and protection is 8 CNY/mu. (4) The cost of timber production and operation. The design fee of the logging area is charged according to the volume of storage, and the other fees are calculated according to the volume of output. The cost of timber production mainly refers to the cost of harvesting and gathering, short-distance freight and road maintenance. Cutting area design fee: 7 CNY/m3 (according to storage); inspection fee: 9 CNY/m3; timber production and operation cost: logging 200 CNY/m3; thinning 230 CNY/m3. Sales expense is ca. 1% of sales price; the management fee is 3% of the sales price; the unforeseen fee is 1% of the sales price. (5) Taxes and fees including forestry fees, forest plant quarantine fees and others. Forestry fees: 10% of the levied price of timber; middle and young forest thinning material reduction 50%; forest plant quarantine fee: 0.2%; others: 3%. (6) Profit from timber production and operation should be calculated by 5% of timber sales revenue. (7) Harvesting age: the average local Chinese fir is felled for 26 years. The first thinning time is 10 years, the second thinning time is 16 years, and the thinning intensity is 25%. (8) The investment return rate is calculated as 6%.
The stand growth prediction model refers to the Chinese fir as follows [37]:
ArcGIS 10.2 software was used for the rasterization, reclassification and calculation of each evaluation indicator.
2.3. Research Methods
2.3.1. Forestland Grading Method
In this study, the factor method was used to classify forestland grades. According to the Regulations for Grading Agricultural Land (GB/T 28405-2012), grading agricultural land mainly includes the amendment method, factor method and sample plot method. The correction method is a method that calculates the correction coefficient on the basis of the grading results, then revises the grading results, and determines the grade. The factor method is to analyze and evaluate the natural factors, social economic factors and location factors that constitute land quality. The sample plot method is a method that establishes scoring rules for grading factors and calculates the score value of unit factors to evaluate the grading. It is difficult to select the standard sample of land because of the forestland particularity and the lack of classification results of the forestland. Thus, the factor method was more suitable for forestland classification.
In the classification of forestland by the factor method, we should first consider the differences in the natural factors of the forestland. On the other hand, we should also consider the distance between forestland and residential areas and traffic arteries, so as to facilitate the management of forest resources. ArcGIS is an efficient and complex tool that can work and analyze more efficiently, producing rigorous and meaningful results. At the same time, ArcGIS spatial analysis technology has been widely applied in natural environmental science and social science [38]. ArcGIS spatial analysis techniques including vector data rasterization, reclassification, raster calculator and partition statistics were adopted in this study.
- (1)
- Determine the grading unit
The determination of the forestland space unit is the basis of the classification. The land characteristics and location conditions of the same forestland space unit are relatively uniform. The forestland grading unit is the basis for calculating the score of each grading factor, and also the basic spatial unit for evaluating forestland grading. The small class is the smallest unit for forest management and wood production organization, and also the basic unit for forest investigation and design. Its internal structure features are basically the same. The same forest small class unit has the same business objectives and should adopt the same business measures. Thus, the small class was used as the evaluation unit of forestland grading.
- (2)
- Determination of grading index and weight value
The scientific and reasonable selection of forestland grading factors directly affects the reasonable forestland grading, and then affects the accuracy of the evaluation the benchmark price of forestland. The classification indexes that can reflect the value characteristics of forestland were selected, including natural factors, social and economic factors and location factors [39]. Natural factors reflect the quality of forestland and are influenced by climate conditions, topography, hydrology and soil. [17]. Due to the same climatic conditions in the same county, hydrological conditions may be associated with forest quality, but it is difficult to obtain accurate data. Therefore, topographic and soil indicators were selected as the natural factors based on the principle of significant difference and data accessibility [40] according to existing research results [41,42]. They contain soil type, soil layer thickness, humus thickness, slope, slope position, slope direction and altitude. Because the social and economic conditions in the same county are similar, the social and economic factors here were excluded; the location factor is closely related to the forestry production, and mainly contains timber and wood yarding distance conditions. The timber transport distance refers to the distance between the small class of forestry and nearby lumber storage yard. This study takes a small village, where the distance to the neighboring lumber storage yard is a variable, to characterize the timber transport distance; the timber logging conditions were determined through the traffic location in the survey data of forest resource planning and design. The influence of the various indicators of forestland value is different; some have a positive influence, and others may have negative influence. The soil texture, slope direction, slope positions and data given by the code of forestland value have a positive influence. The greater the soil layer and humus numerical thickness, the better the forestland quality; the greater the slope, elevation, transportation distance, the lower the value of forestland. Thus, “+” indicates positive influence and “−” indicates negative influence.
After the selection of grading indicators, each indicator has a different degree of impact on the value of forestland. It is necessary to determine the weight of each indicator to reflect the relative impact of each indicator. AHP (Analytic Hierarchy Process) and the Delphi method (expert advice consultation method) are the major methods to determine the weight value. This study focused on the applicability of ArcGIS technology in the grading of forestland, and the Delphi method (expert advice consultation method), which is easier to operate, was used to determine the weight value. The weight value of each index reflects its contribution value to forestland grade and benchmark price (Table 1).

Table 1.
The forest land grading index and weight value in Longquan County.
- (3)
- Forestland Classification
① Rasterization
The original data that need to be rasterized in this study were extracted from the vector data of the forest resources planning and design survey of Longquan county in 2016. The specific methodology involved was based on a relevant literature research [43,44] and in accordance with the relevant provisions of the Technical Regulations for Forest Resources Planning and Design Survey. For example, the soil thickness was obtained through field measurements with professional tools by a working group of a woodland sub-class. The rasterization process of the vector data of each index was completed by using the rasterization processing tool of ArcGIS software, in which the elevation and slope can be extracted from the ground elevation data to reduce the error of human investigation.
② Reclassify
The raster data of each indicator was reclassified, and the effect value was assigned to different characteristics of the indicator. A large value was assigned to the first level. Therefore, the new value of the negative indicator should be reversed, and the effect value was determined by the Delphi method (expert advice consulting method). Combined with the existing literature [39,44,45], and referring to the research methods of scholars, each indicator was classified and graded, and its function was assigned. The specific classification is shown in Table 2:
Table 2.
Assignment of indicator levels.
③ Determine grading index through the ArcGIS grid calculator
The weight of each grading index in the grading unit was multiplied by its assigned value, and the scoring results of each index were summed to obtain the grading index of the grading unit. The forestland grade was divided according to the grading index. This process was completed by the ArcGIS grid calculator.
The calculation formula is:
where, P is the rating index; Vj is the weight of grading index; pj assigns a value to the rating indicator.
④ The corresponding grading index of the grading unit in zonal statistical forestland
The forestland grading index was determined through the table display partition statistical analysis, and the forestland grading level was classified according to the grading index. The different score interval can differentiate different forestland grades. Any grading index evaluation unit can only correspond to one level of forestland. The grade level can reflect the forestland quality (including natural factor, social economy factor and location factor). There should be a gradual transition between grades, and the number of grades varies according to different forestlands, generally ranging from 3 to 7. There are two classification methods for forestland: one is the determination of total score number line, that is, the total score value of grading units is drawn on the number line, and the boundary between grades is selected where the number is rare, according to the merits of forestland. The other is the total frequency curve method, which makes frequency statistics on the grading index score of the grading unit and draws a frequency histogram. According to the actual situation of the advantages and disadvantages of forestland, the sudden change of frequency curve distribution was selected as the boundary between grades.
2.3.2. The Benchmark Price of Forestland
The expected price method was used to evaluate the benchmark price of forestland. The commonly used methods for forestland asset evaluation in China mainly contain: the annuity capitalization method, forestland cost price method, forestland expected price method and current market price method [46]. The annuity capitalization method is a method to estimate the value of forestland assets according to the appropriate return rate on the annual stable income of the assessed forestland. It is difficult to define the annual stable income amount and return rate. The forestland cost pricing method involves taking the sum of the cost of acquiring forestland and the cost of maintaining the status quo of forestland as the value of forestland asset. Nonetheless, the forestland transaction is less, and forestland acquisition fee is difficult to obtain. The current market value method is based on the current price of the same or similar forestland assets. It requires a large number of transaction cases to compare and estimate the assessed forestland assets. The forestland expected price method assumes that forestland is subjected to continuous clear-cutting and forestland benefits and costs are the same in each rotation period; then, the net benefits from the infinite rotation periods are discounted and summed as the evaluation value. The benefits and costs of rotation periods could be reasonably predicted in a feasible way in practice. Thus, the forestland expected price method was adopted as follows:
where: Bu refers to the value of forest land; Au refers to the net income of actual stand logging in u years (refers to the part of timber sales income after deducting the cost of harvesting and transportation, sales expenses, administrative expenses, financial expenses, relevant taxes and fees and reasonable profit of timber operation); Da and Db refer to the net income of thinning in year A and year B, respectively; Cj refers to the annual direct investment in forestry; V refers to the average indirect cost of forest production (including forest protection fee, forest facilities fee, experiment fee of improved varieties, investigation and design fee, and management fee of production units, management fee of the site department and financial expense); i refers to interest rates (excluding inflation); n refers to the number of rotation years.
2.3.3. Compilation of the Correction Coefficient for Forestland Price
It is necessary to establish a reasonable correction coefficient of forestland price through the benchmark price correction method to evaluate the forestland value. The existing mature method for the benchmark price correction originates from the construction land, which includes the evaluation period, floor area ratio, land use period and others. There is commonness and particularity considering the construction land and forestland. The main function of forestland is the production of wood products. The wood production levels could reflect the level of forestland productivity, and the most intuitive factors that could impact the wood production are the accumulation volume per unit area and average tree height. Thus, the correction coefficient of stand volume per unit area or plant number together with the correction coefficient of average tree height were considered as the other correction coefficients in the correction coefficient of forestland price. In summary, the correction coefficient of forestland price includes the correction coefficient of the land use period (K1), the correction coefficient of the evaluation period (K2) and other correction coefficients (K3). The formula for forestland price evaluation using the correction coefficient is as follows:
where: V refers to the forestland price to be evaluated; Va refers to the corresponding grade benchmark price of forestland to be evaluated; Ki refers to forestland correction coefficient.
- (1)
- Correction coefficient of land use period
When evaluating forestland with the benchmark price method, the land use period of the forestland to be evaluated may be different from the legal maximum use period, so it should be corrected. The formula for the annual correction coefficient K1 is as follows:
where: K1 refers to the land use period correction coefficient of forestland to be evaluated; i refers to land restoration rate; m refers to the set service life of forestland to be evaluated; n refers to the maximum service life of the forestland.
- (2)
- Period–day correction coefficient
The daily correction of the evaluation period is mainly made in response to the changes in the forestland value caused by the time, and the social and economic environment. The benchmark price of forestland is evaluated at a specific time point, which has timeliness. The assessment base date between the forestland to be evaluated and the forestland benchmark price is generally different, so it is necessary to revise the assessment date. There are various calculation methods for the period–day correction coefficient. Considering that forestland value is positively correlated with local GDP, social and economic development level, together with the inflation rate, the price index is used to calculate the period–day correction coefficient K2 as follows:
where K2 refers to the daily correction coefficient of the forestland period to be evaluated; PIc refers to the daily price index of forestland evaluation; PIb refers to the daily price index of the forestland benchmark price evaluation.
- (3)
- Other correction coefficients
According to the function of the forestland, the level of forest productivity is largely reflected by the level of wood yield, while the wood yield can be reflected by the forest production volume per unit area and the average tree height. Because the accumulation volume of young forest trees was not involved in the survey data, the level of forest productivity can be reflected by the forest survival rate per unit area. Then, the other correction coefficient K3 was constituted by the accumulation volume per unit area or plants number together with the average tree height as follows:
where K3 refers to other correction coefficients of forestland to be evaluated; Km refers to the correction coefficient of forest stock per unit area or the correction coefficient of tree number per unit area; Kh refers to the average tree height correction factor.
If the forest to be evaluated belonged to the young growth, Km is the correction coefficient of the tree number per unit area; otherwise, Km is the correction coefficient of the tree stock per unit area.
where Km refers to the correction coefficient of forest stock per unit area or the correction coefficient of the tree number per unit area; Mj refers to the accumulation volume of forest trees per unit area on the forestland to be estimated; M refers to the forest accumulation volume per unit area of the same forest grade and same age group as the forest to be evaluated in the administrative region where the benchmark price of forest land is set; Sj refers to the number of trees in the forest land to be estimated; S refers to the number of trees of the same forest grade and age group in the administrative region where the benchmark price of forest land is formulated.
where Kh refers to the average tree height correction coefficient; Hj refers to the average tree height on the forest land to be estimated; H refers to the average tree height of the same forest grade and age group as the forest to be evaluated in the administrative region where the forest benchmark price is formulated.
3. Results
3.1. Forestland Grading
3.1.1. Rasterization of the Indicators
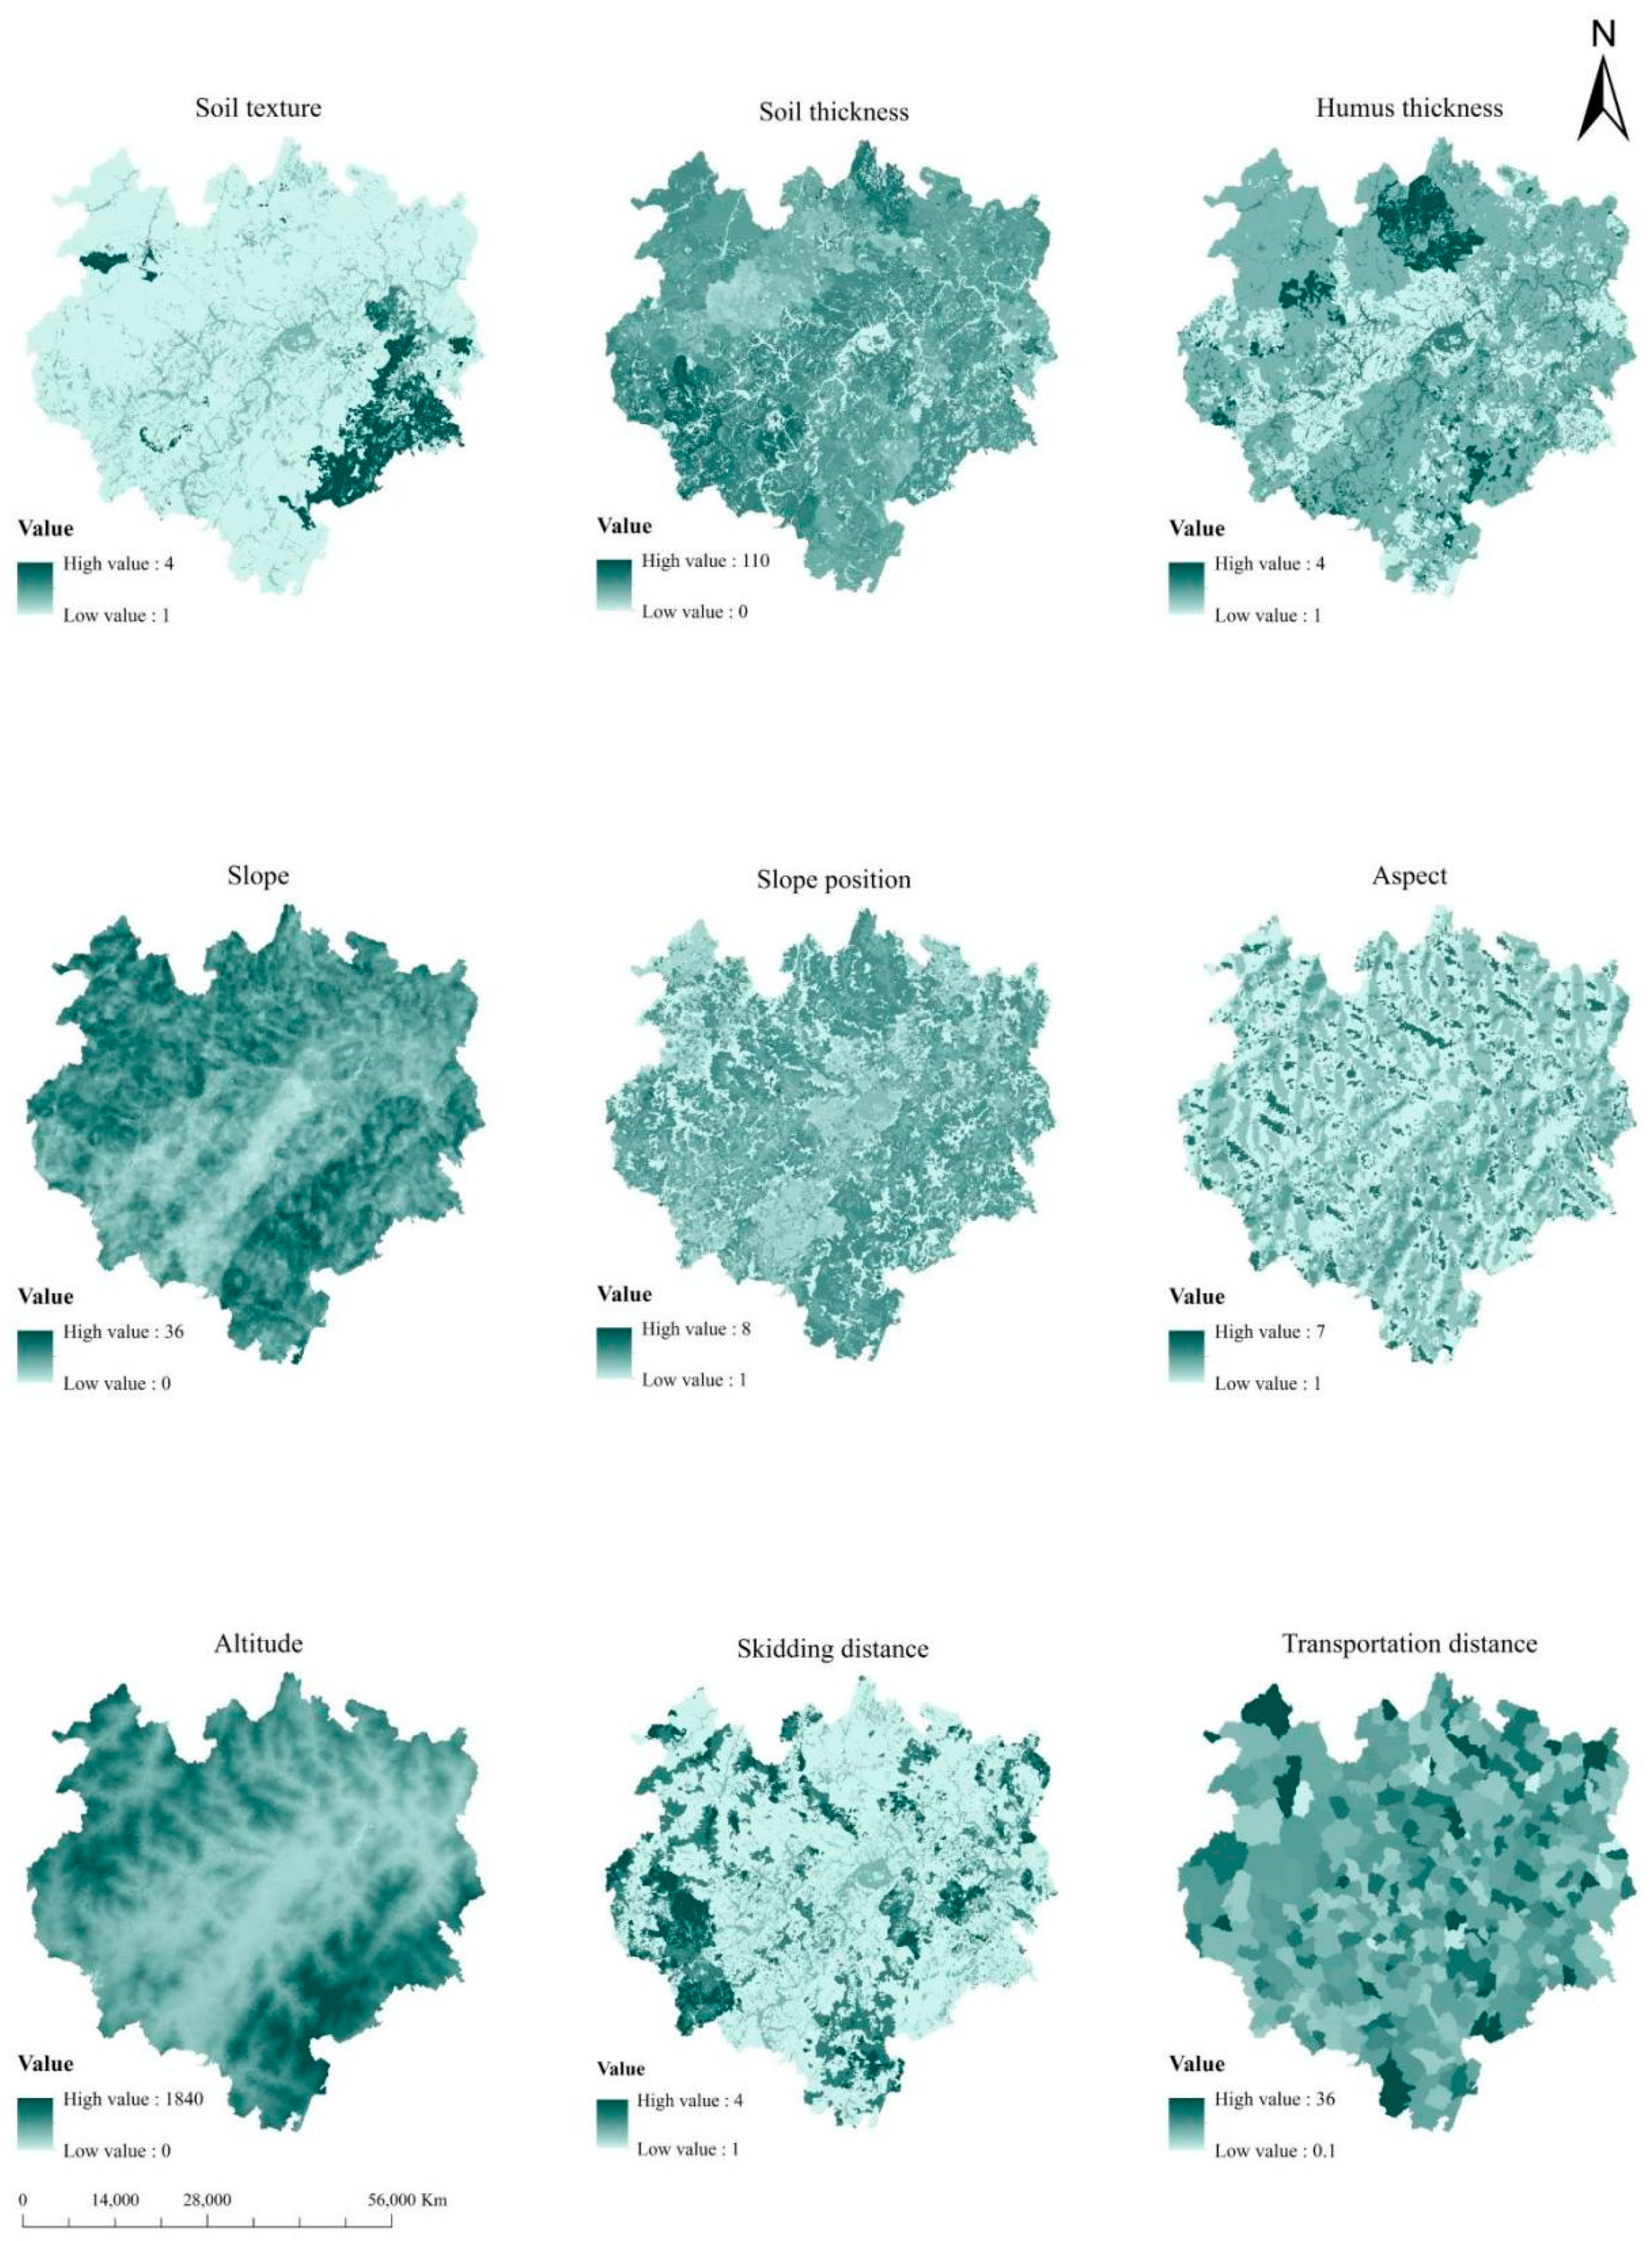
According to the survey data of forest resources planning and design in 2016, nine vector layers were extracted including the soil texture, soil thickness, humus thickness, slope, slope position, slope direction, altitude, transportation distance and skidding distance through ArcGIS software to rasterize the processing tools, and then, each index vector was rasterized as shown in Figure 2.

Figure 2.
Rasterized diagram of each environmental and socio-economic variable.
According to Figure 2, the differences of each index reflected in different forestlands can be seen intuitively and clearly, and an overall trend can be concluded. In addition to soil texture and humus thickness, other conditions such as slope, altitude, transportation distance, skidding distance and other aspects of the forest near the urban area are relatively superior. The soil texture in the southwest of Longquan county is better than that in other regions. The humus thickness is greater in remote mountainous areas, because the mountain forest deep leaves and thick humus. The closer it is to the urban area, the thicker the soil layer, the lower the elevation, the smaller the slope angle, and the shorter the transportation distance of wood, the better the timber gathering conditions. This is consistent with the terrain of Longquan County.
3.1.2. Reclassification of the Indicators
Due to the difference between the positive and negative effects of indicators, rasterization indicators need to be reclassified before grid calculation. Therefore, indicators are reclassified according to the assigned values of each grade in Table 2, and the results of indicator reclassification are shown in Figure 3.
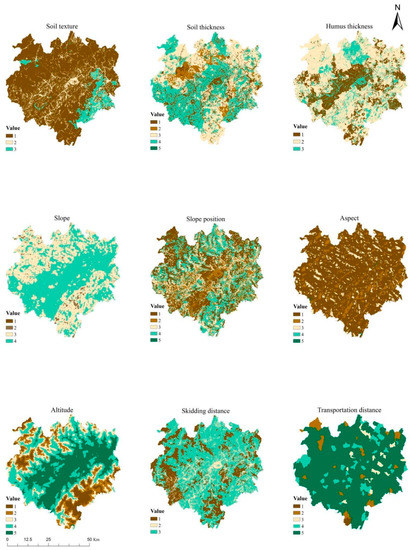
Figure 3.
Data reclassification of each indicator.
In the process of reclassification, negative indexes were reversed by new values. Therefore, both positive and negative indexes in the result of reclassification showed that the higher the value, the greater the forestland quality. According to the reclassification map of each index, the score was generally higher as the forestland was closer to the urban area, especially for the altitude and slope, but not for humus thickness, slope position and slope aspect. Soil texture indices exhibited little difference across the entire region. The regions with higher soil thickness scores are distributed near urban areas and some mountainous areas, which may be caused by river impact near urban areas, while the regions with larger forest vegetation cover in some mountainous areas also have the effect of soil conservation.
3.1.3. The Forestland Grading Results
The map algebra in ArcGIS and the index weights obtained by the Delphi method (expert advice consulting method) were used to conduct raster calculation on the reclassification map of each index, and the grading index was obtained. Then, the forest land was graded according to the grading index of each forest land small class. The results are shown in Table 3.
Table 3.
Forestland classification results in Longquan County.
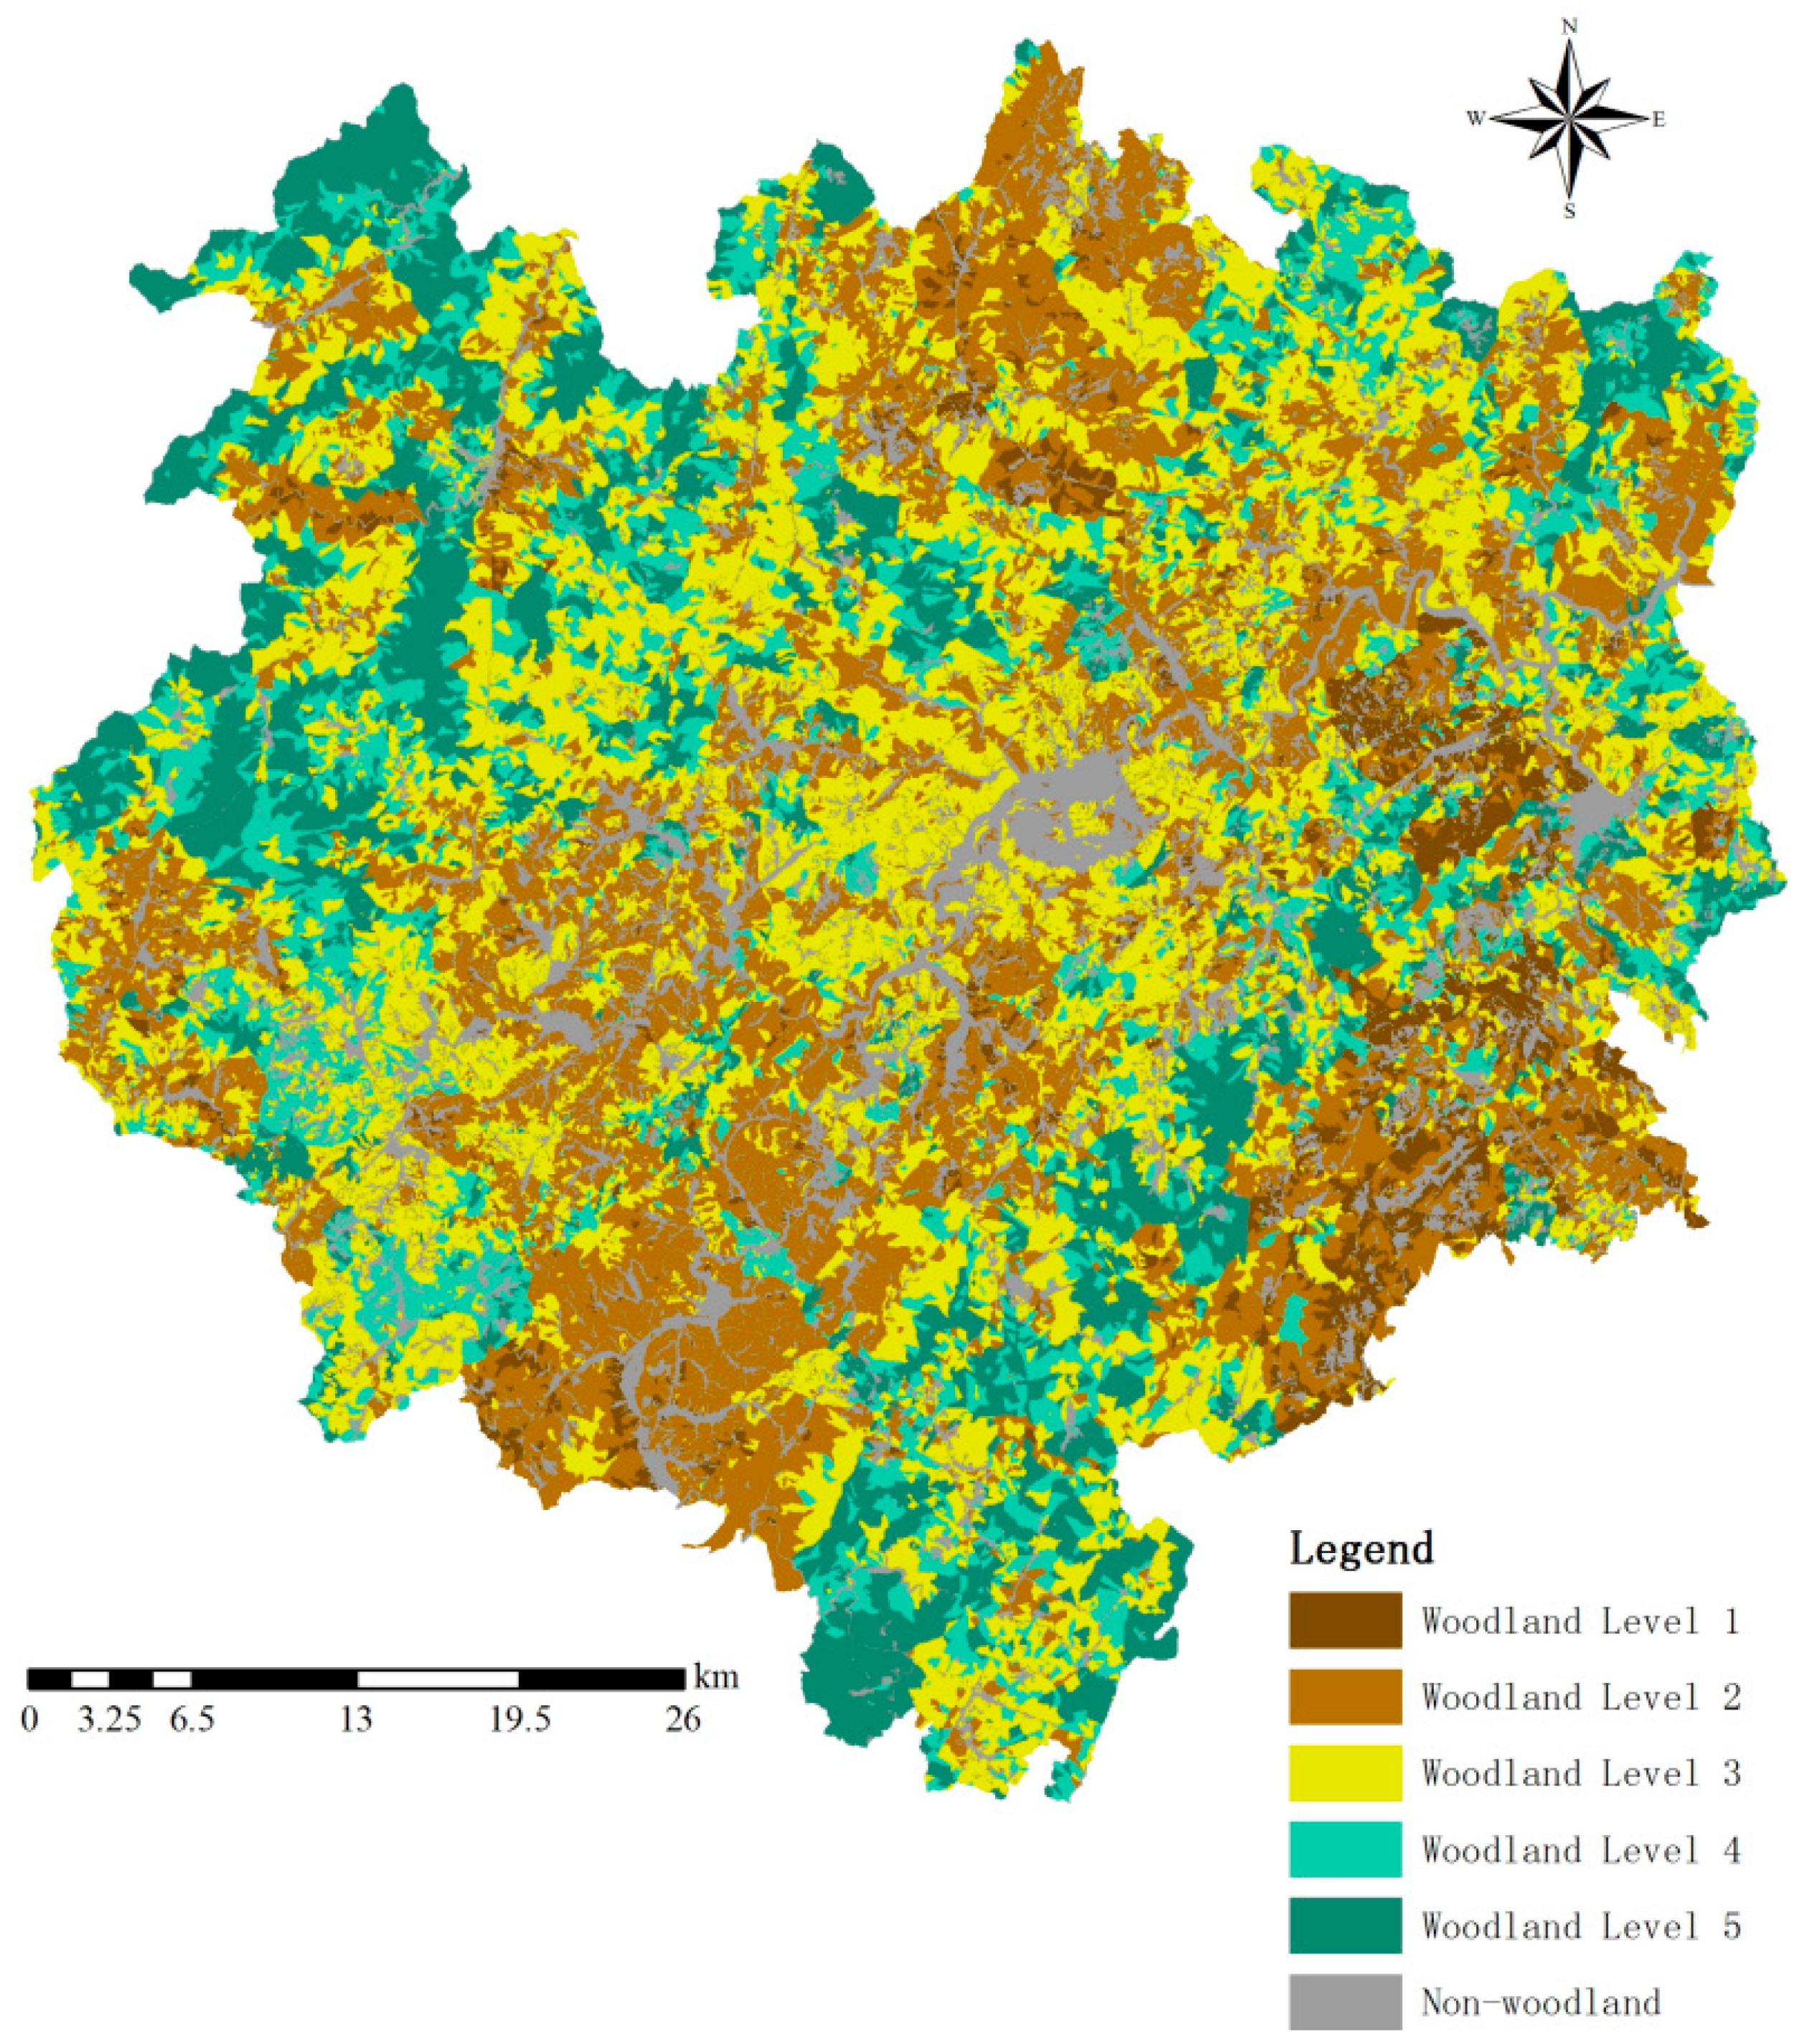
ArcGIS was used to carry out a visual analysis on forest grade, and the results are shown in Figure 4. According to the result table and the distribution map of forest grade, there are 57,678 forest small classes in Longquan County, with a total area of 265,000 ha. Forest grade distribution is mainly concentrated in Grades II and III, accounting for 70.1 and 62% of the total forest area, respectively. The number of those in the Grade II forestland class was the largest, accounting for 36.3%. The area of Grade III forest was the largest accounting for 33.5%. The Grade I forest land was the lowest area accounting for only 4.4%. The non-forestland in the figure is mainly urban construction land and rivers and lakes, which are basically located in the center of Longquan County and low-lying and flat. From the perspective of the forest grade distribution map and the actual river and road network, most of the Grade I and II forest lands with better forest quality were distributed in the areas where rivers flow through and surrounding roads are convenient. Because the land surrounding rivers is flat with a thick soil layer and convenient transportation, the economic value of forest land is high. There are also a small area of Grade I and II woodland distributed in remote mountainous areas. After the comparison of topography, it was found that these forestlands are distributed in valley areas. Although the location is remote and the transportation is not convenient, these areas have a thick humus, and a thick and more fertilized soil layer. The distribution of Grade III forestland was uniform and distributed in the whole region. Most of the Grade IV and V forests are distributed in remote mountainous areas, which are farther away from rivers, lakes and road networks. Therefore, the forestry quality of forest in remote mountainous areas is not necessarily poor, indicating that location factors have a great impact on forestland grade.
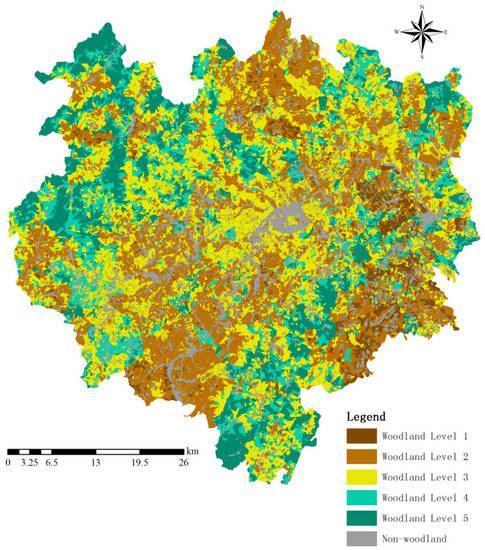
Figure 4.
Forest land grade distribution map of Longquan County.
3.2. The Benchmark Price of Forestland
Benchmark is a particular point in the evaluation of forestland price. It represents timeliness and needs to be updated on a regular basis. It is updated once every three years according to the requirement of other kinds of land benchmark price. This study set the assessment base date to 1 January 2021 based on the economic parameter acquisition time, Because the area and distribution of Grade II forestland is the highest, it was considered as the standard to select the representative sample plots. The economic value of the estimate assets was estimated according to the Longquan economic indicators, whose average was used as the benchmark price of the standard scale forestland. The benchmark price of the standard scale forestland is ca. 9493 CNY/ha, and the average land rent is 570 CNY/a/ha.
The benchmark price of other forestland grades was determined by the ratio between the average value of each forestland grade corresponding to the sub-class grading index and the standard grade. The grading index of Grade I forestland is 1.1 times that of standard forestland, so the benchmark price increases the corresponding multiple on the basis of standard-grade forestland. The benchmark price of Grade III, Grade IV and Grade V is 0.9, 0.8 and 0.7 times that of standard forestland, respectively. The benchmark price of each forestland grade of forestland can be obtained through calculation as shown in Table 4.
Table 4.
Benchmark price of various forestland grades in Longquan County.
As can be seen from Table 4, the benchmark price of forestland shows a decreasing trend from Grade I to Grade V, and the benchmark price is 10,380, 9493, 8708, 7827 and 6771 CNY /ha, respectively. Average land rent from Grade I to Grade V is 623 CNY, 570 CNY, 523 CNY, 470 CNY and 406 CNY/a/ha, respectively. With the improvement of the forestland Grade, the benchmark price of forestland decreases gradually. Because the forestland grade is the comprehensive reflection of natural conditions and location conditions. The better the conditions are, the lower the grade is. According to previous research, the average rental price of forestland varies greatly. Based on the existing literature, the highest and lowest average forestland rents in Zhejiang province are 1389.3 and 309 CNY/a/ha, respectively [47]. The benchmark price of forestland reflects the price benchmark of forestland resources in the administrative region, which can play a certain price reference role, so it should be at the average level. The benchmark price in this study is within this range, indicating that the research results are reasonable and can be applied to the value accounting of large quantities of forestland resources.
3.3. Application of the Forestland Benchmark Price
The economic value of Longquan forestland resources assets including both the public welfare forestland and commodity forestland was calculated through the forestland benchmark price. The value of the public welfare forestland resources was reflected from the asset account. The management disorder of the public welfare forestland was improved, and the standard compensation reference after the destruction was provided. The assessment base date was set to 1 January 2021. The price correction coefficient was modified through the benchmark prices of different forestland grades. As the case was evaluated as the value of forestland resources within the county (city), the land use period was in accordance with the highest legal period (K1 = 1), and the corresponding operation period date was modified. The average height of the timber forest together with the amount of stock per unit area or number of trees in the administrative region are shown in Table 5. After the calculation and summary, the economic value of Longquan forestland resource assets can be obtained as shown in Table 6.
Table 5.
Table of average tree height together with volume per unit area divided by number of plants per unit area in different forestland Grades in Longquan County.
Table 6.
Accounting table of economic value of forest land resource assets in Longquan County.
As shown in Table 5, the average tree height and accumulation volume in Longquan decreased along with the reduction of the forestland grade. There are also some exceptions, such as the average height of sapling forest, mid-maturation forest, nearly-mature forest and mature forest in Grade III being larger than that in Grade II, as was the stock volume per unit area in mid-maturation forest. The reason for this may be that the classification of forestland includes not only the forestry quality, but also location factors. Forestland located in remote mountains is likely to have fertile soil, good forestry quality and high forest yield. However, due to the influence of location and other adverse factors, the final grade of forestland was low. This indicated that it was necessary to involve the locational and social economic factors to develop the forestland benchmark price. Although the assessment result can largely reflect the forestland productivity if only the natural factors were considered, the results will not be reasonable if the role of the forestland locational and social economic factors is ignored.
As shown in Table 6, the total value of forestland resources in Longquan accounted for 2.248 billion CNY, and the land value of different levels is consistent and their physical (area) quantity. The Grade III forest accounted for the highest proportion (33.7%, 758 million CNY) of the total value, while Grade I only accounted for 5.1% (115 million CNY). The evaluation and accounting of regional forestland value by using the revision method of forestland benchmark price has high accounting efficiency and low professional and technical requirements, which has high applicability for the outgoing audit of natural resource assets of regional leading cadres in the future.
4. Discussion
4.1. Establishment of Forest Land Grading Index System
The rationality of a forestland grading index system directly determines the rationality of forestland grades, and then affects the accuracy of forestland benchmark price evaluation. It is the basic work of forestland evaluation to construct the index system of forestland grading according to the purpose of evaluation. At present, due to the diversity and regional differences of forestland evaluation factors, the construction of a forestland grading index system has not been unified [48]. The forestland quality evaluation is closely related to the factors of soil, topography and artificial management [49]. Therefore, some scholars constructed the evaluation index system from the three aspects [50]. There were also some other scholars that constructed a forestland evaluation index system from soil and meteorology [51]. The existing construction of the evaluation index system of forest quality focuses on natural factors, but ignores social and economic factors together with location factors. Thus, forest grading can only reflect the differences in the forestry of forestland, while considering the location and social economic factors can better reflect the comprehensive conditions of forestland. In combination with the characteristics of the study area, natural factors including soil type, soil layer thickness, humus thickness, slope, slope position, slope aspect and altitude were selected. Location factors including wood transportation distance and wood aggregation conditions were adopted. The selected social and economic factors contained output value per unit area, operating level and human disturbance. Since there is not much difference between the social economic factors in this study, they were not further considered. Considering the terrain, river and road network in the study area, the result of forest grading in this study was also reasonable. Due to the difficulty in obtaining data for the measurement of location factors, they were characterized by other factors, which may have a negative impact on the accuracy of forestland grading. In addition, the construction of the forestland grading index system was a complex engineering. Due to the limitation of data availability, the evaluation index system established in this study needs to be further studied and verified. In future research, with the development of technology, remote sensing data can be extracted to select more objective, more appropriate and more reasonable evaluation indicators to grade forestland and better reflect the spatial differences of forestland within the county.
4.2. Forestland Grading Method
The quality of the forest grading method directly affects the accuracy of grading results. Previous research methods mainly focused on the mathematical analysis [52,53]. Xia et al. [54] first used AHP to determine the weight of evaluation indexes for forestland grading, and then established an evaluation model by nonlinear regression analysis. Pippuri et al. (2016) used multi-source remote sensing data to classify forestland [55]. In this study, the mathematical analysis method was combined with ArcGIS spatial analysis technology to conduct forestland grading from a new research perspective. Although the calculation connotation was also based on mathematical principles, the calculation process was completed through the ArcGIS spatial analysis technology, which is more convenient and increased the range of methods that could be selected for forestland grading. Moreover, it provides some reference for further optimizing the quality evaluation system of forestland, and a scientific basis for formulating and standardizing the forestland transfer price and forestland compensation due to occupation and requisition. In addition, the forestland grading method constructed in this study can be used as a reference for similar natural resources. Nonetheless, the quality evaluation of forestland grading process is affected by climate, soil, topography, management and other factors [56], and the vast area and the geographical space of forestland made it inaccessible to most people, which greatly limited the data acquisition, thus affecting the applicability of the grading methods. Thus, more research is needed to further improve the evaluation accuracy.
4.3. Benchmark Price of Forestland
The benchmark price was mostly used in the field of agricultural land [57] and construction land [58,59]. This study innovatively introduced this concept into the forestland. The advantages and limitations of various forestland resource asset valuation methods were analyzed; the forestland expected price method was the most suitable basic evaluation method to calculate the forestland benchmark price, the forestland price correction coefficient was calculated, and, finally, the forestland benchmark price system for Longquan County was established. This provided a preliminary exploration for the establishment of forestland benchmark price in the future administrative region. The accounting for the forestland economic value has been widely investigated previously [60,61,62,63], but most of these studies adopted the annuity capitalization method, the forest land cost price method, and the current market price method [64,65,66]. These methods have the disadvantages of cumbersome operation, low calculation efficiency and a high cost, and it is difficult for these methods to support the current large-scale inventory of forest resource assets. It is simple to collect the reasonable economic value of forestland resource assets through the benchmark price. Results showed that this method can perform the economic value evaluation and the calculation of forestland resource assets for the provinces, cities and counties. Nonetheless, the forestland benchmark price calculation in this study did not distinguish the profit-making forestland from the public welfare forestland, and the economic forestland resources assets were unified. It can only be used as a reference value for a small amount of forest resource assets with the purpose of the transfer and lease. The forestland benchmark price method has good applicability for the accounting of the large-scale forestland resource assets in the administrative region. The reason why commercial forest land and non-commercial ecological public welfare forest land are not distinguished is that the grading indexes of different types of forestlands are different, and it is difficult to obtain the grading indexes. With the improvement of the technological progress monitoring and surveying, the profit-making forestland and public welfare forestland can be further distinguished, different forestland grading index systems can be built, and the benchmark price could be calculated separately. This can effectively improve the accuracy of the forestland classification and benchmark price.
5. Conclusions
This study collected the survey data of forest resources planning and design in Longquan, Zhejiang Province, China in 2016. An index system of forestland classification was built through the local economic parameters, natural factors, together with social economic factors and location factors. It aimed to classify the forestland of Longquan county, to calculate and evaluate the benchmark price of forestland of each grade, and use the benchmark price of forestland to calculate the economic value of forestland to improve the efficiency of statistic management of forestland resources. The process of the forestland classification was further determined through the ArcGIS spatial analysis technology, and the forestland expected value method was used to determine the benchmark price of each forestland level. In order to improve the efficiency of forestland resource asset accounting, the benchmark price of forestland was applied. Results showed that forestland resources in Longquan were mainly concentrated in Grade II and Grade III, accounting for 70.1% of the total number of forestland subclasses and 62% of the total forestland area, respectively. The high-grade forestland (meaning the forest quality is low) was mostly distributed in remote mountains, far from the urban areas, indicating that when compared with the natural factors, location factors such as transport distance and timber gathering distance have a greater impact on the economic value of forestland resources. However, low-grade forest land (meaning high quality forestland) is mainly distributed in the urban areas with flat terrain, which was mainly affected by terrain and traffic location. Taking Longquan county as an example, the empirical study showed that this method can greatly improve the accounting and transfer efficiency, promote the economical and intensive management, and enhance the sustainable management efficiency of forestland resources.
Meanwhile, this study provides some policy implications. The zoning protection scheme of forest land resources can be scientifically formulated based on the basis of the forestland classification, which could promote the effective protection and management of forestland resources. Second, it can calculate the economic value of forestland resources in administrative regions based on the benchmark price, which can effectively manifest the value of natural resources and help local governments calculate and count the value of natural resources assets and serve the evaluation of government departments. Third, it is helpful to establish the benchmark price system in the region, and then, adaptive schemes could be formulated for the ecological compensation, occupation compensation and forestland damage compensation.
Author Contributions
Conceptualization, L.W., W.Z. and M.L.; Data curation, L.W. and W.Z.; Funding acquisition, W.Z.; Formal analysis, L.W. and W.Z.; Investigation, L.W. and F.C.; Methodology, L.W. and M.L.; Supervision, L.W. and W.Z.; Writing—original draft preparation, L.W., W.Z. and F.C.; Writing—review and editing, L.W., W.Z. and M.L. All authors have read and agreed to the published version of the manuscript.
Funding
This research was supported by Major Projects of The National Social Science Fund of China, grant number [21BTJ001].
Institutional Review Board Statement
Not applicable.
Informed Consent Statement
Not applicable.
Data Availability Statement
The data presented in this study are available on request from the first author.
Acknowledgments
We are indebted to the anonymous reviewers and editors. We also give our special thanks to Dexiang Zheng who gave us precious advice.
Conflicts of Interest
The authors declare no conflict of interest.
References
- Dudley, N.; Schlaepfer, R.; Jackson, W.; Jeanrenaud, J.P.; Stolton, S. Forest Quality: Assessing Forests at a Landscape Scale; Routledge: London, UK, 2012. [Google Scholar] [CrossRef]
- Stave, J.; Oba, G.; Charlotte, S.B.; Mengistu, Z.; Stenseth, N.C. Spatial and temporal woodland patterns along the lower Turkwel River, Kenya. Afr. J. Ecol. 2003, 41, 224–236. [Google Scholar] [CrossRef]
- Zaher, H.; Sabir, M.; Benjelloun, H.; Paul-Igor, H. Effect of forest land use change on carbohydrates, physical soil quality and carbon stocks in Moroccan cedar area. J. Environ. Manag. 2020, 254, 109544. [Google Scholar] [CrossRef] [PubMed]
- Karkuff, S.A. Quantifying Forest Subsidies to Food Webs in Woodland Pools. Master’s Thesis, State University of New York, Syracuse, NY, USA, 2014. [Google Scholar]
- Wong, M.H.; Chan, Y.S.G.; Zhang, C.; Ng, W.W. Comparison of pioneer and native woodland species growing on top of an engineered landfill, Hong Kong: Restoration programme. Land Degrad. Dev. 2016, 27, 500–510. [Google Scholar] [CrossRef]
- Chmura, D.J.; Anderson, P.D.; Howe, G.T.; Harrington, C.A.; Halofsky, J.E.; Peterson, D.L.; Shaw, D.C.; Clair, J.B.S. Forest responses to climate change in the northwestern United States: Ecophysiological foundations for adaptive management. For. Ecol. Manag. 2011, 261, 1121–1142. [Google Scholar] [CrossRef]
- Bowman, D.M.J.S.; Murphy, B.P.; Boer, M.M.; Bradstock, R.A.; Cary, G.J. Forest fire management, climate change, and the risk of catastrophic carbon losses. Front. Ecol. Environ. 2013, 11, 66–68. [Google Scholar] [CrossRef] [Green Version]
- Shi, J.H.; Jiang, A.J. Discussions about identifying forestland in plain areas. For. Resour. Manag. 2015, 1, 23–26. [Google Scholar] [CrossRef]
- State Forestry and Grassland Administration. China Forest Resources Report (2014–2018); China Forestry Press: Beijing, China, 2019. [Google Scholar]
- Köhl, M.; Lasco, R.; Cifuentes, M.; Jonsson, Ö.; Korhnen, K.T.; Mundhenk, P.; de Jesus Navar, J.; Stinson, G. Changes in forest production, biomass and carbon: Results from the 2015 UN FAO Global Forest Resource Assessment. For. Ecol. Manag. 2015, 352, 21–34. [Google Scholar] [CrossRef] [Green Version]
- Wisdom Research Consulting. China Forest Fire Protection Industry Current Research and Future Development T rend Analysis Report (2020–2026); China Market Research Network: Beijing, China, 2020. [Google Scholar]
- Bedia, J.; Camia, A.; Moreno, J.M.; Gutierrez Herrera, S. Forest fire danger projections in the Mediterranean using ENSEMBLES regional climate change scenarios. Clim. Chang. 2014, 122, 185–199. [Google Scholar] [CrossRef] [Green Version]
- Jian, S.; Joshua, S.F.; Jason, A.; Lynch, K.H.; Yang, G. Climate-driven Exceedance of Total (Wet + dry) Nitrogen (N) + sulfur (S) deposition to forest soil over the conterminous U.S. Earth’s Future 2017, 5, 560–576. [Google Scholar] [CrossRef] [Green Version]
- Barbier, E.B.; Burgess, J.C.; Grainger, A. The forest transition: Towards a more comprehensive theoretical framework. Land Use Policy 2010, 27, 98–107. [Google Scholar] [CrossRef]
- Chen, L.X.; Shi, G.X. Study on improving the quality of forest land of larch plantations. J. Northeast For. Univ. 1998, 26, 6–11. [Google Scholar]
- Chung, I.K. Quantitative forest land productivity survey and the result: Forest land capability classification in South Korea. Jpn. J. For. Environ. 1978, 19, 31–35. [Google Scholar]
- Martens, D.A.; Reedy, T.E.; Lewis, D.T. Soil organic carbon content and composition of 130-year crop, pasture and forest land-use managements. Glob. J. Chang. Biol. 2004, 10, 65–78. [Google Scholar] [CrossRef] [Green Version]
- Tan, J. Ways and Measures for Improving the Forest Land Productivity in Dongxing County; FAO: Rome, Italy, 2013. [Google Scholar]
- Layser, E.F. Preliminary Classification for the Coniferous Forest and Woodland Series of Arizona and New Mexico; Rocky Mountain Forest and Range Experiment Station, Forest Service, US Department of Agriculture; Utah State University: Logan, UT, USA, 1979. [Google Scholar]
- Corrigan, M.M. Study of the Properties, Classification, and Woodland Site Quality for High Elevation Soils in Western Virginia. Master’s Thesis, Virginia Tech, Blacksburg, VA, USA, 1995. [Google Scholar]
- Chen, C.; Tang, P.; Wu, H. Improving classification of woodland types using modified prior probabilities and Gaussian mixed model in mountainous landscapes. Int. J. Remote. Sens. 2013, 34, 8518–8533. [Google Scholar] [CrossRef]
- Sonti, S.H. Application of geographic information system (GIS) in forest management. J. Geogr. Nat. Disasters 2015, 5, 1000145. [Google Scholar] [CrossRef] [Green Version]
- Koch, N.E.; Hirokazu, Y.; Kahle, H.-P.; Hasenauer, H.; Centritto, M.; Kjell, N.; Peng, Z.; Weimin, S.; Fuliang, C.; Shirong, L.; et al. Classification of Integrated Quality of Chinese Woodland Using Fuzzy Mathemtics. In Proceedings of the International Conference on Sustainable Forest Management—Forest Science Forum, Beijing, China, 19 October 2012; pp. 13–16. [Google Scholar]
- Goushegir, S.Z.; Feghhi, J.; Mohajer, M.R.M.; Makhdoum, M. Criteria and Indicators of monitoring the sustainable wood production and forest conservation using AHP (Case study: Kheyrud educational and research forest). Afr. J. Agric. Res. 2009, 4, 1041–1048. [Google Scholar] [CrossRef]
- Chen, Z.; Yang, C.; Deng, D.; Zhihua, L.I. Analysis of influencing factors and model prediction of forest coverage in Guangdong Province: Based on grey correlation analysis and GM (1,1) model. Environ. Sci. 2017, 33, 101–106. [Google Scholar] [CrossRef]
- Valjarević, A.; Djekić, T.; Stevanović, V.; Ivanović, R.; Jandziković, B. GIS numerical and remote sensing analyses of forest changes in the Toplica region for the period of 1953–2013. Appl. Geogr. 2018, 92, 131–139. [Google Scholar] [CrossRef]
- Anil, P.; Nidhi, R.; Nirmal, K.S. Assessment of forest land degradation by remote sensing and gis: A case study of jaisamand wildlife sanctuary, udaipur (rajasthan). Ecol. Environ. Conserv. 2021, 27, 447–454. [Google Scholar]
- Ismail, M.A.; Ludin, A.; Hosni, N. Comparative Assessment of the Unsupervised Land Use Classification by Using Proprietary GIS and Open Source Software. IOP Conf. Ser. Earth Environ. Sci. 2020, 540, 012020. [Google Scholar] [CrossRef]
- Pokhariya, H.S.; Singh, D.P.; Prakash, R. Investigating the impacts of urbanization on different land cover classes and land surface temperature using GIS and RS techniques. Int. J. Syst. Assur. Eng. Manag. 2021, 29, 1–9. [Google Scholar] [CrossRef]
- Masayi, N.N.; Omondi, P.; Tsingalia, M. Assessment of land use and land cover changes in Kenya’s Mt. Elgon forest ecosystem. Afr. J. Ecol. 2021, 59, 988–1003. [Google Scholar] [CrossRef]
- Healy, M.J.; Bergquist, K. The sales comparison approach and timberland valuation. Apprais. J. 1994, 62, 587–595. [Google Scholar]
- You, S.M.; Chang, C.O. Weight regression model from the sales comparison approach. Prop. Manag. 2009, 27, 302–318. [Google Scholar] [CrossRef]
- Kalle, E.; Mika, V. Deriving market prices for forestland properties from comparables. Prop. Manag. 2018, 36, 423–445. [Google Scholar] [CrossRef]
- da Silva, M.L.; Rocha, R.R.d.; Cordeiro, S.A.; da Silva, M.L.M.; Bezerra, A.F. Comparative study of three forestland assessment methods. Cerne 2011, 17, 209–213. [Google Scholar]
- Kennedy, G.A.; Vandeveer, L.R.; Henning, S.A.; Niu, H.; Deckard, D.L. Estimating Tract value relationships in the North Louisiana timberland market. Southwest. Econ. Rev. 2011, 29, 123–134. [Google Scholar]
- Zhang, D.; Meng, L.; Polyakov, M. Determinants of the Prices of Bare Forestland and Premerchantable Timber Stands: A Spatial Hedonic Study. For. Sci. 2013, 59, 400–406. [Google Scholar] [CrossRef] [Green Version]
- Xie, Z.G.; Han, G.K.; Tong, H.W.; Xu, J.; Ge, W.N.; He, B.T. Serial forest price and its application in the assessment of forest resources assets. For. Sci. 2016, 52, 43–53. (In Chinese) [Google Scholar]
- Liu, H.; Zheng, M.; Liu, J.; Zheng, X. Sustainable land use in the trans-provincial marginal areas in China. Resour. Conserv. Recycl. 2020, 157, 104783. [Google Scholar] [CrossRef]
- Wang, L.; Zhou, Y.; Li, Q.; Zuo, Q.; Gao, H.; Liu, J.; Tian, Y. Forest Land Quality Evaluation and the Protection Zoning of Subtropical Humid Evergreen Broadleaf Forest Region Based on the PSO-TOPSIS Model and the Local Indicator of Spatial Association: A Case Study of Hefeng County, Hubei Province, China. Forests 2021, 12, 325. [Google Scholar] [CrossRef]
- Wu, J.; Lin, W.; Peng, X.; Liu, W. A Review of Forest Resources and Forest Biodiversity Evaluation System in China. Int. J. For. Res. 2013, 2013, 1–7. [Google Scholar] [CrossRef] [Green Version]
- Gu, L.; Gong, Z.W.; Bu, Y.K. Forest Quality Dynamic Change and Its Driving Factors Accompanied by Forest Transition in China. Forests 2021, 12, 733. [Google Scholar] [CrossRef]
- Zhang, Z.Y.; Liu, P.J.; Tang, X.M. Evaluation of forest land quality based on rough set and C5.0 decision tree. J. Northwest A F Univ. Nat. Sci. Ed. 2017, 45, 96–102. [Google Scholar]
- Pokharel, B.; Dech, J.P. An ecological land classification approach to modeling the production of forest biomass. For. Chron. 2011, 87, 23–32. [Google Scholar] [CrossRef]
- Tang, X.; Huang, Q.; Lefsky, M.A.; Huang, L.; Wu, W. Dividing the topographical advantage of forestland by spatial analysis and the analytic hierarchy process. J. Sustain. For. 2021, 40, 263–280. [Google Scholar] [CrossRef]
- 45. Fields-Johnson, C.W.; Zipper, C.E.; Burger, J.A.; Evans, D.M. Forest restoration on steep slopes after coal surface mining in Appalachian USA: Soil grading and seeding effects. For. Ecol. Manag. 2012, 270, 126–134. [Google Scholar] [CrossRef]
- Yang, Z.G. Research on the Evaluation of Forest Benchmark Land Price. Ph.D. Thesis, Fujian Agriculture and Forestry University, Fuzhou, China, 2008. (In Chinese). [Google Scholar]
- Xu, C.; Cheng, B.; Li, L.; Xu, X. Does political identity lower circulating rent: An empirical test from Zhejiang Province. J. Agric. Technol. Econ. 2019, 9, 73–81. (In Chinese) [Google Scholar]
- Zhang, H.R.; Lei, X.D.; Li, F.R. Research progress and prospects of forest management science in China. Sci. Silv. Sin. 2020, 56, 130–142. [Google Scholar]
- Wang, H.B. The Study and Practice of Forestland Modern Management Mode and the Key Issues in China. Ph.D. Thesis, Beijing Forestry University, Beijing, China, 2011. (In Chinese). [Google Scholar]
- Mo, K. The Study on Quality Assessment Indicator System of Timber Forest and Its Methods at Subcompartment Level. Ph.D. Thesis, Beijing Forestry University, Beijing, China, 2012. (In Chinese). [Google Scholar]
- Deng, W.Q. Evaluation of Qaulity of Woodland of Changsha County. Master’s Thesis, Central South University of Forestry and Technology, Changsha, China, 2013. (In Chinese). [Google Scholar]
- Liu, L.M.; Zhou, D.; Chang, X.; Lin, Z.L. A new grading system for evaluating China’s cultivated land quality. Land Degrad. Dev. 2020, 31, 1482–1501. [Google Scholar] [CrossRef]
- Scaloppi, E.J.; Willardson, L.S. Practical Land Grading Based on Least Squares. J. Irrig. Drain. Eng. 1986, 112, 98–109. [Google Scholar] [CrossRef] [Green Version]
- Xia, W. Forest land classification and grading and research of the model. Netw. Secur. Technol. Appl. 2014, 11, 183–184, 186. [Google Scholar]
- Pippuri, I.; Suvanto, A.; Maltamo, M.; Korhonen, K.T.; Pitkänen, J.; Packalen, P. Classification of forest land attributes using multi-source remotely sensed data. Int. J. Appl. Earth Obs. Geoinf. 2016, 44, 11–22. [Google Scholar] [CrossRef]
- Ford, M.M.; Zamora, D.S.; Current, D.; Magner, J.; Wyatt, G.; Walter, W.D.; Vaughan, S. Impact of managed woodland grazing on forage quantity, quality and livestock performance: The potential for silvopasture in Central Minnesota, USA. Agrofor. Syst. 2019, 93, 67–79. [Google Scholar] [CrossRef]
- Tian, Y.; Fan, P.; Yang, Q.; Yang, X.; Wang, L. Theoretical Study on the Regional Comprehensive Price of Expropriated Agricultural Land Based on the Benchmark Land Price. Asian Agric. Res. 2021, 13, 20–23. [Google Scholar] [CrossRef]
- Tian, Y.; Song, L.; Wang, L.; Yang, X.; Yang, Q. Research on the Balance of Urban Benchmark Land Price in Henan Province: A Case Study of Commercial Land. Asian Agric. Res. 2021, 13, 28–53. [Google Scholar] [CrossRef]
- Weibing, Z. Construction and Application of Urban Benchmark Land Price Evaluation Model—Take Commercial Land in Downtown of Longkou as a Case. Mod. Manag. 2020, 10, 909–917. [Google Scholar] [CrossRef]
- Remme, R.P. Spatial accounting for ecosystem services in Limburg, the Netherlands. Berlin Germany, 2014. [Google Scholar]
- Lamichhane, R.; Sedhain, A.; Maharjan, M. Economic value of community forest to local users: A case study from Barandabhar Protected Forest, Chitwan, Nepal. Banko Janakari 2019, 29, 20–27. [Google Scholar] [CrossRef]
- Deng, S.; Xia, Y. Research on green plant development and forest asset accounting based on GIS system data. Arab. J. Geosci. 2021, 14, 1–5. [Google Scholar] [CrossRef]
- Campos, P.; Álvarez, A.; Oviedo, J.L.; Ovando, P.; Mesa, B.; Caparrós, A. Refined Systems of National Accounts and Experimental Ecosystem Accounting Versus the Simplified Agroforestry Accounting System: Testing in Andalusian Holm Oak Open Woodlands. Forests 2020, 11, 393. [Google Scholar] [CrossRef] [Green Version]
- Campbell, E.T.; Tilley, D.R. Valuing ecosystem services from Maryland forests using environmental accounting. Ecosyst. Serv. 2014, 7, 141–151. [Google Scholar] [CrossRef]
- Loomis, J.J.; Knaus, M.; Dziedzic, M. Integrated quantification of forest total economic value. Land Use Policy 2019, 84, 335–346. [Google Scholar] [CrossRef]
- Sukarna, R.M.; Yulianto, S.; Reri, Y. Economic Value of Secondary Natural Forest Resources in District of East Kotawaringin Central Kalimantan Province. Agr. Ecosyst. Eviron. 2019, 12, 1–19. [Google Scholar]

Publisher’s Note: MDPI stays neutral with regard to jurisdictional claims in published maps and institutional affiliations. |
© 2022 by the authors. Licensee MDPI, Basel, Switzerland. This article is an open access article distributed under the terms and conditions of the Creative Commons Attribution (CC BY) license (https://creativecommons.org/licenses/by/4.0/).