Article

Evolution and Climate Drivers of NDVI of Natural Vegetation during the Growing Season in the Arid Region of Northwest China

1
School of Urban and Environmental Sciences, Huaiyin Normal University, Huai’an 223300, China
2
State Key Laboratory of Desert and Oasis Ecology, Xinjiang Institute of Ecology and Geography, Chinese Academy of Sciences, Urumqi 830011, China
3
Research Institute of Huaihe River Eco-Economic Belt, Key Research Base of Philosophy and Social Sciences in Jiangsu Universities, Huai’an 223300, China
4
State Key Laboratory of Earth Surface Processes and Resource Ecology, Faculty of Geographical Science, Beijing Normal University, Beijing 100875, China
*
Author to whom correspondence should be addressed.
Forests 2022, 13(7), 1082; https://doi.org/10.3390/f13071082
Submission received: 28 April 2022 / Revised: 5 July 2022 / Accepted: 7 July 2022 / Published: 10 July 2022
(This article belongs to the Section Forest Meteorology and Climate Change)

Abstract

:
Vegetation plays an important role in linking water, atmosphere, and soil. The dynamic change in vegetation is an important indicator for the regulation of the terrestrial carbon balance and climate change. This study applied trend analysis, detrended correlation analysis, and the Hierarchical Partitioning Algorithm (HPA) to GIMMS NDVI3g data, meteorological data, and natural vegetation types for the period 1983 to 2015 to analyze the temporal and spatial changes in NDVI during the growing season and its driving factors in the arid region of northwestern China. The results showed that: (1) the growing season length (GSL) was delayed, with a regional trend of 8 d/33 a, due to a significant advancement in the start of the growing season (SOS, −7 d/33 a) and an insignificant delay to the end of growing season (EOS, 2 d/33 a). (2) The regional change in NDVI was mainly driven by temperature and precipitation, contributing to variations in NDVI of forest of 36% and 15%, respectively, and in the NDVI of grassland, of 35% and 21%, respectively. In particular, changes to forested land and medium-coverage grassland (Mgra) were closely related to temperature and precipitation, respectively. (3) The spatial distribution of the mean NDVI of forest was closely related with precipitation, temperature, and solar radiation, with these meteorological variables explaining 20%, 15%, and 10% of the variation in NDVI, respectively. Precipitation and solar radiation explained 29% and 17% of the variation in the NDVI of grassland, respectively. The study reveals the spatial–temporal evolution and driving mechanism of the NDVI of natural vegetation in the arid region of Northwest China, which can provide theoretical and data support for regional vegetation restoration and conservation.

1. Introduction

Vegetation plays an important role in the terrestrial ecosystem by connecting soil, hydrosphere, and atmosphere [1]. Vegetation promotes material migration and energy exchange in each sphere, which is beneficial for climate regulation, the terrestrial carbon cycle, and water and soil conservation [2]. Since vegetation sequesters carbon through photosynthesis, vegetation plays an important role in regulating the global carbon balance and mitigating global climate change [3]. Vegetation growth is closely related to local temperature, moisture, and solar radiation conditions [4]. Climate extremes, such as high temperature, low precipitation, and drought are the limiting factors affecting vegetation growth [5].
The continuous monitoring of global vegetation and climate factors through satellite remote sensing and the use of a quantitative vegetation index to analyze the hydrological responses of vegetation at different scales provide strong data and methodological support for the study of the land surface [6]. The normalized difference vegetation index (NDVI) effectively reflects the extent of regional vegetation coverage and the status of vegetation growth. In addition, NDVI can be used as an important indicator within the monitoring of ecosystem and regional vegetation changes [7,8]. At the global scale, the effect of carbon dioxide fertilization is the main driver of vegetation greening. However, the leading factors driving vegetation greening are different in different regions [9]. Recent Moderate Resolution Imaging Spectroradiometer (MODIS) satellite data showed that the areas of vegetated land in China and India have increased. The expansion of forest and agricultural land have contributed to 42% and 32% of the greening in China, respectively. The greening of vegetation in India has mainly been attributed to agricultural land (82% contribution), with a negligible contribution by forests (4.4%) [10]. It should be noted that the long-term trend in global vegetation greening has obscured the weakening trend in vegetation growth. The rate of global greening gradually slowed after the 1990s, after which the rate and spatial distribution of vegetation browning showed increasing trends [11].
The dynamic changes in vegetation are affected by topography, climate, and other factors [12]. Among the climate factors affecting vegetation, temperature and precipitation are the most important [13]. NDVI was positively correlated with annual mean precipitation, relative humidity, and annual mean temperature, indicating that these climate factors might play important roles in the improvement of vegetation [13]. Nemani et al. [14] found that the effects of climate factors on vegetation growth differ spatially. The main climatic factor affecting vegetation growth in the arid and semi-arid northern regions is precipitation, whereas that in the humid southern regions is temperature [15]. Plant photosynthetic activities decreased remarkably in some arid and semi-arid areas in the Southern Hemisphere due to the decreased annual precipitation [16]. In Central Asia, the grassland NPP showed an increasing trend that was smaller than the decreasing trend, and the anthropogenic activities were the primary cause of the reduction in the grassland NPP [17]. Specifically, the annual NDVI showed a significant increasing trend between 1982 and 1994, and exhibited a decreasing trend since 1994 [18]. A strong increase in NDVI coverage in the Middle East was observed, and the main factors affecting the vegetation coverage in the Middle East are governmental policies [19]. Lamchin et al. [20] found that temperature is the main driver of changes in vegetation greening in northeastern and central China. Precipitation and relative humidity jointly control NDVI to a larger degree than solar radiation and air temperature, with these two variables being found to account for a higher proportion of variation in the NDVI of grasslands in Northern China [21]. In addition to climate change, human activities have a major influence on vegetation growth. The afforestation program in China over the past 20 years has played an important role in vegetation greening nationally [22]. Other studies have also shown that greening and degradation are largely related to landscape, possibly due to natural changes and anthropogenic impacts [23]. Land use change is an additional important factor affecting the distribution of vegetation, particularly in humid, semi-arid, and arid areas. However, the impacts of elevation and temperature on NDVI exceed those of land use in semi-humid and humid areas [24].
The arid inland region of Northwest China is situated far from the ocean, and is characterized by sparse precipitation and strong evapotranspiration. Consequently, this region is one of the driest in China, and even globally [25]. The complex topography, rich ecological landscape, and uneven distribution of water resources in this region have contributed to its fragile ecological environment and sensitivity to climate change. The annual mean temperature has increased by 0.39 °C/10 a, which is 1.39-fold for China and 2.78-fold globally [26]. Climate change and human activities have led to a series of ecological challenges, including the expansion of desert areas, sparse and uneven desert vegetation, the destruction of forests, the degradation of grassland, the drying up of rivers, and the degradation of oases [27].
Quantitative evaluations of the relative impacts of climate change on natural vegetation is important for ecosystem conservation and restoration. Previous studies have mostly focused on the effects of temperature and precipitation on vegetation changes [28], and there has been relatively little focus on the effects of other factors, such as solar radiation. In addition, changes in land use have introduced uncertainty into the assessment of the impact of climate change. Most recent studies have not distinguished between the effects of human activities and climate change on vegetation, and few studies have explored the contribution of climate independent of the effects of meso-scale and large-scale land cover changes [29]. Moreover, human disturbance or the heterogeneity of the landscape have resulted in differences in the composition of vegetation types across different spatial scales. Different vegetation types show large differences in species composition, community structure, and root distribution, contributing to differences in the response to the external environment [30]. It is necessary to analyze the response of NDVI to climate at different vegetation types. The present study aimed to identify changes in the growth season NDVI of different types of natural vegetation in the arid region of Northwest China, exclusive of the effects of land use change. The response of vegetation to climate change with reference to temperature, precipitation, and solar radiation is also discussed. The results of the present study can provide a theoretical basis for the sustainable management of ecosystems in the arid area of Northwest China within the context of climate change.

2. Study Area, Data, and Method

2.1. Study Area and Data

The study area is in northwestern China between 34°–50° N and 73°–108° E. It covers a considerable area of 2.53 million km2, and is located to the west of the Helanshan Mountains, and to the west of the Ushaoling Mountains. The climate of the arid region is typical inner-continental climate, with a wide temperature range, low precipitation, and low humidity. The arid region can be divided into three parts according to its geographical characteristics: (1) North Xinjiang, (2) South Xinjiang, and (3) the Hexi Corridor. Each part can also be further subdivided into several basins (Figure 1a).
The remote sensing data used in the present study are the GIMMS NDVI3g data [31] from 1983 to 2015, with temporal and spatial resolutions of 15 d and 8 km, respectively. This dataset eliminates the effects of volcanic eruptions, solar altitude angles, and changes in sensor sensitivity over time, and has been widely used for the detection of global vegetation change [32]. The datasets were retrieved from https://ecocast.arc.nasa.gov/data/pub/gimms/3g.v1/ (accessed on 20 May 2020). The monthly two-scene data were combined with the Maximum Value Composite (MVC) to obtain a monthly scale Normalized Difference Vegetation Index (NDVI) time series. The average NDVI of natural vegetation in the dataset was 0.17, with the highest and lowest of 0.17 and 0.1 for forest land and grassland, respectively (Figure 1f). Land use data of 1980 and 1990 for China were obtained from the Resource and Environment Science Data Center (https://www.resdc.cn/, accessed on 5 April 2020). These land use data represent the most accurate land use remote sensing monitoring data product currently available for China [33,34]. The spatial resolution of these data is 1 km; we resampled the data to a spatial resolution of 8 km to maintain the same resolution as NDVI. Land use types include seven primary types of agricultural land, forest land, grassland, water, urban and rural land, unutilized land, and permanent glacier and snow. The primary types can be further sub-divided into 25 secondary types. Among natural vegetation, the secondary types of forest are forested land (Forestl), shrub land (Shrubl), and sparse forest land (Sparsel). The secondary types of grassland are high-coverage grassland (Hgra), medium-coverage grassland (Mgra), and low-coverage grassland (Lgra). The impacts of human activities were excluded in the current study by only analyzing vegetation in which forest and grassland types remained unchanged from 1980 to 2015; i.e., vegetation types (Forestl, Shrubl, Sparsel, Hgra, Mgra, and Lgra) that experienced no change between 1980 and 2015 were considered natural vegetation (Figure 1). The arid region of northwestern China is mainly grassland, with Hgra, Mgra, and Lgra accounting for 21%, 22%, and 49% of all naturally vegetated areas, whereas Forestl, Shrubl, and Sparsel only accounted for 4%, 2%, and 1%, respectively.
We downloaded the data for monthly precipitation, maximum temperature, minimum temperature, and mean temperature on 4 February 2021, which provides China’s monthly climate data at a 0.0083333° (~1 km) resolution from January 1983 to December 2015 [35,36]. These data were obtained from the website of the National Tibetan Plateau/Third Pole Environment Data Center (https://data.tpdc.ac.cn/zh-hans/ (accessed on 15 May 2021). These datasets are based on the global 0.5° climate dataset released by the Climate Research Unit (CRU) and the global high-resolution climate dataset released by WorldClim, downscaled in China through the Delta Space downscaling scheme [37], which are arguably the most suitable climate datasets, as a result of the fact that the region is data-sparse in China [38,39]. The average temperature of the natural vegetation is 3.39 °C, with the lowest and highest average temperatures for high-cover grassland and shrubs being −0.32 °C and 6.6 °C, respectively (Figure 1c). The average precipitation of natural vegetation is 176 mm, with the lowest and highest for woodland and low-cover grassland of 282 mm and 122 mm, respectively.
A national-level high-resolution (spatial resolution of 10 km) solar radiation dataset covering 33 years (1983–2015) was downloaded from the website of the National Tibetan Plateau/Third Pole Environment Data Center [40], which was accessed on 4 February 2021. We resampled this dataset to a spatial resolution of 8 km using bilinear interpolation. This dataset was developed by merging the global high-resolution (3 h, 10 km) surface solar radiation dataset (1983–2015) incorporating ISCCP-HXG cloud products with a ground-based sunshine duration-derived surface solar radiation dataset obtained from 2261 meteorological stations in China using the geographic weighted regression method. This dataset was used to obtain an approximate estimate of the solar radiation [41,42]. The solar radiation of natural vegetation is 188 W/m2, and there are relatively small differences between vegetation types (Figure 1e).
The aridity index (AI) characterizes the degree of dryness of the climate, and is defined as the ratio of precipitation (P) to potential evapotranspiration (PET). The present study calculated PET using a modified Hargreaves equation [43]. This equation computes the monthly reference evapotranspiration (ET0) of a grass crop based on the original Hargreaves equation. The input data to the equation include maximum and minimum temperatures and latitudes.

2.2. Method

The spatial resolution of all spatial data is 8 km. Generally, we analyzed the results from the following two aspects: (1) In terms of temporal changes, the relationship between NDVI and climate variables in the growing season from 1983 to 2015 at the grid scale and the regional scale (mean of all grids) is analyzed. (2) Spatially, the climate variables and the NDVI of the growing season in 1983–2015 is averaged for each grid, and named the mean NDVI and mean climate at the grid scale. Then, each grid is further analyzed as an independent sample. The asymmetric Savitzky–Golay filtering method in the Timesat software was used to reconstruct the NDVI time series, and to extract the vegetation phenology parameters [44]. The three extracted phenological parameters were the start of the growing season (SOS), the end of growing season (EOS), and the growing season length (GSL). The trend magnitude was indicated by Sen slope β:
β = M e d i a n ( x j x i j i )
where 1 < i < j < n, and n is the time length of the data. β > 0 and β < 0 indicate an increasing and decreasing trend, respectively. The Mann-Kendall (MK) test with the Trend Free Pre-whitening (TFPW) procedure was used to test the trends in the NDVI and climate variables. The advantage of the MK method is that it does not require the data to have a normal distribution [45,46]. The MK statistic Zs is as follows:
Z s = { S 1 V a r ( S ) S > 0 0 S = 0 S + 1 V a r ( S ) S < 0
S = k = 1 n 1 j = k + 1 n sgn ( x j x k )
sgn ( x j x k ) = { 1 x j x k > 0 0 x j x k = 0 1 x j x k < 0
V a r ( S ) = n ( n 1 ) × ( 2 n + 5 ) 18
Xj and Xk is the sequential data at the jth year and the kth year, respectively. A positive Zs indicates an increasing trend, and a negative Zs indicates a decreasing trend. If the absolute value of Zs is greater than 1.96, it indicates that the time series trend is significant.
The correlation coefficient and partial correlation analysis were used to analyze the responses of NDVI to temperature, precipitation, and solar radiation. Correlations between NDVI and the climate time series used detrended data, which removes the linear trend from each time series. Detrended analysis was performed in the R Package of “pracma” [47]; Pearson correlation and partial correlation analysis were performed in the R environment using the “stats” [48] and “ppcor” packages [49], respectively. The correlation coefficient coefficients are as follows:
r 12 = i = 0 n ( x 1 x 1 ¯ ) ( x 2 x 2 ¯ ) i = 0 n ( x 1 x 1 ¯ ) 2 i = 0 n ( x 2 x 2 ¯ ) 2
where r12 is the correlation coefficient between the variables x1 and x2; x 1 ¯ and x 2 ¯ are the mean values of the variables x1 and x2, respectively.
The second-order partial correlation coefficient were used to analyze the responses of NDVI to temperature, precipitation, and solar radiation, which can be calculated as follows:
r 12 34 = r 12 3 r 14 3 r 24 3 ( 1 r 14 3 2 ) ( 1 r 24 3 2 )
r 12 34 is a measure of the relationship between X1 and x2 while controlling for x3 and x4. The first-order partial correlation coefficient (take r 12 3 as example) was calculated as follows:
r 12 3 = r 12 r 13 r 23 ( 1 r 13 2 ) ( 1 r 23 2 )
The correlation coefficient coefficients and partial correlation coefficient were tested for significance using the t-test method [49].
The Hierarchical Partitioning Algorithm (HPA) was used to analyze the relative importance of climate variables to NDVI. Hierarchical partitioning was used to determine the contribution variance explained independently and jointly by each variable [50]. It uses goodness-of-fit measures for the full hierarchy of models based on N predictors (i.e., model (1), (2), …, (N), (1,2), …, (1,N), …, (1,2,3,…,N)). This method calculates the R2 of all possible orders of variables, then averages the joint variance of these variables; finally, the independent variance explained by each variable is the sum of the marginal variance and the averaged joint variance [51]. HPA reduces multicollinearity by determining the independent contribution of each explanatory variable to the response variable, thereby allowing the ranking of the importance of covariates when interpreting response variables. HPA was performed in the R Package of “hier.part” [52]; further details of HPA can be found in the literature [53].

3. Results

3.1. Phenological Changes in the Arid Region of Northwestern China

Regional SOS showed a significant advance of 7 d/33 a (Table 1), although the regional SOS was delayed from 2008, particularly for grassland (Figure 2). The same pattern was observed within the spatial distribution of SOS, with 34% of grids showing an advance in SOS. EOS was non-significantly delayed by 1.8 d/33 a, with 18% and 12% of grids showing a significant delay and advance in EOS, respectively. GSL increased by 8 d/33 a, with increases particularly notable in Forestl, Shrubl, and Sparsel, by 16 d, 12 d, and 7 d over the past 33 years, respectively. There was a non-significant increase in the regional GSL of grassland. In particular, there was a particularly notable increase after 2008, during which 28% of grids showed a significant increase, although 12% of the grids showed a decrease. The mean day of year (DOY) values of SOS and DOY were 104 d and 260 d, respectively. Therefore, the growing season (GS) extended from April to September.

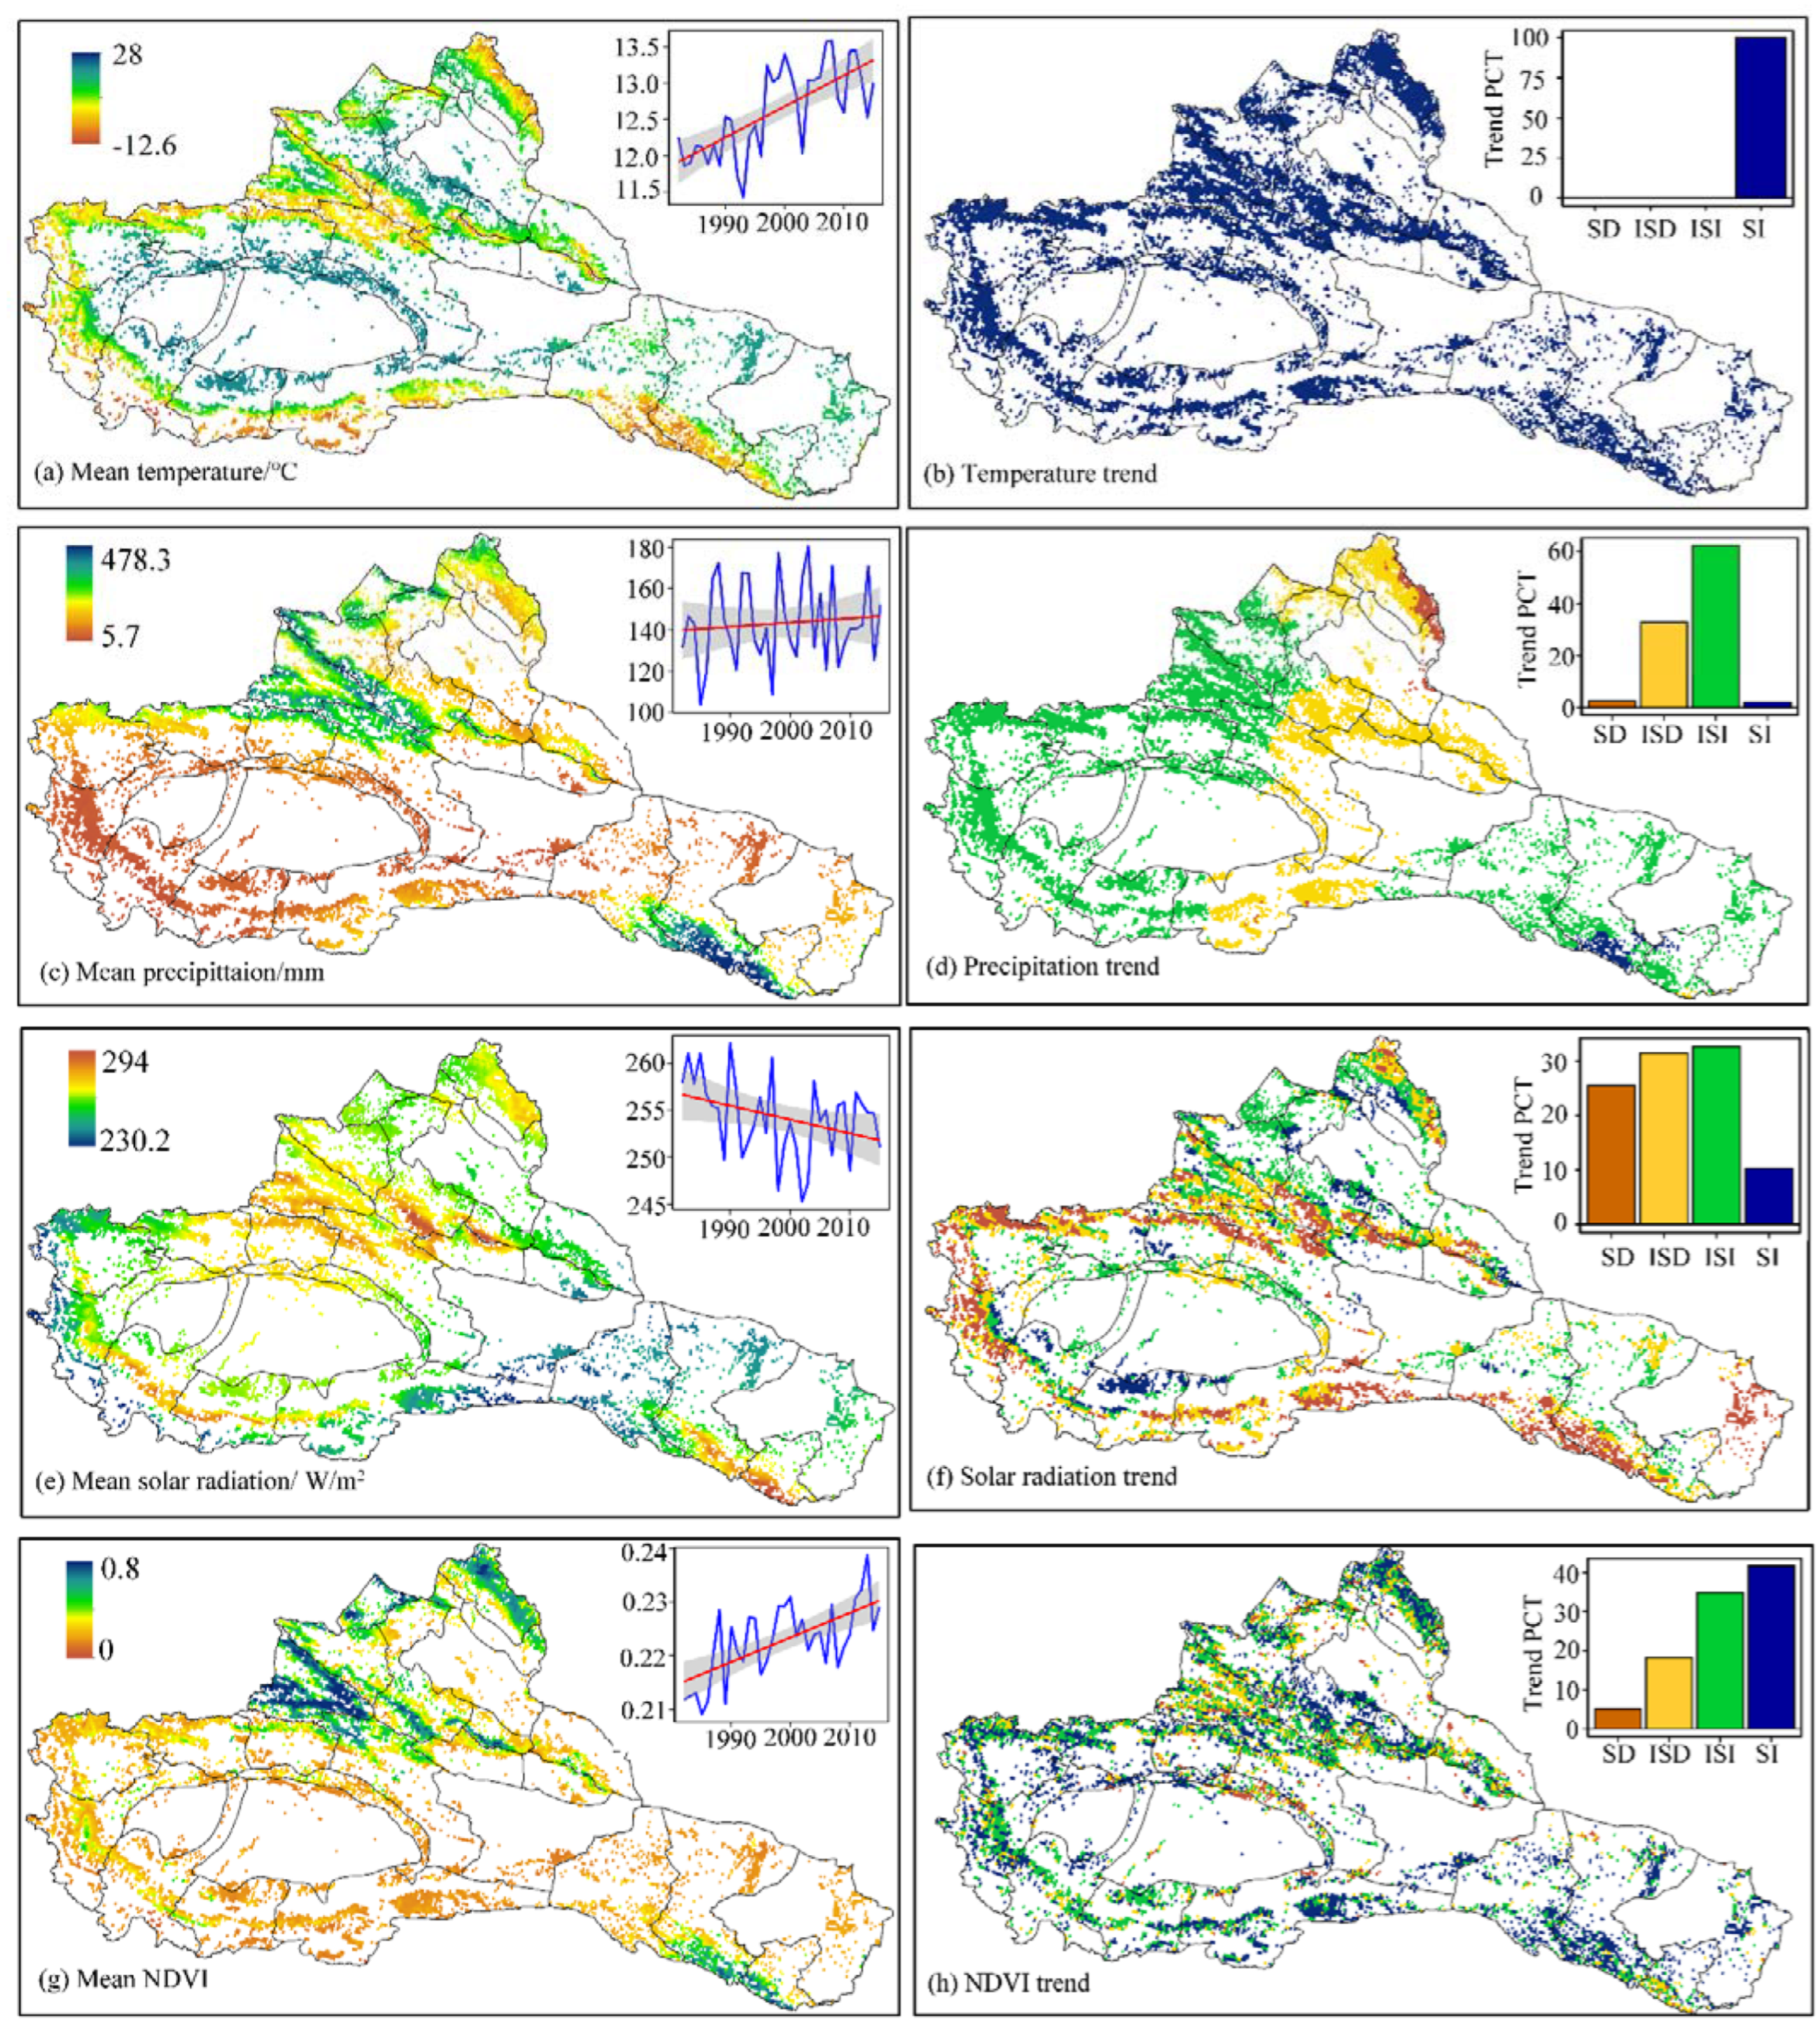
3.2. Spatial and Temporal Changes in Climate Variables and NDVI during the Growing Season

The distribution of mean temperature during the growing season showed an inverse relationship with elevation (temperature = −0.0057 × altitude + 24.976; R2 = 0.8, p < 0.01; not shown). Areas with lower and higher temperatures were noted in the mountains and plains, respectively (Figure 3a). Regional temperature showed a significantly increasing trend of 0.0428 °C/a (Table 2), with increases noted across all grids. Regional precipitation showed a non-significant increasing trend of 0.2021 mm/a (Table 2). Areas of high precipitation were mainly distributed in the high mountains, and particularly in the Qilan, Tianshan, and Altay mountains. Areas with low precipitation were mainly distributed in the middle and lower reaches of the river basin, and particularly in South Xinjiang and along the western Hexi corridor (Figure 3c). Trends of increasing precipitation were noted in the western and eastern regions, whereas a decreasing trend was observed in the central region, although a negligible proportion of grids showed a significant trend. Regional solar radiation (SR) showed a decreasing trend, with low SR mainly distributed in North Xinjiang and in the Tianshan and Qilian mountains (Figure 3e). Significant trends in SR were noted in 26% of the grids, which were mainly distributed in the river headwaters in the mountainous area (Table S1). Decreasing trends in SR were observed in 10% of the grids (Figure 3f), which were mainly in the lower reaches of the river basin (for example, Keriya River Basin and Yarkand River Basin). The regional NDVI showed a significantly increasing trend, with the highest NDVI being mainly distributed in the Tianshan, Altay, and Qilian mountains, and in the Ili River Basin. Significantly increasing and significantly decreasing trends in regional NDVI were noted in 42% and 5% of the grids, with the latter areas being mainly distributed in Tarim River Basin and Ili River Basin.

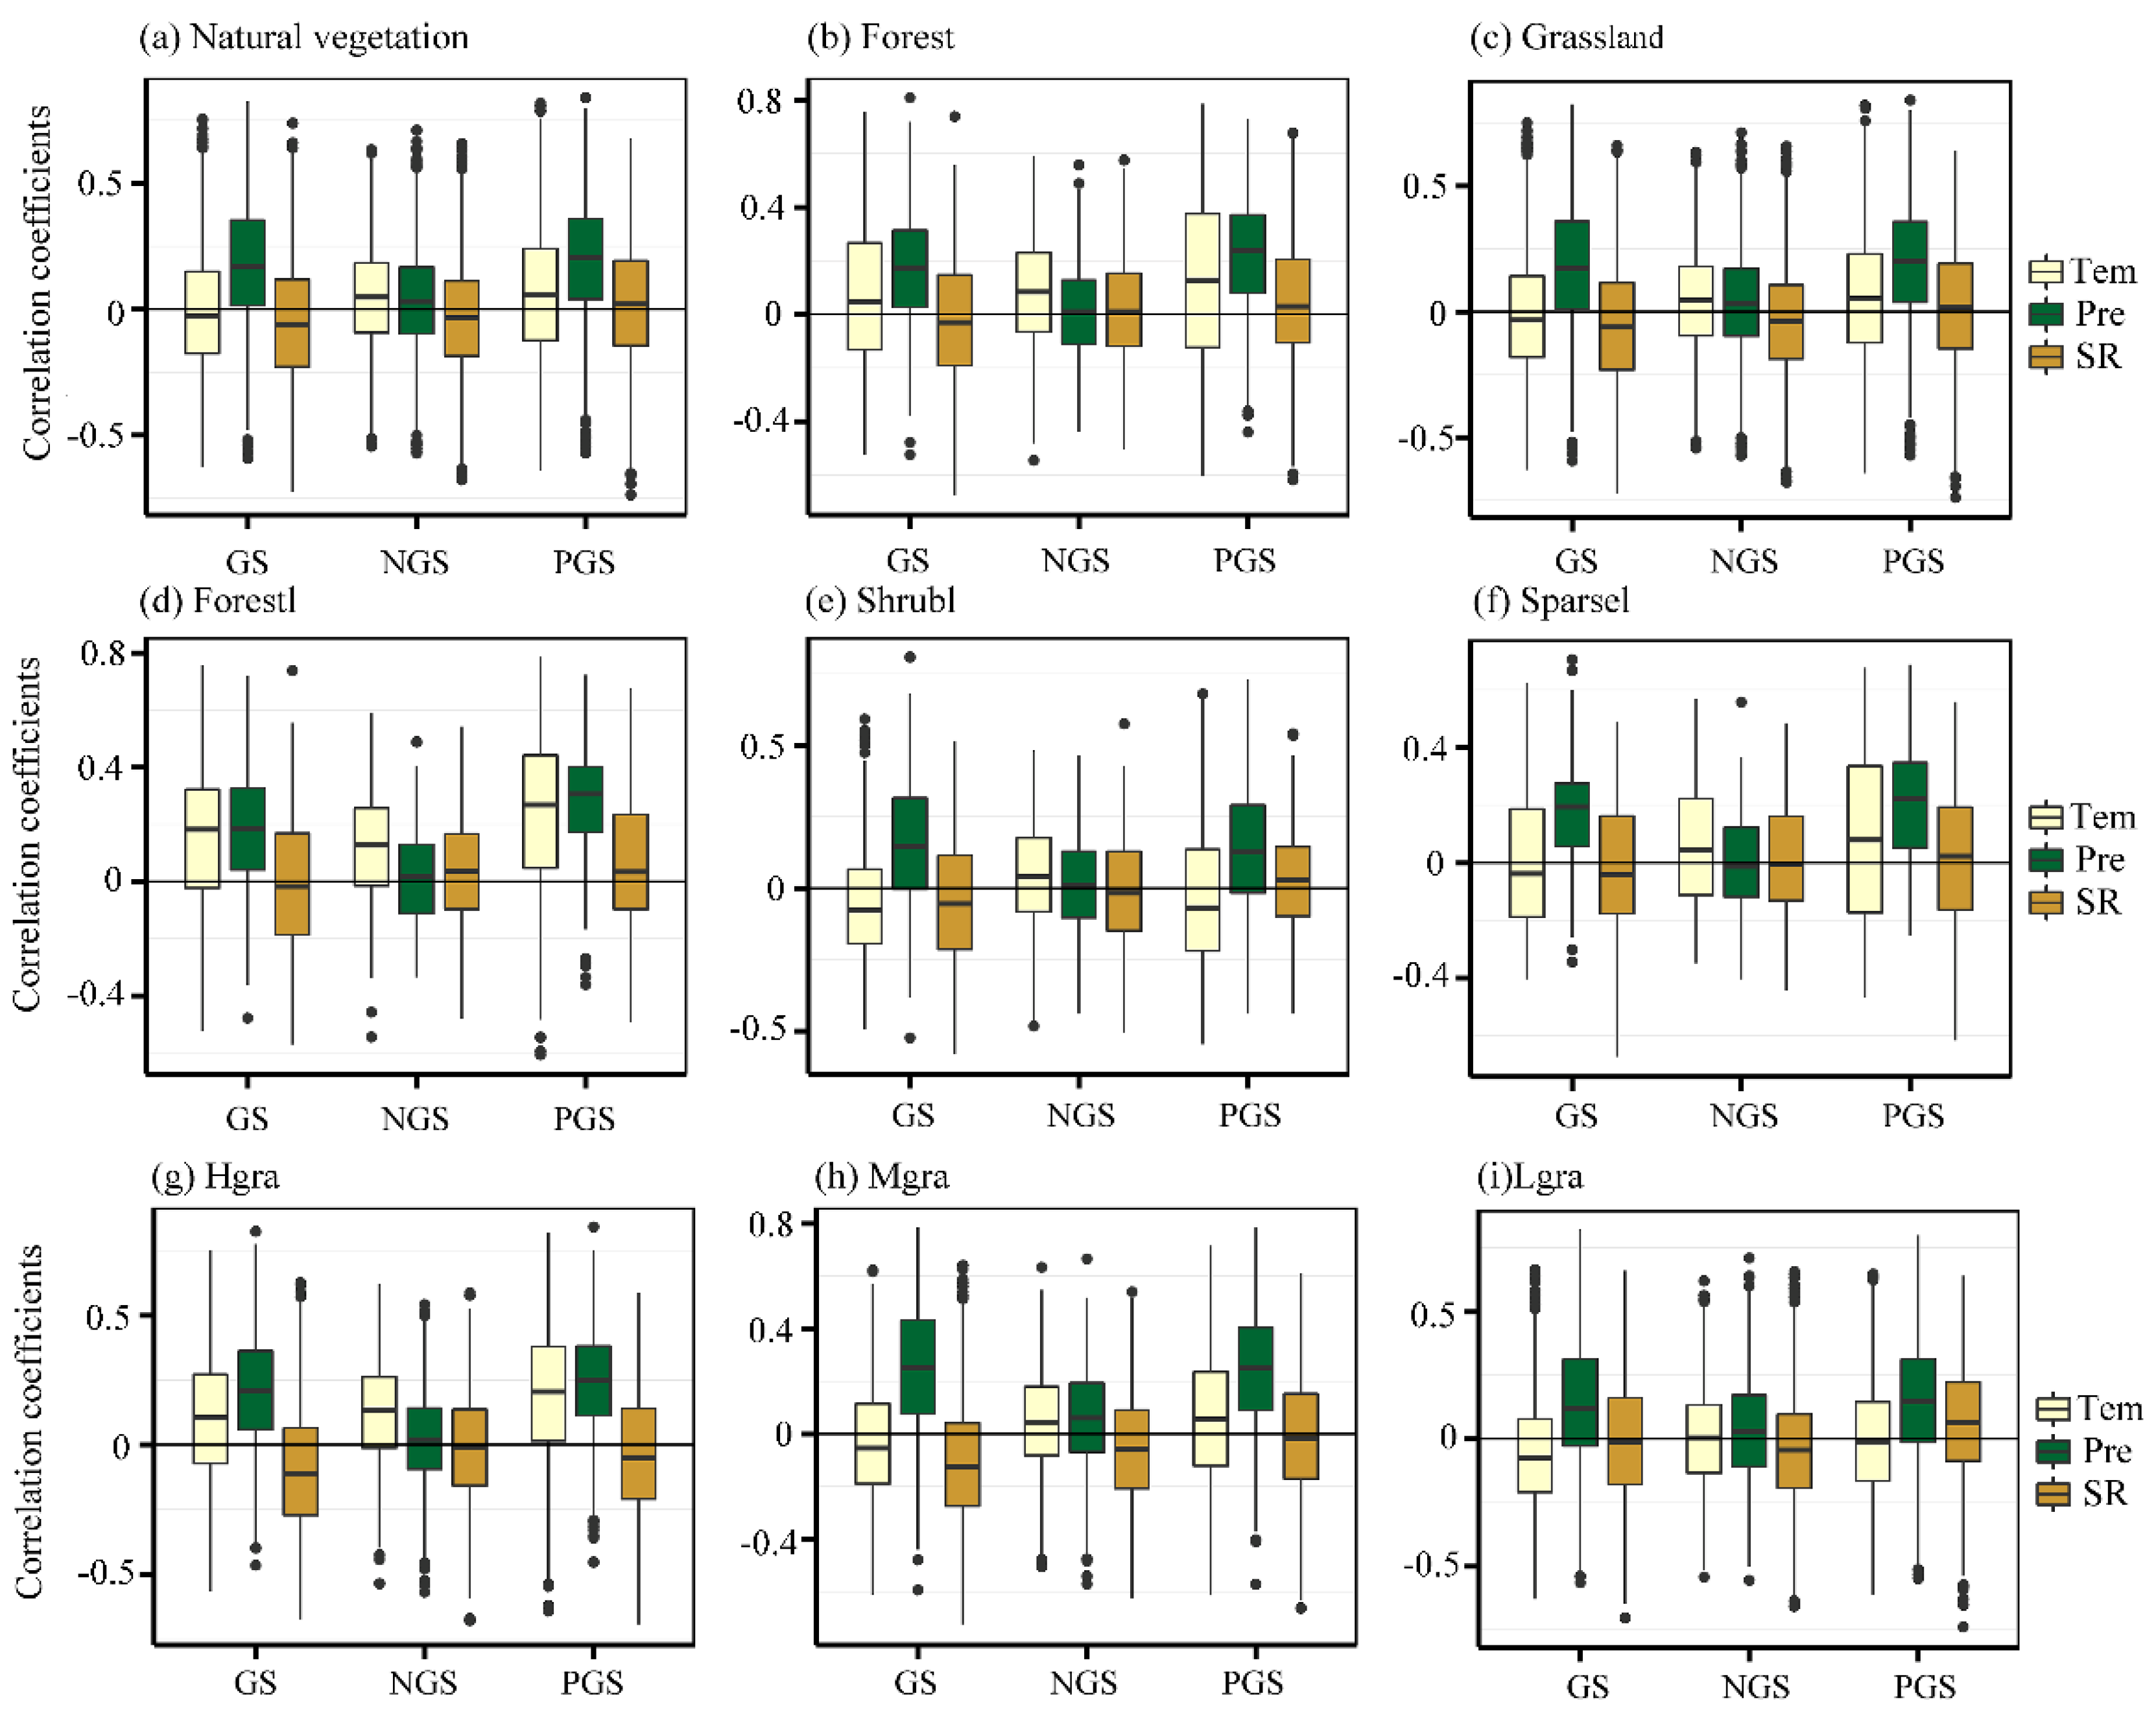
3.3. The Impacts of Mean Climate on Mean NDVI during the Growing Season

The NDVI first increased and then stabilized with increasing precipitation (Figure 4a). Increasing precipitation resulted in a rapid increase in forest NDVI up until 195 mm/a, after which, NDVI stabilized. The response of grassland NDVI to increasing precipitation could be categorized into three stages: (1) The NDVI showed no response to increasing precipitation up until 76.6 mm/a, (2) the NDVI increased rapidly with increasing precipitation when precipitation was in the range of 76.6–218 mm/a, and (3) the NDVI stabilized with increasing precipitation above 218 mm/a. The NDVI first increased and then decreased with increasing temperature as temperature exceeded the optimal plant growth temperature. A temperature exceeding the optimal temperature for plant growth can result in increases in the respiration and transpiration of vegetation. After this point, nutrient decomposition is accelerated and the lifespans of leaves and root activities are shortened, resulting in a reduction in vegetation NDVI. An increasing temperature resulted in a rapid increase in forest NDVI, up until a threshold temperature of 11.6 °C, after which, NDVI decreased. The results indicated the temperature range of 7.43–11.6 °C to be optimal for forest growth. Increases in temperature up until 9.78 °C resulted in increases in grassland NDVI, with increases above this temperature resulting in decreases in NDVI. A temperature range of 3.69–9.78 °C was found to be optimal for grassland growth. The relationship between NDVI and solar radiation was relatively simple, with a decreasing NDVI with increasing radiation.
The present study extracted the means of the NDVI and climate variables at the grid scale. Correlation analysis showed that the spatial distribution of forest NDVI was significantly correlated with temperature, precipitation, and solar radiation (Table 3). The spatial distribution of grassland was mainly affected by precipitation and solar radiation, showing positive and negative correlations, respectively. Partial correlation analysis showed that the distribution of forests was generally negatively correlated with both temperature and solar radiation. The distribution of grassland showed the strongest correlations with precipitation and solar radiation, with positive and negatively correlations, respectively (Table 3).

3.4. The Impacts of Climate Change on Vegetation Changes

A significant positive correlation was noted between regional NDVI and temperature (Table 2, Figure 5a) in 10% of the grids, particularly for forest in which an increasing temperature resulted in an increasing growth in all types of forest (Figure 6). Negative correlations between regional NDVI and temperature were noted mainly in the lower reaches of rivers (Figure 5a). This result could be attributed to an increase in temperature, resulting in an increase in evapotranspiration and the aggravation of drought in water-poor areas, thereby inhibiting the growth of vegetation. Additionally, there was a negative correlation between desert vegetation coverage and temperature that was mostly distributed along the outermost edges of the oasis areas. Irrigation water supply gradually disappeared with increasing distance from the oases, resulting in a reduction in soil moisture content. Increases in temperature accelerated the evaporation of soil moisture, resulting in a decline in vegetation coverage. Significantly positive correlations were observed between NDVI and precipitation in 30% of the grids (Table 2, Figure 6d). The correlation between NDVI and precipitation was higher for grassland than for forest (Table 2), indicating the greater sensitivity of grass to precipitation. Significantly positive correlations between Mgra and precipitation were noted in 41% of the grids, whereas only 24% of grids showed this relationship between Lgra and precipitation (Table S2). This result indicated that precipitation is the main source of recharge for medium-cover grassland. In addition to precipitation, other forms of recharge, such as runoff, are important for low-cover grassland growth. Precipitation during the NGS showed a weaker relationship with NDVI, with significantly positive correlations only noted in 8% of grids. The strength of the correlation between solar radiation and NDVI was relatively small compared with those of precipitation and temperature (Table 2). Negative correlations between solar radiation and NDVI were noted among most grids, with only 6% of grids showing significantly negative correlations. The correlation between solar radiation and NDVI for grassland exceeded that for forest at both the grid and regional scales (Table 2 and Table 3). This result further indicates that grassland is more sensitive to changes in solar radiation than forest.
The present study also analyzed the partial correlations between NDVI and climate variables. There were significant correlations between precipitation and temperature at a regional scale in all vegetation types (Table 2). The positive correlation between precipitation and temperature at the grid scale was stronger than that of solar radiation (Figure 5 and Figure 6), indicating that precipitation and temperature are the main factors affecting vegetation changes in the arid region of northwestern China. A box plot of this correlation at all the grids showed a low partial correlation coefficient, thereby indicating that changes in SR have less impacts on changes to NDVI.

3.5. The Impacts of the Aridity Index on Vegetation

The present study also analyzed the relationship between AI and vegetation. Regional ET showed a non-significant increasing trend of 0.47 mm/a. Areas of high ET were mainly distributed in the lower reaches of the river basin in South Xinjiang (Figure 7a). Significantly increasing trends in ET were observed in 20% of the grids. Regional AI showed a non-significant change, with only 5% of grids showing a significantly decreasing trend. Similar to precipitation, areas of high AI were distributed in the Altay, Tianshan, and Qilian mountains. The spatial distribution of AI was the same as that of precipitation (Figure 7d), with increase trends in AI noted in the western and eastern regions. This result indicates that AI is mainly affected by precipitation in the arid region of northwestern China. A significantly positive relationship between NDVI and AI was observed in 29% of the grids (Table S3). A larger percentage of grids with Mgra showed a significantly positive correlation between AI and NDVI, indicating that meteorological drought has the greatest impact on Mgra. AI had less impact on NDVI during the NGS, indicating that meteorological drought has relatively little impact on vegetation during the NGS.
The mean NDVI for forest and grassland all showed an initial increasing trend, followed by a decreasing trend (Figure 8). The NDVI of forest rapidly increased with increasing AI up until a threshold of 0.31, above which NDVI stabilized up until an AI of 0.84, after which NDVI decreased (Figure 8a). The AI of grassland increased with increasing AI until a threshold of 0.39, above which the NDVI of grassland increased rapidly with increasing AI (Figure 8b). However, increases in AI above 0.86 resulted in decreases in grassland NDVI. The NDVI of grassland remained stable at an AI of between 0.39 and 0.86, indicating that this range of AI is optimal for grassland.

3.6. Contributions of Various Climate Variables to Changes in NDVI

Precipitation and temperature were found to be the climate variables most affecting temporal changes in vegetation in the arid region of northwestern China, explaining 36% and 21% of changes in vegetation, respectively (Figure 9a). Temperature and precipitation explained 36% and 15% of changes in NDVI in Forestl, respectively, whereas they only explained 10% and 13% of changes in NDVI of shrubs, respectively. This result indicated that shrub growth is more sensitive to non-climate-related factors compared to forest. Temperature and precipitation explained 35% and 21% of changes in grassland NDVI, respectively. Hgra was most affected by temperature, Mgra was the most affected by precipitation, whereas Lgra showed a lower sensitivity to precipitation than Hgra and Mgra.
The spatial distribution of mean NDVI during the growing season was mainly affected by precipitation and solar radiation, explaining 29% and 18% of NDVI distribution, respectively (Figure 9b). However, these relationships were dramatically different between forest and grassland. The contributions of precipitation and solar radiation in explaining the NDVI of forest both exceeded 10%, indicating that the distribution of forest is affected by all three factors, and particularly temperature and precipitation. The contributions of climate variables to changes in Forestl NDVI were low, indicating that Forestl is relatively less affected by mean climate. The spatial distribution of grassland was mainly affected by precipitation and solar radiation, accounting for 29% and 17% of NDVI, respectively. The contribution of temperature to grassland NDVI was negligible in all grassland types, explaining less than 5%.

4. Discussion

The results showed that the NDVI increased significantly for the natural vegetation during the growing season in the arid region of Northwest China, which is consistent with other studies. For example, Piao et al. [54] found that NDVI in the northwest China increased significantly. Zhao et al. [55] showed that about 30% of the vegetation in Xinjiang Province from 1982 to 2003 had an increasing trend in NDVI during the growing season. Wang et al. [56] also showed a increasing trend for NDVI, especially in the Tianshan Mountains, Altai Mountains, and Tarim Basin in Xinjiang. Our results also showed that the significant rise area of NDVI is mainly located upstream of the river. In these regions, climate warming has decreased climatic constraints, facilitating increases in vegetation greenness over the high latitudes [57,58,59]. In contrast, downstream of the river, mainly in basins (such as Tarim Basin, Ili River Basin), the NDVI showed a downward trend. There is rare precipitation in the lower reaches of the inland river, and the change of NDVI is more greatly affected by human activities such as irrigation.
The results of this paper showed that precipitation was the main driver of changes in the NDVI during the growing season. This observation could be related to the arid and semi-arid nature of the study area, with limited precipitation showing an uneven spatial and temporal distribution. Precipitation was the main factor limiting changes in the NDVI [60,61], which can change soil aeration conditions and increase soil moisture [62]. In central Asia, the main precipitation control area accounts for 69% of the entire study area, and is mainly distributed in desert plains, especially in southern Xinjiang, which are areas with the greatest rainfall deficiency [63]. Kong et al. [64] found that the browning of summer vegetation in the Caspian Sea is mainly affected by water stress. Gang et al. [65] showed that during 1981–2010, grassland and desert vegetation NPP in China, North America, Australia, and Europe was significantly positively correlated with precipitation changes, while the response to air temperature was not significantly or negatively correlated. Our study indicated that the NDVI in the arid region of China is mainly controlled by precipitation, except for the high latitudes and high-altitude mountainous areas, which is consistent with the conclusion of [66]. Piao et al. [9] pointed out that although rising atmospheric carbon dioxide concentration, climate change, nitrogen deposition, and land use changes are thought to affect vegetation greening, in water-limited ecosystems, changes in precipitation have been suggested as the main drivers of greening and browning. Our results also showed that natural vegetation conditions in Northwest China have improved, and the increased precipitation has a positive impact on ecological benefits, which is in agreement with other studies [67].
Our research also showed that temperature was the most important climatic factor affecting the growth of vegetation in the arid region of northwestern China. This could be attributed to an increase in temperature during spring and autumn leading to an advanced SOS [68] and delayed EOS, respectively [69]. The melting of snow and frozen soil with increasing temperature leads to high water availability and a slow response to drought. In addition, an increase in temperature in mountainous areas can induce an accelerated decomposition of soil organic matter and an increase soil activity. This is conducive to the growth and development of plant roots [70].The relationship between mean air temperatures and mean NDVI first increased and then decreased, and the increase in air temperature was beneficial to increase the growth of vegetation, which was consistent with the results of [71]. Wang et al. [72] found that the decline in vegetation productivity in most regions of Northwest North America since the 1990s cannot be explained by drought stress, but is closely related to a drop in spring temperatures in the region. Propastin et al. [73] analyzed the inter-annual and inter-seasonal vegetation changes in Central Asia, and found that temperature increase is the only factor affecting NDVI changes in spring. Lamchin et al. [20] found that the increase in evapotranspiration and air temperature is usually accompanied by the decrease in vegetation greenness and precipitation, and considered that air temperature is the main factor of Kazakhstan. However, excessive warming will adversely affect the vegetation activity process. Excessive warming may accelerate the evaporation of soil water, and then vegetation can prevent its own water loss by reducing the leaf area and the light saturation point, resulting in a corresponding reduction in vegetation coverage, and limiting the rate of photosynthesis [74].
The present study mainly analyzed the impact of climate on regional- and grid-scale growing season vegetation, and did not conduct analysis over finer temporal scales. At the same time, the contribution variances of temporal changes and the spatial means of NDVI climate variables in the arid region of northwestern China were 62% and 51%, respectively. This result indicates that the spatiotemporal changes in vegetation are not only affected by temperature, precipitation, and solar radiation, but are also affected by other factors, such as human activities. Human factors can accelerate or decelerate the process of ecosystem damage or restoration. Policy factors can significantly change the ecological environment over the short term. The Chinese government has implemented a series of vegetation protection and ecological environment restoration projects in response to the ecological challenges that have emerged in the arid region of Northwest China. These projects have achieved remarkable results [75]. For example, Xinjiang Province has implemented a policy of returning farmland to forests for ecosystem restoration since 2000. This policy involved a grazing prohibition, temporarily suspending the grazing of degraded grassland, and basic categorization of grassland in ecologically fragile deserts and sandy areas, and in degraded grassland areas. Liu et al. [76] similarly showed that ecological restoration policies are the dominant factor driving the mitigation of desertification. The Chinese government initiated a program of comprehensive management of the Tarim River Basin in 2001. This program involved launching the ecological water transportation plan to the lower reaches of the Tarim River, thereby halting periods of low flow in the lower reaches of the Tarim River, and contributing to a significant increase in vegetated areas [77].
This paper also contains existing limitations and uncertainty. In order to make the spatial resolution consistent with the GIMMS NDVI, we used the precipitation, temperature, and land use data, re-projected and resampled using bilinear/nearest interpolation into the GIMMS NDVI projection, and resampled to 8 km resolution. At present, it is difficult to find high-quality data with matching spatial resolution with GIMMS NDVI, and so resampling is a good choice. However, there are still some shortcomings in the calculation process. For example, when land use types are resampled from 1 km to 8 km, many land use types will be ignored, so there may be some uncertainty in resampling to the same resolution as NDVI. Future studies could analyze the factors driving vegetation change in the northwest arid area in more depth, using higher quality remote sensing and GIS data.

5. Conclusions

The preset study analyzed the spatiotemporal changes in the growing season NDVI of natural vegetation in the arid region of Northwest China. The relationships between NDVI and climate variables were identified through correlation analysis and partial correlation analysis, and the Hierarchical Partitioning Algorithm was used to quantify the contributions of the different climate variables to vegetation change. The following conclusions could be derived from the results of the present study:
(1) The mean DOY values of SOS, EOS, and LGS were 104 d, 260 d, and 155 d, respectively. Regional SOS was advanced by 7 d/34 a, whereas EOS and LGS were non-significant delayed by 2 d/33 a and 8 d/33 a, respectively. The trends in SOS, EOS, and GSL changed after 2008, with that of SOS changing from advance to delay, and those of EOS and GSL changing from delay to advance.
(2) Regional temperature showed a significantly increasing trend of 0.0428 °C/a. Precipitation showed a non-significant increasing trend at regional and grid scales. A decreasing trend in solar radiation was evident in 25% of the grids, with a regional trend of −0.1396 w/m2/a. There were significant increases in NDVI in 40% of the grids.
(3) A significantly positive correlation was also observed between NDVI and precipitation in 42% of the grids, with this relationship being particularly evident for Mgra. Temperature significantly impacted NDVI, particularly that of Foretsl, with 26% of the grids showing a significantly positive correlation between temperature and NDVI. A negative correlation was observed between solar radiation and NDVI, although this correlation was weaker than those between NDVI and precipitation and temperature.
(4) The spatial distribution of the mean NDVI of forest was closely related to the mean temperature, precipitation, and solar radiation. The spatial distribution of grassland NDVI was closely related to those of precipitation and solar radiation. The NDVI showed an inverse relationship with solar radiation. The NDVI initially increased and then decreased with increasing temperature. The NDVI first increased and then stabilized with increasing precipitation.
(5) There was a non-significant change in regional AI, with AI being mainly affected by changes in precipitation. The NDVI was significant correlated with AI, particularly for Mgra. The mean NDVI first increased and then decreased with increasing AI, with the optimal AI for forest and grassland growth being found within the ranges of 031–0.84 and 0.39–0.89, respectively.
(6) Regional changes in forest and grassland were driven by temperature and precipitation, with these factors explaining 36% and 15% of variation in forest, and 35% and 21% of variation in grassland, respectively. The spatial distribution of mean forest NDVI was affected by mean temperature, mean precipitation, and mean solar radiation, whereas only precipitation and solar radiation affected grassland NDVI.

Supplementary Materials

The following supporting information can be downloaded at: www.mdpi.com/article/10.3390/f13071082/s1, Table S1. Percentage of grids with trends for climate variables and NDVI (SD—significant decrease trend; ISD—non-significant decrease trend; ISI—non-significant increase trend; SI—significant increase trend; Table S2. Percentages of grids showing relationships between Normalized Difference Vegetation Index (NDVI) and climate variables in the arid region of northwestern China (SNC, significantly negative correlation; ISNC, non-significant negative correlation; ISPC, non-significant positive correlation; SPC, significantly positive correlation);Table S3. Percentage of grids with a relationship between Normalized Difference Vegetation Index (NDVI) and aridity index (AI) in the arid region of northwestern China (SNC, significantly negative correlation; ISNC, non-significant negative correlation; ISPC, non-significant positive correlation; SPC, significantly positive correlation).

Author Contributions

Conceptualization, Z.L. and H.W.; methodology, H.W. and Y.N.; software, H.W.; formal analysis, X.L. and Y.P.; writing—original draft preparation, R.F. and H.W.; writing—review and editing, Q.H. and H.W.; visualization, L.C. All authors have read and agreed to the published version of the manuscript.

Funding

This research was supported by Natural Science Foundation of Xinjiang Uygur Autonomous Region (2021D01E02), Open fund of State Key Laboratory of Desert and Oasis Ecology (G2020-02-01), and the National Key Research and Development Program (2019YFA0606902).

Data Availability Statement

The data that support the findings of this study are available from the corresponding author upon reasonable request.

Acknowledgments

The authors would like to thank all the reviewers who participated in the review.

Conflicts of Interest

The authors declare no conflict of interest.

References

  1. Prentice, I.C.; Bondeau, A.; Cramer, W.; Harrison, S.P.; Hickler, T.; Lucht, W.; Sitch, S.; Smith, B.; Sykes, M.T. Dynamic global vegetation modeling: Quantifying terrestrial ecosystem responses to large-scale environmental change. In Terrestrial Ecosystems in a Changing World; Springer: Berlin/Heidelberg, Germany, 2007; pp. 175–192. [Google Scholar]
  2. Jia, L.; Li, Z.B.; Xu, G.C.; Ren, Z.P.; Li, P.; Cheng, Y.T.; Yu, S. Dynamic change of vegetation and its response to climate and topographic factors in the Xijiang River basin, China. Environ. Sci. Pollut. Res. 2020, 27, 11637–11648. [Google Scholar] [CrossRef]
  3. Sitch, S.; McGuire, A.D.; Kimball, J.; Gedney, N.; Gamon, J.; Engstrom, R.; Wolf, A.; Zhuang, Q.; Clein, J.; McDonald, K.C. Assessing the carbon balance of circumpolar Arctic tundra using remote sensing and process modeling. Ecol. Appl. 2007, 17, 213–234. [Google Scholar] [CrossRef] [Green Version]
  4. Muchow, R.C.; Sinclair, T.R.; Bennett, J.M. Temperature and solar radiation effects on potential maize yield across locations. Agron J. 1990, 82, 338–343. [Google Scholar] [CrossRef]
  5. Xie, Y.; Wang, X.; Silander, J.A. Deciduous forest responses to temperature, precipitation, and drought imply complex climate change impacts. Proc. Natl. Acad. Sci. USA 2015, 112, 13585–13590. [Google Scholar] [CrossRef] [Green Version]
  6. AghaKouchak, A.; Farahmand, A.; Melton, F.; Teixeira, J.; Anderson, M.; Wardlow, B.D.; Hain, C. Remote sensing of drought: Progress, challenges and opportunities. Rev. Geophys. 2015, 53, 452–480. [Google Scholar] [CrossRef] [Green Version]
  7. Goward, S.N.; Markham, B.; Dye, D.G.; Dulaney, W.; Yang, J. Normalized difference vegetation index measurements from the Advanced Very High Resolution Radiometer. Remote Sens. Environ. 1991, 35, 257–277. [Google Scholar] [CrossRef]
  8. Guha, S.; Govil, H. An assessment on the relationship between land surface temperature and normalized difference vegetation index. Environ. Dev. Sustain. 2021, 23, 1944–1963. [Google Scholar] [CrossRef]
  9. Piao, S.; Wang, X.; Park, T.; Chen, C.; Lian, X.; He, Y.; Bjerke, J.W.; Chen, A.; Ciais, P.; Tømmervik, H. Characteristics, drivers and feedbacks of global greening. Nat. Rev. Earth Environ. 2020, 1, 14–27. [Google Scholar] [CrossRef]
  10. Chen, C.; Park, T.; Wang, X.; Piao, S.; Xu, B.; Chaturvedi, R.K.; Fuchs, R.; Brovkin, V.; Ciais, P.; Fensholt, R. China and India lead in greening of the world through land-use management. Nat. Sustain. 2019, 2, 122–129. [Google Scholar] [CrossRef]
  11. Pan, N.; Feng, X.; Fu, B.; Wang, S.; Ji, F.; Pan, S. Increasing global vegetation browning hidden in overall vegetation greening: Insights from time-varying trends. Remote Sens. Environ. 2018, 214, 59–72. [Google Scholar] [CrossRef]
  12. Li, H.; Zhang, H.; Li, Q.; Zhao, J.; Guo, X.; Ying, H.; Wang, S. Vegetation productivity dynamics in response to climate change and human activities under different topography and land cover in Northeast China. Remote Sens. 2021, 13, 975. [Google Scholar] [CrossRef]
  13. Tao, Z.; Wang, H.; Liu, Y.; Xu, Y.; Dai, J. Phenological response of different vegetation types to temperature and precipitation variations in northern China during 1982–2012. Int. J. Remote Sens. 2017, 38, 3236–3252. [Google Scholar] [CrossRef]
  14. Nemani, R.R.; Keeling, C.D.; Hashimoto, H.; Jolly, W.M.; Piper, S.C.; Tucker, C.J.; Myneni, R.B.; Running, S.W. Climate-driven increases in global terrestrial net primary production from 1982 to 1999. Science 2003, 300, 1560–1563. [Google Scholar] [CrossRef] [PubMed] [Green Version]
  15. Zhang, M.; Liu, X.; Nazieh, S.; Wang, X.; Nkrumah, T.; Hong, S. Spatiotemporal distribution of grassland NPP in Gansu province, China from 1982 to 2011 and its impact factors. PLoS ONE 2020, 15, e0242609. [Google Scholar] [CrossRef]
  16. Kawabata, A.; Ichii, K.; Yamaguchi, Y. Global monitoring of interannual changes in vegetation activities using NDVI and its relationships to temperature and precipitation. Int. J. Remote Sens. 2001, 22, 1377–1382. [Google Scholar] [CrossRef]
  17. Bi, X.; Li, B.; Zhang, L.; Nan, B.; Zhang, X.; Yang, Z. Response of grassland productivity to climate change and anthropogenic activities in arid regions of Central Asia. PeerJ 2020, 8, e9797. [Google Scholar] [CrossRef]
  18. Yin, G.; Hu, Z.; Chen, X.; Tiyip, T. Vegetation dynamics and its response to climate change in Central Asia. J. Arid Land 2016, 8, 375–388. [Google Scholar] [CrossRef] [Green Version]
  19. Rousta, I.; Olafsson, H.; Zhang, H.; Moniruzzaman, M.; Baranowski, P. Anthropogenic factors affecting the vegetation dynamics in the arid Middle East. Preprints 2020. [Google Scholar] [CrossRef]
  20. Lamchin, M.; Lee, W.K.; Jeon, S.W.; Wang, S.W.; Lim, C.H.; Song, C.; Sung, M. Long-term trend and correlation between vegetation greenness and climate variables in Asia based on satellite data. Sci. Total Environ. 2018, 618, 1089–1095. [Google Scholar] [CrossRef]
  21. Zhao, W.; Hu, Z.; Guo, Q.; Wu, G.; Chen, R.; Li, S. Contributions of Climatic Factors to Interannual Variability of the Vegetation Index in Northern China Grasslands. J. Clim. 2020, 33, 175–183. [Google Scholar] [CrossRef]
  22. Zheng, K.; Tan, L.; Sun, Y.; Wu, Y.; Duan, Z.; Xu, Y.; Gao, C. Impacts of climate change and anthropogenic activities on vegetation change: Evidence from typical areas in China. Ecol. Indic. 2021, 126, 107648. [Google Scholar] [CrossRef]
  23. Zhao, Y.; Feng, Q.; Lu, A. Spatiotemporal variation in vegetation coverage and its driving factors in the Guanzhong Basin, NW China. Ecol. Inform. 2021, 64, 101371. [Google Scholar] [CrossRef]
  24. Zhang, X.; Wang, J.; Gao, Y.; Wang, L. Variations and controlling factors of vegetation dynamics on the Qingzang Plateau of China over the recent 20 years. Geogr. Sustain. 2021, 2, 74–85. [Google Scholar] [CrossRef]
  25. Shang, J.; Zhang, Y.; Peng, Y.; Huang, Y.; Zhu, L.; Wu, Z.; Wang, J.; Cui, Y. Climate change drives NDVI variations at multiple spatiotemporal levels rather than human disturbance in Northwest China. Environ. Sci. Pollut. Res. 2021, 29, 13782–13796. [Google Scholar] [CrossRef]
  26. Chen, Y.; Yang, Q.; Luo, Y.; Shen, Y.; Pan, X. Ponder on the issues of water resources in the arid region of northwest China. Arid. Land Geogr. 2012, 1, 1–9. (In Chinese) [Google Scholar]
  27. Hu, S.; Ma, R.; Sun, Z.; Ge, M.; Zeng, L.; Huang, F.; Bu, J.; Wang, Z. Determination of the optimal ecological water conveyance volume for vegetation restoration in an arid inland river basin, northwestern China. Sci. Total. Environ. 2021, 788, 147775. [Google Scholar] [CrossRef] [PubMed]
  28. Wang, H.; Li, Z.; Cao, L.; Feng, R.; Pan, Y. Response of NDVI of Natural Vegetation to Climate Changes and Drought in China. Land 2021, 10, 966. [Google Scholar] [CrossRef]
  29. Zhou, Y.; Fu, D.; Lu, C.; Xu, X.; Tang, Q. Positive effects of ecological restoration policies on the vegetation dynamics in a typical ecologically vulnerable area of China. Ecol. Eng. 2021, 159, 106087. [Google Scholar] [CrossRef]
  30. Yu, M.; Gao, Q. Increasing Summer Rainfall and Asymmetrical Diurnal and Seasonal Warming Enhanced Vegetation Greenness in Temperate Deciduous Forests and Grasslands of Northern China. Remote Sens. 2020, 12, 2569. [Google Scholar] [CrossRef]
  31. National Center for Atmospheric Research Staff (NCAR). NDVI: Normalized Difference Vegetation Index-3rd Generation: NASA/GFSC GIMMS. 2018. Available online: https://climatedataguide.ucar.edu/climate-data/ndvi-normalized-difference-vegetation-index-3rd-generation-nasagfsc-gimms (accessed on 20 May 2020).
  32. Pinzon, J.E.; Tucker, C.J. A Non-Stationary 1981–2012 AVHRR NDVI3g Time Series. Remote Sens. 2014, 6, 6929–6960. [Google Scholar] [CrossRef] [Green Version]
  33. Chinese Academy of Sciences Resource and Environmental Science Data Center. Land Use Dataset in China (1980–2015). 2021. Available online: https://www.resdc.cn/ (accessed on 5 April 2020).
  34. Liu, J.; Liu, M.; Deng, X. The land use and land cover change database and its relative studies in China. J. Geogr. Sci. 2002, 12, 275–282. [Google Scholar]
  35. Peng, S.; Gang, C.; Cao, Y.; Chen, Y. Assessment of climate change trends over the Loess Plateau in China from 1901 to 2100. Int. J. Climatol. 2018, 38, 2250–2264. [Google Scholar] [CrossRef]
  36. Peng, S.; Ding, Y.; Wen, Z. Spatiotemporal change and trend analysis of potential evapotranspiration over the Loess Plateau of China during 2011–2100. Agric. Forest Meteorol. 2017, 233, 183–194. [Google Scholar] [CrossRef] [Green Version]
  37. Peng, S.; Ding, Y.; Liu, W.; Li, Z. 1 km monthly temperature and precipitation dataset for China from 1901 to 2017. Earth Syst. Sci. Data 2019, 11, 1931–1946. [Google Scholar] [CrossRef] [Green Version]
  38. Zhang, Z.; Ding, J.; Zhu, C.; Chen, X.; Wang, J.; Han, L.; Xu, D. Bivariate empirical mode decomposition of the spatial variation in the soil organic matter content: A case study from NW China. Catena 2021, 206, 105572. [Google Scholar] [CrossRef]
  39. Li, Y.; Sun, Y.; Li, J.; Gao, C. Socioeconomic drivers of urban heat island effect: Empirical evidence from major Chinese cities. Sustain. Cities Soc. 2020, 63, 102425. [Google Scholar] [CrossRef]
  40. Feng, F.; Wang, K. Merging High-Resolution Satellite Surface Radiation Data with Meteorological Sunshine Duration Observations over China from 1983 to 2017. Remote Sens. 2021, 13, 602. [Google Scholar] [CrossRef]
  41. Cao, Q.; Liu, Y.; Sun, X.; Yang, L. Country-level evaluation of solar radiation data sets using ground measurements in China. Energy 2021, 241, 122938. [Google Scholar] [CrossRef]
  42. Zhang, K.; Qian, Z.; Yang, Y.; Chen, M.; Zhong, T.; Zhu, R.; Yan, J. Using street view images to identify road noise barriers with ensemble classification model and geospatial analysis. Sustain. Cities Soc. 2022, 78, 103598. [Google Scholar] [CrossRef]
  43. Hargreaves, G.H. Defining and using reference evapotranspiration. J. Irrig. Drain. Eng. 1994, 120, 1132–1139. [Google Scholar] [CrossRef]
  44. Eklundh, L.; Jönsson, P. TIMESAT for processing time-series data from satellite sensors for land surface monitoring. In Multitemporal Remote Sensing; Springer: Berlin/Heidelberg, Germany, 2016; pp. 177–194. [Google Scholar]
  45. Yue, S.; Wang, C.Y. Applicability of prewhitening to eliminate the influence of serial correlation on the Mann-Kendall test. Water Resour. Res. 2002, 38, 4-1–4-7. [Google Scholar] [CrossRef]
  46. Yue, S.; Pilon, P.; Cavadias, G. Power of the Mann–Kendall and Spearman’s rho tests for detecting monotonic trends in hydrological series. J. Hydrol. 2002, 259, 254–271. [Google Scholar] [CrossRef]
  47. Hans, W. Borchers Pracma: Practical Numerical Math Functions. R Package Version 2.3.6. 2021. Available online: https://CRAN.R-project.org/package=pracma (accessed on 15 April 2020).
  48. R Core Team. R: A Language and Environment for Statistical Computing; R Foundation for Statistical Computing: Vienna, Austria, 2020; Available online: https://www.R-project.org/ (accessed on 15 April 2020).
  49. Seongho, K. Ppcor: Partial and Semi-Partial (Part) Correlation. R package version 1.1. 2015. Available online: https://CRAN.R-project.org/package=ppcor (accessed on 15 April 2020).
  50. Mac Nally, R. Regression and model building in conservation biology, biogeography and ecology: The distinction between and reconciliation of ‘predictive’ and ‘explanatory’ models. Biodivers. Conserv. 2000, 9, 655–671. [Google Scholar] [CrossRef]
  51. Both, S.; Riutta, T.; Paine, C.T.; Elias, D.M.; Cruz, R.S.; Jain, A.; Burslem, D.F. Logging and soil nutrients independently explain plant trait expression in tropical forests. New Phytol. 2019, 221, 1853–1865. [Google Scholar] [CrossRef] [PubMed]
  52. Mac Nally, R.; Walsh, C.J. Hierarchical partitioning public-domain software. Biodivers. Conserv. 2004, 13, 659–660. [Google Scholar] [CrossRef]
  53. Chevan, A.; Sutherland, M. Hierarchical partitioning. Am. Stat. 1991, 45, 90–96. [Google Scholar]
  54. Piao, S.; Fang, J.; Liu, H.; Zhu, B. NDVI-indicated decline in desertification in China in the past two decades. Geophys. Res. Lett. 2005, 32, 347–354. [Google Scholar] [CrossRef]
  55. Zhao, X.; Tan, K.; Zhao, S.; Fang, J. Changing climate affects vegetation growth in the arid region of the northwestern China. J. Arid Environ. 2011, 75, 946–952. [Google Scholar] [CrossRef]
  56. Wang, S.; Liu, Q.; Huang, C. Vegetation change and its response to climate extremes in the Arid Region of Northwest China. Remote Sens. 2021, 13, 1230. [Google Scholar] [CrossRef]
  57. Lucht, W.; Prentice, I.C.; Myneni, R.B.; Sitch, S.; Friedlingstein, P.; Cramer, W.; Smith, B. Climatic control of the high-latitude vegetation greening trend and Pinatubo effect. Science 2002, 296, 1687–1689. [Google Scholar] [CrossRef] [Green Version]
  58. Xu, L.; Myneni, R.B.; Chapin Iii, F.S.; Callaghan, T.V.; Pinzon, J.E.; Tucker, C.J. Temperature and vegetation seasonality diminishment over northern lands. Nat. Clim. Chang. 2013, 3, 581–586. [Google Scholar] [CrossRef] [Green Version]
  59. Zhu, Z.; Piao, S.; Myneni, R.B.; Huang, M.; Zeng, Z.; Canadell, J.G.; Zeng, N. Greening of the Earth and its drivers. Nat. Clim. Chang. 2016, 6, 791–795. [Google Scholar] [CrossRef]
  60. Vicente-Serrano, S.M.; Gouveia, C.; Camarero, J.J.; Beguería, S.; Trigo, R.; López-Moreno, J.I.; Azorín-Molina, C.; Pasho, E.; Lorenzo-Lacruz, J.; Revuelto, J. Response of vegetation to drought time-scales across global land biomes. Proc. Natl. Acad. Sci. USA 2013, 110, 52–57. [Google Scholar] [CrossRef] [PubMed] [Green Version]
  61. Zhang, Q.; Kong, D.; Singh, V.P.; Shi, P. Response of vegetation to different time-scales drought across China: Spatiotemporal patterns, causes and implications. Glob. Planet Chang. 2017, 152, 1–11. [Google Scholar] [CrossRef] [Green Version]
  62. He, B.; Chen, A.; Wang, H.; Wang, Q. Dynamic response of satellite-derived vegetation growth to climate change in the Three North Shelter Forest Region in China. Remote Sens. 2015, 7, 9998–10016. [Google Scholar] [CrossRef] [Green Version]
  63. Zhu, S.H.; Yan, Y.; Shao, H.; Li, C.F. The Responses of the Net Primary Productivity of the Dryland Ecosystems in Central Asia to the CO_2 and Climate Changes during the Past 35 Years. J. Nat. Resour. 2017, 11, 1844–1856. (In Chinese) [Google Scholar]
  64. Kong, D.; Zhang, Q.; Singh, V.P.; Shi, P. Seasonal vegetation response to climate change in the Northern Hemisphere (1982–2013). Glob. Planet Chang. 2017, 148, 1–8. [Google Scholar] [CrossRef] [Green Version]
  65. Gang, C.; Zhou, W.; Wang, Z.; Chen, Y.; Li, J.; Chen, J.; Groisman, P.Y. Comparative assessment of grassland NPP dynamics in response to climate change in China, North America, Europe and Australia from 1981 to 2010. J. Agron. Crop Sci. 2015, 201, 57–68. [Google Scholar] [CrossRef]
  66. Eisfelder, C.; Klein, I.; Niklaus, M.; Kuenzer, C. Net primary productivity in Kazakhstan, its spatio-temporal patterns and relation to meteorological variables. J. Arid Environ. 2014, 103, 17–30. [Google Scholar] [CrossRef] [Green Version]
  67. Li, M.; Sun, H.Q.; Su, Z.C. Research progress in dry/wet climate variation in Northwest China. Geogr. Res. 2021, 4, 1180–1194. (In Chinese) [Google Scholar]
  68. Fernandez-Gimenez, M.; Allen-Diaz, B. Vegetation change along gradients from water sources in three grazed Mongolian ecosystems. Plant. Ecol. 2001, 157, 101–118. [Google Scholar] [CrossRef]
  69. Richardson, A.D.; Andy Black, T.; Ciais, P.; Delbart, N.; Friedl, M.A.; Gobron, N.; Hollinger, D.Y.; Kutsch, W.L.; Longdoz, B.; Luyssaert, S. Influence of spring and autumn phenological transitions on forest ecosystem productivity. Philos. Trans. R. Soc. B Biol. Sci. 2010, 365, 3227–3246. [Google Scholar] [CrossRef] [PubMed] [Green Version]
  70. Gutiérrez-Girón, A.; Díaz-Pinés, E.; Rubio, A.; Gavilán, R.G. Both altitude and vegetation affect temperature sensitivity of soil organic matter decomposition in Mediterranean high mountain soils. Geoderma 2015, 237, 1–8. [Google Scholar] [CrossRef]
  71. Zhou, L.; Kaufmann, R.K.; Tian, L.Y.; Myneni, R.B.; Tucker, C.J. Relation between interannual variations in satellite measures of northern forest greenness and climate between 1982 and 1999. J Geophys. Res.-Atmos. 2003, 108, ACL-3. [Google Scholar] [CrossRef] [Green Version]
  72. Wang, X.; Piao, S.; Ciais, P.; Li, J.; Friedlingstein, P.; Koven, C.; Chen, A. Spring temperature change and its implication in the change of vegetation growth in North America from 1982 to 2006. Proc. Natl. Acad. Sci. USA 2011, 108, 1240–1245. [Google Scholar] [CrossRef] [Green Version]
  73. Propastin, P.A.; Kappas, M.; Muratova, N.R. Inter-annual changes in vegetation activities and their relationship to temperature and precipitation in Central Asia from 1982 to 2003. J. Environ. Inform. 2008, 12, 75–87. [Google Scholar] [CrossRef] [Green Version]
  74. Zhang, K.; Kimball, J.S.; Nemani, R.R.; Running, S.W.; Hong, Y.; Gourley, J.J.; Yu, Z. Vegetation greening and climate change promote multidecadal rises of global land evapotranspiration. Sci Rep. 2015, 5, 15956. [Google Scholar] [CrossRef]
  75. Zhu, Y.; Chen, Y.; Ren, L.; Lü, H.; Zhao, W.; Yuan, F.; Xu, M. Ecosystem restoration and conservation in the arid inland river basins of Northwest China: Problems and strategies. Ecol. Eng. 2016, 94, 629–637. [Google Scholar] [CrossRef]
  76. Liu, Q.; Zhang, Q.; Yan, Y.; Zhang, X.; Niu, J.; Svenning, J.-C. Ecological restoration is the dominant driver of the recent reversal of desertification in the Mu Us Desert (China). J. Clean. Prod. 2020, 268, 122241. [Google Scholar] [CrossRef]
  77. Bao, A.; Huang, Y.; Ma, Y.; Guo, H.; Wang, Y. Assessing the effect of EWDP on vegetation restoration by remote sensing in the lower reaches of Tarim River. Ecol. Indic. 2017, 74, 261–275. [Google Scholar] [CrossRef]
Figure 1. Topographic distribution (a), vegetation type distribution (b), monthly mean temperature (c), precipitation (d), solar radiation (e), and Normalized Difference Vegetation Index (NDVI) (f) for natural vegetation in the arid region of northwestern China (Naturalv—Natural vegetation; Forestl—forested land; Shrubl—shrub land; Sparsel—sparse forest land; Hgra—High−coverage grassland; Mgra—Medium−coverage grassland; Lgra—Low−coverage grassland).
Forests 13 01082 g001
Figure 2. Spatial changes in the start of the growing season (SOS; (a)), end of the growing season (EOS; (c)), and growing season length (GSL; (e)), and temporal changes in SOS (b), EOS (d), and GSL (f) in the arid region of northwestern China (PCT is the abbreviation of percent; SD, significantly decreasing trend; ISD, non-significant decreasing trend; ISI, non-significant increasing trend; SI, significantly increasing trend).
Forests 13 01082 g002
Figure 3. The means (a,c,e,g) and trends (b,d,f,h) in climate variables and Normalized Difference Vegetation Index (NDVI) during the growing season in the arid region of northwestern China (PCT is the abbreviation of percent; SD, significantly decreasing trend; ISD, non-significant decreasing trend; ISI, non-significant increasing trend; SI, significantly increasing trend). The visualized colors in the left-hand graphs refer to the mean climate and NDVI values, while those in the right-hand graphs refer to the trends in climate and NDVI.
Forests 13 01082 g003
Figure 4. Changes in Normalized Difference Vegetation Index (NDVI) with changes in precipitation, temperature, and solar radiation for forest ((ac), respectively) and grassland ((df), respectively) in the arid region of northwestern China.
Forests 13 01082 g004
Figure 5. Spatial distribution of correlation coefficients between detrend Normalized Difference Vegetation Index (NDVI) and detrend climate variables at pixels in the arid region of northwestern China ((a,d,g): correlations between NDVI and temperature, precipitation, and solar radiation during the growing season (GS), respectively; (b,e,h): correlations between GS NDVI and temperature, precipitation, and solar radiation of the previous NGS, respectively; (c,f,i): Partial correlation between NDVI and temperature, precipitation, and solar radiation during the GS, respectively).
Forests 13 01082 g005
Figure 6. Box plots of grid correlation coefficients between detrend Normalized Difference Vegetation Index (NDVI) and detrend climate variables in the arid region of northwestern China (GS: growing season; NGS: non-growing season; PGS: Partial correlation in growing season).
Forests 13 01082 g006
Figure 7. Mean (a,c), trends (b,d), and detrended correlations (e,f) between the Normalized Difference Vegetation Index (NDVI) and aridity index (AI) in the arid region of northwestern China (SD, significantly decreasing trend; ISD, non-significant decreasing trend; ISI, non-significant increasing trend; SI, significantly increasing trend; SNC, significantly negative correlation; ISNC, non-significant negative correlation; ISPC, non-significant positive correlation; SPC, significantly positive correlation; GS, growing season; NGS, non-growing season).
Forests 13 01082 g007
Figure 8. Changes to the Normalized Difference Vegetation Index (NDVI) with changes in the aridity index (AI) in the arid region of northwestern China.
Forests 13 01082 g008
Figure 9. Variance partitions of the climate variables derived through the Hierarchical Partitioning Algorithm (HPA) ((a): contribution rate for regional changes in the Normalized Difference Vegetation Index (NDVI) during the growing season; (b): contribution rate for spatial distribution of mean NDVI during the growing season).
Forests 13 01082 g009
Table 1. Mean and trends (Sen slope β) in phenological parameters of natural vegetation in the arid region of northwestern China (significant trends at the 0.05 significance level are shown in bold).
NaturalvForestForest1ShrublSparselGrassHgraMgraLgra
Mean
DOY
SOS104105108113108104110106102
EOS260259256257256260255257262
LGS155154148144148156145151160
Trend
(d/33a)
SOS−7.09−6.70−9.58−6.55−3.06−3.15−7.92−5.77−2.13
EOS1.833.767.624.784.722.124.401.40−1.43
LGS8.2910.8016.2211.757.264.7910.694.76−0.50
Table 2. Regional changes (Sen slope β) and correlations between the Normalized Difference Vegetation Index (NDVI) and climate variables in the arid region of northwestern China (SR: solar radiation; Pre: precipitation; Tem: temperature; significant trends and correlation coefficients at a 0.05 significance level were indicated in bold).
Trend (Sen Slope β)/unit/aCorrelation CoefficientsPartial Correlation Coefficient
NDVISRPreTemSRPreTemSRPreTem
Naturalv0.0005−0.13960.20210.0428−0.14 0.510.19 0.25 0.630.42
Forest0.0005−0.14200.48430.0401−0.04 0.330.360.17 0.520.52
Forestl0.0005−0.21510.21610.0429−0.08 0.330.440.15 0.550.63
Shrubl0.0003−0.04980.64550.0415−0.02 0.28 0.00 0.18 0.340.05
Sparsel0.0006−0.02980.40190.04270.02 0.32 0.27 0.18 0.490.40
Grass0.0005−0.14610.18370.0437−0.14 0.530.16 0.25 0.630.40
Hgra0.0005−0.22930.05460.0428−0.25 0.460.360.04 0.580.62
Mgra0.0006−0.15720.32720.0420−0.21 0.620.02 0.24 0.680.31
Lgra0.0004−0.10270.09370.04380.00 0.43−0.03 0.33 0.530.09
Table 3. Correlation coefficients and partial correlation coefficients between the mean NDVI and the mean climate in the arid region of northwestern China (SR: solar radiation; Pre: precipitation; Tem: temperature; significant correlation coefficients at the 0.05 significance level are indicated in bold).
Correlation CoefficientsPartial Correlation Coefficients
TemPreSRTemPreSR
Naturalv−0.300.67−0.540.040.49−0.32
Forest−0.630.60−0.50−0.320.06−0.24
Forestl−0.340.33−0.25−0.170.10−0.11
Shrubl−0.720.78−0.62−0.060.27−0.17
Sparsel−0.680.66−0.49−0.280.11−0.19
Grass−0.260.66−0.520.050.51−0.32
Hgra0.070.47−0.400.340.48−0.23
Mgra−0.030.57−0.480.180.49−0.26
Lgra−0.070.61−0.410.180.57−0.25
Publisher’s Note: MDPI stays neutral with regard to jurisdictional claims in published maps and institutional affiliations.

