Abstract
Natural secondary forests not only contribute to the total balance of terrestrial carbon, but they also play a major role in the future mitigation of climate change. In China, secondary forests have low productivity and carbon sequestration, which seriously restricts the sustainable development of the forest. Thinning is a core measure of scientific management of forest ecosystems and is a primary natural forest management technique. The carbon density of the tree layer is most affected by thinning. Taking larch–birch mixed natural secondary forests in the Greater Khingan Range, Northeast China, as the research object, we analyzed the changes in tree layer carbon density of secondary forests under different thinning intensities. The results showed that in five thinned groups, when intensity was 49.6%, the diameter at breast height (DBH) and individual tree biomass significantly increased. Thinning had no significant effect on the carbon content of the tree stem, branches and bark, but had significant effects on the carbon content of leaves. Our result showed that the carbon content of birch leaves increased and that of larch decreased. As the thinning intensity increases, the proportion of broad-leaved tree species (birch) increased, yet larch decreased. In the short term, thinning will reduce the total biomass and carbon density of tree layers. However, when the thinning intensity was 49.6%, the carbon accumulation was higher than that of the blank control group (CK group) after thinning for 12 years. This shows that after a long period of time, the carbon density of tree layers will exceed that of the CK group. Reasonable thinning intensity management (49.6% thinning intensity) of natural secondary forests can make trees grow better, and the proportion of broad-leaved trees increases significantly. It can also increase the carbon sequestration rate and lead to more accumulation of biomass and carbon density. This can not only promote the growth of secondary forests, but also shows great potential for creating carbon sinks and coping with climate change.
1. Introduction
Increased CO2 levels result in global warming and frequent heavy natural disasters, which have a series of positive feedback effects [1,2,3]. Forest carbon stock accounts for about 45%–54% of the total carbon in terrestrial ecosystems [4]. As the largest carbon reservoir in terrestrial ecosystems, forests have great potential to remove excess carbon dioxide from the atmosphere. Forests mitigate the effects of climate change through carbon sequestration [5]. The annual sequestrated carbon in global forests could offset about half of the global CO2 emissions from fossil fuel combustion [6,7]. Carbon sequestration processes and activities, including forest management, are growing areas of forestry research [8]. Article 3.4 of the Kyoto Protocol allows the use of forest management for carbon sequestration and the development of National Forest Inventories [9].
Thinning is a core measure of scientific management of forest ecosystems and is a primary natural forest management technique. It is the main way to optimize forest structure and improve forest productivity and quality [10]. It regulates the distribution of growing space so that standing trees may benefit in terms of competition, growth and health status [11]. At the same time, thinning management will provide a complementary alternative for wood production, hopefully contributing to a decrease in the logging pressure and the resulting degradation and deforestation [12]. Furthermore, thinning can be the cleaning of dead or diseased trees, decreasing the original stand density and greatly improving the growth of the retained trees [13]. Thinning is usually applied to dense immature forest stands. The management objective is to redistribute aboveground growth from many small trees to a few large trees to produce more valuable trees more quickly than in an un-thinned forest. Several studies reported a change in carbon dynamics after thinning. The benefits of managing teak plantations using thinning management have been demonstrated by the study to include a higher survival rate (more stems per ha), larger stems and taller trees, these all translating into higher biomass and carbon stocks [14]. Radial expansion of tree trunks is one of the main processes of semipermanent removal of carbon dioxide from the atmosphere [15]. Yan-Feng Bai’s research revealed that selective thinning management plays an important role in improving the carbon storage of degraded C. lanceolata plantations [16]. Andrés Bravo-Oviedo’s study has analyzed experimental data to disentangle the way in which forest thinning in a Scots pine stand in the Mediterranean basin may affect aboveground biomass (AGB), C and results revealed that biomass and C stock in AGB significantly changed with thinning intensity [17].
Natural secondary forests not only contribute to the total balance of terrestrial carbon, but also play a major role in the future mitigation of climate change [18]. A study analysis found that the new research frontiers are related to carbon sinks, mainly concentrated on changes in the carbon storage and carbon sequestration potential of secondary forests [8]. Moreover, secondary forests have higher rates of success than expensive and poorly adapted afforestation and reforestation initiatives. In China, natural secondary forests account for 46.2% of total forest areas and 23.3% of total forest stock and most of the forest areas are distributed, but there are some differences in the main tree species. Secondary forests have been reported to sequester carbon at higher rates through faster growth [19]. However, a study gives the opposite view that secondary forests have low productivity, low carbon sequestration rate and low soil fertility, which seriously restrict and affect the sustainable development of the forest [20]. This means that completely transforming the stand structure through natural renewal would be a long process. Artificial intervention in the secondary forest may help to reach a stable state more quickly [11].
Some studies of the allometric growth equation of biomass greatly expanded our knowledge in understanding carbon stock and its dynamic forests in China [21]. In the future, China’s natural secondary forests are projected to have high carbon uptake potential. While such potential assumes continuous human management, the effects of human management on carbon uptake and accumulation potential are less clear [21]. Aboveground carbon and the changes induced by harvest and tending operations are also considered good indicators of the sustainability of forest practices when the mitigation of global change is considered [22]. Researchers believe that those operations should be investigated for the potential enhancement of carbon uptake from optimized forest management, which is particularly important for China’s subtropical forests identified as essential carbon sinks [23]. Synthesis studies based on meta-analyses have shown that carbon stored in the forest floor is more vulnerable to harvesting methods, both thinning and clear-cut, than mineral soil [24]. Jason N. James et al. found that thinning treatments had larger impacts on aboveground pools [25]. The higher biomass in the secondary natural forests than in the Chinese fir plantation [26]. Thus, secondary forests should be highly valued. Few large trees, rather than plant diversity and composition, drive the aboveground biomass stock and dynamics of temperate forests in Northeast China [27]. Thus, our study analyzed tree layer aboveground biomass and corresponding carbon stocks.
In this study, we focus on the larch-birch mixed natural secondary forests in the Greater Khingan Range of Heilongjiang Province, Northeast China. We evaluated thinning strategy with regard to carbon storage in biomass. Our objectives were to: (1) evaluate the effect of thinning on AGB of individual trees and stands in secondary forests and (2) assess the effect of thinning management on tree layer carbon density (carbon density refers to the carbon storage per unit area of forest, which is calculated by dividing forest carbon storage by forest area) and provide the scientific basis of forest thinning management for the purpose of increasing forest carbon sequestration.
2. Materials and Methods
2.1. Overview of Study Area
The study area is in Xinlin forest farm of Greater Khingan Range (the largest natural forest region in China) in Northeast China (Figure 1), which is on the northeast slope of the Yilehuli Mountain in the Greater Khingan Range. The geographical coordinates are 51°20′–52°10′, 123°41′–125°25′. The average altitude is about 600 m, the terrain is gentle and the slope is less than 6°. The annual average temperature is −2.6 °C and the annual average accumulated temperature is less than 1600 °C. This area is located in the cold temperate continental climate. The annual precipitation is 513.9 mm and the distribution is uneven. The main precipitation is from July to August and the annual precipitation is about 130 days. The freezing period of the whole year is about 7 months, the freezing period is generally in late September, the final freezing period is in mid-late April, the first frost begins in late August and the frost-free period is about 90 days. The annual sunshine duration is 2357 h and the sunshine percentage is 51%–56%. The overall wind speed is small, with an average annual wind speed of 2.5 m/s, mainly in May.
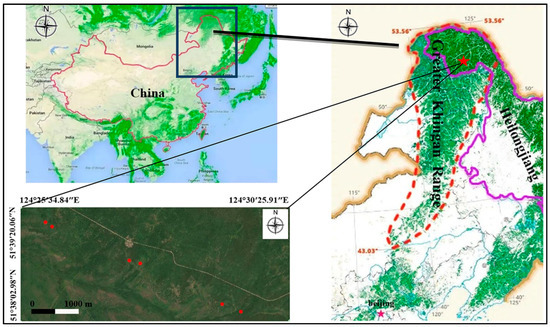
Figure 1.
Geographic location of the study area in different thinning intensities in the Greater Khingan Range. (Note: The red dot in the figure is thinning sample plot).
The vegetation in this study area is a typical natural secondary forest in the Greater Khingan Range. The peak growing season is from June to August. The dominant species is larch (Larix gmelinii (Ruprecht) Kuzeneva), which is a fast-growing deciduous conifer tree species which covers 70% of the forested area and has a similar carbon gain capacity to evergreen species. Birch (Betula platyphylla Suk.) usually coexists with larch and is also a widely distributed deciduous species with a high colonization ability [28]. Meanwhile, there are a few Pinus sylvestris L. var. mongholica Litv., Picea asperata Mast. and Populus davidiana Dode. Lespedeza bicolor Turcz. and Rhododendron dauricum L. were the main understory vegetation. The main ground covers were Vaccinium Vitis-idaea and Deyeuxia Langsdorffii (Link) Kunth.
2.2. Selection of Thinning Sample Site
The study sites are located in 106, 107, 108 and 109 forest classes on Xinlin forest farm. In March 2007, six study areas with different thinning intensities were established in the study area. We established 6 groups, thinning intensity is 0(CK), 16.7%, 25.5%, 34.4%, 49.6% and 59.9%, respectively. All groups had identical forest environment parameters such as gradient, slope aspect and stand type. At that time, the intensity of tending and thinning was designed according to the ratio of cutting volume to total volume. According to the requirements of timber forest management, thinning is used to cut down the trees with high density, no growth prospects and non-target trees. We can optimize forest management by adjusting the stand density, spatial structure and other indicators. The selected test plots can be found in Figure 1.
2.3. Field Measurement and Sampling
In August 2019, we selected three experimental plots which were 20 m × 20 m in each study groups. We recorded the major information of the species and the numbers of trees. The basic survey of six thinning groups is shown in Table 1. Additionally, the information was classified by tree species in order to make biomass estimates. In each group, the trees with a diameter at breast height (DBH) > 5 cm were measured. The tree density was calculated by dividing the total tree numbers by the area. According to the distribution and quantity of each diameter step of trees, 10 standard trees were selected from each species in each plot. In total, 50 g (fresh mass) was taken from different tree parts, such as stem, branches, leaves and bark. The samples were taken back to the laboratory for carbon content analysis. Finally, we carried out an analysis of the carbon density of each organ and its allocation characteristics. Only undamaged trees with no deformities were included in the study.

Table 1.
The basic survey of six thinning groups.
2.4. Carbon Content Based on Chemical Analysis
Samples were dried to constant weight in 85 °C constant temperature drying oven (the difference between the two weights was less than 0.2 mg), then crushed and sieved (0.25 mm mesh screen). The carbon content was determined and calculated by the potassium dichromate wet burning sulfuric acid oxidation method (LY/T1237-1999). During the experiment, the oil bath temperature was controlled at 170–180 °C and the accurate time was 5 min. Three replicates were determined for each sample and the relative deviation of the three replicates was controlled within 2%. If the average relative error exceeds ±2%, repeat once more and take the average of the three determination results with the smallest difference as the carbon content of the sample.
2.5. Aboveground Tree Biomass and Carbon Density
Tree data of DBH were converted into biomass using allometric biomass equations. Mu et al. [29] developed anisotropic equations for each aboveground part of the tree (including: stem, bark, branches, leaves). It was used to estimate the biomass of all individual trees within each group, as well as tree AGB at the stand scale, based on assessed tree density. The allometric formula is as follows:
where W is the individual tree AGB (kg); a and b are allometric biomass equation coefficients; D is DBH (cm); R2 is the regression coefficients; and SE stands for a standard error. The values of a, b, R2 and SE are shown in Table 2.
Table 2.
Related parameters of allometric growth equation of tree species biomass.
Carbon density is calculated by multiplying the biomass of the various organs of the tree species in the sample plot by the carbon content of the corresponding organs, adding them and divided by the sample plot area. The carbon density here only represents the aboveground carbon density of the tree layer, excluding the carbon of the root.
where AGC is the aboveground carbon density of the tree layer in the sample plot (kg/m2); AGB is the aboveground biomass of the tree layer in the sample plot (kg); and S is the sample plot area (m2).
2.6. Statistical Analysis
We used analysis of variance (ANOVA) and Duncan methods if there were significant differences in DBH, biomass and aboveground carbon density in the tree layer between the thinned groups and the CK group. An effect was determined statistically significant if p < 0.05. All analyses were run using IBM-SPSS Statistics software (Version 26.0, IBM Corp., Armonk, NY, USA) and all graphs were prepared using OriginPro 2021 software (Version 9.8, OriginLab Corp., Northampton, Massachusetts, USA).
3. Results
3.1. Effect of Thinning on Stand Growth
Effect of Thinning on DBH of the Tree
We analyzed the average DBH of trees among all thinning intensities (Table 3). The mean DBH across species was from 11.31–15.54 cm. Different thinning groups significantly differed in DBH (p < 0.05). In the 49.6% thinned group, DBH reached its peak. As the thinning intensity increases, the DBH showed a pattern of first decreasing, then increasing and eventually decreasing after 12 years of thinning.
Table 3.
Distribution parameters of tree DBH.
From Table 3, the skewness coefficient of tree DBH distribution was only 49.9% for the thinning group, which was smaller than that in the CK plot. This indicates that, compared to the CK plot, the DBH distribution in the 49.6% thinned groups shifts to a higher diameter order. The absolute kurtosis value of the DBH distribution of trees in 49.9% of the thinning plots is the closest to zero. This indicates that thinning adjusts the structure of the stand and makes the DBH distribution of trees become the standard normal distribution.
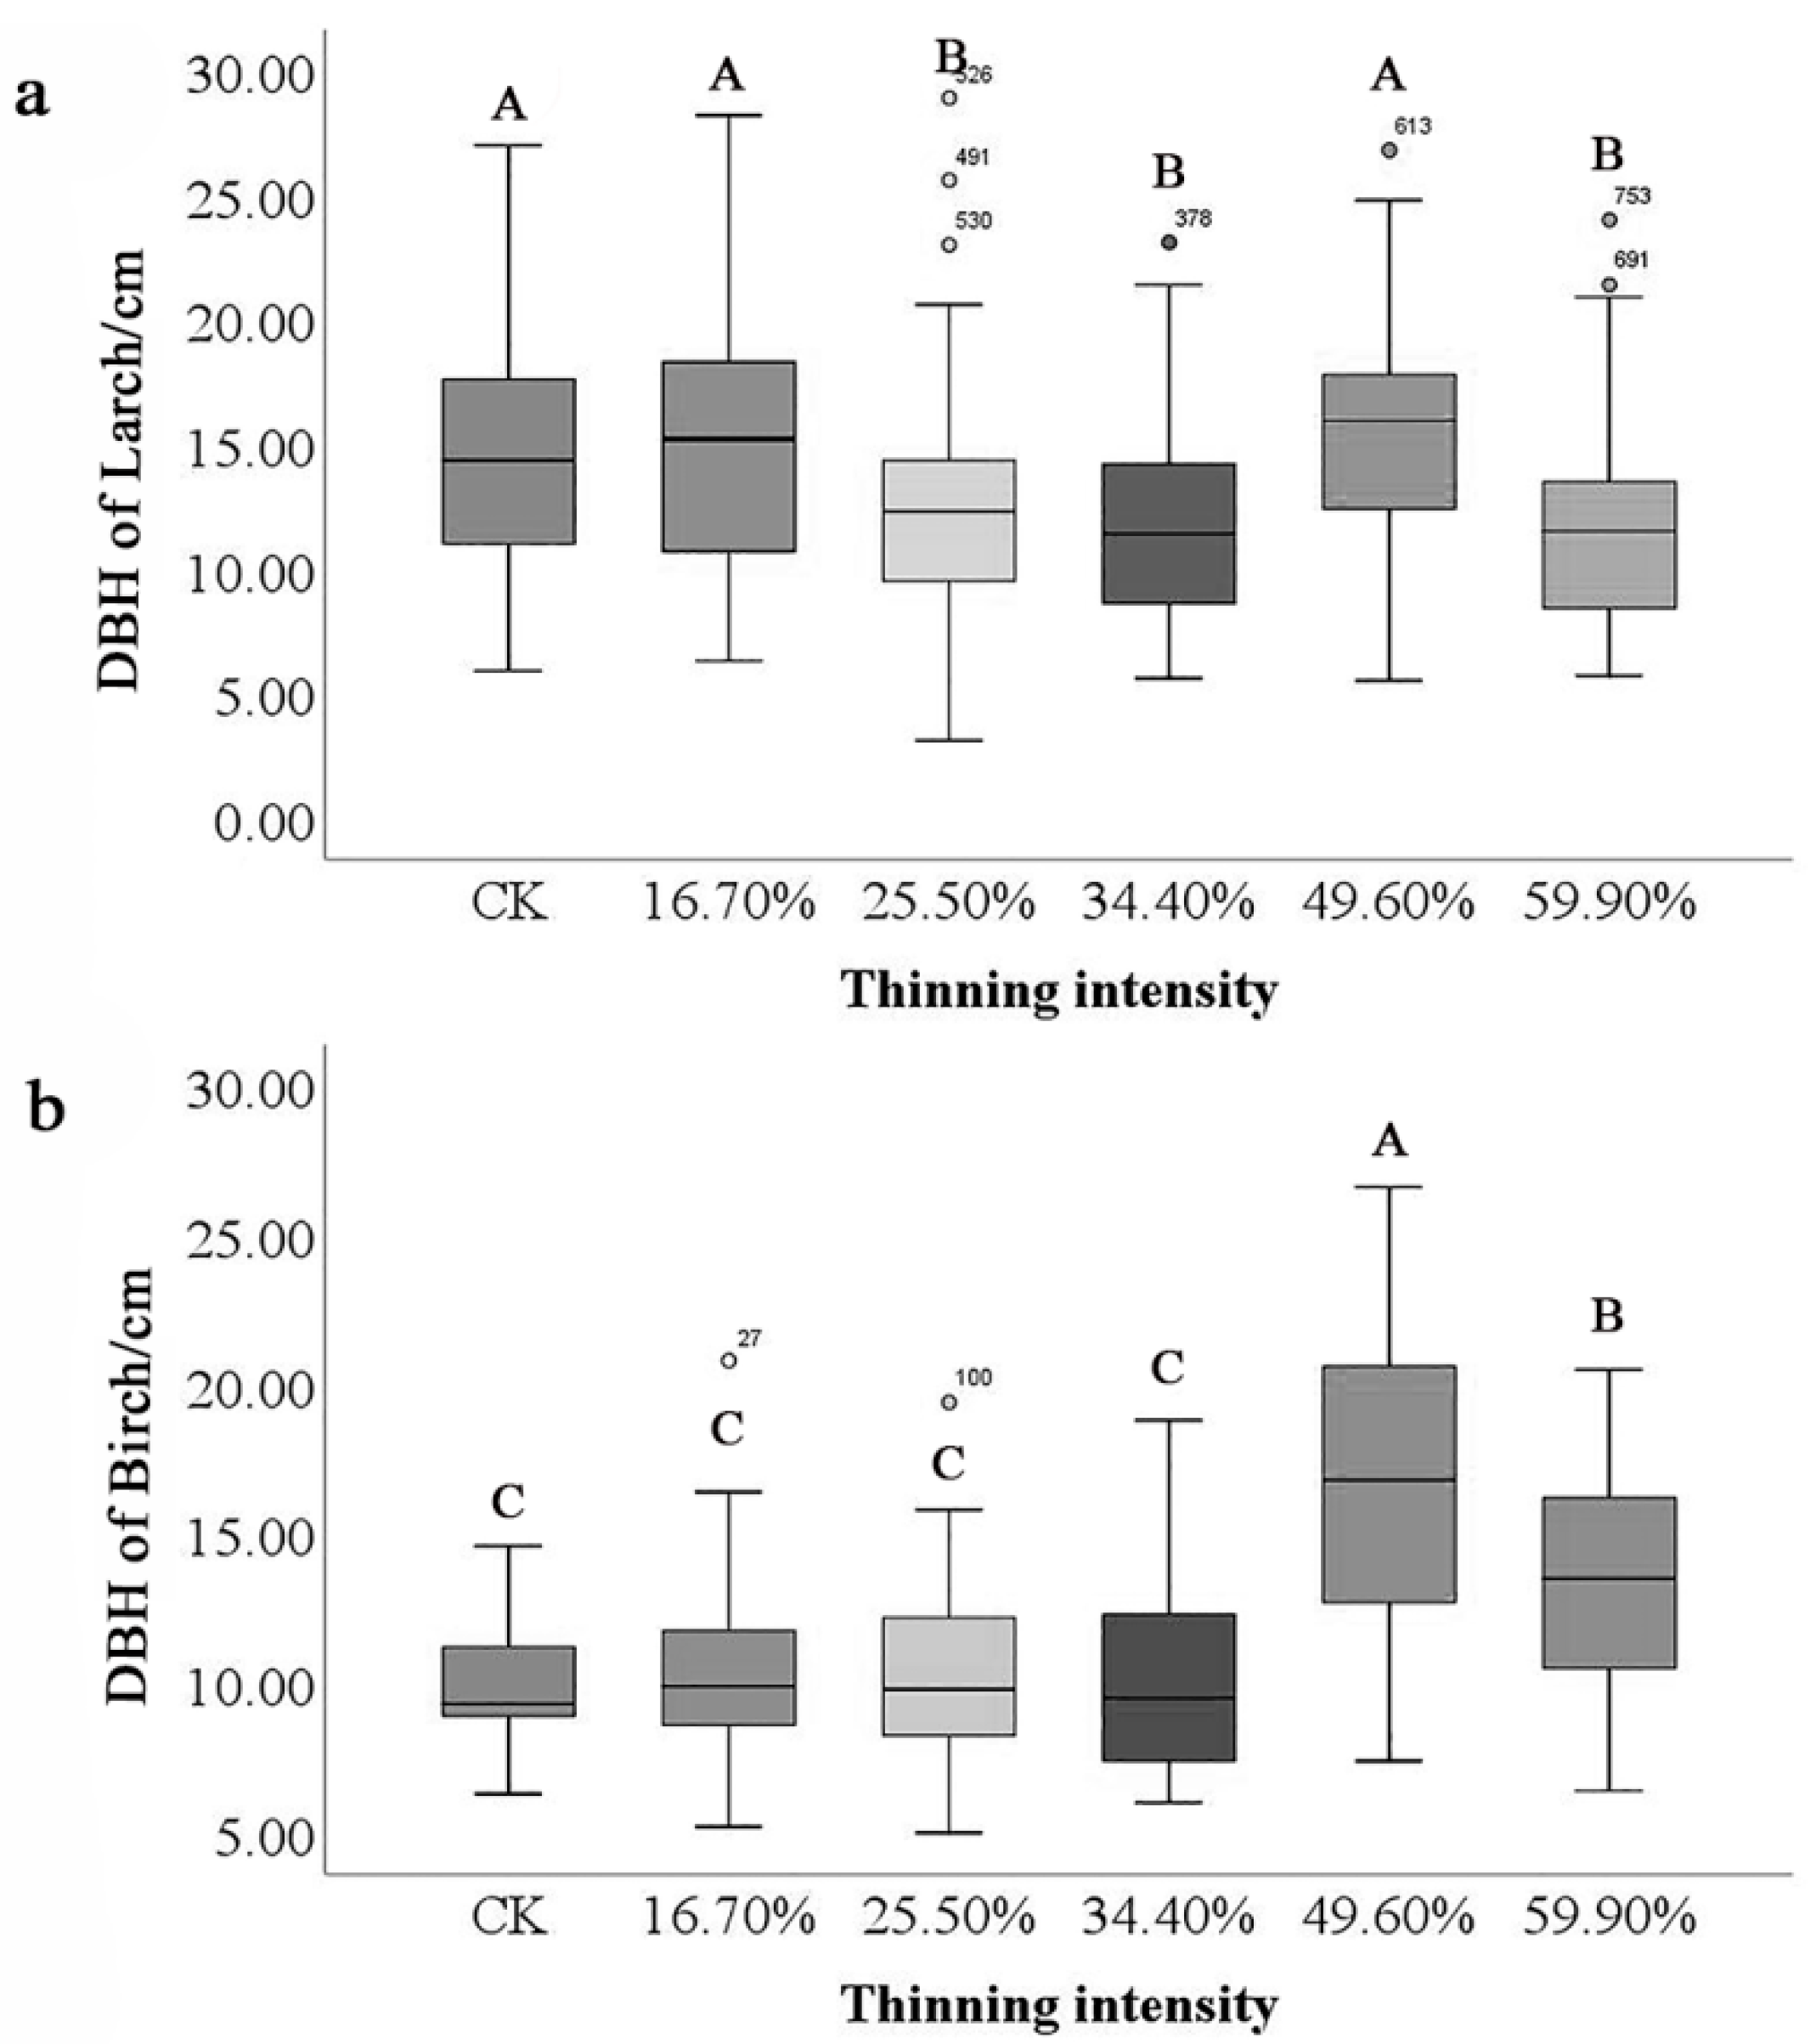
Different tree species also significantly differed in DBH. The highest and lowest DBH were found in birch (16.58 cm and 9.85 cm). In contrast, the moving range of larch is smaller than that of birch (Figure 2). Under different thinning intensities, the mean DBH of birch was greater than that of larch. The maximum difference in DBH of birch is 6.72 cm, while that of larch is 3.48 cm. However, both species reached the maximum DBH in the 49.6% thinned group and the difference between birch species was the most significant.

Figure 2.
Differences in DBH of tree species. Note: The small letter (a) stands for DBH of larch and (b) stands for DBH of birch. Different capital letters in the same figure represent significant differences in DBH among the thinning groups (p < 0.05).
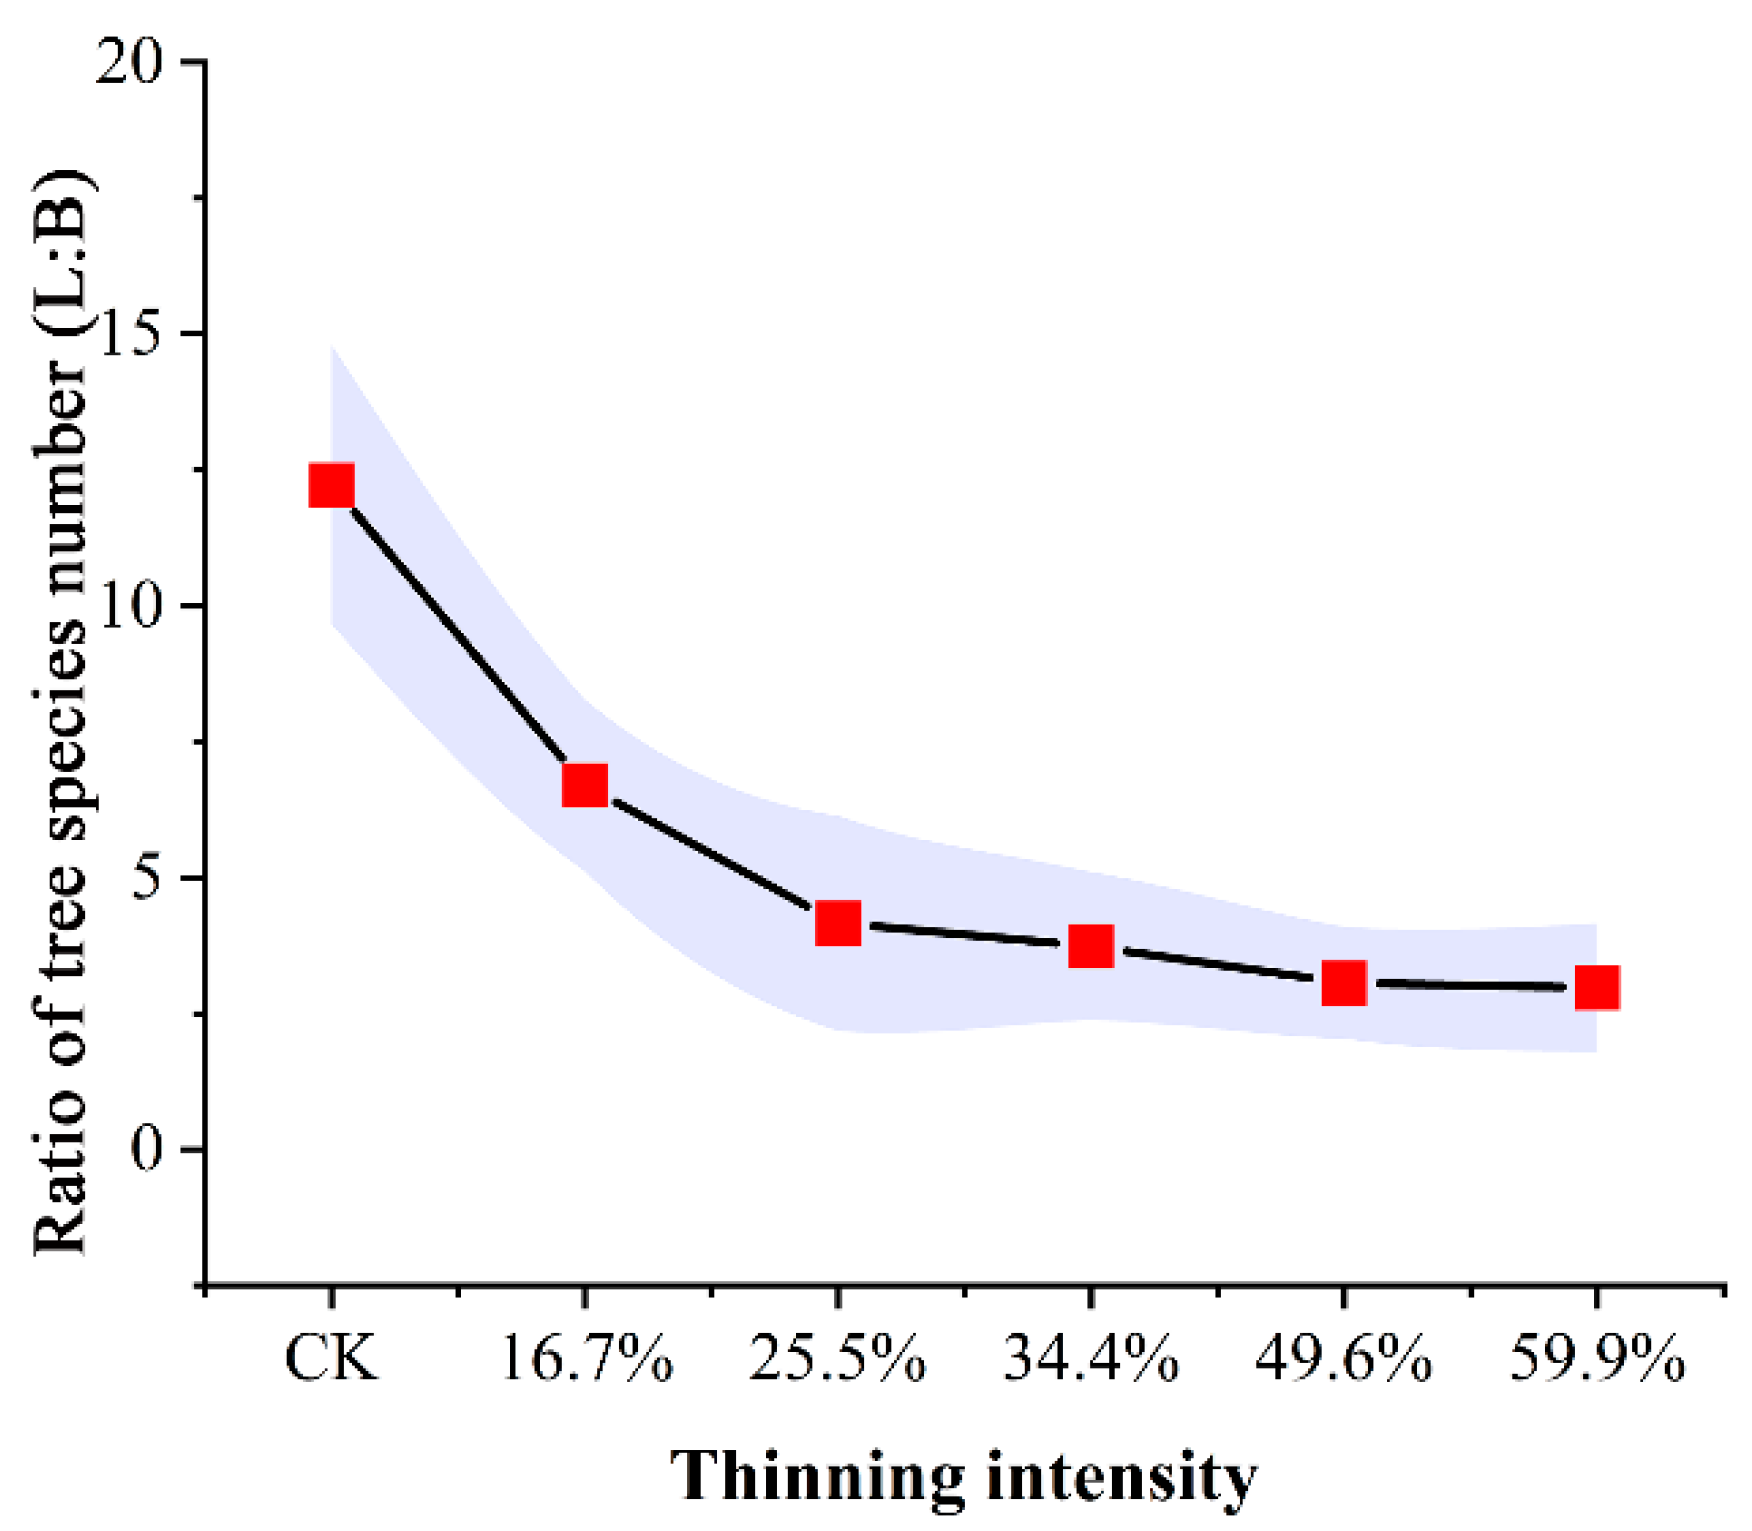
We recorded the species and number of trees in all groups. The composition proportion of tree species in the sample plot was analyzed (Figure 3).
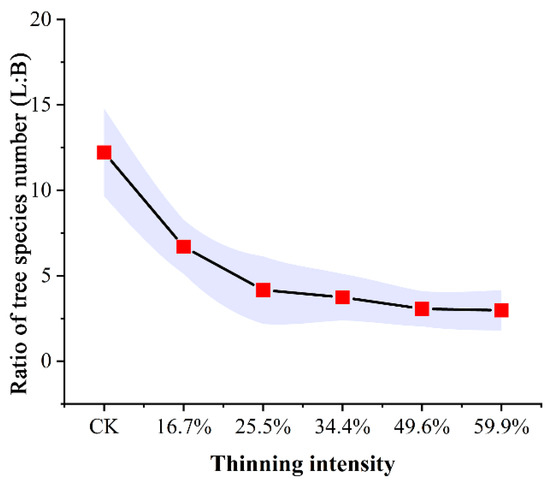
Figure 3.
Proportion of tree species number in sample plots (L: larch; B: birch).
As shown in Figure 3, the ratio of larch to birch in thinned plots was much smaller than that in CK plot. As the thinning intensity increases, the ratio of larch to birch decreased rapidly at first and then decreased slowly, finally becoming stable. Generally speaking, in all thinned groups, the proportion of larch decreased compared to the CK group. These plots were replaced by the pioneering, light-loving, fast-growing species of birch. The results showed that thinning directly caused the decline in larch population and proportion. To some extent, this indirectly reflects that thinning can increase species abundance.
3.2. Effect of Thinning on Organ Carbon Concentration of the Tree Species
Table 4 showed the mean carbon content values and standard deviation (SD) of organs for larch and white birch under different thinning intensities. The results showed that only the leaf carbon content of larch (p = 0.001 < 0.05) and white birch (p = 0.006 < 0.05) had significant differences under different thinning intensities, but there was no significant difference in the other organs. Both birch and larch showed the highest carbon content in the bark. The carbon content of birch bark is as high as 0.7 g/g. In the other organs, the carbon content was different under different thinning intensities. The carbon content of larch tree species showed stem > branch > leaf in 25.5% and 34.4% thinned groups, leaf > stem > branch in 16.7% and 49.6% thinned groups and branch > leaf > stem under the 59.9% thinned groups. For birch species, the carbon content in the CK and 16.7% and 34.4% thinned groups was leaf > branch > stem; in the 25.5% and 59.9% thinned groups, it was stem > branch > leaf; and in the 49.6% thinned groups, it was branch > leaf > stem.
Table 4.
Carbon content of organs of tree species under tending thinning intensity. Carbon content (g/g) = Mean + SD.
As can be seen from Table 4, in almost all thinning groups, the organ carbon content of birch was higher than that of the CK group. However, there were partially opposite results. The carbon content of the stem in the 16.7% thinned group was lower than that of the CK group and in the 25.5% thinned group the carbon of the bark was lower than that of the CK group. The result indicated that the thinned group can improve the carbon content of the organs of birch. In Table 4, the carbon content of larch in the CK group was lower than that of the thinned groups. Regarding the carbon content of branches and leaves, the thinning treatment group was greater than the control group; however, the increment was not obvious.
These results show that thinning can change the carbon content of various organs of tree species and whether the carbon content increases or decreases varies with tree species. Under the six groups, the difference in the leaves was the most significant. There was no significant difference among the stem, branches and leaves.
3.3. Effect of Thinning on the Biomass of Tree Layers
3.3.1. Effect of Thinning on the Biomass of Standard Individual Trees
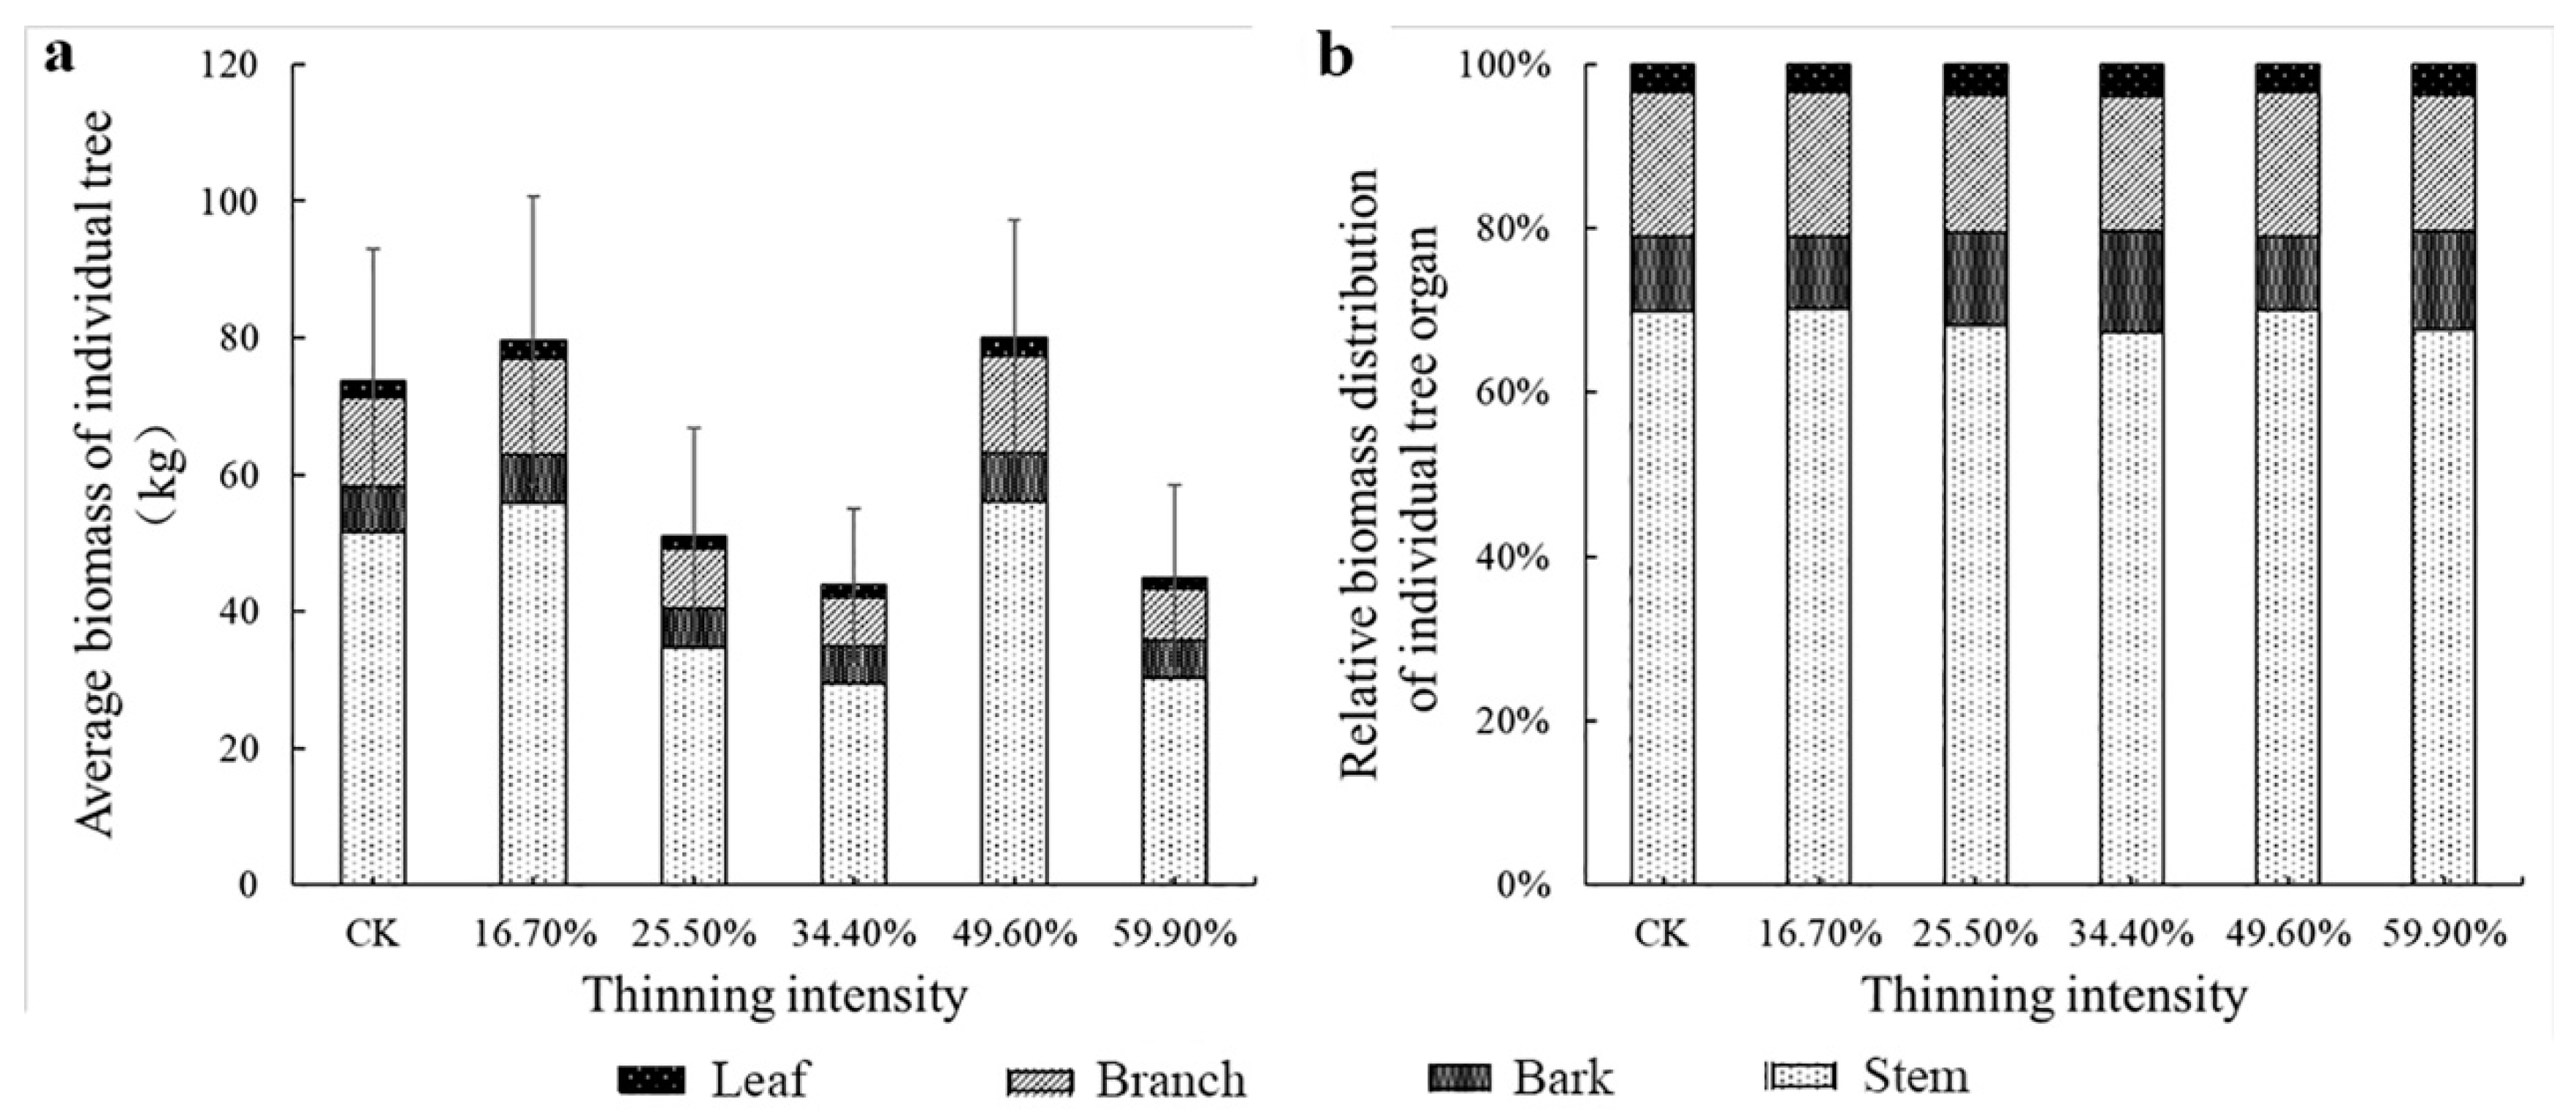
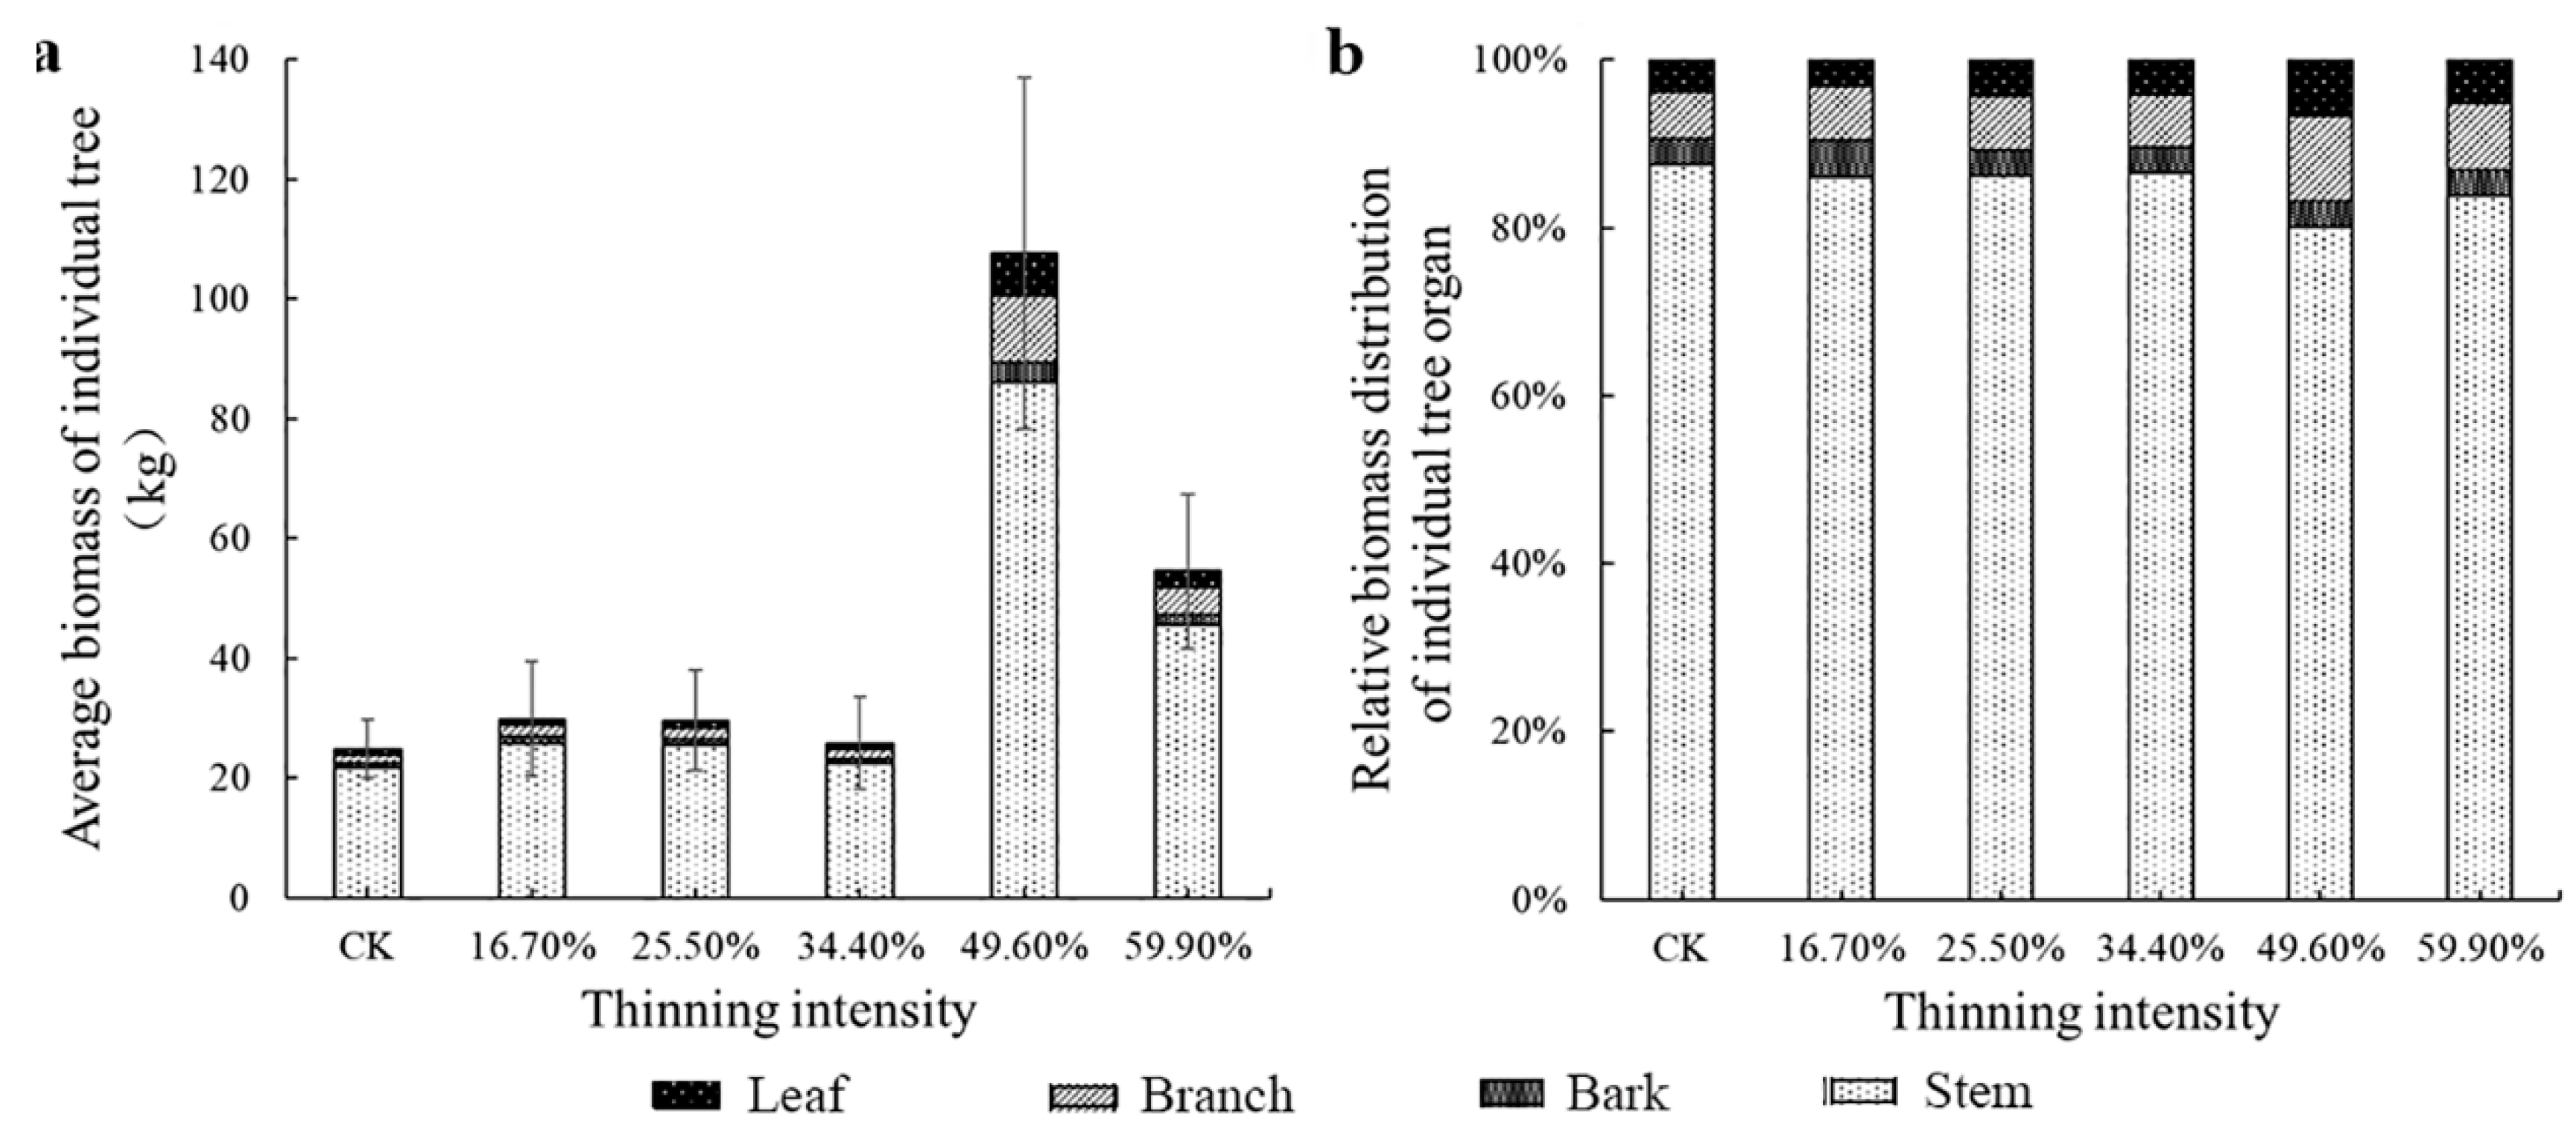
The average DBH was used to calculate the four organs and the AGB of the individual tree. Meanwhile, we visualized the biomass percentage of each organ relative to the AGB of an individual tree in different thinned groups in Figure 4 and Figure 5. First, in the two figures, we could see that the trend of AGB was rather similar between larch and birch. The tree biomass was highest in the stem, followed by the branch. The biomass of individual tree organ components differed, in the order of stem > branch > bark > leaf in larch, and stem > branch > leaf > bark in birch. When the thinning intensity was 49.6%, the AGB of individual trees of the two tree species reached the highest. In the 49.6% thinned group, larch and birch were 8.5% (6.3 kg) and 334.6% (82.9 kg) higher compared to the CK group, respectively. AGB of white birch in five thinning groups was higher than that in the CK group.
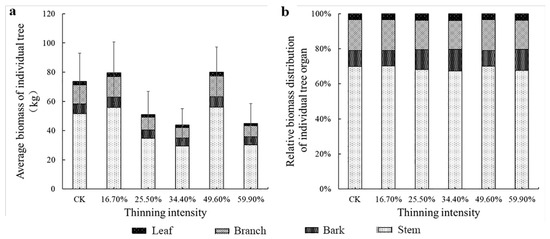
Figure 4.
The average individual tree organ biomass and its allocation of larch. Note: (a) is larch average biomass of individual tree, (b) is larch relative biomass distribution of individual tree organ.

Figure 5.
The average individual tree organ biomass and its allocation of birch. Note: (a) is birch average biomass of individual tree, (b) is birch relative biomass distribution of individual tree organ.
However, from Figure 4b and Figure 5b, the change trend of biomass allocation proportion among different organs of larch was different. The proportion of leaf and branch biomass allocated to larch did not change significantly as the intensity of thinning increased. The proportion of biomass in the stems decreased and then increased; however, the proportion of biomass in the bark followed the opposite trend to that of the stems. It shows the trend of transformation from stem biomass to bark. The largest difference in the thinned groups was bark, which was 3.5%. The differences among the stem, branches and leaves were 2.8%, 1.2% and 0.5%, respectively. However, the pattern of birch differed from that of larch. Briefly, only the biomass allocation ratio of leaves did not change significantly. The relative proportion of the biomass of the other organs was obviously visually different. As the thinning intensity increases, the relative biomass of bark and branches increased first and then decreased, reaching a peak in the 49.6% thinned group. The stem showed the opposite trend, decreasing first and then increasing, showing the lowest value in the 49.6% thinned group. In the 49.6% thinned group, the relative biomass distribution of the stem, branches, leaves and bark of white birch increased by −3.6%, 4.7%, 2.7% and 0% compared to the CK group, respectively.
3.3.2. Effect of Thinning on AGB of Tree Layers
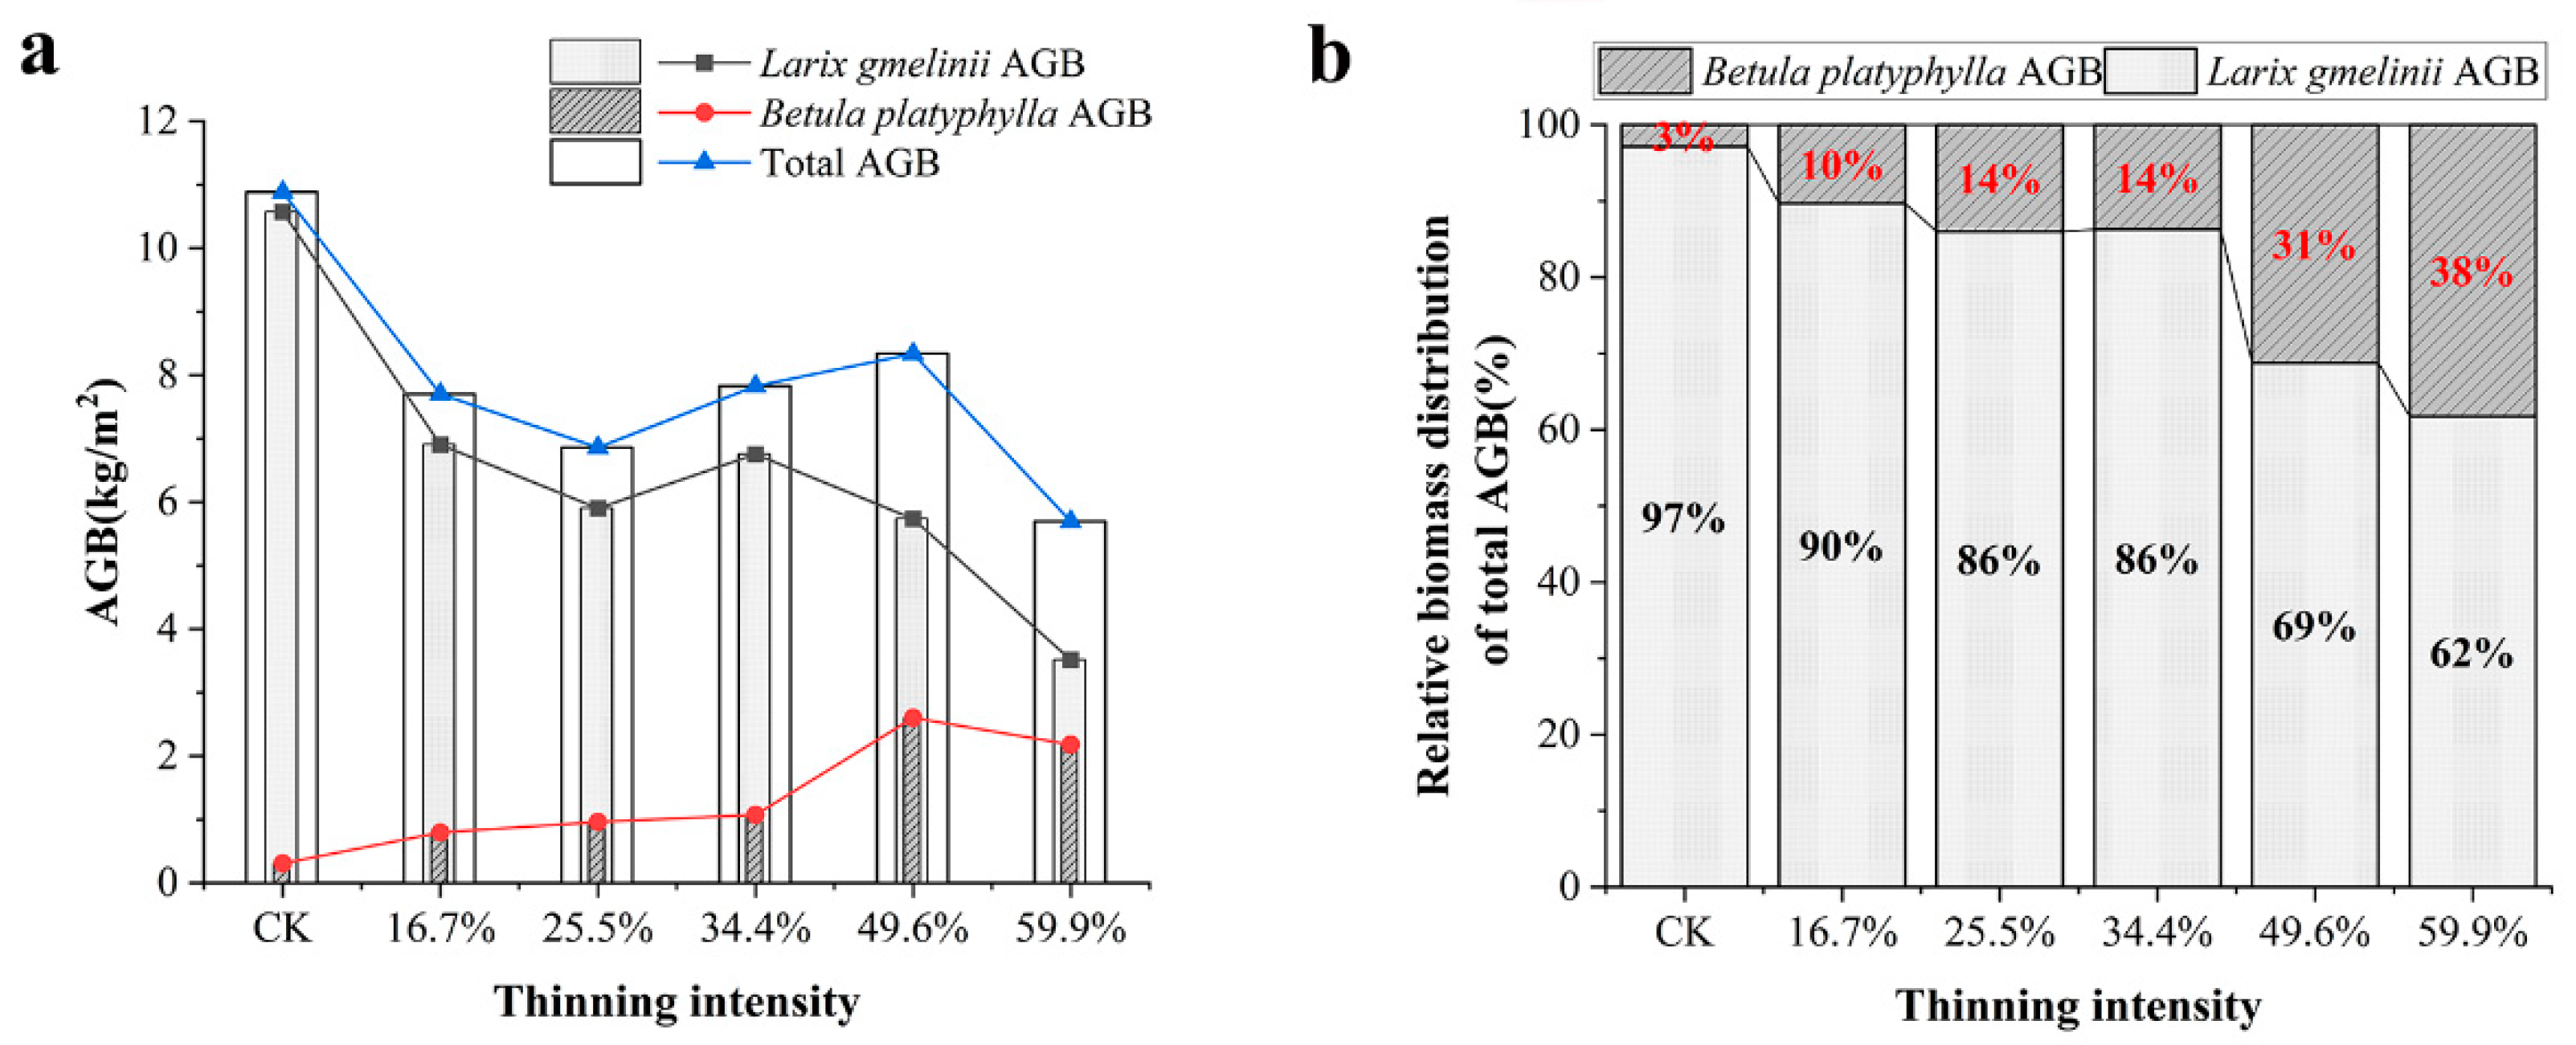
The AGB of tree species was obtained by accumulating the biomass of the stem, branches, leaves and bark. The AGB of the tree layer was obtained by accumulating the AGB of larch and birch. Meanwhile, we used biomass per unit area to express the relative size of total biomass. The results are shown in Figure 6.
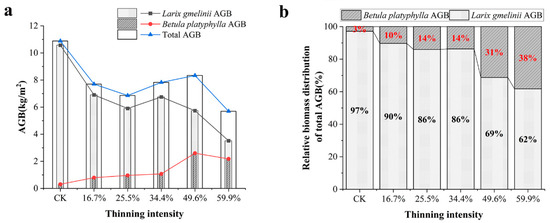
Figure 6.
AGB of tree layer under different thinning intensities. Note: (a) shows the total AGB of larch, birch and stand in the tree layer, (b) is the relative distribution of total AGB of Larch and birch in the tree layer.
As the thinning intensity increases, the AGB of larch decreased gradually. The AGB of the thinned groups was lower than that of the CK group. However, the AGB of the 34.4% thinned group was only 36% lower than that of the CK group. The birch has the opposite pattern. It showed an overall upward trend but a slight decrease in the 59.9% thinned group. In the 49.6% thinned group, AGB reached the peak, which was 740% higher than that of the CK group, but AGB in the five thinned groups was much higher than that of the CK group. In terms of total AGB, the five thinned groups were lower than the CK group. However, in the five thinning groups, as the thinning intensity increased, the total biomass increased first and then decreased. In the 49.6% thinned group, the total biomass reached the peak, which was only 2.5 kg/m2 lower than that of the CK group. The highest total AGB is always found in the un-thinned stands.
As shown in Figure 6b, we visualized the distribution of AGB of two tree species in total AGB. The results showed that larch AGB was dominant. However, the relative proportion of the two tree species has changed greatly. As the thinning intensity increases, the proportion of AGB in total AGB of birch increased from 3% to 38% in the CK group and the 59.9% thinned group. The AGB of larch showed a downward trend.
3.4. Effect of Thinning on the Carbon Density of Tree Layers
3.4.1. Effect of Thinning on Carbon Density of Standard Individual Trees
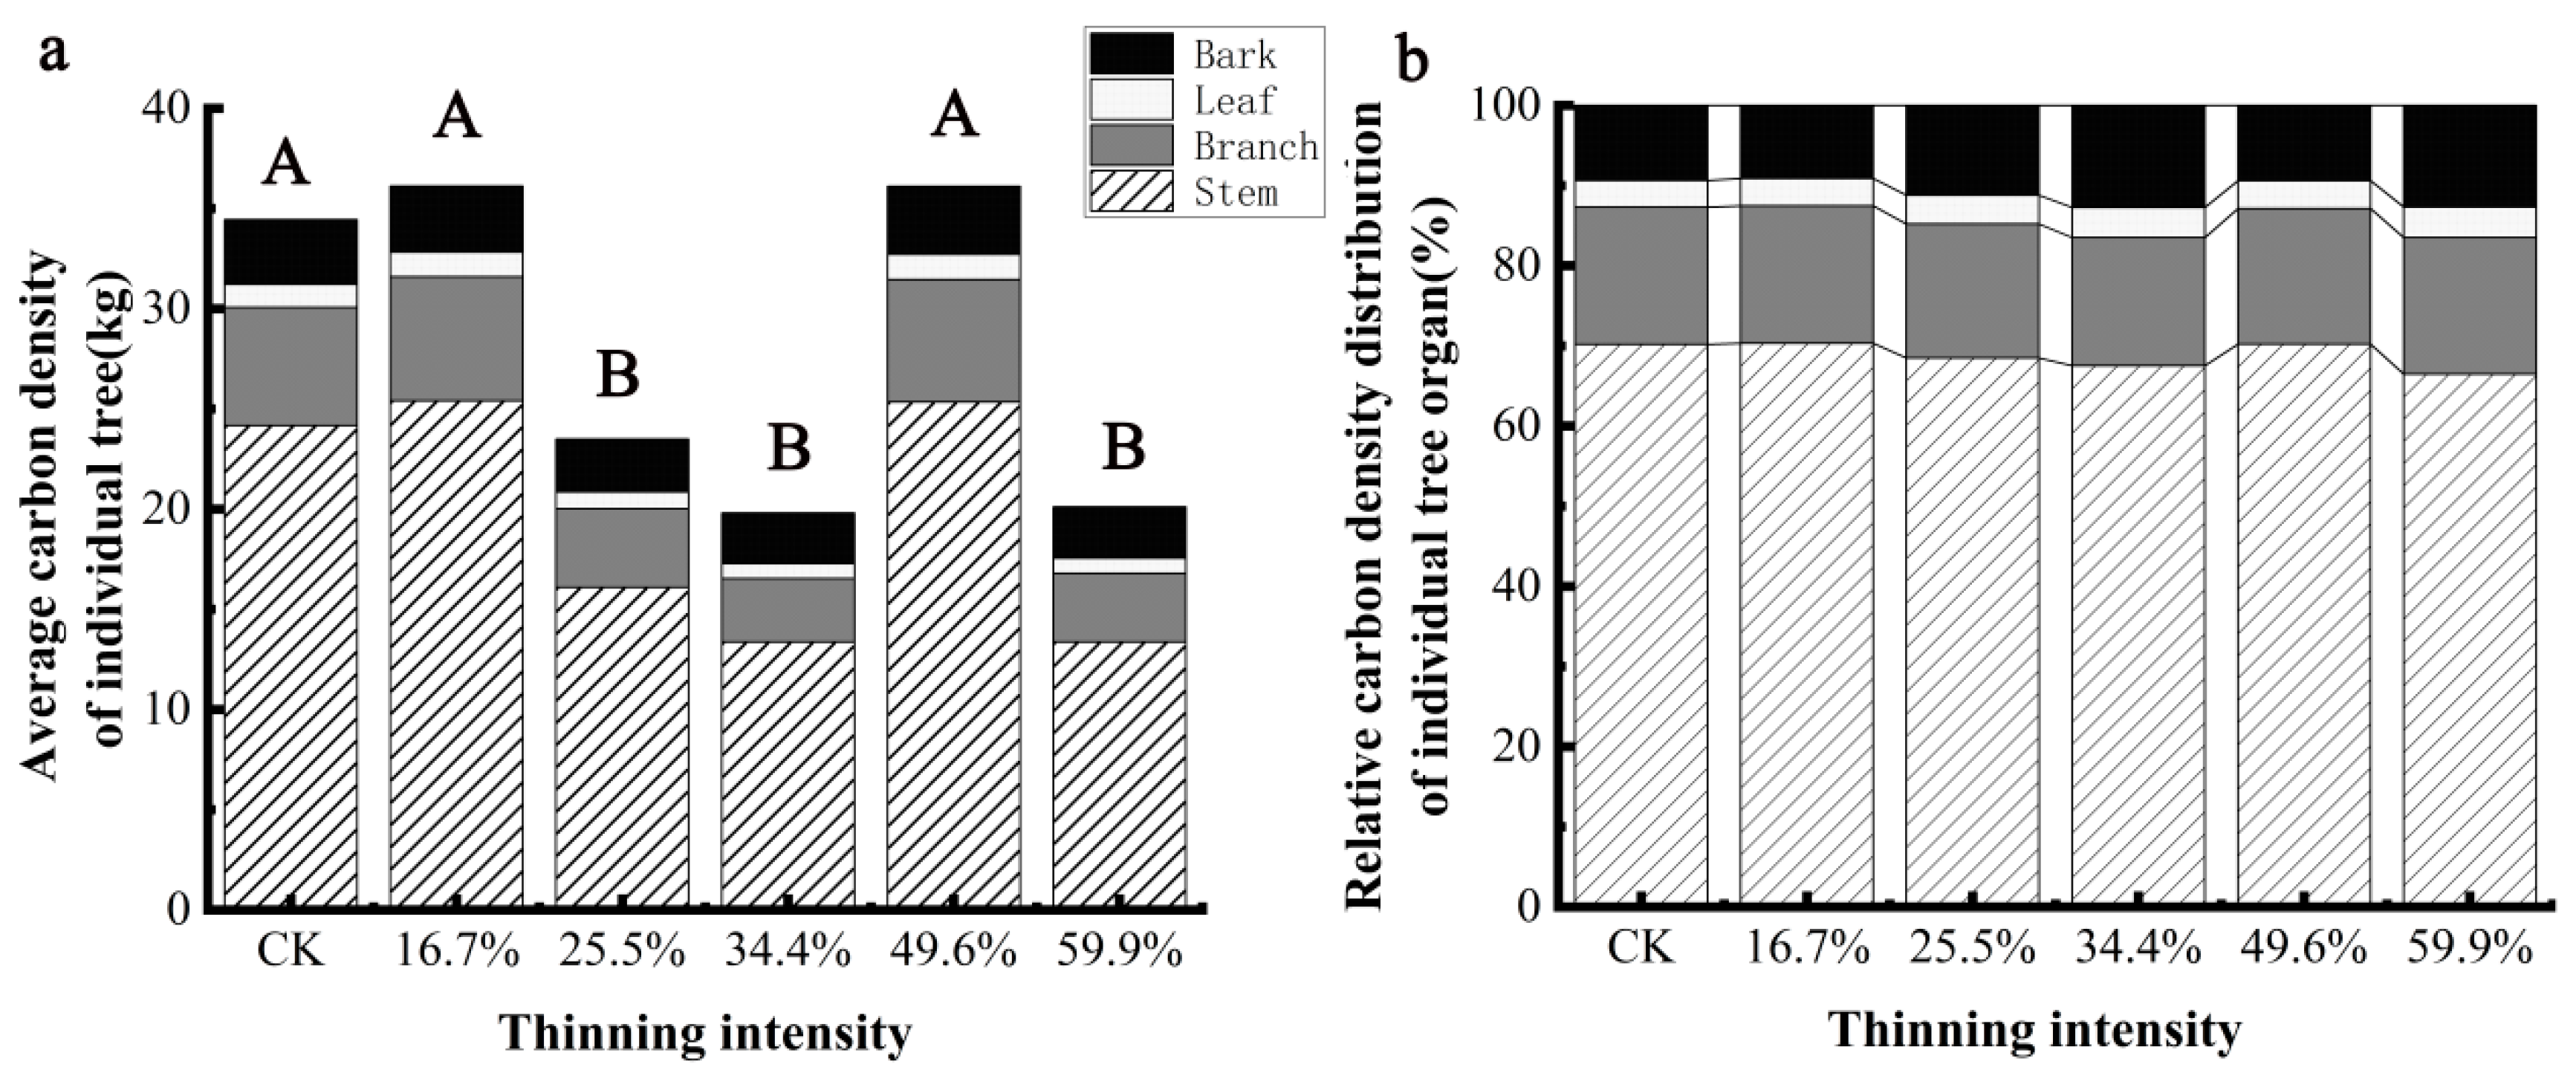
The carbon density of individual trees and organs of larch species under different thinning intensities is shown in Figure 7a, which shows that the carbon density of larch and its organs decreases at first and then increases and then decreases with the increase in thinning intensity. Different thinning groups had different effects on the carbon density of individual trees and organs of larch. Compared with the CK group, carbon density of larch and organs increased in 16.7% and 49.6% intensity thinning groups, but the difference was not significant (p > 0.05). While 25.5%, 34.4% and 59.9% intensity thinning groups, larch and various organs’ carbon density significantly decreased (p < 0.05). Based on the analysis of the carbon density of each organ of larch (Figure 7b), it can be seen that all the sample plots have the largest stem carbon density, accounting for more than 60% of the carbon density of larch per plant, and the leaf carbon density is the smallest, accounting for only 3% of the carbon density of larch per plant. The biggest difference in carbon density distribution of larch organs under different thinning intensities was bark. In the 34.4% thinning group, the proportion of bark carbon density increased by 4% compared with that of the CK group, while the change range of carbon density ratio of other organs was less than 4%, indicating that thinning had little effect on the distribution of carbon density in larch organs.
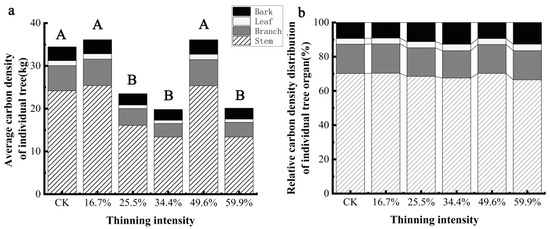
Figure 7.
The average individual tree organ carbon density and its allocation of larch. Note: (a) is larch average carbon density of individual tree, (b) is larch relative carbon density distribution of individual tree organ.The different capital letters in the same graph denote a statistically significant difference at p < 0.05 of the average carbon density between thinning intensity groups.
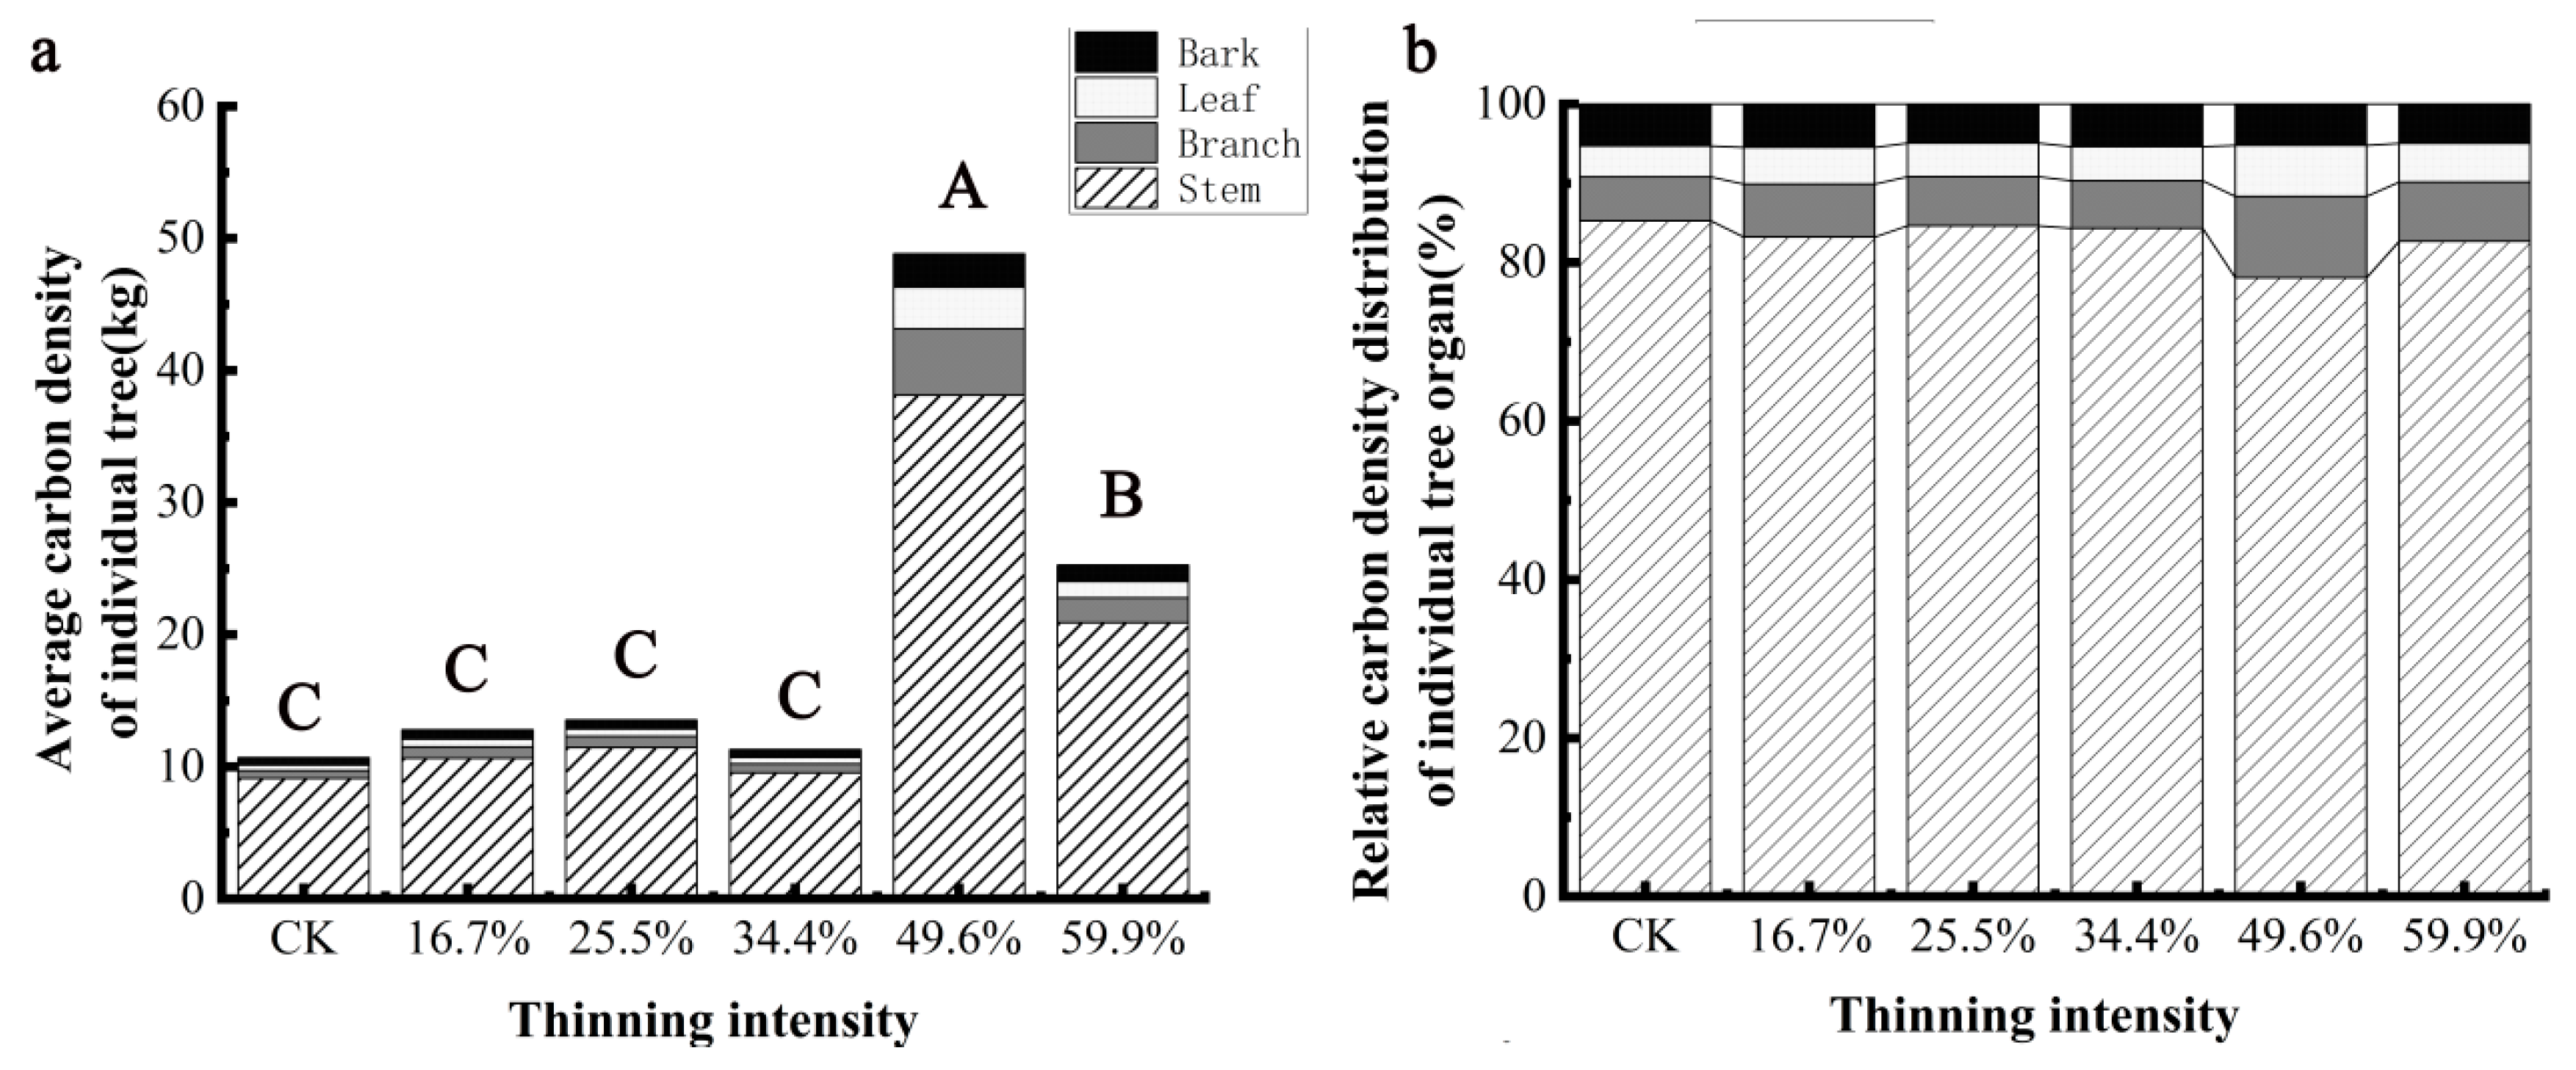
The carbon density of individual trees and organs of birch species is shown in Figure 8a. It can be seen that the carbon density of individual trees and organs of birch with different thinning intensities increases at first and then decreases. The carbon density of birch and its organs in the five thinning groups was higher than those in the CK group, but the differences were different. The carbon density of a single tree and organs in the 49.9% thinning group was the most, which was the most significant increase compared with CK (p < 0.05). When the intensity was less than 34.4%, thinning had no significant effect on the carbon density of birch and its organs (p > 0.05). The distribution of carbon density in individual trees and organs of birch with different thinning intensity is shown in Figure 8b. The distribution of carbon density in different organs is different under different thinning intensities, and the proportion of stem carbon density is the largest, which is 69% and 74%. Stem > branch > leaf > bark in 49.6% thinning intensity group, stem > branch > bark > leaf in 25.5%, 34.4% and 59.9% thinning group, stem > branch > bark > leaf in CK group and 16.7% thinning group. Thinning reduced the proportion of carbon density in the stem and increased the proportion of carbon density in the branches and leaves. The proportion of stem carbon density changed the most, with the proportion of stem carbon density decreasing by 7% and that of branches and leaves increasing by 4% and 2%, respectively, in the 49.6% thinning group compared with the CK group. This shows that thinning can not only increase the carbon density of birch, but also change the proportion of carbon density in different organs of birch.
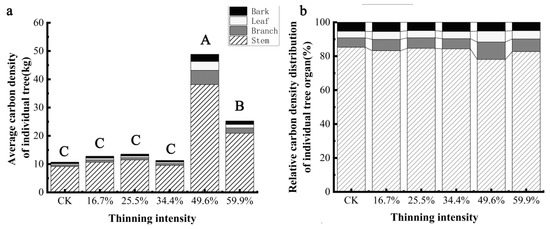
Figure 8.
The average individual tree organ carbon density and its allocation of birch. Note: (a) is birch average carbon density of individual tree, (b) is birch relative carbon density distribution of individual tree organ. The different capital letters in the same graph denote a statistically significant difference at p < 0.05 of the average carbon density between thinning intensity groups.
3.4.2. Effect of Thinning on AGC of Tree Layers
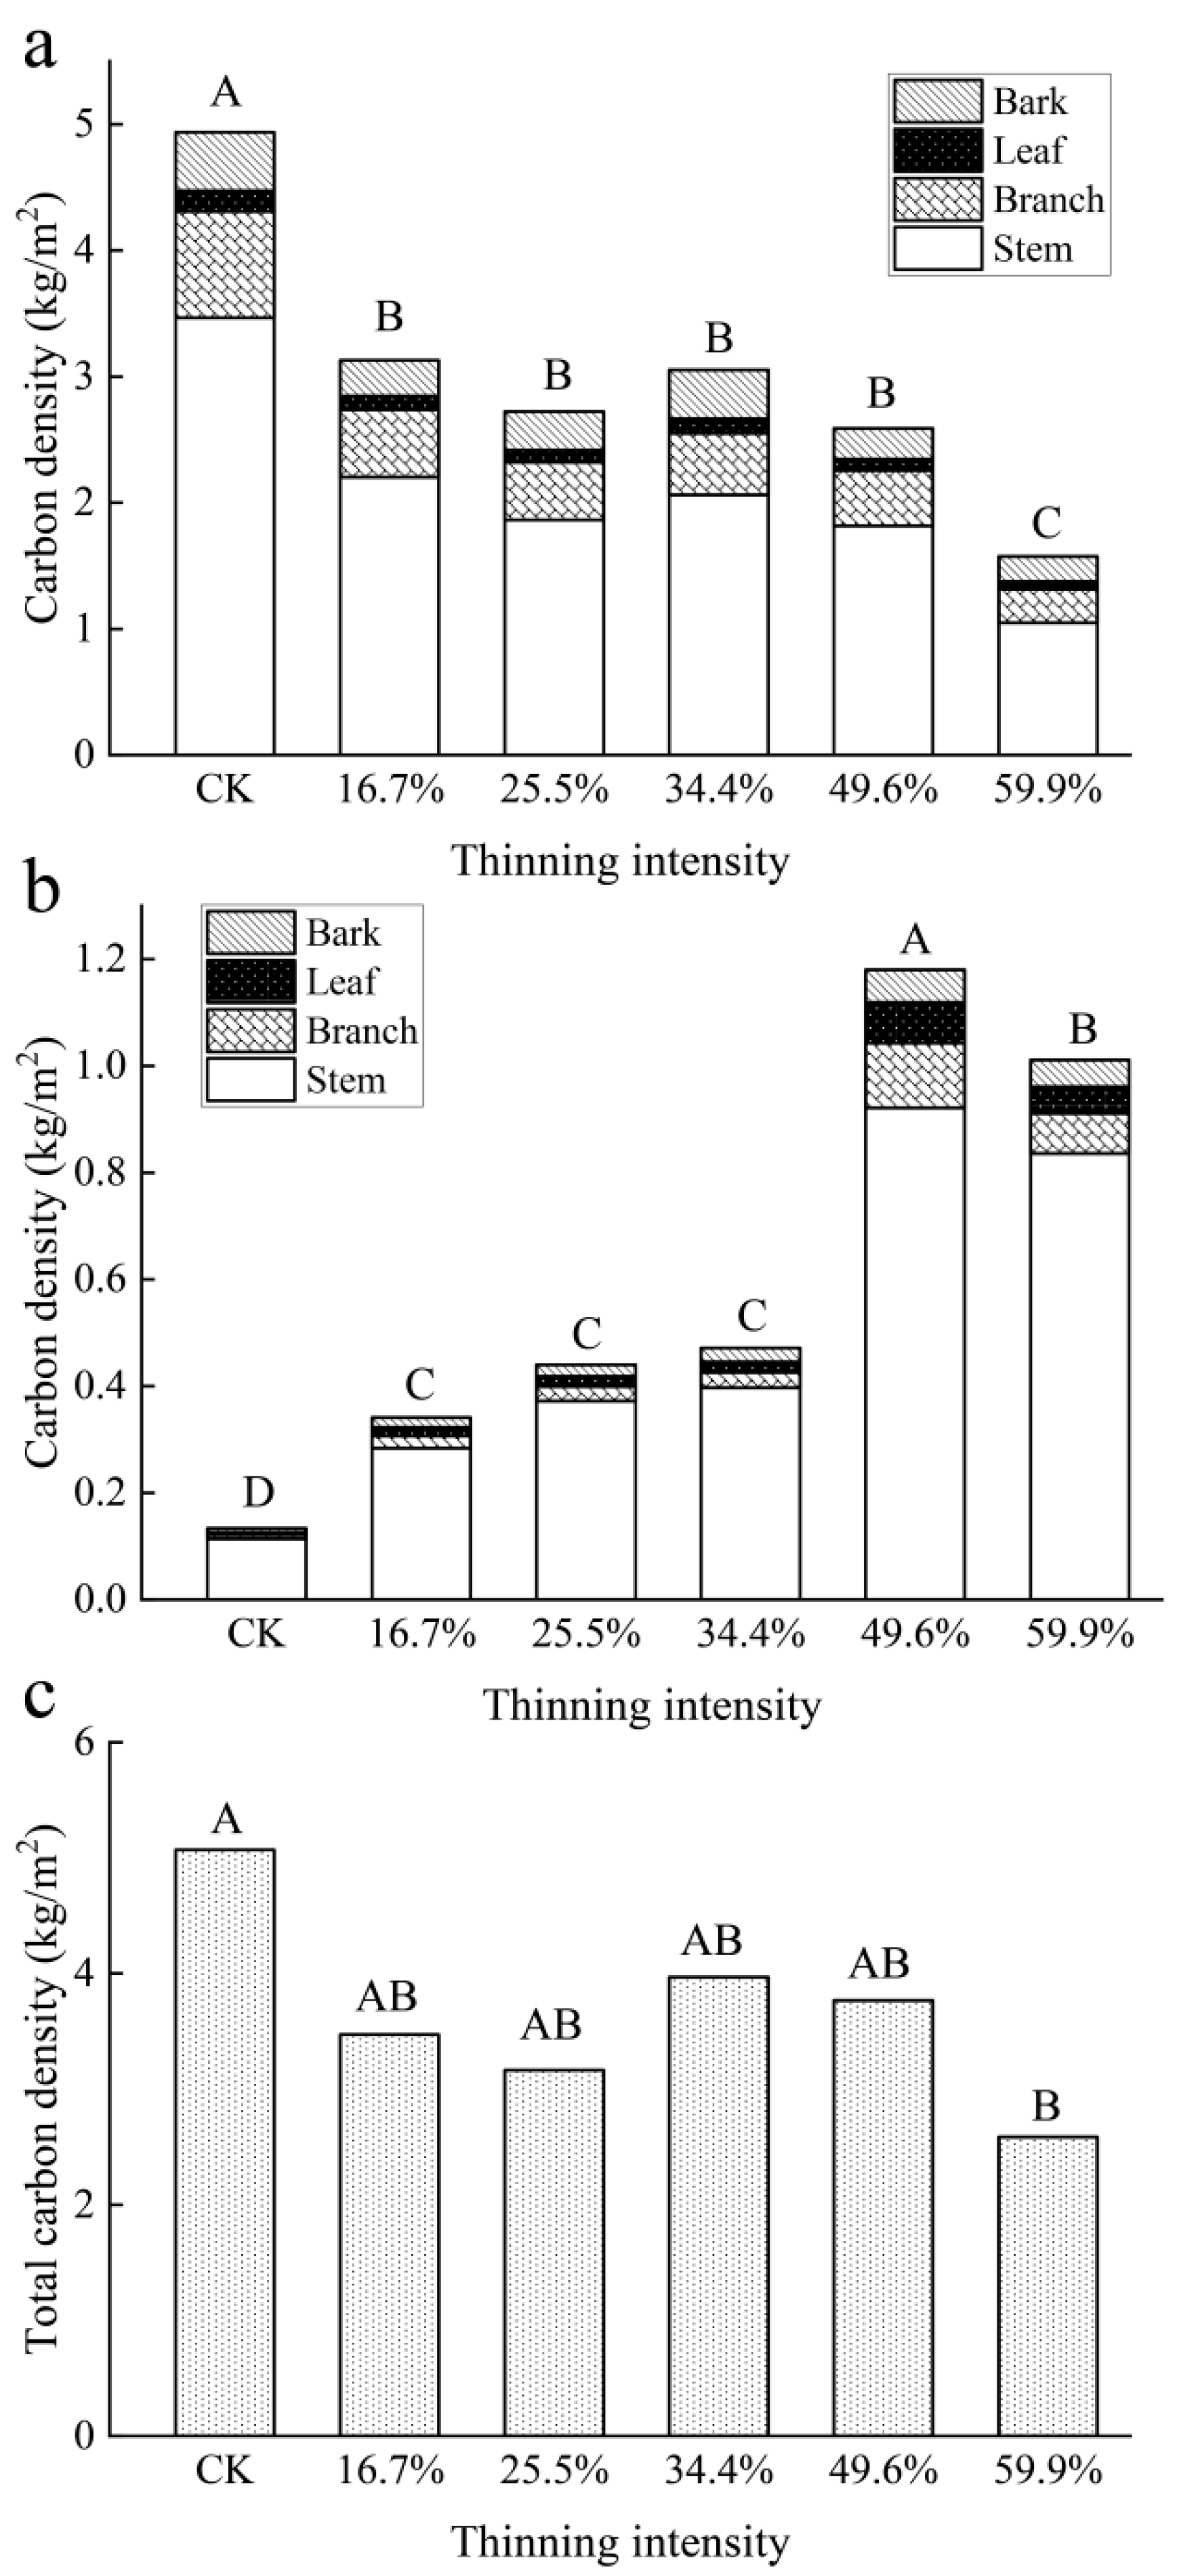
As shown in Figure 9a, the carbon density of larch species decreased with the increase in thinning intensity. Carbon density decreased significantly in all the thinned groups. The carbon density of each organ was significantly different and the order was stem > branch > bark > leaf. According to a one-way ANOVA statistical analysis, there was a significant difference in carbon density between the CK group and all thinned groups (p < 0.05).

Figure 9.
Aboveground carbon density of tree layers. Note: (a) is larch carbon density, (b) is birch carbon density and (c) stand total carbon density. The different capital letters in the same graph denote a statistically significant difference at p < 0.05 of the carbon density between thinning intensity groups.
The carbon density of the birch shows the opposite pattern to that of larch in Figure 9b. The carbon density of birch increased significantly with the increase in thinning intensity and reached a peak when in the 49.6% thinned group. Then, it showed a downward trend when in the 59.9% thinned group. The carbon density of each organ was significantly different and the order was stem > branch > bark = leaf.
The total carbon density of the aboveground biomass of the tree layer (including larch and birch) decreased with the increase in thinning intensity, which was first fast and then slow. In the 34.4% thinned group, the carbon density rebounded slightly, which was due to the contribution of birch carbon density and then continued to decrease slowly. In the 59.9% thinned group, the carbon density reached the minimum value, 2.58 kg/m2. Although birch showed an increasing trend, larch was dominant in all groups. There was a significant difference in carbon density between the CK group and the 59.9% thinned group, but there was no significant difference with other thinned groups.
4. Discussion
4.1. Effect of Thinning on Forest Growth
Tree DBH distribution and tree height distribution are the most direct and effective factors to reflect the management status of stand in non-spatial structure. DBH is easily measured in forest surveys and the measured values are accurate and reliable, which provides solid data support for forest tree tabulating and forest management technology research. They are commonly used as key variables for understanding stand biomass, carbon stock, forest growth and for the evaluation of forest status [11]. Most research results show that thinning can increase DBH growth because it improves the competitive pressure of light and water among tree species [30,31]. These previous studies are different from our results. Our results showed that compared with the CK group, the low or high thinning intensity did not significantly increase DBH. When the thinning intensity was 49.6%, DBH increased compared to the CK group. This may be due to the difference between natural secondary forests and artificial forests. Previous thinning research has tended to focus on forests with favorable growth conditions, whereas our study is taking place in secondary forests with a poor growth environment and low canopy density. After low-intensity thinning, the canopy density decreased and the soil surface temperature increased, resulting in water evaporation, which affected the growth of trees. When the thinning intensity was 49.6%, although this effect was still there, due to the increase in the proportion of birch, a broad-leaved tree species, the DBH developed in a larger direction. Analogous to other studies, species-level differences in growth may be useful in explaining different responses to thinning treatments [31]. The thinning management seems to be the most important driver of the increase in hardwoods and mixed stands and the decrease in conifer stands [32,33]. Understanding the relationship between thinning intensity and growth response can help managers plan thinning levels to maximize benefits for carbon stock and species growth.
4.2. Effect of Thinning on Carbon Concentrations
Carbon conversion coefficient choices influence AGB carbon estimates. Carbon content changes along with species, composition, organs, stand conditions, seasons, and other factors. While mostly ignored, these changes affect AGB carbon stocks estimates and accumulation rates through time. Our results showed that under the six thinning intensities, the difference in the leaves was the most significant. There was no significant difference among the stem, branches and bark. Thinning increased the carbon content of larch leaves. This may be due to the change in canopy structure and light competition caused by thinning, which affects photosynthesis. Carbohydrates, the first product of photosynthesis, are stored in the leaves. Larch conifers receive more sunlight. In general, the thinning intensity will not make a great difference in the carbon content of tree species. However, the actual measured carbon content is 43%–47%, which will be lower than the carbon content commonly used (50%) [34] in carbon sink measurement. The estimation of the carbon pool will be biased [35,36]. Therefore, we suggest that it is more accurate to measure the carbon content of tree species in small-scale carbon pool measurement research.
4.3. Effect of Thinning on Biomass
We calculate the biomass through the allometric growth equation of DBH, so the average individual tree biomass and DBH have a similar trend. However, throughout the study, differences can be seen in biomass growth between white birch and larch, as birch has greater leaf mass per area and greater photosynthetic capacity than larch. In general, as the thinning intensity increases, the biomass on the stand scale decreased. This result is the same as other research results, which is directly caused by the reduction in stand density and the number of dynamic trees caused by thinning [17,21,32,37]. Between 34.4% and 49.6% thinned groups, biomass showed a slight rebound, which was the result of the significant increase in the proportion of birch species [38]. This result can also be seen in Figure 6b. The mixed forest stand grew faster and reached higher productivity than monospecific stands. The results of statistical analysis showed that when the thinning intensity was lower than 49.6%, there was no significant difference in the total aboveground biomass compared with CK group. It also showed that after twelve years of forest growth recovery after thinning, the biomass of the thinned groups will be closer to that of the CK group.
4.4. Effect of Thinning on Carbon Density
Our research result has shown that the CK group stands store more aboveground carbon than thinning groups [32]. Here, thinning has resulted in reduced carbon in living biomass. Carbon density shows a pattern that is familiar with biomass. This suggests that aboveground biomass (AGB) or C stocks could return to their original values, or it will take longer to recover [39].
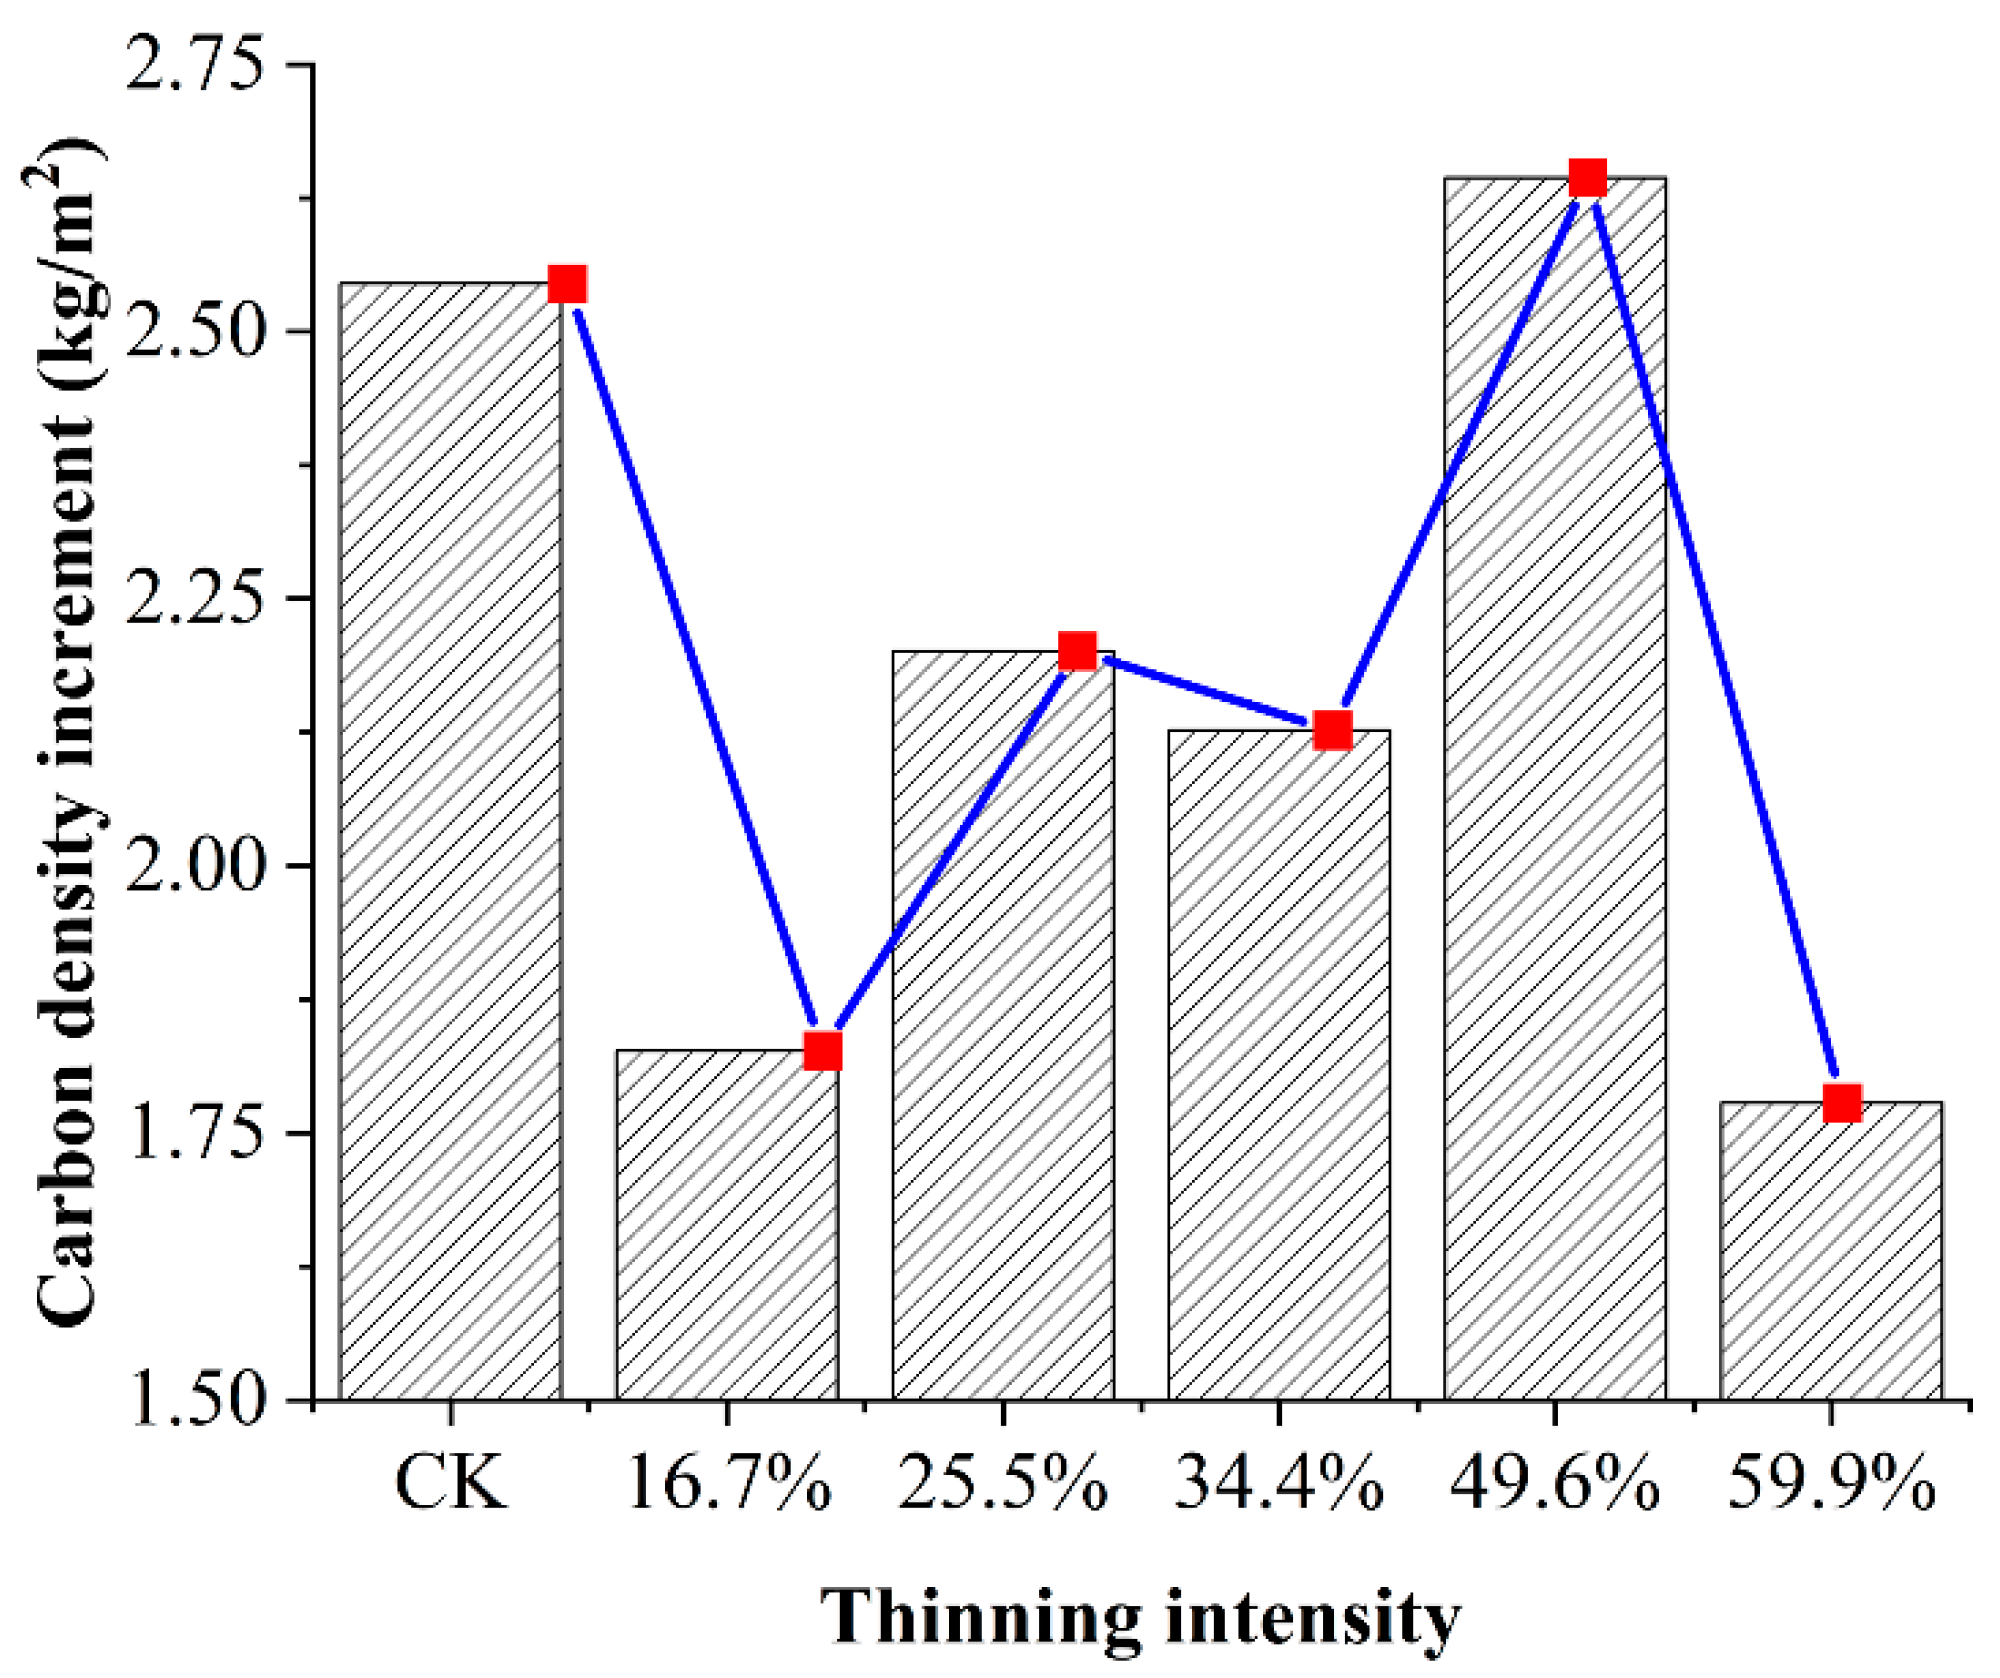
We assume that all the trees in the sample plot are larch and we make a rough comparison of the carbon density in the sample plot in 2007 and 2019. The increment in carbon density after 12 years of thinning is shown in Figure 10.

Figure 10.
The increment in carbon density after 12 years of thinning.
In Figure 10, after 12 years of thinning as the thinning intensity increases, the cumulative increase in carbon density first increased and then decreased, reaching the maximum cumulative increment in the 49.6% thinned group. It was the only group that exceeded the CK group on carbon density. Time since thinning is also an important factor in post-treatment carbon density growth response. In the 12 years after thinning, the carbon density of the five thinned groups decreased compared to the CK group. However, the carbon sequestration rate of the 49.6% thinned group was higher than that of the CK group. With the extension of time, the carbon storage of the 49.6% thinned group will exceed that of the CK group. This result showed that thinning is a beneficial practice in the long term from the standpoint of carbon accumulation [29,40]. In addition, we should note that the increment in carbon density of the 49.6% thinned group was underestimated. For the convenience of calculation and rough estimation, we assume that all the trees in the sample plot are larch. In fact, birch accounts for 31% in this thinning group, and the individual wood biomass of birch (107 kg) was much larger than that of larch (80 kg).
The carbon stock of live trees due to thinning was compensated for by the fast growth in pioneer broadleaf species during the first several decades after the management [41]. This suggests that white birch may succeed in larch as the dominant species of these stands in the long term. Birch is considered to be a fast-growing pioneer tree species with a high biological yield. Intensive natural regeneration of birch after thinning is also very common, which means that the reduction in carbon storage caused by thinning is temporary. This reduction will lead to the balance of the carbon budget for the short thinning period due to the high productivity of birch species and the rapid recovery of carbon accumulation. This dynamic should eventually lead to the development of a forest dominated by mixed coniferous and broad-leaved species, which is closer to the primary vegetation in northeastern China. Given the increasing importance of natural forest rehabilitation and restoration in China, the conversion of larch forest to the natural mixed forest with complex structures is stated as a management objective for the region. Based on our observations, a succession cut that prioritizes the harvest of dominant larch trees could be used in the future to accelerate stand conversion and meet such an objective.
4.5. Limitations of This Study and Suggestions for the Future
There are several limitations and deficiencies in our study. First, we used the biomass allometric growth equation with the DBH and the same parameter in different thinned groups. The effect of thinning on the morphological changes in tree species (such as the change in crown width) and then on the allometric growth equation was not considered. Second, in our study, only the effect of thinning on the aboveground tree layer biomass carbon density was carried out, and the surface and underground biomass carbon density were not considered. Although the carbon density of the tree layer is most affected by thinning, thinning also has a certain impact on the carbon density of shrubs, herbs and soil. Therefore, in assessing the impact of thinning on the carbon density of the whole forest ecosystem, it is necessary to consider all carbon pools.
5. Conclusions
We studied the relationship between thinning and tree layer carbon density of larch–birch natural secondary forests in the Greater Khingan Range. Thinning reduced AGB and carbon density of the tree layers in a short time. However, the appropriate thinning intensity (49.6%) could promote the increase in DBH, AGB of the individual tree and carbon accumulation. The great difference in carbon growth rates among different management levels shows that thinning management intensity plays a key role in the natural secondary forest carbon accumulation.
Thinning management plays an important role in improving carbon storage of degraded secondary forests. Our research results provide an important basis for thinning management of natural secondary forests, to protect the sustainable development of productivity and carbon sequestration benefits of natural secondary forests. The results of this study can be used as a reference to guide the thinning management of secondary forests of similar tree species in the study area and even similar areas, especially in Northeast China.
Author Contributions
Conceptualization, Y.L. and Y.M.; methodology, Y.M. and Y.Z.; software, Y.M.; validation, C.L. and Z.W.; investigation and sample collection, Y.M. and Z.W.; writing—original draft preparation, Y.M.; writing—review and editing, Y.L. and Y.Z. All authors have read and agreed to the published version of the manuscript.
Funding
This research was supported by the Provincial Key R&D Program of Heilongjiang (GA19C006, GA21C030).
Institutional Review Board Statement
Not applicable.
Informed Consent Statement
Not applicable.
Data Availability Statement
The data presented in this study are available on request from the corresponding author.
Conflicts of Interest
The authors declare no conflict of interest.
References
- Al-Ghussain, L. Global warming: Review on driving forces and mitigation. Environ. Prog. Sustain. Energy 2019, 38, 13–21. [Google Scholar] [CrossRef] [Green Version]
- Scheffer, M.; Brovkin, V.; Cox, P.M. Positive feedback between global warming and atmospheric CO2 concentration inferred from past climate change. Geophys. Res. Lett. 2006, 33, gl025044. [Google Scholar] [CrossRef]
- Wang, J.; Quan, Q.; Chen, W.; Tian, D.; Ciais, P.; Crowther, T.W.; Mack, M.C.; Poulter, B.; Tian, H.; Luo, Y.; et al. Increased CO2 emissions surpass reductions of non-CO2 emissions more under higher experimental warming in an alpine meadow. Sci. Total Env. 2021, 769, 144559. [Google Scholar] [CrossRef] [PubMed]
- Carvalhais, N.; Forkel, M.; Khomik, M.; Bellarby, J.; Jung, M.; Migliavacca, M.; Mu, M.; Saatchi, S.; Santoro, M.; Thurner, M.; et al. Global covariation of carbon turnover times with climate in terrestrial ecosystems. Nature 2014, 514, 213–217. [Google Scholar] [CrossRef] [Green Version]
- Węgiel, A.; Polowy, K. Aboveground Carbon Content and Storage in Mature Scots Pine Stands of Different Densities. Forests 2020, 11, 240. [Google Scholar] [CrossRef] [Green Version]
- Nölte, A.; Meilby, H.; Yousefpour, R. Multi-purpose forest management in the tropics: Incorporating values of carbon, biodiversity and timber in managing Tectona grandis (teak) plantations in Costa Rica. For. Ecol. Manag. 2018, 422, 345–357. [Google Scholar] [CrossRef]
- Pan, Y.; Birdsey, R.A.; Fang, J.; Houghton, R.; Kauppi, P.E.; Kurz, W.A.; Phillips, O.L.; Shvidenko, A.; Lewis, S.L.; Canadell, J.G.; et al. A large and persistent carbon sink in the world’s forests. Science 2011, 333, 988–993. [Google Scholar] [CrossRef] [Green Version]
- Huang, L.; Zhou, M.; Lv, J.; Chen, K. Trends in global research in forest carbon sequestration: A bibliometric analysis. J. Clean. Prod. 2020, 252, 119908. [Google Scholar] [CrossRef]
- Jandl, R.; Lindner, M.; Vesterdal, L.; Bauwens, B.; Baritz, R.; Hagedorn, F.; Johnson, D.W.; Minkkinen, K.; Byrne, K.A. How strongly can forest management influence soil carbon sequestration? Geoderma 2007, 137, 253–268. [Google Scholar] [CrossRef]
- Aldea, J.; Bravo, F.; Bravo-Oviedo, A.; Ruiz-Peinado, R.; Rodríguez, F.; del Río, M. Thinning enhances the species-specific radial increment response to drought in Mediterranean pine-oak stands. Agric. For. Meteorol. 2017, 237, 371–383. [Google Scholar] [CrossRef]
- Guan, H.; Dong, X.; Zhang, T.; Wang, Z.; Ruan, J. Comparing the Stand Structure of a Secondary Mixed Forest with Three Broad-Leaved Forests in China’s Greater Khingan Mountains. Pol. J. Environ. Stud. 2020, 29, 5. [Google Scholar] [CrossRef]
- Fantini, A.C.; Schuch, C.; Siminski, A.; Siddique, I. Small-scale Management of Secondary Forests in the Brazilian Atlantic Forest. Floresta Ambiente 2019, 26, 1–12. [Google Scholar] [CrossRef]
- Nicoll, B.C.; Connolly, T.; Gardiner, B.A. Changes in Spruce Growth and Biomass Allocation Following Thinning and Guying Treatments. Forests 2019, 10, 253. [Google Scholar] [CrossRef] [Green Version]
- Kumi, J.A.; Kyereh, B.; Ansong, M.; Asante, W. Influence of management practices on stand biomass, carbon stocks and soil nutrient variability of teak plantations in a dry semi-deciduous forest in Ghana. Trees For. People 2021, 3, 100049. [Google Scholar] [CrossRef]
- Babst, F.; Bouriaud, O.; Papale, D.; Gielen, B.; Janssens, I.A.; Nikinmaa, E.; Ibrom, A.; Wu, J.; Bernhofer, C.; Kostner, B.; et al. Above-ground woody carbon sequestration measured from tree rings is coherent with net ecosystem productivity at five eddy-covariance sites. New Phytol. 2014, 201, 1289–1303. [Google Scholar] [CrossRef] [Green Version]
- Bai, Y.-F.; Shen, Y.-Y.; Jin, Y.-D.; Hong, Y.; Liu, Y.-Y.; Li, Y.-Q.; Liu, R.; Zhang, Z.-W.; Jiang, C.-Q.; Wang, Y.-J. Selective thinning and initial planting density management promote biomass and carbon storage in a chronosequence of evergreen conifer plantations in Southeast China. Glob. Ecol. Conserv. 2020, 24, e01216. [Google Scholar] [CrossRef]
- Bravo-Oviedo, A.; Ruiz-Peinado, R.; Modrego, P.; Alonso, R.; Montero, G. Forest thinning impact on carbon stock and soil condition in Southern European populations of P. sylvestris L. For. Ecol. Manag. 2015, 357, 259–267. [Google Scholar] [CrossRef]
- Griscom, B.W.; Busch, J.; Cook-Patton, S.C.; Ellis, P.W.; Funk, J.; Leavitt, S.M.; Lomax, G.; Turner, W.R.; Chapman, M.; Engelmann, J.; et al. National mitigation potential from natural climate solutions in the tropics. Philos. Trans. R Soc. Lond. B. Biol. Sci. 2020, 375, 20190126. [Google Scholar] [CrossRef] [Green Version]
- Poorter, L.; Bongers, F.; Aide, T.M.; Almeyda Zambrano, A.M.; Balvanera, P.; Becknell, J.M.; Boukili, V.; Brancalion, P.H.; Broadbent, E.N.; Chazdon, R.L.; et al. Biomass resilience of Neotropical secondary forests. Nature 2016, 530, 211–214. [Google Scholar] [CrossRef]
- Zhang, T.; Dong, X.; Guan, H.; Meng, Y.; Ruan, J.; Wang, Z. Effect of Thinning on the Spatial Structure of a Larix gmelinii Rupr. Secondary Forest in the Greater Khingan Mountains. Forests 2018, 9, 720. [Google Scholar] [CrossRef] [Green Version]
- Yu, Z.; Zhou, G.; Liu, S.; Sun, P.; Agathokleous, E. Impacts of forest management intensity on carbon accumulation of China’s forest plantations. For. Ecol. Manag. 2020, 472, 118252. [Google Scholar] [CrossRef]
- Ruiz-Peinado, R.; Bravo-Oviedo, A.; Montero, G.; del Río, M. Carbon stocks in a Scots pine afforestation under different thinning intensities management. Mitig. Adapt. Strateg. Glob. Chang. 2014, 21, 1059–1072. [Google Scholar] [CrossRef]
- Yu, G.; Chen, Z.; Piao, S.; Peng, C.; Ciais, P.; Wang, Q.; Li, X.; Zhu, X. High carbon dioxide uptake by subtropical forest ecosystems in the East Asian monsoon region. Proc. Natl. Acad. Sci. USA 2014, 111, 4910–4915. [Google Scholar] [CrossRef] [PubMed] [Green Version]
- Nave, L.E.; Vance, E.D.; Swanston, C.W.; Curtis, P.S. Harvest impacts on soil carbon storage in temperate forests. For. Ecol. Manag. 2010, 259, 857–866. [Google Scholar] [CrossRef]
- James, J.N.; Kates, N.; Kuhn, C.D.; Littlefield, C.E.; Miller, C.W.; Bakker, J.D.; Butman, D.E.; Haugo, R.D. The effects of forest restoration on ecosystem carbon in western North America: A systematic review. For. Ecol. Manag. 2018, 429, 625–641. [Google Scholar] [CrossRef]
- Hu, M.; Zou, B.; Huang, Z.; Wang, S.; Su, X.; Ding, X.; Zheng, G.; Chen, H.Y.H. Fine root biomass and necromass dynamics of Chinese fir plantations and natural secondary forests in subtropical China. For. Ecol. Manag. 2021, 496, 119413. [Google Scholar] [CrossRef]
- Yuan, Z.; Ali, A.; Sanaei, A.; Ruiz-Benito, P.; Jucker, T.; Fang, L.; Bai, E.; Ye, J.; Lin, F.; Fang, S.; et al. Few large trees, rather than plant diversity and composition, drive the above-ground biomass stock and dynamics of temperate forests in northeast China. For. Ecol. Manag. 2021, 481, 118698. [Google Scholar] [CrossRef]
- Huang, C.; Liang, Y.; He, H.S.; Wu, M.M.; Liu, B.; Ma, T. Sensitivity of aboveground biomass and species composition to climate change in boreal forests of Northeastern China. Ecol. Model. 2021, 445, 109472. [Google Scholar] [CrossRef]
- Mu, C.; Lu, H.; Wang, B.; Bao, X.; Cui, W. Short-term effects of harvesting on carbon storage of boreal Larix gmelinii–Carex schmidtii forested wetlands in Daxing’anling, northeast China. For. Ecol. Manag. 2013, 293, 140–148. [Google Scholar] [CrossRef]
- Roberts, S.D.; Harrington, C.A. Individual tree growth response to variable-density thinning in coastal Pacific Northwest forests. For. Ecol. Manag. 2008, 255, 2771–2781. [Google Scholar] [CrossRef]
- Vernon, M.J.; Sherriff, R.L.; van Mantgem, P.; Kane, J.M. Thinning, tree-growth, and resistance to multi-year drought in a mixed-conifer forest of northern California. For. Ecol. Manag. 2018, 422, 190–198. [Google Scholar] [CrossRef]
- Bosela, M.; Štefančík, I.; Marčiš, P.; Rubio-Cuadrado, Á.; Lukac, M. Thinning decreases above-ground biomass increment in central European beech forests but does not change individual tree resistance to climate events. Agric. For. Meteorol. 2021, 306, 108441. [Google Scholar] [CrossRef]
- Molina, E.; Valeria, O.; De Grandpre, L.; Ramirez, J.A.; Cyr, D.; Boulanger, Y. Projecting future aboveground biomass and productivity of managed eastern Canadian mixed wood boreal forest in response to climate change. For. Ecol. Manag. 2021, 487, 119016. [Google Scholar] [CrossRef]
- Gao, B.; Taylor, A.R.; Chen, H.Y.H.; Wang, J. Variation in total and volatile carbon concentration among the major tree species of the boreal forest. For. Ecol. Manag. 2016, 375, 191–199. [Google Scholar] [CrossRef]
- Pompa-García, M.; Sigala-Rodríguez, J.; Jurado, E.; Flores, J. Tissue carbon concentration of 175 Mexican forest species. Iforest Biogeosci. For. 2017, 10, 754. [Google Scholar] [CrossRef] [Green Version]
- Zhang, Q.; Wang, C.; Wang, X.; Quan, X. Carbon concentration variability of 10 Chinese temperate tree species. For. Ecol. Manag. 2009, 258, 722–727. [Google Scholar] [CrossRef]
- Ahmad, B.; Wang, Y.; Hao, J.; Liu, Y.; Bohnett, E.; Zhang, K. Variation of carbon density components with overstory structure of larch plantations in northwest China and its implication for optimal forest management. For. Ecol. Manag. 2021, 496, 119399. [Google Scholar] [CrossRef]
- Moreau, G.; Auty, D.; Pothier, D.; Shi, J.; Lu, J.; Achim, A.; Xiang, W. Long-term tree and stand growth dynamics after thinning of various intensities in a temperate mixed forest. For. Ecol. Manag. 2020, 473, 118311. [Google Scholar] [CrossRef]
- Schwartz, G.; Falkowski, V.; Peña-Claros, M. Natural regeneration of tree species in the Eastern Amazon: Short-term responses after reduced-impact logging. For. Ecol. Manag. 2017, 385, 97–103. [Google Scholar] [CrossRef]
- Aragón, S.; Salinas, N.; Nina-Quispe, A.; Qquellon, V.H.; Paucar, G.R.; Huaman, W.; Porroa, P.C.; Olarte, J.C.; Cruz, R.; Muñiz, J.G.; et al. Aboveground biomass in secondary montane forests in Peru: Slow carbon recovery in agroforestry legacies. Glob. Ecol. Conserv. 2021, 28, e01696. [Google Scholar] [CrossRef]
- Hotta, W.; Morimoto, J.; Inoue, T.; Suzuki, S.N.; Umebayashi, T.; Owari, T.; Shibata, H.; Ishibashi, S.; Hara, T.; Nakamura, F. Recovery and allocation of carbon stocks in boreal forests 64 years after catastrophic windthrow and salvage logging in northern Japan. For. Ecol. Manag. 2020, 468, 118169. [Google Scholar] [CrossRef]

Publisher’s Note: MDPI stays neutral with regard to jurisdictional claims in published maps and institutional affiliations. |
© 2022 by the authors. Licensee MDPI, Basel, Switzerland. This article is an open access article distributed under the terms and conditions of the Creative Commons Attribution (CC BY) license (https://creativecommons.org/licenses/by/4.0/).