Abstract
Quantifying wind loads acting on forest trees remains a major challenge of wind-tree-interaction research. Under wind loading, trees respond with a complex motion pattern to the external forces that displace them from their rest position. To minimize the transfer of kinetic wind energy, crowns streamline to reduce the area oriented toward the flow. At the same time, the kinetic energy transferred to the trees is dissipated by vibrations of all aerial parts to a different degree. This study proposes a method to estimate the effective wind load acting on plantation-grown Scots pine trees. It evaluates the hypothesis that the effective wind load acting on the sample trees can be estimated using static, non-destructive pulling tests, using measurements of stem tilt under natural wind conditions and static, non-destructive pulling tests. While the analysis of wind-induced stem displacement reconstructs the temporal tree response dynamics to the effective wind load, results from the pulling tests enable the effective wind load quantification. Since wind-induced stem displacement correlates strongly with the sample trees’ diameter at breast height, the effective wind load estimation can be applied to all other trees in the studied stand for which diameter data is available. We think the method is suitable for estimating the effective wind load acting on trees whose wind-induced response is dominated by sway in the fundamental mode.
1. Introduction
An essential factor of the atmospheric environment that affects the growth, development, and survival of trees and forests is the endemic wind load regime [1,2,3,4]. Turbulent and non-turbulent parts of local airflow cause a dynamic response in trees resulting from the tree-specific conversion of kinetic airflow energy to elastic energy [5,6].
The energy transfer into trees occurs on several different temporal and spatial scales on all aerial tree parts—from individual leaves to entire canopies [7,8]. Depending on their intensity, wind loads can be classified as recurrent or critical. Recurrent wind loads are an inherent part of the endemic wind climate. Critical wind loads occur infrequently and cause damage to trees and forests [9].
Maximum gust speed is an effective indicator of critical wind loads [3,10,11,12] used in statistical [13,14] and hybrid-mechanistic modeling of storm damage to forests [15,16,17,18].
Because storms frequently damage enormous numbers of trees and forests worldwide, there is a fundamental interest in a comprehensive understanding of the processes that contribute to storm damage. Considerable efforts have been made to better understand the origin [19,20], the patterns [21,22], and the impacts of storm damage in forests [23,24,25] and urban trees [26] as well as the growth reaction of trees to storm and wind stimulus [27,28].
The first step in analyzing wind-forest tree interactions is a comprehensive assessment of the excitation of the above-ground tree parts exposed to the wind. Because of the broad spectrum of spatial and temporal scales at which full-scale tree excitation can occur under natural wind conditions, analysis of the components involved in inducing tree response is inherently complex [29].
A simple assumption, which cannot represent the whole complexity, is based on the decomposition of wind loads into turbulent and non-turbulent or mean wind loads. The turbulent wind loads, which are associated with the occurrence of gusts, act on shorter time scales (<1 min) and more minor space scales (maximum a few hundred meters) than the mean wind loads (typically 10 to 60 min averaging intervals). Under high natural winds, the mean loads can also be called quasi-static because they have lower spatiotemporal variability than turbulent scales. Hybrid-mechanistic storm damage models combine turbulent and quasi-static wind loading to calculate the critical wind speed. The critical wind speed is the minimum wind speed required to break or overturn forest trees [9].
Trees do not respond equally to the whole wind load spectrum. A key finding is that the frequencies where the wind excites forest tree motion and the frequencies of the trees’ dominant damped sway modes occur do not coincide [6]. The primary response to wind loads occurs at frequencies below the frequency range associated with the fundamental sway mode.
Earlier studies [30,31] found that in plantation-grown Scots pine (Pinus sylvestris L.) trees, sway in the fundamental mode is an indirect reaction to displacement from the rest position mainly caused by organized turbulence in the canopy airflow. The median duration of the organized turbulence elements at their measurement site was in the range of 20 s. They characterized the organized wind loads as quasi-static because they act on trees significantly longer than the fundamental sway period and cause non-oscillatory motion. There was no evidence that wind loading in the frequency range of the fundamental sway mode significantly contributed to the wind-induced tree motion pattern. They suggested that oscillatory tree sway in the fundamental mode results from the elastic energy stored in the aerial parts and roots and the damping that returns the trees to their rest position.
Because not all airflow components contribute to the excitation of wind-induced Scots pine tree motion, another study presented an approach for selecting the scales at which the Scots pine trees’ motion is coupled with wind loads [32]. It separates the effective turbulent scales from all scales that do not significantly contribute to the wind excitation of the trees. The components at the connected scales can be linearized and imitate the combined impact of effective turbulent and quasi-static wind loads. So far, the approach can only reproduce the dynamics of effective wind loading, and it is not yet helpful in approximating the absolute value of the effective wind load.
To apply the previously proposed approach, a parameterization via static pulling tests [33,34,35,36,37,38] has to be realized. Tree pulling tests are used for imitating quasi-static wind load components with a winch and cable system. The rationale behind static pulling tests is to approximate the mean force at a constant wind direction required to displace trees from their rest position or break or overturn the pulled trees [39]. We test the hypothesis that the effective wind load acting on trees can be estimated using static, non-destructive pulling tests.
This paper presents a novel approach to combine the temporal dynamics and the absolute values of effective wind loads on individual plantation-grown Scots pine trees. While the temporal dynamics were derived from tree motion measurements made with the Tree Motion Monitoring System TreeMMoSys [40], non-destructive pulling tests were applied to quantify the absolute values of the effective wind loads. The results show that this combination allows a tree-specific estimation of the dynamics and absolute values of effective wind loading on trees where the first sway mode dominates the wind-induced motion.
2. Material and Methods
2.1. Workflow
The main steps of data collection and analysis are summarized in Figure 1: (1) Collecting data from measurements of wind-induced stem tilt, airflow, and stem tilt and pulling force during non-destructive static pulling tests; (2) Splitting wind-induced stem displacement (D) time series into oscillatory (DOC) and non-oscillatory (DNOC) components using singular spectrum analysis; (3) Low-pass filtering of momentum flux data (MNOC) to match the frequency range of DNOC; (4) Applying regression analysis (significance level α = 0.05) for estimating the coefficients of D dependence on the force applied on the sample trees during non-destructive pulling tests; (5) Maximizing the local correlation between DNOC and MNOC using dynamic time warping; (6) Calculating of the effective force (Feff) from dynamically time-warped DNOC and MNOC; (7) Determining of wind load coefficients (WLC) from Feff and MNOC values; (8) Calculating of the tree-specific, instantaneous effective wind load (WLeff) using MNOC and WLC values.
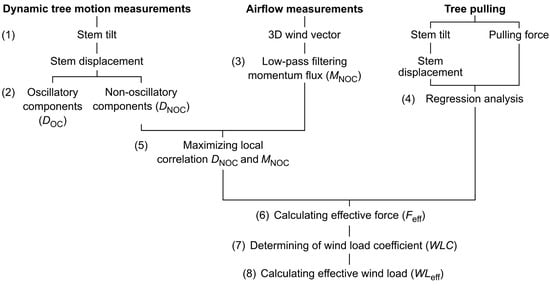
Figure 1.
Main steps in the calculation of the effective wind load (WLeff).
2.2. Research Site and Forest Characteristics
The study was carried out at the forest research site Hartheim operated by the University of Freiburg in Germany. The research site is located in the flat southern Upper Rhine Valley (47°56′04″ N, 7°36′02″ E, 201 m a.s.l.). During the measurement campaign, the Scots pine (Pinus sylvestris L.) forest at the research site had a mean density of 550 trees per hectare and a mean height of 18 m [41].
Detailed information on tree and stand characteristics at the site are available from terrestrial laser scans (TLS). The forest was scanned in March 2020 from 142 positions using a Rigel VZ-400i scanner (RIEGL Laser Measurement Systems GmbH, Horn, Austria). The device was placed at a tripod at 1.8 m height to scan the whole site in a 15 m × 15 m regular grid. An integrated RGB camera was recording pictures during the acquisition process. All scans were colorized using the RGB images, filtered for points with very low reflectance (brightness less than −15 dB), strongly deviated pulses (deviation more than 15), and scatter points (less than 5 points in 0.5 m radius) using the RiScan Software (Version 2.12.1, RIEGL Laser Measurement Systems GmbH, Horn, Austria). Afterward, the scans were combined into one-point clouds and duplicated points where merged within a search radius of 2 cm.
To validate whether crown area influences the wind-induced tree sway behavior, we extracted the crown points for each sample tree using a raster image created from the TLS point clouds. Located trees were manually segmented from the point clouds using the CloudCompare software version 2.12 [42]. To quantify the crown areas in x, y, and z directions, two-dimensional raster images at a 0.1 m × 0.1 m grid resolution were created.
2.3. Airflow Measurements
We analyzed airflow data that was measured (sampling frequency 10 Hz) on seven windy days from 26 December 2020 to 1 January 2021 using four (S1 to S4) ultrasonic anemometers (type 81000VRE, R.M. Young Company, Traverse City, MI, USA). The ultrasonic anemometers were mounted to slender scaffold towers and measured the wind vector components in east-west (u), north-south (v), and vertical (w) directions at the heights 2 m, 9 m, 18 m, and 21 m above ground (Figure 2). The above-canopy momentum flux (M) at 21 m, which was used to approximate the temporal wind load dynamics [32], was calculated as [43]:
where , and are the turbulent parts of u, v, and w after applying the Reynolds decomposition.
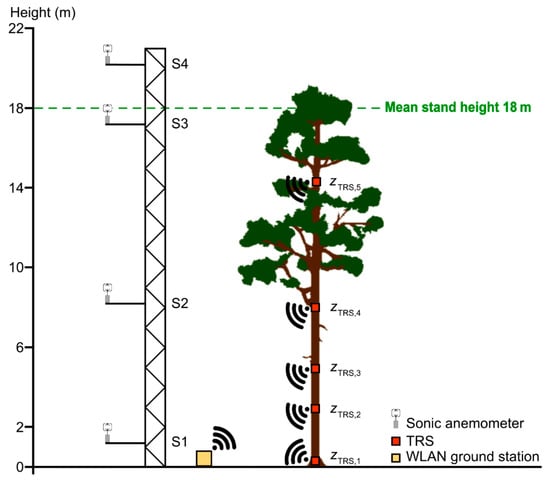
Figure 2.
System used to measure airflow and stem tilt. Four ultrasonic anemometers (S1 to S4) mounted to a slender scaffold tower measured the horizontal and vertical wind vector components at 2 m, 9 m, 18 m, and 21 m. Tilt of the sample trees’ stems under natural wind conditions and during pulling tests was measured in different configurations with the Tree Response Sensor (TRS) [40] at heights zTRS,1 = 0.1 m, zTRS,2 = 1/7 H, zTRS,3 = 5 m, zTRS,4 = 3/7 H, and zTRS,5 = 5/7 H, H is the tree height.
2.4. Stem Tilt Measurements
Previous studies show that the Scots pine trees at the research site start swaying in first mode under low wind speed conditions [29,40]. First-order mode vibration results from their monopodial branching pattern and small crowns and dissipates even small amounts of kinetic energy transferred to them quickly.
To continuously measure (sampling frequency 10 Hz) stem tilt (T, in degrees) in x (tx, east-west) and y (ty, north-south) directions, four Tree Response Sensors (TRS) [40] were mounted to the north facing side of the stems of five sample trees (B1 to B5) at the stem base (zTRS,1 = 0.1 m), 1/7 H (zTRS,2), 3/7 H (zTRS,4), and 5/7 H (zTRS,5), H is the tree height, and z is the measuring height (Table 1).

Table 1.
Height (H, m), stem diameter at breast height (DBH, 1.3 m a.g.l., cm), and crown area (CA, m2) of the sample trees B1 to B35. za is the height of pulling rope anchor point (m), RA is the pulling rope angle (°), and zTRS,1 to zTRS,5 are the Tree Response Sensor (TRS) stem tilt measurement heights.
Based on the results from a previous study [29], it was assumed that zTRS,2, zTRS,4, and zTRS,5, represent the antinodal points of stem vibration. The time series of stem tilt components tx and ty were used to calculate the stem displacement vector (D):
To increase the number of continuously monitored trees for this study, the wind-induced motion of 15 other Scots pine trees (B6 to B20) was measured using a simpler set up with one TRS mounted at zTRS,2. Earlier studies show that information on the Scots pine trees’ stem response measured at one point is sufficient for the following analysis [29,32]. All stem tilt data were collected wirelessly and stored on a ground receiver using the Tree Motion Monitoring System (TreeMMoSys) [40].
Continuously monitored B1 to B20 were subjected to static, non-destructive pulling tests described below. Another set of 15 trees (B21 to B35) was non-destructively pulled to enlarge the sample size and statistical certainty of the pulling test results. We selected the sample trees according to their accessibility, DBH, and based on their neighbors’ positions to enable undisturbed, non-destructive pulling tests without crown collisions.
2.5. Non-Destructive Tree Pulling
After completing the measurement campaign, B1 to B35 were subjected to static, non-destructive pulling tests to calibrate TRS measurements (Figure 3). A 3-fold pulley (CT-Climbing Technology, Torchio, Italia) combined with the PiCUS TreeQinetic system (Argus electronic, Rostock, Germany) was used for the pulling tests. The pulling rope (Dyneema, Dynamica Ropes ApS, Fredericia, Denmark) was attached to the sample trees’ stems below the crown base, corresponding to za = 0.6 H. This height was assumed to be a compromise between avoiding the effects of knots on the overall strength of the stems and being close enough to the crowns where the wind loading occurs [39].
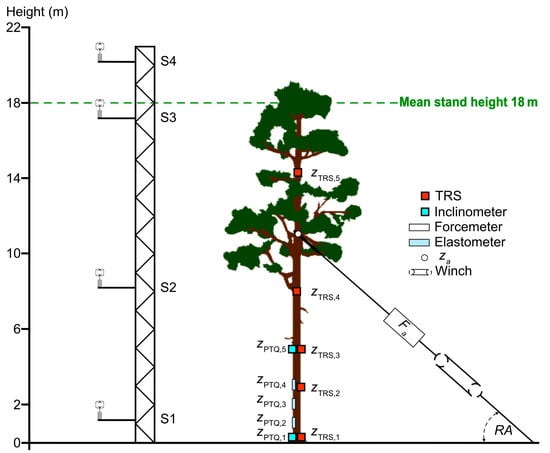
Figure 3.
System used for measuring stem tilt of B1 to B35 during static, non-destructive pulling tests. The stem tilt was measured with five Tree Response Sensors (TRS) at heights zTRS,1 = 0.1 m (stem base), zTRS,2 = 1/7 H, zTRS,3 = 5 m, zTRS,4 = 3/7 H (only B1 to B5), and zTRS,5 = 5/7 H (only B1 to B5), and two PiCUS TreeQinetic (PTQ) inclinometers at zPTQ,1 = 0.1 m and zPTQ,5 = 5 m. Three PTQ elastometers at zPTQ,2 = 1 m, zPTQ,3 = 2 m, and zPTQ,4 = 3 m measured strain in the marginal wood fibers.
The TreeQinetic forcemeter measured the applied force (Fa) along the rope into the pulling direction. Three TreeQinetic elastometers were mounted to the leeward side of the stems at 1 m (zPTQ,2), 2 m (zPTQ,3), and 3 m (zPTQ,4) to measure strain in the marginal wood fibers. TRS (zTRS,1, zTRS,3) and TreeQinetic inclinometers were mounted to the stem base (0.1 m) and at 5 m height (zPTQ,1, zPTQ,5) to record tx and ty while B1 to B35 were pulled [44]. The pulling force was increased until a root plate inclination of 0.25° or 100 µm of strain in the marginal fibers were reached to prevent primary tree failure [45].
2.6. Processing and Analysis of Stem Displacement Data
To assess the coupling between wind loading and the wind-induced response of B1 to B20, a method proposed in a previous study was used [32]. The application of the method includes attenuating all variations of M shorter than 5 s by a fourth-order Butterworth low-pass filter yielding MNOC and decomposing D into DOC and DNOC through the application of singular spectrum analysis (SSA) [46,47]. The D decomposition separates motion components responding to wind loading from components that dissipate elastic energy stored in the stem and roots, such as oscillatory sway in the fundamental mode [31].
Since the local correlation between instantaneous wind loading and tree response in the time domain is generally low [6,48,49], MNOC and DNOC were dynamically time-warped to synchronize their time series and maximize their correlation [50,51] as described in a previous study [32]. All further analyses were carried out with dynamically time-warped MNOC and DNOC. The oscillatory signal components were no longer considered.
2.7. Calculation of Effective Wind Load
Functional relationships between D and the wind load impact were approximated by the horizontal component of the pulling force (FP) at za using a modified approach proposed in a previous study [52]:
with RA being the pulling rope angle between za and the rope anchorage point at the ground.
To attenuate small, short-term, and insignificant fluctuations in the time series of D and FP during the pulling tests, D and FP were low-pass filtered using SSA. Since the crucial step in the SSA application is the choice of the embedding dimension, which indicates the maximum lag up to which the D and FP time series were shifted against themselves, embedding dimensions were tested from 10 to 150 measurement values. The embedding dimensions that yielded the highest correlation coefficient values (r > 0.9) between FP and D at zTRS,1 and zTRS,2 were 80 and 40 for D at zTRS,3 and zTRS,5, respectively. On average, the first SSA component, which represents the low-pass filtered signal component of D (DLP) and FP (FPLP), explained 97% of the variance in the FP signals and 83% (zTRS,1) to 96% (zTRS,4) in the D signals.
The high values for the explained variance indicate that the SSA efficiently separated the signal components that are important for the analysis from the unimportant signal components. The remaining residual variance can be attributed to higher frequency signal components that have no influence on the pulling test results.
It was assumed that during the pulling tests, quasi-static DNOC is represented by DLP because from previous studies, it is known that at the research site, the Scots pine trees’ total wind-induced reactions are dominated by sway in the fundamental mode. Vibrations in higher modes are negligible [29,30,32].
Linear regression forced through zero was used to parameterize the functional relationships between DLP and FPLP:
The variable s is the slope resulting from the pulling tests representing the change in force applied to za per meter of stem displacement, and has the same units as the spring constant (N/m). It is a measure of flexural tree stiffness.
The functional dependence of s on above-ground tree characteristics such as diameter at breast height (DBH, 1.3 m a.g.l.) and H and variables combined from them, was established with a power law. The power law provided better fits to the data than other simple regression models, especially at height zTRS,1:
here c is any above-ground tree characteristic, a1, a2, and a3 are coefficients. The strength of the functional relationships was assessed with the coefficient of determination (r2).
Using DLP and s, the effective pulling force applied at za (FZV) was calculated:
To approximate the applied force at za under natural wind conditions, s and DNOC were used to calculate the effective force (Feff).
The effective force is assumed to be the base level of wind loading associated with the airflow components effectively involved in the excitation of the Scots pine tree motion.
To establish a relationship between MNOC and Feff, the wind load parameter (WLP) was calculated for 10 min intervals using a linear regression forced through zero:
After the calculation of 10 min WLP values describing the effective tree-specific response to MNOC, the wind load coefficient (WLC) was determined as the offset of the second phase (i.e., using all values greater than detected change points) of a two-phase regression of WLP on 10 min mean values of MNOC (MNOC,mean). WLC enables the calculation of the instantaneous, effective wind load (WLeff):
2.8. Change Point Analysis
An earlier study showed that the Scot pine tree response to the airflow systematically changes with increasing wind load [32]. This change in the response behavior can be associated with tree-specific MNOC thresholds. We used a two-phase linear regression model for detecting these thresholds [53].
3. Results and Discussion
3.1. Non-Destructive Tree Pulling
With increasing DLP, FPLP calculated at height zTRS,2 = 1/7 H increased during static pulling tests. The FPLP maxima always occurred when 100 µm of strain was reached and the force application was aborted. After reaching the FPLP maximum, Fa was steadily reduced, and the trees returned to their rest position. For B1 to B5, which were equipped with multiple sensors, s was calculated at heights zTRS,1 to zTRS,5 (Figure 4a). The vertical s profiles along the stem available are of similar shape, the highest values occurring at zTRS,1, where stem diameters were always the biggest, resulting in the greatest flexural stiffness. From zTRS,1 to zTRS,2, the s values decrease by several orders of magnitude, which requires the results to be presented on a logarithmic scale. Due to the very small DLP values, s needs to be considerably larger to reach the same FPLP as at height za.
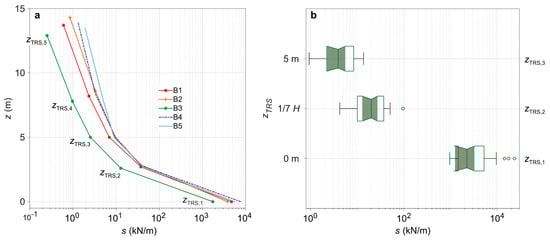
Figure 4.
(a) Vertical profiles of the slope (s) calculated by a linear regression (p < 0.001) between smoothed displacement (DLP) and horizontal component of the pulling force (FPLP) at TRS measurement heights zTRS,1 to zTRS,5 resulting from static pulling tests at sample trees B1 to B5. Due to the large s range, the x-axis is logarithmically scaled. (b) Boxplots of s at zTRS,1 to zTRS,3 resulting from static pulling tests at sample trees B1 to B35.
For B1 to B35, s is available at heights zTRS,1 to zTRS,3. Generally, s values are orders of magnitude higher at the stem base than at the other measuring heights due to very small DLP, ranging from 962 (B31) to 23606 (B23) kN/m at zTRS,1 and 0.9 (B26) to 13.6 (B22) kN/m at zTRS,3 (Figure 4b).
Regression analysis (α = 0.05) was performed to evaluate whether there is a functional relationship between s and the above-ground tree characteristics DBH [17,35,54], DBH3 [55], H [17,35,54], H/DBH [35], DBH/H2 [56,57], DBH2/H [58], and DBH2H [17,58,59,60,61] that have been reported in previous studies to influence tree response on static pulling and wind loading. Crown and stem mass, which also influence tree response to external loading [56,57,58], were not included in this analysis since they were unavailable.
Figure 5 shows power law curves resulting from regressing s to tree characteristics (p < 0.001). The strongest relationships, as measured by r2, were established between s and DBH, mean r2 = 0.86 from zTRS,1 to zTRS,3. With increasing DBH, s also increases. The increase is more linear at zTRS,2 = 1/7 H and zTRS,3 = 5 m than at the stem base. We argue that the stronger nonlinear dependence at the stem base is due to the cable attachment height za = 0.6 H which is higher than in other studies [35,58]. The greater cable attachment height causes stronger bending of the upper stem parts [39], which mimics the stem bending of the sample trees under natural wind conditions better than the bending with cable attachment heights below 0.5 H. Regressing s against DBH3 as conducted in a previous study [58], did not raise the explained variance of DBH in s.
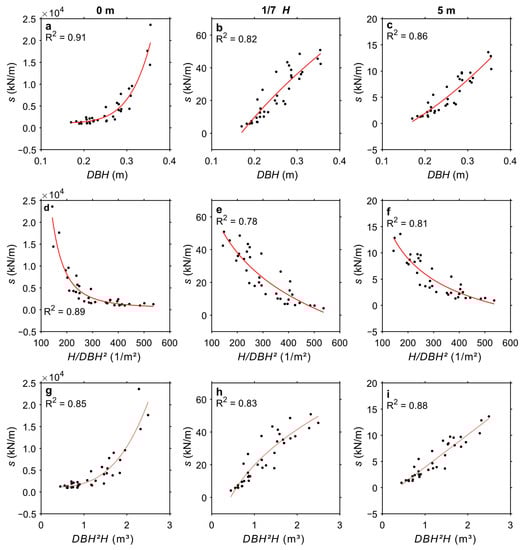
Figure 5.
Slope (s) as a function of DBH (1.3 m a.g.l.), H/DBH2, and DBH2H of the sample trees B1 to B35 at heights (a,d,g) zTRS,1 = 0.1 m, (b,e,h) zTRS,2 = 1/7 H, and (c,f,i) zTRS,3 = 5 m.
The functional dependencies of s on H/DBH2 (mean r2 = 0.83) and DBH2H (mean r2 = 0.85) are only slightly weaker. As H/DBH2 increases, s decreases. The decrease in s is most pronounced at zTRS,1, but curvilinear at all displayed heights. With increasing DBH2H, which is used to represent stem volume, s increases. The strength of the presented functional relationships is in the range of previous studies [54,58]. Other tree characteristics such as H, H/DBH, DBH2/H, DBH/H2, and TLS-measured CA available in different directions were tested, but their functional relationships were weaker (r2 ≤ 0.75) at all studied heights.
3.2. Tree Response under Natural Wind Conditions
Figure 6 shows 10 min mean values of DNOC (DNOC,mean) of B1 to B5 along the stem at the heights zTRS,5 to zTRS,1 plotted against MNOC,mean values. The DNOC,mean values decrease by several orders of magnitude towards the stem base. At the same measurement heights, DNOC,mean is mostly similar for B1 to B5. The greatest inter-tree differences occur at the stem base.
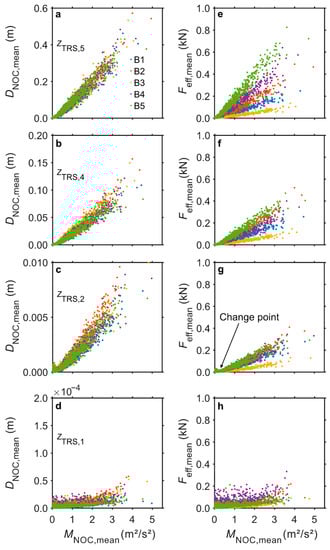
Figure 6.
Dependence of 10 min mean values of non-oscillatory stem displacement (DNOC,mean) on low-pass filtered momentum flux (MNOC,mean) at heights (a) zTRS,5 = 5/7 H, (b) zTRS,4 = 3/7 H, (c) zTRS,2 = 1/7 H, and (d) zTRS,1 = 0.1 m. Dependence of 10 min mean effective force (Feff,mean) on MNOC,mean at (e) zTRS,5, (f) zTRS,4, (g) zTRS,2, and (h) zTRS,1 along the stems of B1 to B5. The arrow in (g) highlights the point where the response of B1 to B5 to wind loading systematically changes.
If 10 min mean values of Feff (Feff,mean) are plotted against MNOC,mean, then large differences between the sample trees become apparent, although the tree-specific DNOC,mean patterns are similar. This demonstrates that B1 to B5 were subjected to different wind loads, the wind load acting on B5 being the greatest at zTRS,4 and zTRS,5. The wind load acting on B3 is always the smallest. The inter-tree differences in Feff,mean decrease from the crown space towards the stem base. There is a considerable spread of the data at the stem base resulting from the small DNOC,mean values used in the Feff,mean calculation.
In the near-origin area, where small DNOC,mean values dominate, there are change points in the relationship of Feff,mean and MNOC,mean. Below the change points, DNOC,mean was always close to zero, indicating minimal wind-induced stem displacement resulting from weak wind loading. Except for the nearest area around the coordinate origin, the dependence of Feff,mean on MNOC,mean is linear, as is demonstrated in detail for B2 (thickest tree with DBH = 28.6 cm) and B19 (thinnest tree with DBH = 19.3 cm) in Figure 7.
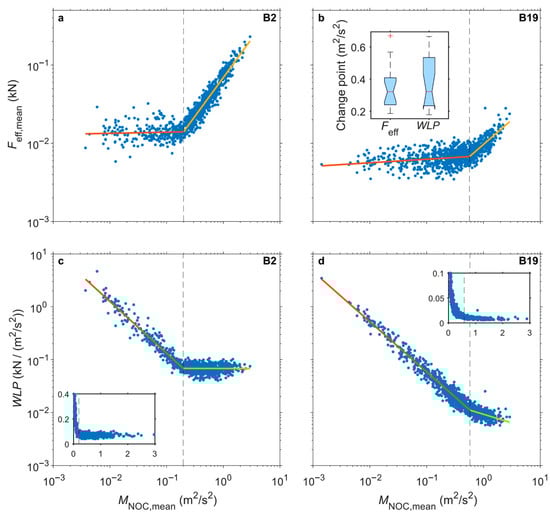
Figure 7.
(a,b) Dependence of 10 min mean effective force (Feff,mean) on 10 min mean low-pass filtered momentum flux (MNOC,mean) of trees B2 (thickest tree with DBH = 28.6 cm) and B19 (thinnest tree with DBH = 19.3 cm). (c,d) Dependence of the tree-specific wind load parameter (WLP) on MNOC,mean. The red and orange lines represent the two phases of a linear regression before and after a change point. The inset in (b) shows the distribution of WLP and Feff values of B1 to B20 as boxplots. The boxplot notches indicate the 95% confidence interval around the median. The insets in (c,d) show the relationships between WLP and MNOC,mean in a linearly scaled coordinate system.
The points associated with the changes in the tree-specific response as expressed by Feff,mean acting on B2 and B19 are at 0.20 (Figure 7a) and 0.60 m2/s2 (Figure 7b). After passing these points, the dependence of the tree response on MNOC,mean increases linearly.
The WLP values shown for B2 (Figure 7c) and B19 (Figure 7d) as a function of MNOC,mean also show a two-phase pattern with a change point. After passing these points, the WLP distributions level off and are parallel to the x-axis. The small insets highlight the WLP development as a function of MNOC,mean after the passage of the change points in a linearly scaled coordinate system.
The linear WLP dependence on MNOC,mean after crossing the change points, allows the estimation of the wind-induced tree response as a function of MNOC,mean. The WLP vs. MNOC,mean change point values are very similar (r2 = 0.89) to the Feff,mean vs. MNOC,mean change point value distribution, as is illustrated by boxplots for B1 to B20 in the inset in Figure 7b. The WLP-related change points range from MNOC,mean = 0.18 m2/s2 (B5) to MNOC,mean = 0.67 m2/s2 (B13), with the median WLP-related change point value being 0.32 m2/s2. The medians of the Feff- and WLP-related change points show no significant difference at the 95% confidence level as indicated by the boxplot notches.
Once the tree-specific WLC values have been identified, they can be used for calculating the instantaneous, tree-specific effective wind load (WLeff) knowing MNOC.
Figure 8a shows a short time series of 3000 WLeff and Feff 10 Hz values (300 s) as an example. The time series length is limited to highlight their similar behavior from small to some of the largest values that occurred during the study period. Calculated WLeff is strongly correlated with measured Feff (r2 = 0.99). Over the entire study period, r2 calculated from 2,263,673 WLeff and Feff values each per tree ranges between 0.45 (B6) and 0.94 (B5). The r2 median is 0.89 (B11).
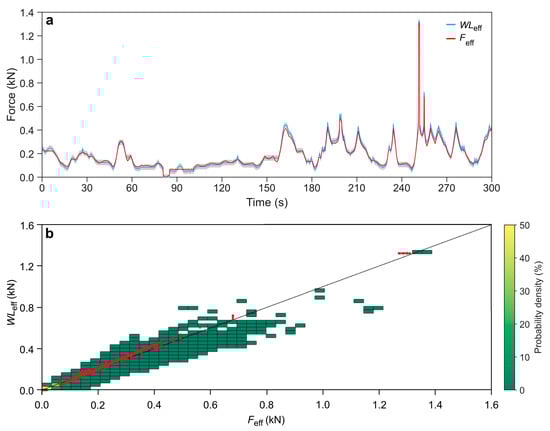
Figure 8.
(a) Time series (300 s) of instantaneous WLeff and Feff of sample tree B4. The grey region shows the standard deviation of the residuals from WLP values of the second phase (i.e., for all values greater than detected change points) of the two-phase linear regression model. (b) WLeff plotted against Feff (red dots) and bivariate histogram bins (green tiles) that represent the total wind-induced response of B4 in the study period. 84% of the displayed values are smaller than WLeff < 0.1 kN (yellow and light green bins), indicating the dominance of episodes with low wind loading in the study period.
The relationship of the 3000 WLeff and Feff values is shown for B4 as red points in Figure 8b. The red points are plotted together with a binned (40 × 40 bins) scatter plot including the 2,263,673 WLeff and Feff values, exceeding the tree-specific MNOC thresholds. The data from the interval shown in Figure 8a are in the range of the histogram bins that represent the total wind-induced response of B4 in the study period. The majority of all analyzed WLeff and Feff values (84%) are in the range smaller than WLeff < 0.1 kN indicating the dominance of episodes with low wind loading.
The response of B1 to B20 to WLeff in the study period is shown as bivariate histograms in Figure 9. The histogram bins of all trees group around the 1:1 line indicating a good approximation of Feff. This figure shows the differences in tree-specific WLeff. Lowest WLeff acted on B10 and B19, the smallest of the presented trees. The largest effective wind load acted on B2, which is the tallest tree. Common to all trees is that high WLeff values are rare. The highest share of WLeff values of 90.4% can always be found close to the origin of the coordinate system for WLeff < 0.1 kN. Due to measurement device failure, there are no data for B7 and B15.
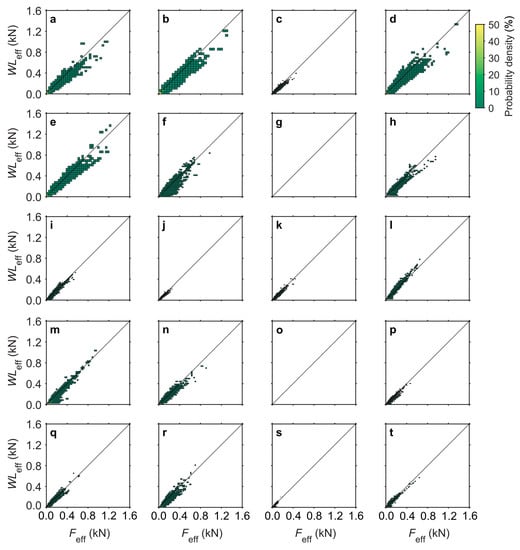
Figure 9.
(a–t) Bivariate histograms of instantaneous WLeff and Feff of B1 to B20 in the study period. Due to measurement device failure there is no data for B7 and B15.
4. Conclusions
This study demonstrates that for the investigated Scots pine trees, whose wind-induced sway behavior is dominated by first-order mode vibration, the effective wind load acting on them can be quantified using non-destructive pulling tests. It is assumed that the pulling test execution resembles the quasi-static stem displacement through the combination of organized turbulence and mean wind loading. Under dominant first-order mode vibration, wind loads acting on the Scots pines’ crown periphery are transferred through the needles and branches to the stem without much damping.
Based on the presented results, we propose that for trees whose stem sway behavior is dominated by first-order mode vibration, the method helps to bridge the gap between pure stem motion analysis and the assessment of acting wind loads at the individual tree level. Due to the strong correlation between the easily measurable tree characteristics DBH and DBH2H, the effective wind load can be estimated tree-specifically and used to determine the instantaneous effective wind load via the wind load coefficient WLC. The use of WLC will simplify future investigations into the Scots pine trees’ wind-induced motion behavior.
So far, the described approach cannot be applied to trees whose stem sway behavior is not dominated by first-order mode vibration. For example, in trees with large crowns, a substantial part of the kinetic energy transferred to them from the airflow is already dissipated by the foliage and branch motion. Foliage and branch motion then cause higher-order mode vibration in the stem, which static pulling tests cannot simulate. This relationship affects the execution and interpretation of results obtained from static pulling tests related to wind load estimation. Motion and bending moments measured at the stem, especially at the stem base, might not always be a good indicator for wind loading.
More investigations into the combination of pulling tests and effective wind loads could reinforce the importance of pulling tests for tree-specific wind load estimation. It can also provide an approach for reanalyzing the results of thousands of pulling tests conducted in Germany and elsewhere over the past decades. To further improve the understanding of loads acting on trees during pulling tests and under natural wind conditions, we propose to monitor root motion in addition to above-ground tree motion in future studies.
Author Contributions
Conceptualization, S.K., D.S.; methodology, S.K., D.S.; software, S.K., D.S.; validation, S.K., D.S.; formal analysis, S.K., D.S.; investigation, S.K., D.S., J.F., T.S., F.R.; resources, D.S.; data curation, S.K., D.S.; writing—original draft preparation, S.K.; writing—S.K., F.R., B.G., A.D., D.S.; visualization, S.K., D.S.; supervision, D.S.; project administration, S.K., D.S.; funding acquisition, D.S. All authors have read and agreed to the published version of the manuscript.
Funding
This research was funded by the German Research Foundation, grant SCHI 868/6-1.
Institutional Review Board Statement
Not applicable.
Informed Consent Statement
Not applicable.
Data Availability Statement
Data available on request.
Acknowledgments
We thank Julius Nickl, Mattis Pfenning, and Jonas Wehrle for their excellent support during field work. Thanks go to Steffen Rust (HAWK) and the Tree Statics Expert Association (SAG) for providing additional equipment to conduct the tree pulling tests.
Conflicts of Interest
The authors declare no conflict of interest.
Nomenclature
| Acronyms | Description |
| α | significance level |
| c | above-ground tree characteristic |
| CA | crown area (m2) |
| D | stem displacement (m) |
| DNOC | non-oscillatory component of stem displacement (m) |
| DNOC,mean | 10 min mean value of DNOC |
| DOC | oscillatory component of stem displacement (m) |
| DLP | spline-smoothed stem displacement during tree pulling tests (m) |
| DBH | diameter at breast height (cm) |
| Fa | force applied along the rope into the pulling direction (N) |
| Feff | effective force (N) |
| Feff,mean | 10 min mean value of Feff |
| FP | horizontal component of the pulling force at pulling rope attachment height during tree pulling tests (N) |
| FPLP | Low-pass filtered (SSA) bending moment (N) |
| FZV | effective load during pulling test (N) |
| H | tree height (m) |
| M | above-canopy momentum flux density (m²/s²) |
| MNOC | low-pass filtered component of above-canopy momentum flux (m²/s²) |
| MNOC,mean | 10 min mean value of MNOC |
| p | p-value of the applied regression analyses |
| r | correlation coefficient |
| r2 | coefficient of determination |
| RA | pulling rope angle between za and anchorage point at the ground (°) |
| s | slope of the regression line determined between DLP and FPLP during tree pulling (N/m) |
| tx | stem tilt in x direction (east-west) (°) |
| ty | stem tilt in y direction (north-south) (°) |
| u | horizontal wind vector component in east-west direction (m/s) |
| v | horizontal wind vector component in north-south direction (m/s) |
| w | vertical wind vector component (m/s) |
| WLeff | effective wind load (N) |
| WLC | wind load coefficient (kN/(m2/s2)) |
| WLP | wind load parameter (kN/(m2/s2)) |
| za | attachment height of the pulling rope (m) |
| zPTQ | measurement height above ground of TreeQinetic sensors (m) |
| zTRS | measurement height above ground of the Tree Response Sensor (m) |
| Abbreviations | Description |
| PTQ | Picus TreeQinect |
| S | ultrasonic anemometer |
| SSA | singular spectrum analysis |
| B | sample tree |
| TLS | terrestrial laser scanning |
| TRS | tree response sensor |
| TreeMMoSys | tree motion monitoring system |
References
- Schindler, D.; Bauhus, J.; Mayer, H. Wind effects on trees. Eur. J. For. Res. 2012, 131, 159–163. [Google Scholar] [CrossRef] [Green Version]
- Bonnesoeur, V.; Constant, T.; Moulia, B.; Fournier, M. Forest trees filter chronic wind-signals to acclimate to high winds. New Phytol. 2016, 210, 850–860. [Google Scholar] [CrossRef] [PubMed] [Green Version]
- Gardiner, B. Wind damage to forests and trees: A review with an emphasis on planted and managed forests. J. For. Res. 2021, 26, 248–266. [Google Scholar] [CrossRef]
- Jackson, T.D.; Sethi, S.; Dellwik, E.; Angelou, N.; Bunce, A.; van Emmerik, T.; Duperat, M.; Ruel, J.-C.; Wellpott, A.; Van Bloem, S.; et al. The motion of trees in the wind: A data synthesis. Biogeosciences 2021, 18, 4049–4072. [Google Scholar] [CrossRef]
- Mayer, H. Wind-induced tree sways. Trees 1987, 1, 195–206. [Google Scholar] [CrossRef]
- Gardiner, B.A. The interactions of wind and tree movement in forest canopies. In Wind and Trees; Coutts, M.P., Grace, J., Eds.; Cambridge University Press: Cambridge, UK, 1995; pp. 41–59. [Google Scholar] [CrossRef]
- Gardiner, B.; Berry, P.; Moulia, B. Review: Wind impacts on plant growth, mechanics and damage. Plant. Sci. 2016, 245, 94–118. [Google Scholar] [CrossRef]
- De Langre, E. Plant vibrations at all scales: A review. J. Exp. Bot. 2019, 70, 3521–3531. [Google Scholar] [CrossRef]
- Gardiner, B.; Byrne, K.; Hale, S.; Kamimura, K.; Mitchell, S.J.; Peltola, H.; Ruel, J.-C. A review of mechanistic model-ling of wind damage risk to forests. Forestry 2008, 81, 447–463. [Google Scholar] [CrossRef] [Green Version]
- Jackson, T.; Shenkin, A.; Wellpott, A.; Calders, K.; Origo, N.; Disney, M.; Burt, A.; Raumonen, P.; Gardiner, B.; Herold, M.; et al. Finite element analysis of trees in the wind based on terrestrial laser scanning data. Agric. For. Meteorol. 2019, 265, 137–144. [Google Scholar] [CrossRef]
- Usbeck, T.; Wohlgemuth, T.; Dobbertin, M.; Pfister, C.; Bürgi, A.; Rebetez, M. Increasing storm damage to forests in Switzerland from 1858 to 2007. Agric. For. Meteorol. 2010, 150, 47–55. [Google Scholar] [CrossRef]
- Valta, H.; Lehtonen, I.; Laurila, T.K.; Venäläinen, A.; Laapas, M.; Gregow, H. Communicating the amount of windstorm induced forest damage by the maximum wind gust speed in Finland. Adv. Sci. Res. 2019, 16, 31–37. [Google Scholar] [CrossRef] [Green Version]
- Albrecht, A.; Jung, C.; Schindler, D. Improving empirical storm damage models by coupling with high-resolution gust speed data. Agric. For. Meteorol. 2019, 268, 23–31. [Google Scholar] [CrossRef]
- Schindler, D.; Jung, C.; Buchholz, A. Using highly resolved maximum gust speed as predictor for forest storm damage caused by the high-impact winter storm Lothar in Southwest Germany. Atmos. Sci. Lett. 2016, 17, 462–469. [Google Scholar] [CrossRef] [Green Version]
- Ancelin, P.; Courbaud, B.; Fourcaud, T. Development of an individual tree-based mechanical model to predict wind damage within forest stands. For. Ecol. Manag. 2004, 203, 101–121. [Google Scholar] [CrossRef]
- Dupont, S.; Ikonen, V.-P.; Väisänen, H.; Peltola, H. Predicting tree damage in fragmented landscapes using a wind risk model coupled with an airflow model. Can. J. For. Res. 2015, 45, 1065–1076. [Google Scholar] [CrossRef]
- Gardiner, B.; Peltola, H.; Kellomäki, S. Comparison of two models for predicting the critical winds required to damage coniferous trees. Ecol. Model. 2000, 129, 1–23. [Google Scholar] [CrossRef]
- Peltola, H.; Kellomäki, S.; Vaisanen, H.; Ikonen, V.-P. A mechanistic model for assessing the risk of wind and snow damage to single trees and stands of Scots pine, Norway spruce, and birch. Can. J. For. Res. 1999, 29, 647–661. [Google Scholar] [CrossRef]
- Quine, C.P.; Gardiner, B.A.; Moore, J. Wind disturbance in forests: The process of wind created gaps, tree overturning, and stem breakage. In Plant Disturbance Ecology—The Process and the Response; Johnson, E.A., Miyanishi, K., Eds.; Elsevier: Amsterdam, The Netherlands, 2020; pp. 117–184. [Google Scholar] [CrossRef]
- Seidl, R.; Schelhaas, M.J.; Lexer, M.J. Unraveling the drivers of intensifying forest disturbance regimes in Europe. Glob. Chang. Biol. 2011, 17, 2842–2852. [Google Scholar] [CrossRef]
- Schelhaas, M.-J.; Nabuurs, G.-J.; Schuck, A. Natural disturbances in the European forests in the 19th and 20th centuries. Glob. Chang. Biol. 2003, 9, 1620–1633. [Google Scholar] [CrossRef]
- Ulanova, N.G. The effects of windthrow on forests at different spatial scales: A review. For. Ecol. Manag. 2000, 135, 155–167. [Google Scholar] [CrossRef]
- Lindroth, A.; Lagergren, F.; Grelle, A.; Klemendtsson, L.; Langvall, O.; Weslien, P.; Tuulik, J. Storms can cause Europe-wide reduction in forest carbon sink. Glob. Chang. Biol. 2009, 15, 346–355. [Google Scholar] [CrossRef]
- Magnabosco Marra, D.; Trumbore, S.E.; Higuchi, N.; Ribeiro, G.H.P.M.; Negrón-Juárez, R.I.; Holzwarth, F.; Rifai, S.W.; dos Santos, J.; Lima, A.J.N.; Kinupp, V.F.; et al. Windthrows control biomass patterns and functional composition of Amazon forests. Glob. Chang. Biol. 2018, 24, 5867–5881. [Google Scholar] [CrossRef] [PubMed] [Green Version]
- Reyer, C.P.O.; Bathgate, S.; Blennow, K.; Borges, J.G.; Bugmann, H.; Delzon, S.; Faias, S.P.; Garcia-Gonzalo, J.; Gardiner, B.; Gonzalez-Olabarria, J.R.; et al. Are forest disturbances amplifying or canceling out climate change-induced productivity changes in European forests? Environ. Res. Lett. 2017, 12, 034027. [Google Scholar] [CrossRef] [PubMed]
- Dahle, A.G.; James, K.R.; Kane, B.; Grabosky, J.C.; Detter, A. A review of factors that affect the static load-bearing capacity of urban trees. Arboricul. Urban For. 2017, 43, 89–106. [Google Scholar] [CrossRef]
- Abetz, P.; Künstle, E. Zur Druckholzbildung bei Fichte. Allg. Forst Und Jagdztg. 1982, 153, 117–127. [Google Scholar]
- Duncker, P.; Spiecker, H. Compression wood formation and pith eccentricity in Picea abies L. depending on selected site-related factors: Detection of compression wood by its spectral properties in reflected light. In Proceedings of the TRACE—Tree Rings in Archaeology, Climatology and Ecology, Bormernsdorf, Switzerland, 22–24 April 2004; pp. 150–158. [Google Scholar]
- Schindler, D.; Vogt, R.; Fugmann, H.; Rodriguez, M.; Schönborn, J.; Mayer, H. Vibration behavior of plantation-grown Scots pine trees in response to wind excitation. Agric. For. Meteorol. 2010, 150, 984–993. [Google Scholar] [CrossRef]
- Schindler, D.; Mohr, M. Non-oscillatory response to wind loading dominates movement of Scots pine trees. Agric. For. Meteorol. 2018, 250, 209–216. [Google Scholar] [CrossRef]
- Schindler, D.; Mohr, M. No resonant response of Scots pine trees to wind excitation. Agric. For. Meteorol. 2019, 265, 227–244. [Google Scholar] [CrossRef]
- Schindler, D.; Kolbe, S. Assessment of the response of a Scots pine tree to effective wind loading. Forests 2020, 11, 145. [Google Scholar] [CrossRef] [Green Version]
- Angelou, N.; Dellwik, E.; Mann, J. Wind load estimation on an open-grown European oak tree. Forestry 2019, 92, 381–392. [Google Scholar] [CrossRef]
- Kane, B.; Clouston, P. Tree pulling tests of large shade trees in the genus Acer. Arboricul. Urban For. 2008, 34, 101–109. [Google Scholar] [CrossRef]
- Moore, J. Differences in maximum resistive bending moments of Pinus radiata trees grown on a range of soil types. For. Ecol. Manag. 2000, 135, 63–71. [Google Scholar] [CrossRef]
- Nicoll, B.C.; Gardiner, B.A.; Rayner, B.; Peace, A.J. Anchorage of coniferous trees in relation to species, soil type, and rooting depth. Can. J. For. Res. 2006, 36, 1871–1883. [Google Scholar] [CrossRef]
- Rahardjo, H.; Harnas, F.R.; Indrawan, I.G.B.; Leong, E.C.; Tan, P.Y.; Fong, Y.K.; Ow, L.F. Understanding the stability of Samanea saman trees through tree pulling, analytical calculations and numerical models. Urban For. Urban Green. 2014, 13, 355–364. [Google Scholar] [CrossRef]
- Duperat, M.; Gardiner, B.; Ruel, J.-C. Testing an individual tree wind damage risk model in a naturally regenerated balsam fir stand: Potential impact of thinning on the level of risk. Forestry 2021, 94, 141–150. [Google Scholar] [CrossRef]
- Peltola, H. Mechanical stability of trees under static loads. Am. J. Bot. 2006, 93, 1501–1511. [Google Scholar] [CrossRef]
- Kolbe, S.; Schindler, D. TreeMMoSys: A low cost sensor network to measure wind-induced tree response. HardwareX 2021, 9, e00180. [Google Scholar] [CrossRef]
- EM (Environmental Meteorology, University of Freiburg, Germany). Hartheim Forest Research Site. Available online: https://www.meteo.uni-freiburg.de/en/infrastructure/hartheim-forest-research-site (accessed on 31 December 2021).
- CloudCompare (version 2.12) (GPL software). 3D Point Cloud and Mesh Processing Software Open Source Project. Available online: http://www.cloudcompare.org/ (accessed on 31 December 2021).
- Stull, R.B. An Introduction to Boundary Layer Meteorology; Springer: Dordrecht, The Netherlands, 2009. [Google Scholar] [CrossRef]
- Detter, A.; Rust, C.; Maybaum, G. Determining strength limits for standing tree stems from bending tests. In Proceedings of the 18th International Nondestructive Testing and Evaluation of Wood Symposium, Madison, WI, USA, 24–27 September 2013; US Department of Agriculture, Forest Service, Forest Products Laboratory: Madison, WI, USA. Available online: https://www.tree-consult.org/upload/mediapool/pdf/baumstatik_und_biomechanik/detter_etal-ndt-proceedings-2014.pdf (accessed on 13 June 2022).
- Detter, A.; Rust, S. Findings of recent research on the pulling test method. In Jahrbuch der Baumpflege; Dujesiefken, D., Ed.; Haymarket Media GmbH Buch- und Zeitschriftenverlage: Braunschweig, Germany, 2013; pp. 87–100. [Google Scholar]
- Broomhead, D.; King, G. Extracting qualitative dynamics from experimental data. Phys. D 1986, 20, 217–236. [Google Scholar] [CrossRef]
- Vautard, R.; Ghil, M. Singular spectrum analysis in nonlinear dynamics with applications to paleoclimatic time series. Phys. D 1989, 35, 395–424. [Google Scholar] [CrossRef]
- Sellier, D.; Brunet, Y.; Fourcaud, T. A numerical model of tree aerodynamic response to a turbulent airflow. Forestry 2008, 81, 279–297. [Google Scholar] [CrossRef] [Green Version]
- Schindler, D.; Schönborn, J.; Fugmann, H.; Mayer, H. Responses of an individual deciduous broadleaved tree to wind excitation. Agric. For. Meteorol. 2013, 177, 69–82. [Google Scholar] [CrossRef]
- Sakoe, H.; Chiba, S. Dynamic programming algorithm optimization for spoken word recognition. IEEE Trans. Acoust. Speech 1978, 26, 43–48. [Google Scholar] [CrossRef] [Green Version]
- Paliwal, K.K.; Agarwal, A.; Sinha, S.S. A modification over Sakoe and Chiba’s dynamic time warping algorithm for isolated word recognition. Signal. Process. 1982, 4, 329–333. [Google Scholar] [CrossRef]
- Krišāns, O.; Čakša, L.; Matisons, R.; Rust, S.; Elferts, D.; Seipulis, A.; Jansons, Ā. A Static Pulling Test Is a Suitable Method for Comparison of the Loading Resistance of Silver Birch (Betula pendula Roth.) between Urban and Peri-Urban Forests. Forests 2022, 13, 127. [Google Scholar] [CrossRef]
- Atanasov, D. Two-Phase Linear Regression Model. Available online: https://www.mathworks.com/matlabcentral/fileexchange/26804-two-phase-linear-regression-model MATLAB Central File Exchange (accessed on 10 March 2022).
- Papesch, A.J.G.; Moore, J.R.; Hawke, A.E. Mechanical stability of Pinus Radiata trees at Eyrewell Forest investigated using static tests. N. Z. J. For. Sci. 1997, 27, 188–204. [Google Scholar]
- Peltola, H.; Nykänen, M.-L.; Kellomäki, S. Model computations on the critical combination of snow loading and windspeed for snow damage of scots pine, Norway spruce and Birch sp. at stand edge. For. Ecol. Manag. 1997, 95, 229–241. [Google Scholar] [CrossRef]
- Moore, J.R.; Maguire, D.A. Natural sway frequencies and damping ratios of trees: Concepts, review and synthesis of previous studies. Trees 2004, 18, 195–203. [Google Scholar] [CrossRef]
- Moore, J.R.; Maguire, D.A. Natural sway frequencies and damping ratios of trees: Influence of crown structure. Trees 2005, 19, 363–373. [Google Scholar] [CrossRef]
- Fredericksen, T.S.; Hedden, R.L.; Williams, S.A. Testing loblolly pine wind firmness with simulated wind stress. Can. J. For. Res. 1993, 23, 1760–1765. [Google Scholar] [CrossRef]
- Hale, S.E.; Gardiner, B.A.; Wellpott, A.; Nicoll, B.C.; Achim, A. Wind loading of trees: Influence of tree size and competition. Eur. J. Forest. Res. 2012, 131, 203–217. [Google Scholar] [CrossRef]
- Hale, S.E.; Gardiner, B.A.; Peace, A.; Nicoll, B.; Taylor, P.; Pizzirani, S. Comparison and validation of three versions of a forest wind risk model. Environ. Model. Softw. 2015, 68, 27–41. [Google Scholar] [CrossRef] [Green Version]
- Peltola, H.; Kellomäki, S.; Hassinen, A.; Granander, M. Mechanical stability of Scots pine, Norway spruce and birch: An analysis of tree-pulling experiments in Finland. For. Ecol. Manag. 2000, 135, 143–153. [Google Scholar] [CrossRef]
Publisher’s Note: MDPI stays neutral with regard to jurisdictional claims in published maps and institutional affiliations. |
© 2022 by the authors. Licensee MDPI, Basel, Switzerland. This article is an open access article distributed under the terms and conditions of the Creative Commons Attribution (CC BY) license (https://creativecommons.org/licenses/by/4.0/).