Article

Validation of the Habitat Quality Index of Tetraclinis articulata Forests and Its Application in Cost-Effectiveness Analysis of Restoration Projects

by
Juan Miguel Moya-Pérez
1,*,
Miguel Ángel Esteve-Selma
1,
Adrián Ruiz Rocamora
2 and
Antonio Félix Carrillo
2
1
Department of Ecology and Hidrology, Faculty of Biology, University of Murcia, 30100 Murcia, Spain
2
Latizal S.L., C/Canteras, nº 5, esc. 3ª, 1º C, 30100 Murcia, Spain
*
Author to whom correspondence should be addressed.
Forests 2022, 13(6), 950; https://doi.org/10.3390/f13060950
Submission received: 15 May 2022 / Revised: 13 June 2022 / Accepted: 15 June 2022 / Published: 17 June 2022

Abstract

:
The latest reports from the European Commission warn of the need to improve the conservation status of its forest habitats. Native populations of priority habitat 9570 (Tetraclinis articulata forests) in continental Europe are located in the southeast of the Iberian Peninsula. The LIFE-TETRACLINIS-EUROPE project aimed to improve habitat conservation conditions. As part of the results of this project, a habitat quality index was proposed with the intention of evaluating both its conservation conditions and its evolution after the implemented action measures. The variables used in this index were selected with the aim of achieving high representativeness of the quality of the habitat while at the same time being easily integrated into monitoring programs. In this paper, we intend to verify the suitability of the variables chosen for this index, its sensitivity to discriminate different conservation levels, and its possible inclusion in forest management programs through a cost-effectiveness analysis.

1. Introduction

Article 17 of the EEC Habitat Directive requires monitoring the conservation status of those habitats included in the Natura 2000 Network every six years [1,2]. Despite the efforts of monitoring proposals by numerous authors [3,4,5,6], the absence of common EU minimum standards for monitoring habitats is problematic when assessing their conservation status [7,8,9]. In Spain, the first great effort to establish the ecological basis for evaluating habitats’ conservation status was performed in 2009 [10]. This pioneering work included a review of the parameters that defined the conservation status of 117 habitats of Community Interest. In turn, an evaluation of the level of conservation by biogeographic region was advanced and it contained basic recommendations for the management of these habitats. Over 2015–2017, the project “Establishment of a state system for monitoring the Conservation Status of Habitat Types in Spain” was conducted to respond to the obligations of the Habitat Directive. As part of this project, guidelines for the assessment of forest habitats were developed based on information collected in the National Forest Inventory [11]. However, not all forest habitats present in Spain are sufficiently represented in the inventory plots, so additional information is required to establish their conservation status [12]. The latest report for 2013–2018 reveals that almost 20% of European protected forest habitats need measures to improve their conservation status [13].
The main distribution areas of the semiarid Mediterranean forest species Tetraclinis articulata (Vahl) Masters are located in Maghreb [14], where its timber is extremely valued for carpentry, handcraft, and construction [15,16]. Due to their history of intense human exploitation (harvesting of wood, grazing, fires), these forests are subject to a process of regression [17]. However, several authors have observed a high capacity for natural regeneration of the species once degradative pressures such as fires and overgrazing have ceased [18,19,20]. Similar behavior has been described when ecological competition relations against Pinus halepensis Miller decrease in areas where both species are present [21]. Population dynamics of the latter species in these zones appears to be in decline due to climate change [22,23]. The ability of T. articulata to survive and thrive even in abandoned mining soils has recently been highlighted [24,25,26]. Most of the area occupied in the EU by the priority habitat 9570 “Tetraclinis articulata forests” is found in the southeast of the Iberian Peninsula. The populations located in the coastal mountains of Cartagena-La Unión account for 98% of the European habitat of this species (remaining populations are located in Malta and Melilla). The European Commission and the European Environment Information and Observation Network (Eionet) consider the habitat conservation status as “Unfavorable–Inadequate” [27,28]. Before the last decade of the 20th century, species of the 9570 habitat were rarely included in restoration and reforestation projects [29]. Semiarid environments are where the failure of many conventional reforestations has been most evident [24] and where more precedents have been generated for the restoration of several habitats. In the Iberian Peninsula, the restoration works that have been executed with this species are mainly focused on its use for reforestation of zones beyond its current distribution range [30,31], and other actions of lower economic costs related to habitat improvement are not usually considered. The LIFE13 NAT/ES/00436 project “Conservation of the priority habitat 9570 Tetraclinis articulata forest in the European continent” [32] proposed a number of measures intended to improve the habitat quality of the European continental population of this species over 2014–2019. For this purpose, specific actions were implemented in order to improve those areas subject to different degradative impacts: burned areas, ecological competition situations, habitat degradation due to mine tailings’ accumulations, scarce presence of the target species, compacted soil due to unauthorized activities, overgrazed areas, and presence of invasive species.
As an outcome of the LIFE-Tetraclinis project, a management guide [29] was published which suggests a habitat quality index. This index integrates the main factors previously considered for the evaluation of the conservation status of T. articulata habitat in European semiarid environments [12,33]: habitat structural elements (habitat species richness), demographic dynamics of the target species (total number of specimens, recruitment dynamics, and recruitment facilitating factors), and system disturbance dynamics (fires, overgrazing, invasive species, and altered or compacted soils). The objectives of this study are: (i) to test the suitability of the main index variables proposed in the habitat management guide, (ii) to test the index sensitivity to discriminate different habitat conservation statuses, and (iii) to develop a cost-effectiveness model based on habitat quality to facilitate management decisions.

2. Materials and Methods

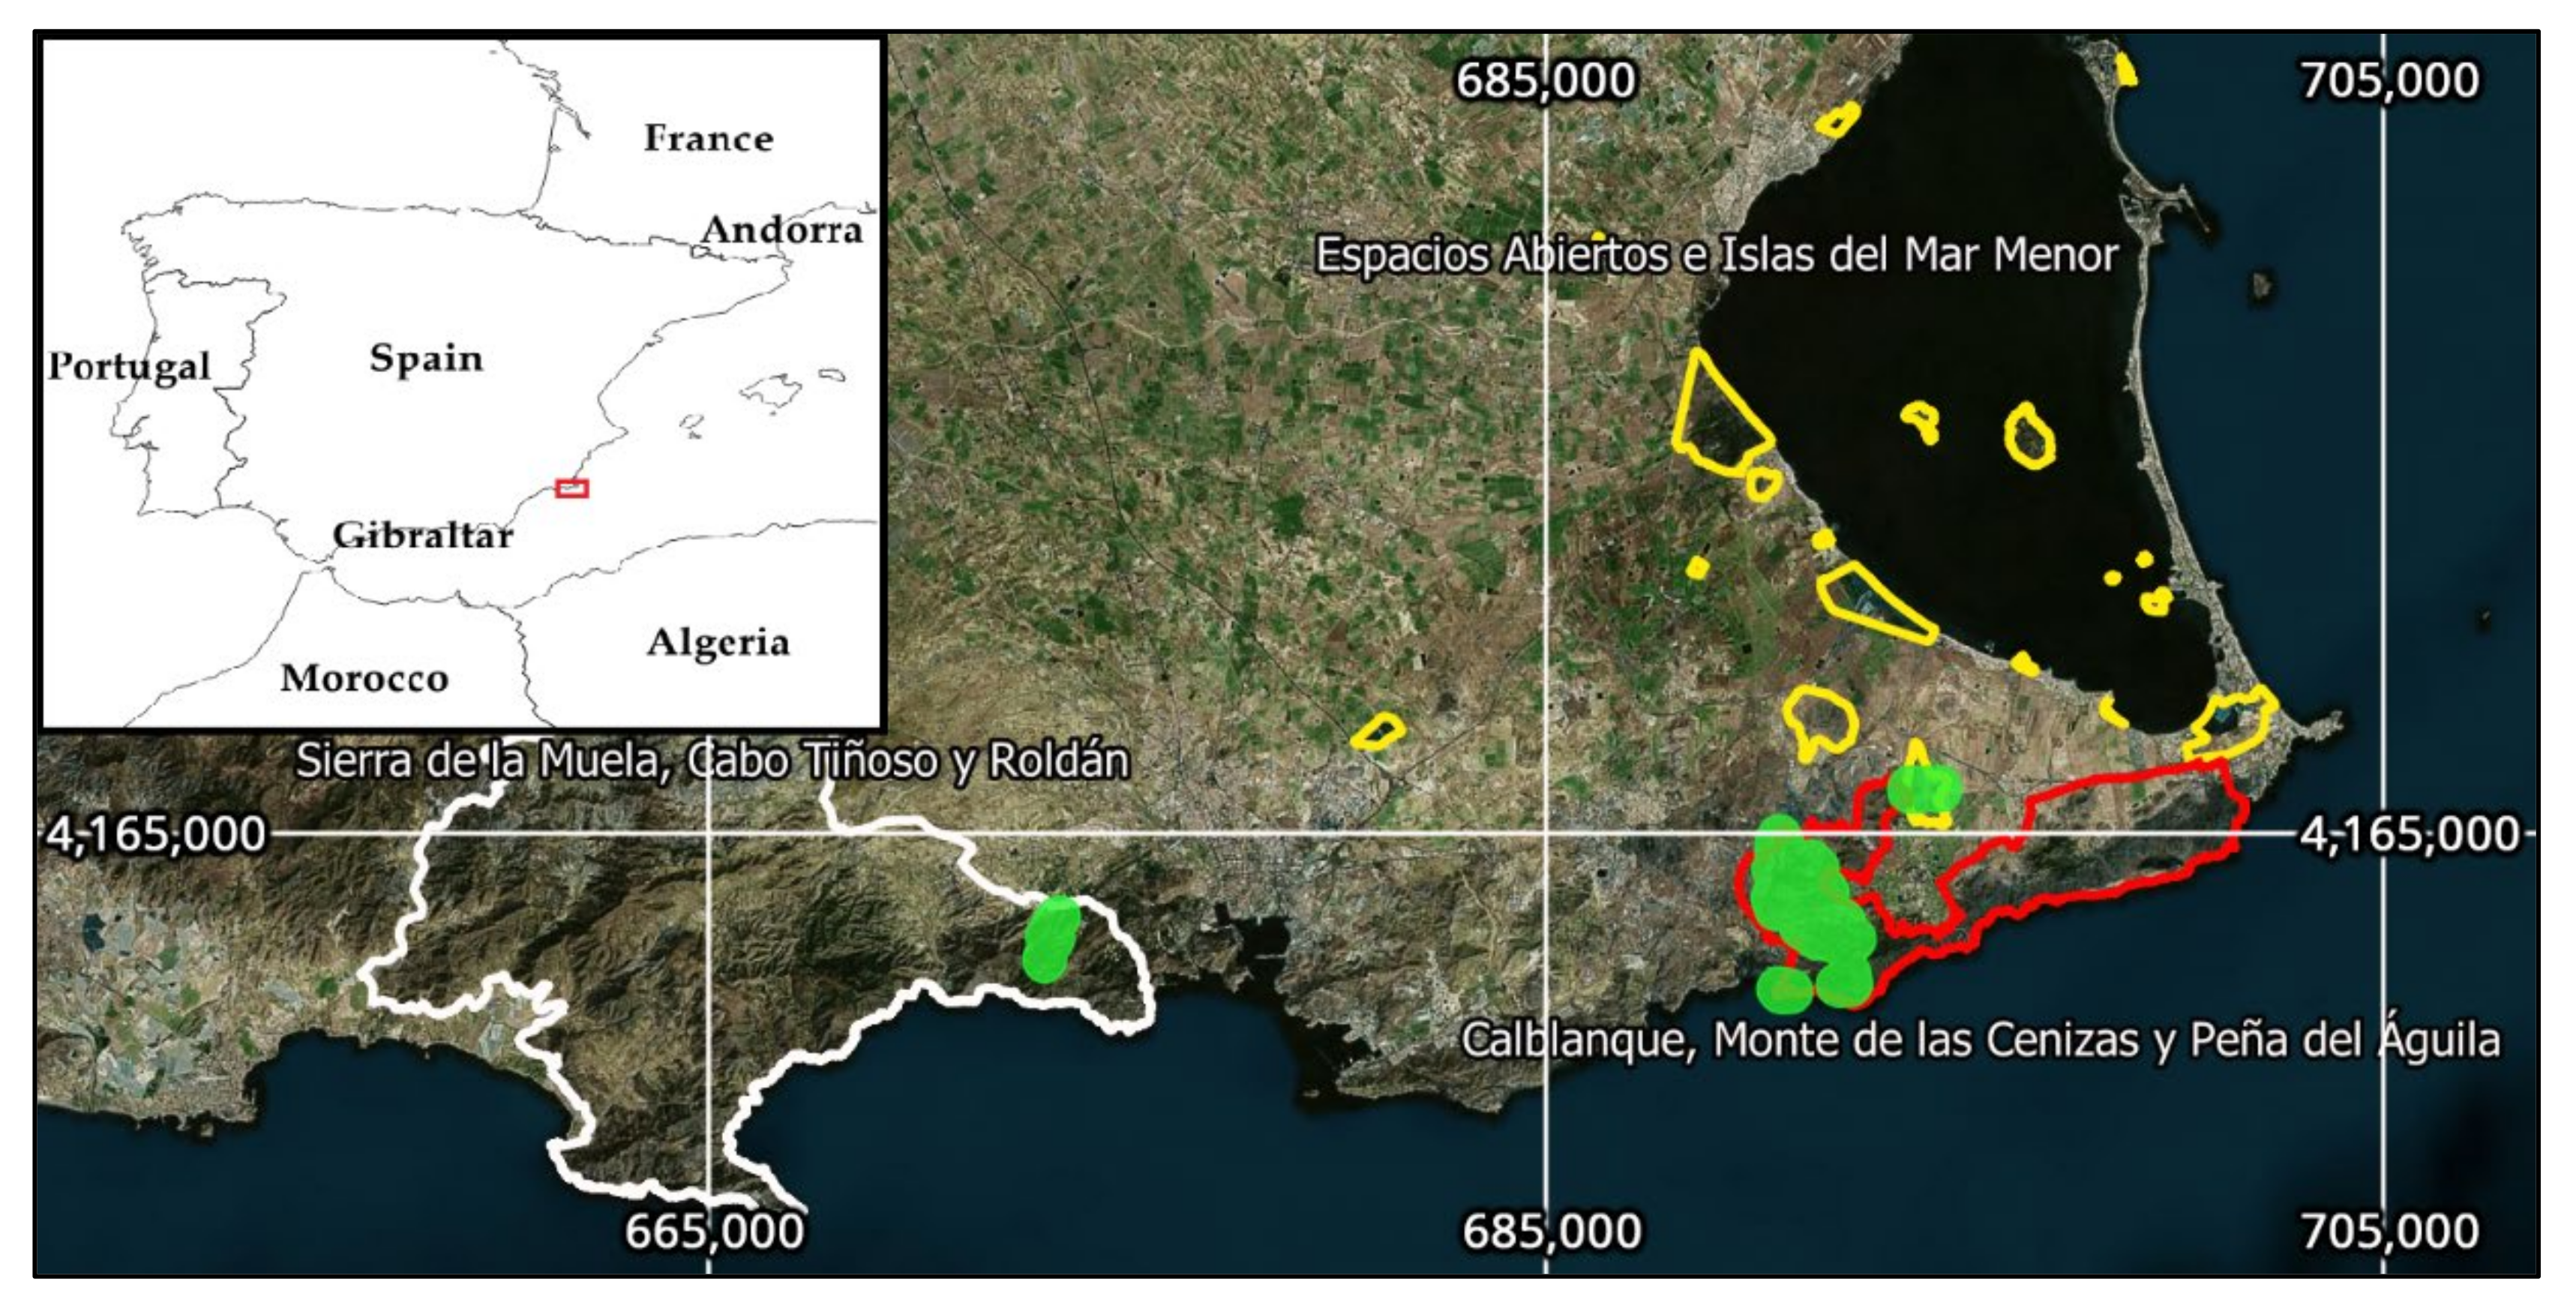
2.1. Experimental Design

In 2016, 132 survey plots (Table 1) were established in 3 protected areas (Figure 1) of the LIFE project: Calblanque, Monte de las Cenizas y Peña del Águila Regional Park (code SCI ES6200001), Espacios Abiertos e Islas del Mar Menor (code SAC ES6200006), and Sierra de La Muela, Cabo Tiñoso y Roldán Protected Area (codes SPA ES0000264 and SCI ES6200024). In the second area, a fence was installed to prevent overgrazing. In the third, only actions to close unauthorized trails and eliminate invasive species were performed. The survey plots were classified according to the main factor of habitat degradation caused by diverse forms of human interventions. The design of the plots was adapted to the type of action implemented.

2.2. Data Collection

We collected the survey plots’ data over the period 2016–2019. These data were standardized and used to test the Tetraclinis articulata habitat quality index (HQI) proposed in the habitat management guide [29], allowing comparisons of habitat status before and after the improvement actions. The species richness was calculated by considering those most representative of the habitat: Chamaerops humilis, Maytenus senegalensis, Olea europea var. sylvestris, Osyris lanceolata, Periploca angustifolia, Pinus halepensis, Pistacia lentiscus, Quercus coccifera, Rhamnus lycioides, and Tetraclinis articulata. We have considered the most representative species of the priority habitat 9570 to be those focal species listed in recent local bibliography [29,33]. Those specimens of T. articulata that showed signs of having reached reproductive maturity (i.e., cone production) were considered adults. Specimens with a diameter greater than 8 cm without signs of having developed reproductive activity were considered as sub-adults. Consequently, those with a smaller diameter and without signs of reproductive activity were considered juvenile. Limiting factors and anthropogenic impacts considered can be observed in Table 2. Tree canopy cover, terrain elevation, and slope LiDAR-based models were obtained from the Spanish National Center for Geographic Information website [34]. Normalized burn ratio (1) was calculated as a proxy of fire severity as the ratio of NIR to SWIR bands using LANDSAT-5 images of June and September 2011. Normalized difference vegetation index (2) was calculated as an annual mean for 2015 as the NIR and RED bands ratio using LANDSAT-8 images. Overgrazing damage was calculated according to the percentage of damage in the first 1.5 m (0 = no damage, 1 = 1–25%, 2 = 25–50%, 3 = 50–75%, 4 = 75–100%) multiplied by the ratio of damaged height to the total specimen height.
N B R = N I R S W I R N I R + S W I R ;         d N B R = N B R p r e f i r e N B R p o s t f i r e
N D V I = N I R R E D N I R + R E D

2.3. Habitat Quality Index and Cost-Effectiveness Model

To facilitate the study of the conservation status of priority habitat 9570 “Tetraclinis articulata forests”, an easy-to-use habitat quality index was developed [29]. This index was calculated based on habitat focal species richness (SpR), number of adult and sub-adult specimens (AdN), number of recruited or juvenile specimens (RecN), limiting factors affecting recruitment (LimF), and anthropogenic impacts (AImp). Table 2 summarizes the procedures to be considered for each variable involved in the index calculation.
The habitat quality index (3) ranges from −3 to 12 and classifies habitat quality into 5 categories: Unfavorable–Bad (−3 to 2), Unfavorable–Inadequate (2 to 5), Favorable–Basic (5 to 7), Favorable–Good (7 to 9), and Favorable–Optimum (9 to 12). Each survey plot has a HQI value. The actions have a mean HQI value obtained by the average of their units.
H Q I = 0.91 S p R + A d N + R e c N + L i m F + A I m p

2.4. Data Analysis

A correlation matrix (R ‘corrplot’ package [35]) and principal component analysis (R ‘FactoMineR’ package [36]) were used on the following variables to discuss their possible implementation in the quality index: habitat species richness, total number of adult and sub-adult specimens of T. articulata, total number of saplings and juvenile specimens of T. articulata, limiting factors or anthropogenic impacts, tree canopy cover, elevation, slope, differenced normalized burn ratio [37], normalized difference vegetation index [38], and overgrazing damage [39]. An ANOVA approach (R ‘car’ package [40]) was employed to verify the absence of statistically significant differences of the HQI values among the plots included in each action group. The purpose of these analyses was: (i) to confirm the comparability of the initial conditions of the plots within each group and (ii) to verify that the improvement actions had a similar effect in each group of plots. Subsequently, a paired t-test was used to determine whether the observed variation in the HQI value for each intervened group was significant. To calculate a cost-effectiveness model, a linear model relating the cost in Euros per hectare per HQI unit increment of each action and their initial average HQI value was employed. A natural logarithm was applied to the dependent variable for this model.

3. Results

3.1. Correlation Analysis

Values of Pearson correlation coefficients of the analyzed variables are shown in Table 3. Although most of them are poorly or moderately correlated, the highest values are observed for the species richness–anthropogenic impacts and tree cover–NDVI pairs.

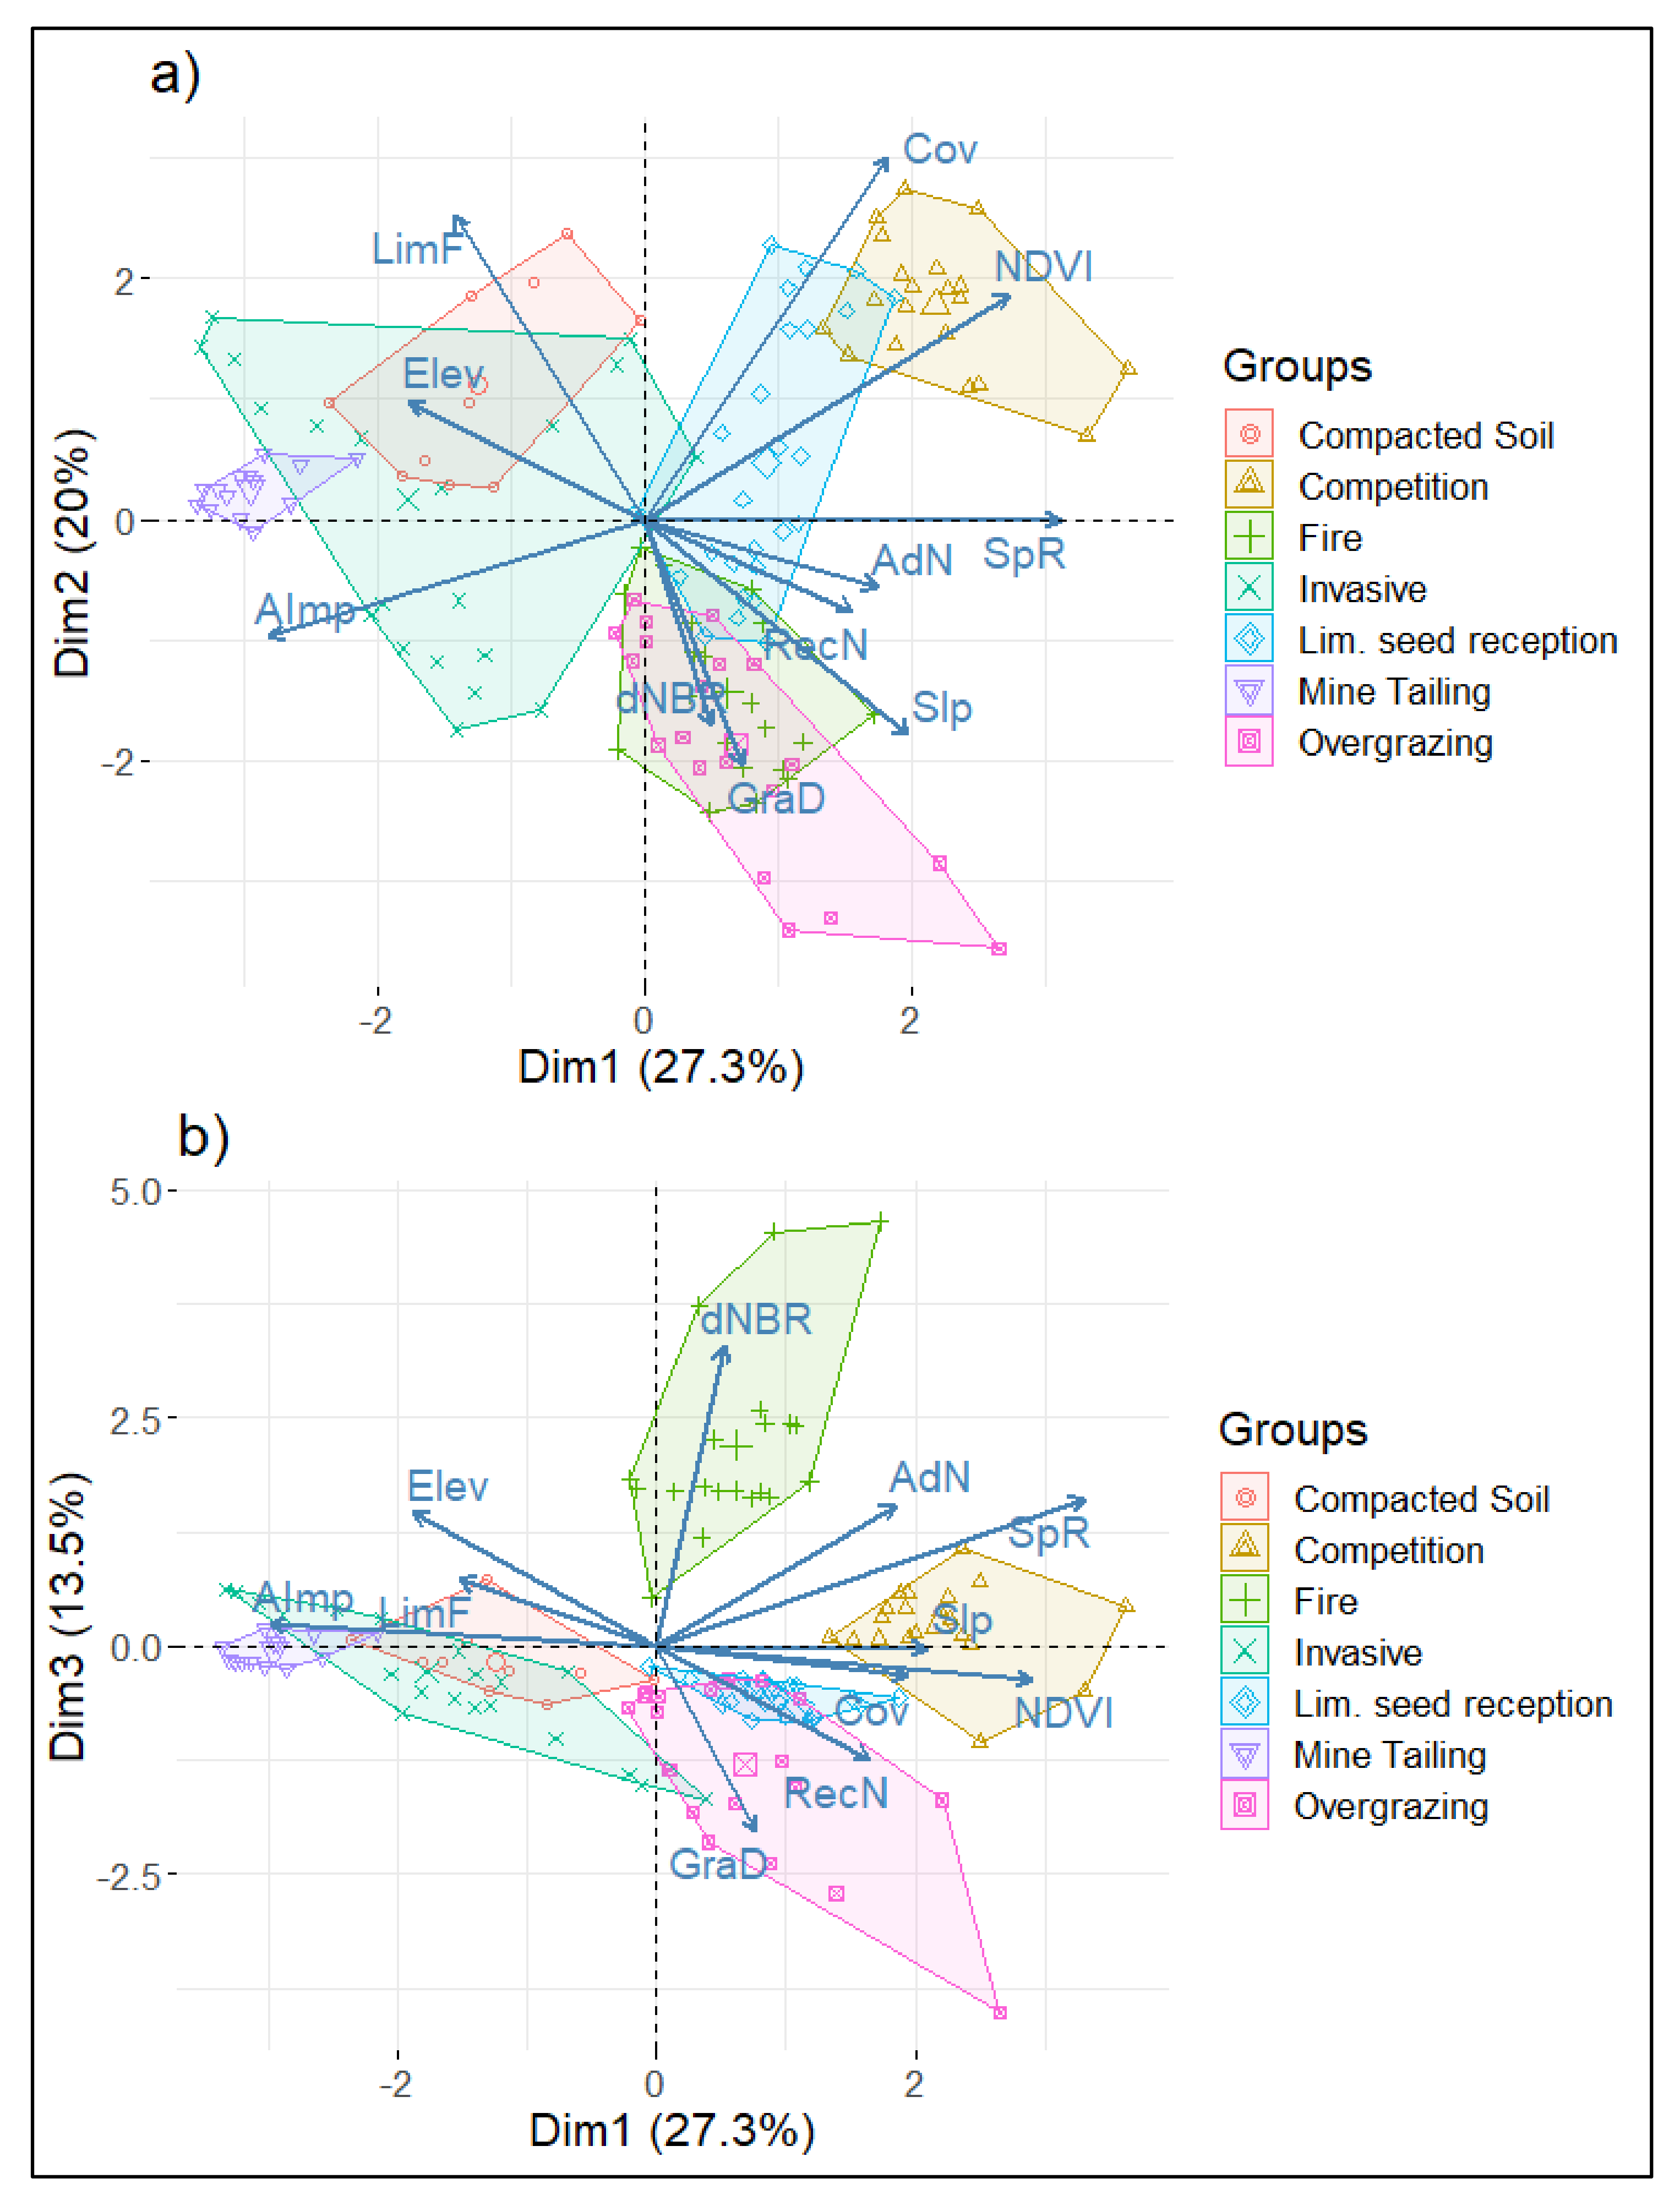
3.2. Principal Component Analisys

Main results obtained from the principal component analysis are summarized in Table 4. The left side reveals that the first four components contribute to about 74% of the explained variance. The right side includes the variables’ contribution to the first four dimensions.
The graphical representation of the first three axes highlights the dimensional configuration of the study groups (Figure 2). According to the location of the groups in the first two dimensions (a), a gradient of system degradation is suggested. An evident gradient of degradation activities is represented by the axis of the first dimension, while the axis of the second dimension suggests a secondary gradation involving some historical processes of habitat alteration (grazing and fires). Furthermore, the addition of the third dimension (b) allows a clear distinction of burned and overgrazed areas.

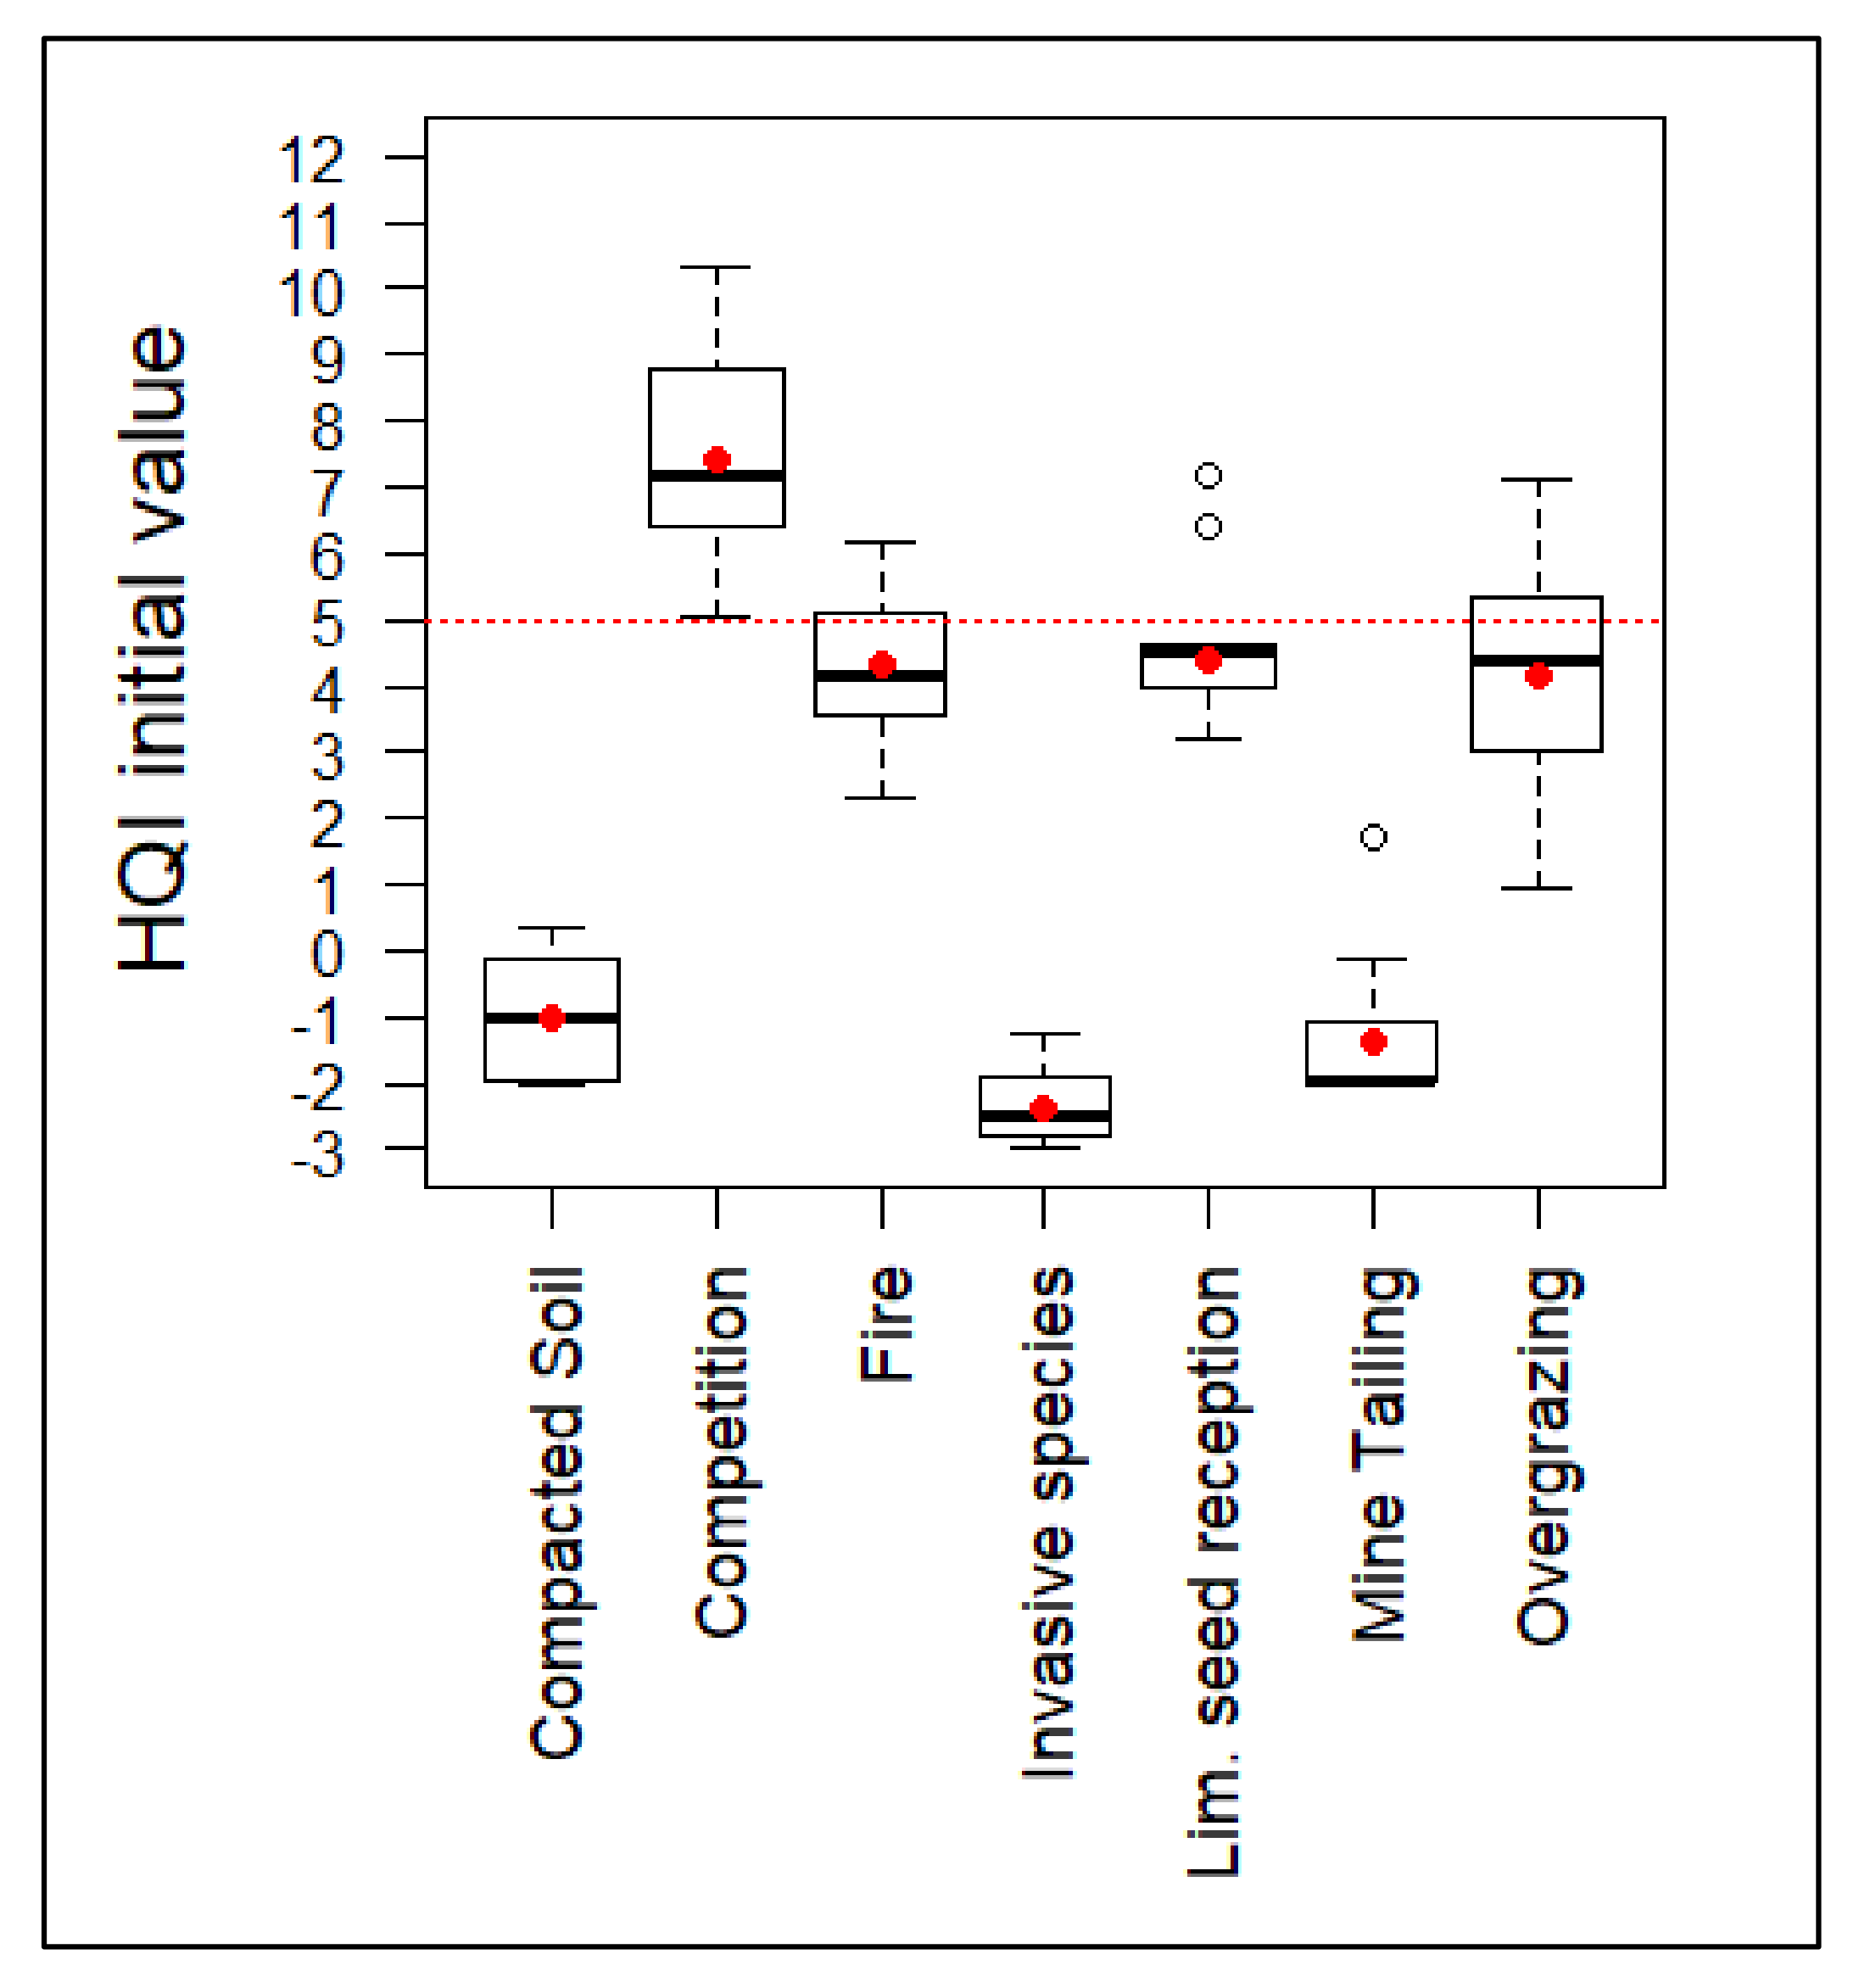
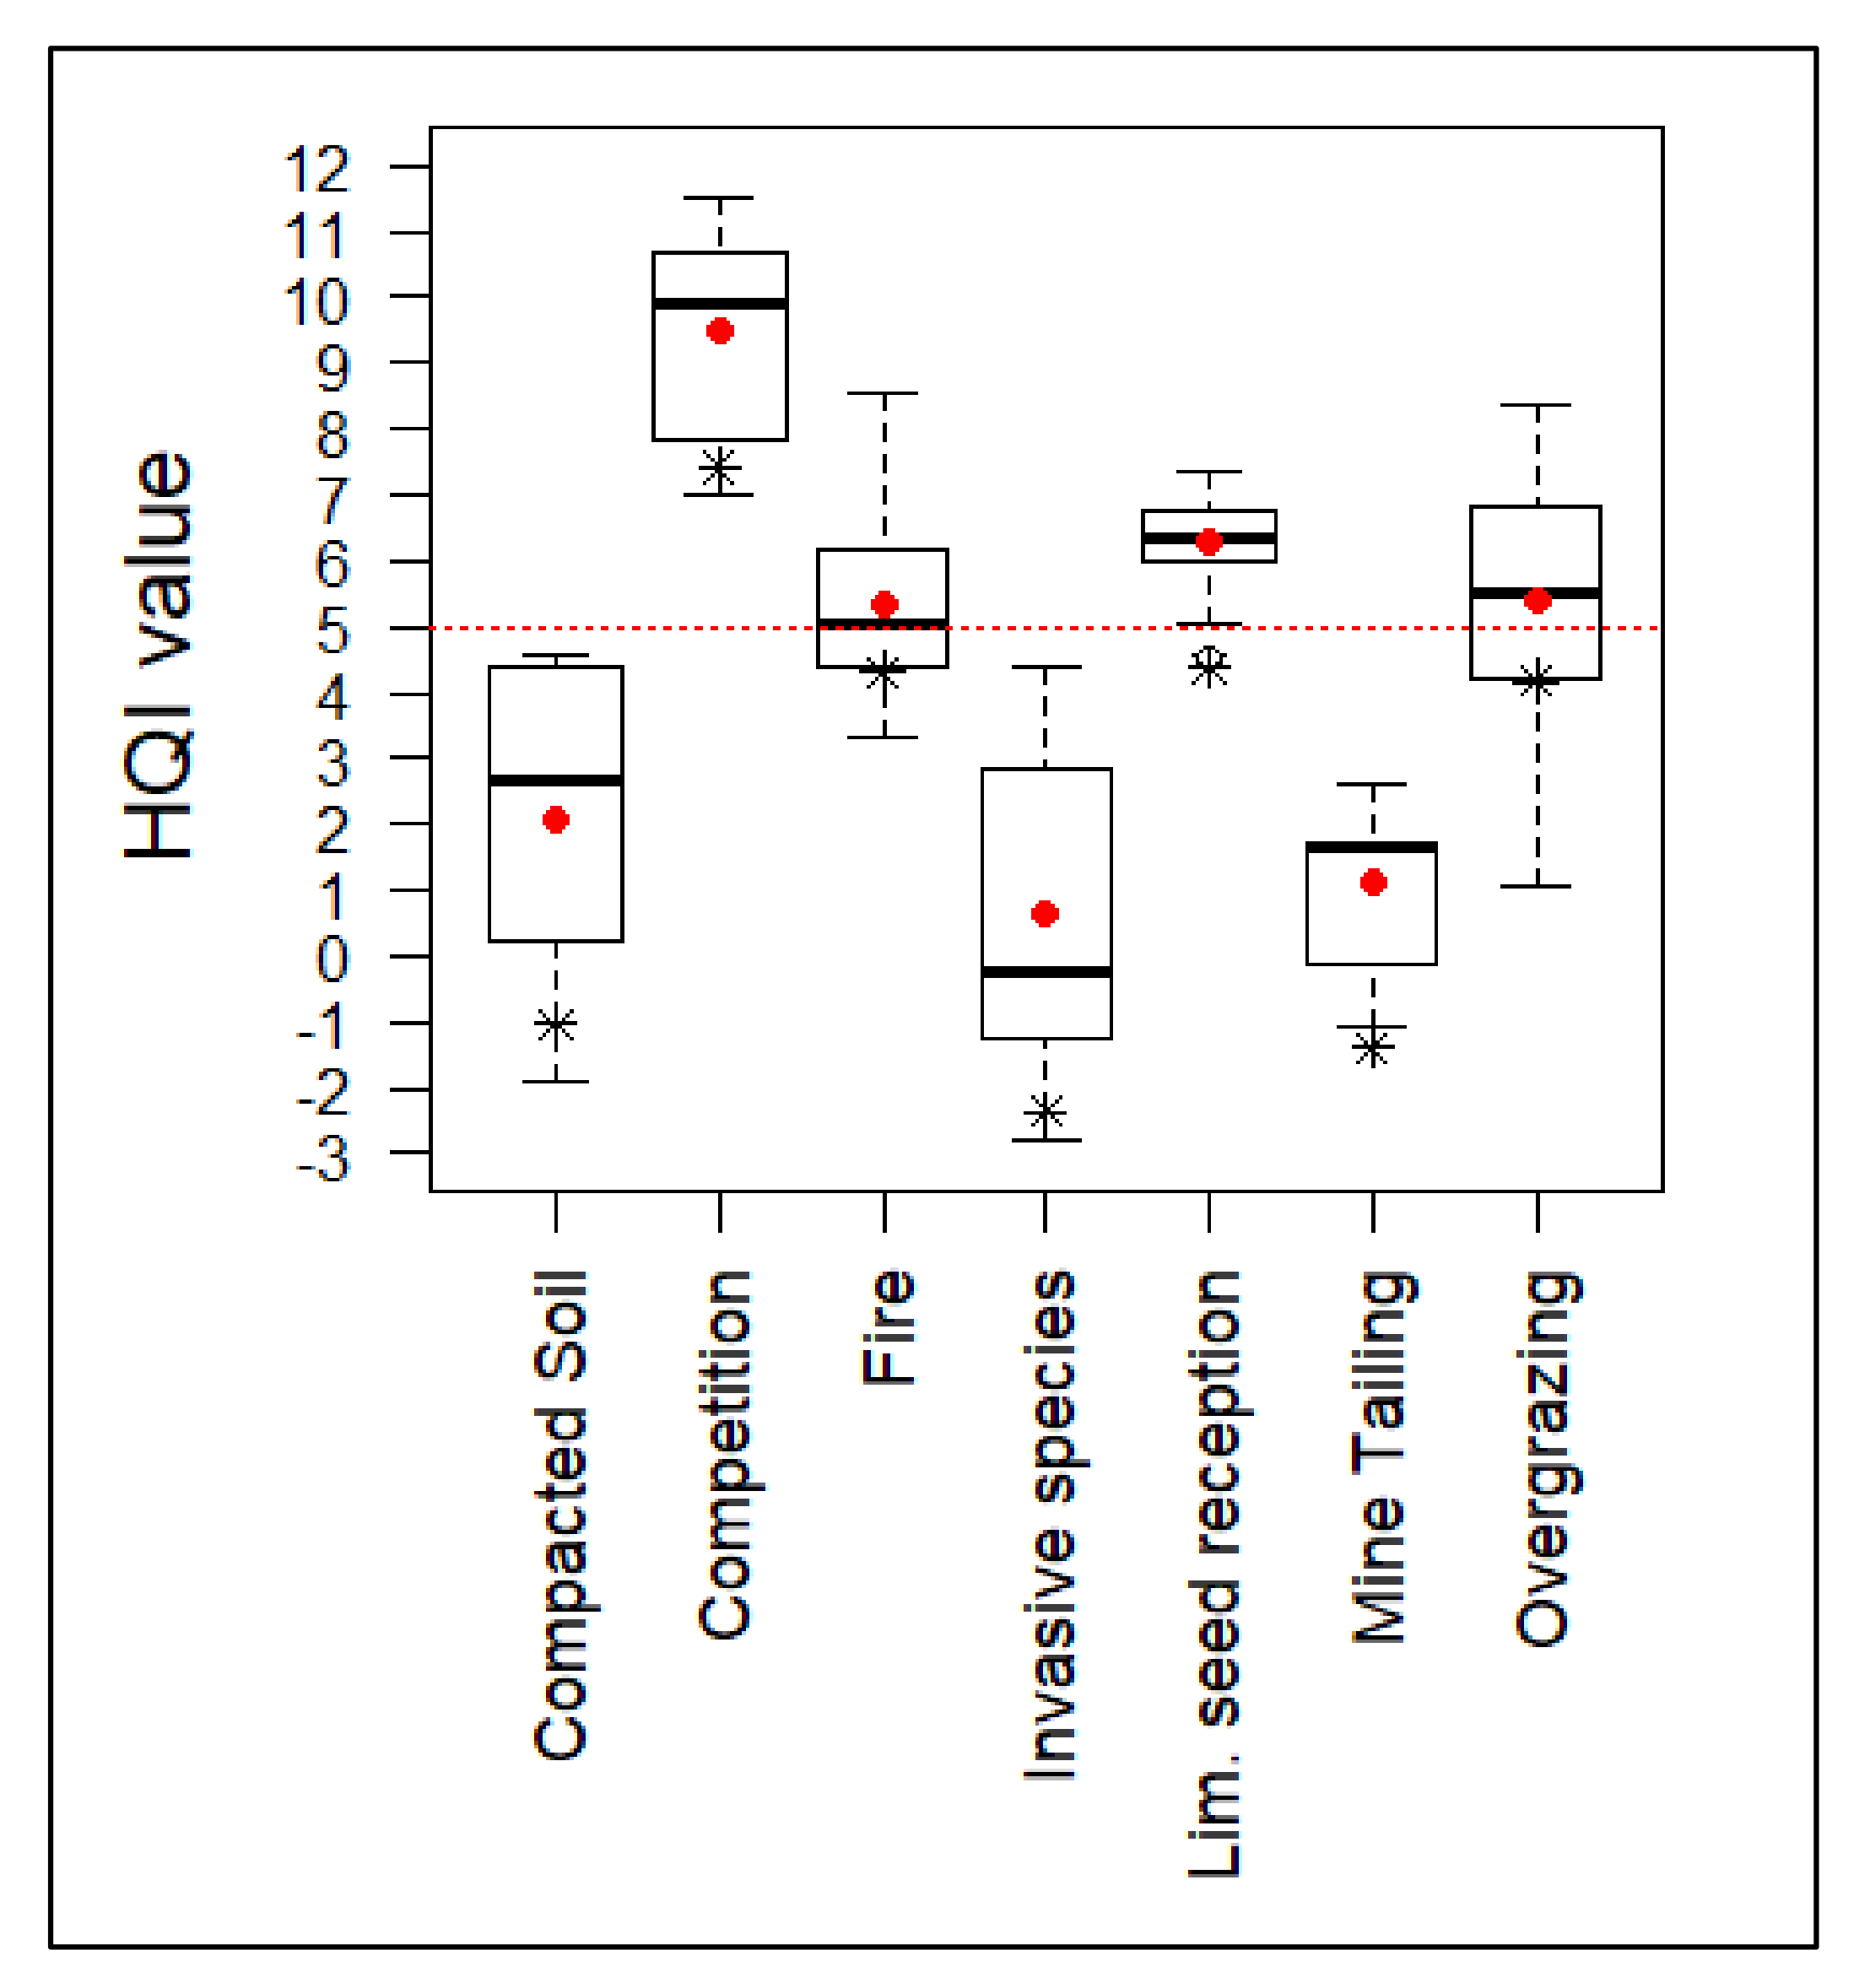
3.3. Habitat Quality Index Variation

The ANOVA tests applied to the set of plots that were included in each group did not reveal significant differences in their HQI initial values before implementing the habitat improvement measures (Table 5). Those values (Figure 3) show that only the ecological competition situations group had favorable initial values of the quality index. Initial HQI values seem to be consistent with the degradation gradient suggested by the principal component analysis.
As a result of the implemented actions, only the invasive species elimination plots showed significant differences (Table 6). The actions resulted in an overall increase of the habitat quality index (Figure 4). However, those groups that were subjected to highly degradative processes and which originally showed negative index values maintained an unfavorable quality rating (HQI < 5).
The actions implemented to improve the habitat have had a positive effect on the value of the quality index of the groups. All of them registered statistically significant changes (Table 7). After weighting the intervened surfaces in each action, the overall average of the habitat quality index improved from 4.33 (Unfavorable–Inadequate) to 5.79 (Favorable–Basic).

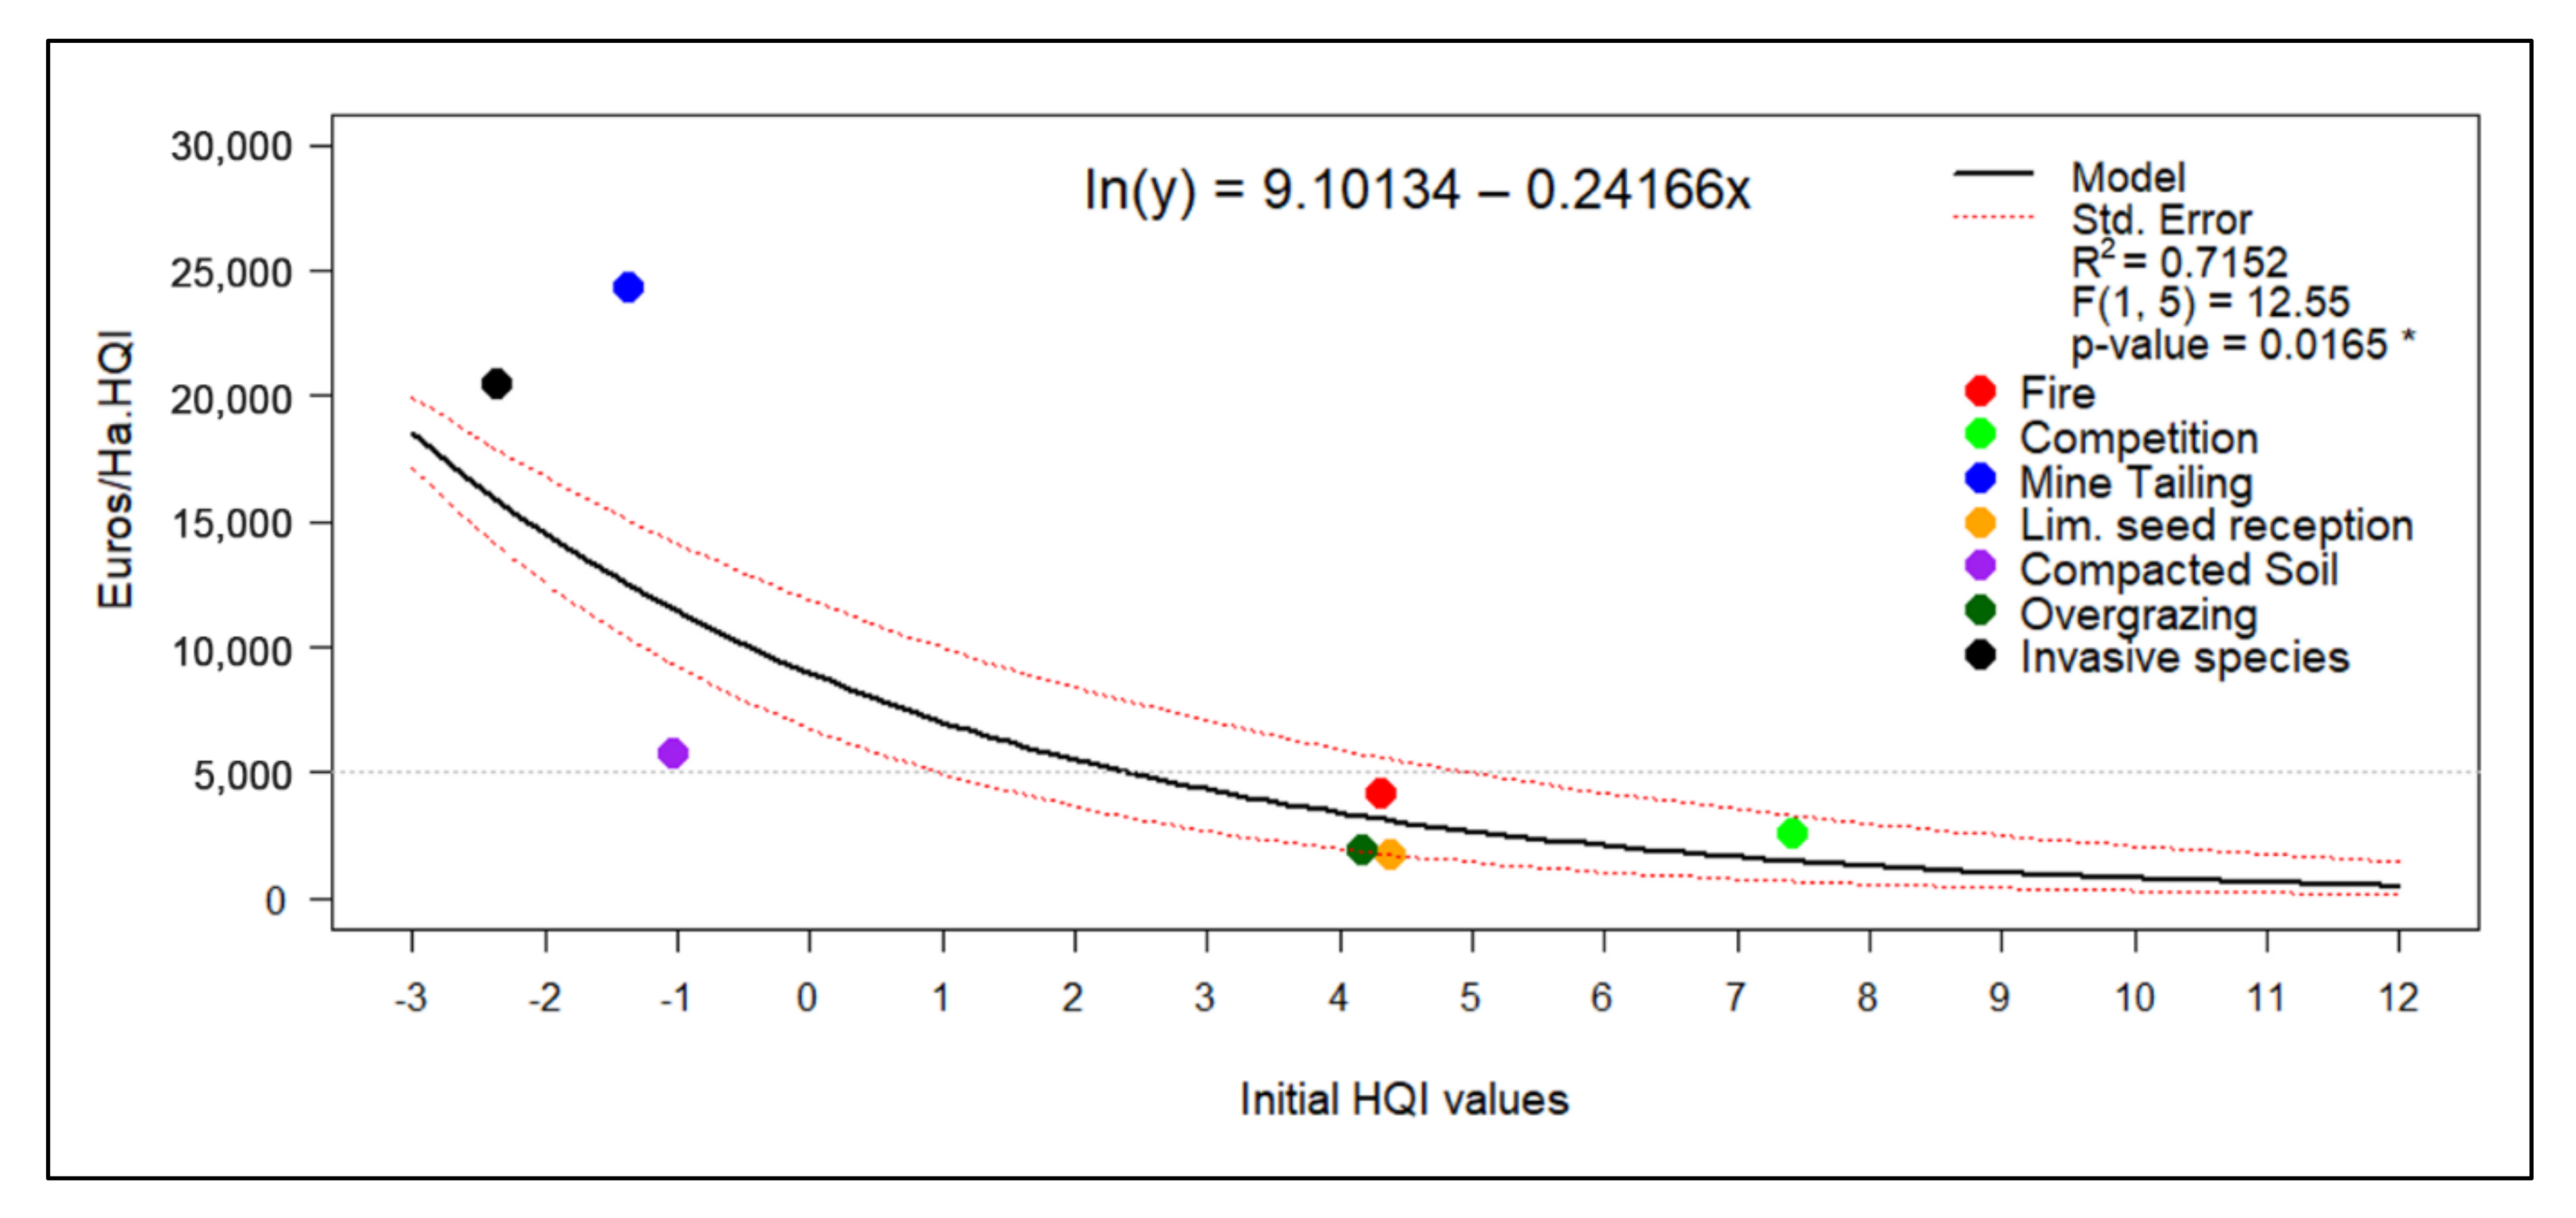
3.4. Cost-Effectiveness Model

The linear model relating the initial average HQI value to the cost of increasing one quality point in Euros per hectare is shown in Figure 5. The model achieved an R2 value of 0.7152 and a statistically significant p-value (0.0165 *). The observed tendency indicates that the economic cost was considerably reduced as the value of the initial quality index increased.

4. Discussion

4.1. Index Variables

Prior to this work, some authors have suggested certain indicators to assess the conservation status of priority habitat 9570 [12,33]. In this sense, the index used in this study (HQI [29]) integrates such indicators and has proven to be a useful and easy to apply habitat management tool. Some suggestive findings were observed from the analyses applied to the variables involved in the quality index. The low to moderate correlation observed indicates that the index variables share minimal information, making them non-redundant and valuable for assessing the overall habitat quality. The initial variables proposed for HQI [29] had a relevant impact on the first four dimensions of the principal component analysis by absorbing about 74% of the variance, which would justify their inclusion. The graphical representation of the first two dimensions suggests the existence of a degradation pressure gradient related to the intensity of the impacts, depending on whether they involve different ecological compartments of ecosystems, certain physical factors, the soil composition, or exclusively changes in the plant community. Furthermore, the third dimension suggests some potential index improvements, since the factor including anthropogenic impacts could be segregated to consider specific disturbances such as fire intensity or overgrazing. These last disturbances correspond to the traditionally most common impacts in the entire geographical area of the T. articulata formations [18,19,20,21,29,41]. The key factors contributing to the habitat variability of Tetraclinis stands appear to be the severity of anthropogenic impacts, the richness of habitat-specific phanerophytes, and the role of the accompanying vegetation (which either restricts or facilitates recruitment). Other factors such as soil compaction or litter volume [19,20,29], canopy cover [21], and variables directly associated with the target species (density of adults and number of juveniles or recruits of T. articulata) are also relevant. It is interesting that these demographic variables related to the target species were the last to be added, which allows a clearer differentiation between habitat quality (in a strictly ecosystemic sense) and the quality of each survey plot directly related to the local demographic status of T. articulata.
The index consistently and reliably classifies the quality of the different Tetraclinis formations studied. The first axis of the PCA systematically ranks the index values, properly separating negatives from positives. However, it should be noted that top-quality expressions of the habitat were not included in this analysis, since the aim of the LIFE project was to select localities that required improvement actions. In the case of undisturbed plots located in locally optimal areas, the index value ranges between 10.6 and 11.4 (unpublished data). In addition, the index has been shown to be responsive to management measures. Only two years after the actions, the average habitat quality in the 78.81 hectares involved in the study improved from Unfavorable–Inadequate to Favorable–Basic, with an overall increase of 1.46 in the habitat quality index. Those actions involving extremely deteriorated population conditions showed a significant improvement, however this fact must be revised by considering the economic costs. Previous studies on the elimination of ecological competition or the ability to colonize abandoned mining areas have indicated the rapid response capacity of T. articulata when the main impact has ceased [21,26].

4.2. Index Applicability to Management and Other Biogeographical Areas

The latest assessments of the improvement requirements of European protected habitats show that forests are most in need [13]. The conservation status of the priority habitat 9570 “Tetraclinis articulata forests” was classified as “Unfavorable–Inadequate” in 2015 [27]. This study confirmed the HQI potential to assess the cost-effectiveness of management actions for the European populations of T. articulata. The economic cost per unit of change and hectare would be determined by the initial value of the habitat quality index. Although the overall changes were greater in extreme degradation situations, at an intermediate initial quality value, the economic cost of increasing one quality point per hectare would be significantly lower compared to situations with lower or negative values of the index. Therefore, our results suggested that using the regenerative potential of the species through low-impact actions focused on specific degradative factors could benefit the system in a relatively short time and at a low economic cost. This would represent a change in the approach to habitat restoration in semiarid environments, transcending the traditional methods focused on reforestations [24]. This information could be useful as a guide for administrators when deciding which areas should be considered for habitat quality improvement actions.
Previous research studies for Algerian [19] and Moroccan [20] populations suggest a high regeneration potential in the absence of grazing. A high regeneration capacity after fire damage has also been observed in Algerian populations [18]. However, the intensive and uncontrolled use of Tetraclinis timber in carpentry, handcraft, and construction could lead to an irreversible decline of its North African populations, particularly in Morocco where the species covers most of its distribution range [14,15,16,17]. The observed overall improvements in the quality index presented in this study are consistent with the species’ high regeneration capacity, even more so considering that the specific actions developed for these pressures resulted in low-impact interventions (removal of pine shoots and installation of a fence). Since the conservation threats to T. articulata are very similar, the index has the potential to be applied to their semiarid North African populations with some minor modifications (e.g., habitat species composition and timber usage), which would be useful both to establish the global conservation status of this species and in the development of habitat conservation and management plans.

4.3. Index Applicability in Context with Climate Change Scenarios

Regarding the expected effects of climate change on Iberian populations of Tetraclinis articulata [42], two different situations can be distinguished: (i) the appearance of new distant areas beyond its current distribution range and (ii) the response of the current populations on the Iberian Mediterranean coast. The first scenario would be problematic unless the colonization of the new areas is not artificially facilitated, as the species shows a low dispersal speed [29]. According to the second scenario, the current populations on the Iberian coast should increase due to two factors: (a) a closer approach to their optimal climatic niche in North Africa (warmer areas, without large variations in rainfall) and (b) a decreased competition with Pinus halepensis, which currently competes for the most favorable local areas regarding water deficit [21]. The index is adjusted for an asymptotic response in its most favorable ranges, limited to a total of 12 points. A given numerical or population improvement of the target species at current optimal localities should not result in a substantial variation of the index value. Regarding the remaining local focal species of the habitat, those that have been modeled (Chamaerops humilis, Maytenus senegalensis, and Periploca angustifolia) exhibit an uncertain and variable response depending on the species [43]. The remaining species of the habitat are still under study. In this sense, this section of the index should probably be adapted to the new conditions in the medium term.

5. Conclusions

This study has verified the suitability of the main variables proposed in the development of the habitat quality index for the Tetraclinis articulata forests [29] in their European populations (habitat code 9570). Additionally, new options to improve the index have been identified by disaggregating the anthropogenic impacts into specific variables, such as the severity of the forest fires or the overgrazing damage. Index sensitivity was found to be suitable to discriminate between different habitat conservation statuses, as well as to detect changes in them. The obtained cost-effectiveness model suggests a higher profitability of those measures focused on the improvement of intermediate scenarios in the initial value of HQI, demonstrating its usefulness for managers when planning and deciding on future habitat management actions. The relative simplicity of the index might be appropriate for testing its applicability in the North African semiarid natural habitats with Tetraclinis populations, as it could be implemented with some minor modifications.

Author Contributions

J.M.M.-P. and M.Á.E.-S. participated in conceptualization, experimental design, methodology, and formal analysis. J.M.M.-P. participated in writing—original draft preparation. M.Á.E.-S. participated in writing—review and editing. A.R.R. and A.F.C. participated in the economic data acquisition. All authors provided editorial advice and participated in the review process. All authors have read and agreed to the published version of the manuscript.

Funding

This work was funded and supported by the data collected in the LIFE13 NAT/ES/00436 project (Conservation of the habitat 9570 * Tetraclinis articulata forest in the European continent). The preparation of this manuscript was carried out under project 20912/PI/18, financed by the “Fundación Séneca-Agencia de Ciencia y Tecnología de la Región de Murcia” (Seneca Foundation, Agency for Science and Technology of the Region of Murcia).

Data Availability Statement

Publicly available datasets were analyzed in this study. The data can be found here: https://github.com/jmmp83/cost-effectivenes-Tetraclinis.git, accessed on 13 May 2022.

Acknowledgments

The authors gratefully acknowledge José Antonio Palazón and Mª Francisca Carreño for their support and the following for their invaluable contribution throughout the data collection process: Isabel Hernández García, Pablo Montoya Bernabéu, Jesús Muñoz Parra, Juanjo Saumar, and Aixa Mª Morata Uceda. We would also like to thank the reviewers for their comments and contributions which have helped us to improve the clarity of this manuscript.

Conflicts of Interest

The authors declare no conflict of interest.

References

  1. European Commission. Council Directive 92/43/EEC on the conservation of natural habitats and of wild fauna and flora. Eur. Commun. Gazette 1992, 206, 1–50. [Google Scholar]
  2. European Commission. Interpretation Manual of European Union Habitats-EUR28. 2013. Available online: https://ec.europa.eu/environment/nature/legislation/habitatsdirective/docs/Int_Manual_EU28.pdf (accessed on 11 May 2022).
  3. Carnino, N. État de Conservation des Habitats D’intérêt Communautaire à L’échelle du Site–Méthode D’évaluation des Habitats Forestiers. Muséum National d’Histoire Naturelle/Office National des Forêts, 49 pp. + Annexes. 2009. Available online: https://www.tela-botanica.org/wp-content/uploads/2017/03/etatdeconservationhabitatsinteretcommunautaire_Carnino_2009_methode_EC_hab_foret.pdf (accessed on 11 May 2022).
  4. Evans, D.; Arvela, M. Assessment and reporting under Article 17 of the Habitats Directive. Explanatory Notes & Guidelines for the period 2007–2012. European Commission, Brussels. 2011. Available online: https://circabc.europa.eu/sd/a/2c12cea2-f827-4bdb-bb56-3731c9fd8b40/Art17-Guidelines-final.pdf (accessed on 11 May 2022).
  5. Gigante, D.; Attorre, F.; Venanzoni, R.; Acosta, A.; Agrillo, E.; Aleffi, M.; Alessi, N.; Allegrezza, M.; Angelini, P.; Angiolini, C.; et al. A methodological protocol for Annex I Habitats monitoring: The contribution of Vegetation science. Plant Sociol. 2016, 53, 77–87. [Google Scholar] [CrossRef]
  6. Angiolini, C.; Foggi, B.; Sarmati, S.; Gabellini, A.; Gennai, M.; Castagnini, P.; Mugnai, M.; Viciani, D.; Fanfarillo, E.; Maccherini, S. Assessing the conservation status of EU forest habitats: The case of Quercus suber woodlands. For. Ecol. Manag. 2021, 496, 119432. [Google Scholar] [CrossRef]
  7. Angelini, P.; Chiarucci, A.; Nascimbene, J.J.; Cerabolini, B.; Dalle Fratte, M.; Casella, L. Plant assemblages and conservation status of habitats of Community interest (Directive 92/43/EEC): Definitions and concepts. Ecol. Quest. 2018, 29, 87–97. [Google Scholar] [CrossRef]
  8. Ellwanger, G.; Runge, S.; Wagner, M.; Ackermann, W.; Neukirchen, M.; Frederking, W.; Müller, C.; Ssymank, A.; Sukopp, U. Current status of habitat monitoring in the European Union according to Article 17 of the Habitats Directive, with an emphasis on habitat structure and functions and on Germany. Nat. Conserv. 2018, 29, 57–78. [Google Scholar] [CrossRef] [Green Version]
  9. Röschel, L.; Noebel, R.; Stein, U.; Naumann, S.; Romão, C.; Tryfon, E.; Gaudillat, Z.; Roscher, S.; Moser, D.; Ellmauer, T.; et al. State of Nature in the EU-Methodological Paper. Methodologies under the Nature Directives Reporting 2013–2018 and Analysis for the State of Nature 2000. ETC/BD Report to the EEA; European Environment Agency: Copenhagen, Denmark, 2020. [CrossRef]
  10. VV.AA. Bases Ecológicas Preliminares para la Conservación de los Tipos de Hábitat de Interés Comunitario en España. Madrid: Ministerio de Medio Ambiente, y Medio Rural y Marino. 2009. Available online: https://www.miteco.gob.es/es/biodiversidad/temas/espacios-protegidos/red-natura-2000/rn_tip_hab_esp_bases_eco_preliminares.aspx (accessed on 11 May 2022).
  11. Pescador, D.S.; Vayreda, J.; Escudero, A.; Lloret, F. Identificación y descripción de las variables utilizadas en el Inventario Forestal Nacional para la evaluación de la ‘Estructura y función’ de los tipos de hábitat de bosque. In Metodologías para el Seguimiento del Estado de Conservación de los Tipos de Habitat; Ministerio para la Transición Ecológica: Madrid, Spain, 2019; p. 135. Available online: https://www.miteco.gob.es/es/biodiversidad/temas/ecosistemas-y-conectividad/04bosquesymatorralesnofluviales_2_metodosestructurayfuncionifn_tcm30-506048.pdf (accessed on 11 May 2022).
  12. Pescador, D.S.; Chacón-Labella, J.; Vayreda, J.; Escudero, A.; Lloret, F. Identificación de tipos de hábitat de bosque y matorral no representados en las parcelas del Inventario Forestal Nacional y descripción de procedimientos para evaluar su estado de conservación. In Metodologías para el Seguimiento del Estado de Conservación de los Tipos de Hábitat; Ministerio para la Transición Ecológica: Madrid, Spain, 2019; p. 31. Available online: https://www.miteco.gob.es/es/biodiversidad/temas/ecosistemas-y-conectividad/04bosquesymatorralesnofluviales_7_metodostiposnorepresentados_tcm30-506052.pdf (accessed on 11 May 2022).
  13. European Commission. Report from the Commission to the European Parliament, the Council and the European Economic and Social Committee. The state of nature in the European Union. Report on the status and trends in 2013–2018 of species and habitat types protected by the Birds and Habitats Directives. Brussels. 2020. Available online: https://eur-lex.europa.eu/legal-content/EN/TXT/PDF/?uri=CELEX:52020DC0635&from=ES (accessed on 11 May 2022).
  14. Charco, J. El bosque Mediterráneo en el Norte de África: Biodiversidad y Lucha Contra la Desertificación [The Mediterranean Forest in North Africa: Biodiversity and Desertification]; Mundo Árabe e Islam-AECI: Madrid, Spain, 1999; p. 370. [Google Scholar]
  15. El-Mouridi, M.; Laurent, T.; Farimi, A.; Kabouchi, B.; Alméras, T.; Calchéra, G.; El Abid, A.; Ziani, M.; Gril, J.; Hakam, A. Caractérisation physique du bois de la loupe de Thuya (Tetraclinis articulata (Vahl) Masters). Phys. Chem. News 2011, 59, 57–64. [Google Scholar]
  16. Sghaier, T.; Sánchez-González, M.; Garchi, S.; Ammari, Y.; Cañellas, I.; Calama, R. Developing a stand-based growth and yield model for Thuya (Tetraclinis articulata (Vahl) Mast) in Tunisia. iForest 2015, 9, 79–88. [Google Scholar] [CrossRef]
  17. Benabid, A.; del Barrio, G.; Ruiz, A.; Sanjuán, M.E.; Sainz, H.; Simón, J.C. Libro Rojo de los Ecosistemas Forestales de Marruecos; Gland, S., Ed.; IUCN: Malaga, Spain, 2015; p. 164. Available online: https://digital.csic.es/bitstream/10261/179371/1/628523.pdf (accessed on 12 May 2022).
  18. Terras, M.; Labani, A.; Benabdeli, K.; Adda-Hanifi, N. Dynamique phytoécologique du Thuya de Berberie face à l’incendie. For. Méditerr. 2008, 29, 33–40. [Google Scholar]
  19. Hadjadj-Aoul, S.; Chouieb, M.; Loisel, R. Effet des facteurs environnementaux sur les premiers stades de la régénération naturelle de Tetraclinis articulata (Vahl, Master) en Oranie, Algérie. Ecol. Mediterr 2009, 35, 19–30. [Google Scholar] [CrossRef]
  20. Dallahi, Y.; Chahhou, D.; El Aboudi, A.; Aafi, A.; Abbas, Y.; Mounir, F.; Abidine, M.M.O. The dynamics of natural regeneration of Tetraclinis articulata (Vahl) Masters in the Moroccan Central Plateau. Plant Sociol. 2017, 54, 37–41. [Google Scholar]
  21. Moya-Pérez, J.M.; Carreño, M.F.; Esteve-Selma, M.Á. Enhancing the Resilience of a Mediterranean Forest to Extreme Drought Events and Climate Change: Pinus—Tetraclinis Forests in Europe. Forests 2021, 12, 487. [Google Scholar] [CrossRef]
  22. Esteve-Selma, M.A.; Carreño-Fructuoso, M.F.; Moya-Pérez, J.M.; Montoya-Bernabeu, P.F.; Martínez-Fernández, J.; Pérez-Navarro, M.A.; Lloret, F. Respuesta de los bosques de Pinus halepensis del sureste ibérico al cambio climático: Los eventos de sequía extrema. In El Clima: Aire, Agua, Tierra y Fuego; Montávez, J.P., Gómez, J.J., López, J.M., Palacios, L., Turco, M., Jerez, S., Lorente, R., Jiménez, P., Eds.; Asociación Española de Climatología; Agencia Estatal de Meteorología: Madrid, Spain, 2018; pp. 1023–1033. Available online: http://aeclim.org/wp-content/uploads/2019/07/1023-ESTEVE.pdf (accessed on 12 May 2022).
  23. Moya-Pérez, J.M.; Esteve-Selma, M.A. Incrementando la resiliencia al cambio climático de los bosques costeros: El caso de las formaciones mixtas Pinus-Tetraclinis. In Cambio Climático en la Región de Murcia: Del Acuerdo de París a la Emergencia Climática. Trabajos del Observatorio Regional del Cambio Climático 2020; Consejería de Agua, Agricultura, Ganadería, Pesca y Medio Ambiente de la Región de Murcia: Murcia, Spain, 2020; pp. 103–110. Available online: https://www.carm.es/web/descarga?ARCHIVO=1113-2020%20LIbro%20del%20Cambio%20Clima%C2%BFtico%20con%20portadas.pdf&ALIAS=ARCH&IDCONTENIDO=176927&IDTIPO=60&RASTRO=c866$m9665 (accessed on 14 May 2022).
  24. Navarro-Cano, J.A.; Goberna, M.; González-Barberá, G.; Castillo, V.M.; Verdú, M. Restauración Ecológica en Ambientes Semiáridos: Recuperar las Interacciones Biológicas y las Funciones Ecosistémicas; CSIC: Murcia, Spain, 2017; p. 159. Available online: https://www.uv.es/cide/Documentos/RESTAURACION_ECOLOGICA.%20Libro.pdf (accessed on 12 May 2022).
  25. Navarro-Cano, J.A.; Goberna, M.; Verdú, M. Plant facilitation as a tool to restore diversity and ecosystem functions. Ecosistemas 2019, 28, 20–31. [Google Scholar] [CrossRef]
  26. Oná, M.B.; Goberna, M.; Navarro-Cano, J.A. Natural Seed Limitation and Effectiveness of Forest Plantations to Restore Semiarid Abandoned Metal Mining Areas in SE Spain. Forests 2021, 12, 548. [Google Scholar] [CrossRef]
  27. European Commission. Natura 2000 and Forests Part I–II. Technical Report 2015, 88. European Commission, DG-ENV. Brussels. 2015. Available online: https://ec.europa.eu/environment/nature/natura2000/management/docs/Final%20Guide%20N2000%20%20Forests%20Part%20I-II-Annexes.pdf (accessed on 12 May 2022).
  28. EIONET Conservation Status 2013-2018-Experts Web Viewer. Available online: https://nature-art17.eionet.europa.eu/article17/habitat/summary/?period=5&subject=9570 (accessed on 12 May 2022).
  29. Esteve-Selma, M.A.; Moya-Pérez, J.M.; Navarro-Cano, J.A. Manual de Evaluación y Gestión del Hábitat 9570*: Bosques de Tetraclinis Articulata, 1st ed.; Dirección General del Medio Natural: Murcia, Spain, 2019; p. 87. Available online: http://www.murcianatural.carm.es/c/document_library/get_file?uuid=15ccbf52-1211-4174-bc86-5572c2f662bc&groupId=14 (accessed on 12 May 2022).
  30. Baeza, M.J.; Pastor, A.; Martín, J.; Ibáñez, M. Mortalidad post-implantación en repoblaciones de Pinus halepensis, Quercus ilex, Ceratonia siliqua y Tetraclinis articulata en la Provincia de Alicante. Stud. Oecol. 1991, 8, 139–146. [Google Scholar]
  31. Padilla, F.M.; Ortega, R.; Sánchez, J.; Pugnaire, F.I. Rethinking species selection for restoration of arid shrublands. Basic App. Ecol. 2009, 10, 640–647. [Google Scholar] [CrossRef] [Green Version]
  32. Conservation of the priority habitat 9570 Tetraclinis articulata forest in the European continent. Available online: https://lifetetraclinis.carm.es/ (accessed on 12 May 2022).
  33. Esteve, M.A. 9570 Bosques de Tetraclinis articulata (*). In Bases Ecológicas Preliminares Para la Conservación de los Tipos de Hábitat de Interés Comunitario en España; Ministerio de Medio Ambiente, y Medio Rural y Marino: Madrid, Spain, 2009; p. 68. [Google Scholar]
  34. Spanish National Center for Geographic Information. Available online: https://centrodedescargas.cnig.es (accessed on 14 May 2022).
  35. Taiyun, W.; Simko, V.R. Package ‘Corrplot’: Visualization of a Correlation Matrix (Version 0.92). 2021. Available online: https://github.com/taiyun/corrplot (accessed on 14 May 2022).
  36. Lê, S.; Josse, J.; Husson, F. FactoMineR: An R Package for Multivariate Analysis. J. Stat. Sof. 2008, 25, 1–18. [Google Scholar] [CrossRef] [Green Version]
  37. Key, C.H.; Zhu, Z.; Ohlen, D.; Howard, S.; McKinley, R.; Benson, N. The normalized burn ratio and relationships to burn severity: Ecology, remote sensing and implementation. In Proceedings of the Ninth Forest Service Remote Sensing Applications Conference; J.D. Greer, ed. Rapid Delivery of Remote Sensing Products, San Diego, CA, USA; 2002. [Google Scholar]
  38. Kriegler, F.J.; Malila, W.A.; Nalepka, R.F.; Richardson, W. Preprocessing transformations and their effect on multispectral recognition. Remote Sens. Environ. 1969, 7, 97–132. [Google Scholar]
  39. Montoya-Bernabéu, P.; Esteve-Selma, M.A. Sobrepastoreo y microhábitat en Tetraclinis articulata (Vahl) Masters: Efecto en variables dendrométricas y demográficas. In Biodiversidad y Procesos Ecológicos en el Sureste Ibérico; Editum; University of Murcia: Murcia, Spain, 2017; pp. 21–27. [Google Scholar]
  40. Fox, J.; Weisberg, S. An {R} Companion to Applied Regression, 3rd ed.; Sage: Thousand Oaks, CA, USA, 2019; Available online: https://socialsciences.mcmaster.ca/jfox/Books/Companion/ (accessed on 12 May 2022).
  41. Esteve Selma, M.A.; Montoya, P.; Moya, J.M.; Miñano, J.; Hernández, I.; Carrión, J.S.; Charco, J.; Fernández, S.; Munuera, M.; Ochando, J. Tetraclinis Articulata: Biogeografía, Ecología, Amenazas y Conservación, 1st ed.; Dirección General de Medio Natural, Región de Murcia: Murcia, Spain, 2017; p. 248. Available online: https://murcianatural.carm.es/c/document_library/get_file?uuid=6eeb4eb9-b1d1-4695-81e3-49fea2a002e8&groupId=14 (accessed on 12 May 2022).
  42. Esteve-Selma, M.A.; Martínez-Fernández, J.; Hernández-García, I.; Montávez, J.P.; López-Hernández, J.J.; Calvo, J.F. Potential effects of climatic change on the distribution of Tetraclinis articulata, an endemic tree from arid Mediterranean ecosystems. Clim. Chang. 2012, 113, 663–678. [Google Scholar] [CrossRef]
  43. Esteve-Selma, M.A.; Martínez-Fernández, J.; Hernandez, I.; Robledano, F.; Perez-Navarro, M.; Lloret, F. Cambio climático y biodiversidad en el contexto de la Región de Murcia. In Cambio Climático en la Región de Murcia. Evaluación Basada en Indicadores; Oficina de Impulso Socioeconómico del Medio Ambiente: Murcia, Spain, 2015; pp. 105–132. Available online: https://www.researchgate.net/publication/303685461_CAMBIO_CLIMATICO_Y_BIODIVERSIDAD_EN_EL_CONTEXTO_DE_LA_REGION_DE_MURCIA (accessed on 14 May 2022).
Figure 1. Study area location in the southeast of the Iberian Peninsula (Region of Murcia, Spain). Colored lines represent Protected Areas limits. The LIFE project actions were performed in the green areas (EPSG Projection 25830-ETRS89/UTM zone 30N).
Forests 13 00950 g001
Figure 2. PCA groups’ classification: (a) dimensions 1 and 2, (b) dimensions 1 and 3. Group names correspond to those in Table 1. SpR: focal species richness, AdN: No. of adults and sub-adults, RecN: No. of saplings and juveniles, LimF: limiting factors, AImp: anthropogenic impacts, Cov: tree canopy cover, Elev: elevation in meters above sea level, Slp: slope expressed as degrees, dNBR: differenced normalized burn ratio, NDVI: normalized difference vegetation index, GraD: overgrazing damage.
Forests 13 00950 g002
Figure 3. HQI values before the implementation of habitat improvement actions. Red dotted line represents the value from which the habitat quality index is considered favorable. Average value of the groups is represented by a red dot.
Forests 13 00950 g003
Figure 4. HQI values after the implementation of habitat improvement actions. Red dotted line represents the value from which the habitat quality index is considered favorable. Average value of the groups is represented by a red dot. Initial average value is represented by an asterisk.
Forests 13 00950 g004
Figure 5. Cost-effectiveness model based on the initial average value of the habitat quality index. p-value significance: * < 0.05, ** < 0.01, *** < 0.001.
Forests 13 00950 g005
Table 1. Summary of the LIFE-Tetraclinis project actions and number of survey plots. Each plot type was sized according to the nature of the studied degradative factor: (a) square plots of 400 m2, (b) circular plots of 15 m radius, (c) square plots of 25 m2, and (d) original irregular polygons designed in the LIFE project.
Degradation FactorImplemented ActionSurvey PlotsTotal Costs (€)Intervened Area (ha)
FireAbout 400 ha of Pinus-Tetraclinis mixed forest were burned by a fire in August 2011. The subsequent regeneration of the pine forest reached 3000 specimens/ha in some areas, so the aim was to reduce it to a maximum of 600 specimens/ha.20 (a)121,38128.09
CompetitionDecrease in the competitive pressure caused by the pine forest and stimulation through the increase in direct sunlight received from the reproductive activity of sub-adult specimens of T. articulata.20 (b)51,3839.5
Mine TailingExperimental restoration through the reintroduction of the main habitat species in an area of mine tailings from the middle of the last century.14 (c)53,8000.88
Limited seed receptionPlanting of T. articulata groves (20 ± 8 specimens/plot) to promote the creation of open forest stands in areas isolated from adult specimens.26 (b)38,80911.27
Compacted SoilsClosure and restoration of unauthorized trails in order to avoid an excessive habitat fragmentation.10 (c)46,0602.58
OvergrazingEliminate overgrazing in a specific area by installing fencing.20 (a)61,98025.61
Invasive SpeciesEliminate invasive species within the area of the Sites of Community Importance (SCI) of Calblanque, Monte de las Cenizas y Peña del Águila (code ES6200001) and La Muela-Cabo Tiñoso (code ES0000264).22 (d)54,1990.88
TOTAL132427,61278.81 (13% *)
* Percentage of intervened area in relation to the total occupied by priority habitat 9570 in continental Europe (595 ha, Esteve 2017).
Table 2. Variables used to calculate the habitat quality index (HQI) and applied methodologies. Contribution to the quality index corresponds to either (a) 100 m2 or (b) 400 m2 of survey plot size. SpR: focal species richness, AdN: No. of adults and sub-adults, RecN: No. of saplings and juveniles, LimF: limiting factors, AImp: anthropogenic impacts.
Variable AcronymMethodologyHQI Contribution
SpRFocal species richness as the presence or absence of the main habitat species: Chamaerops humilis, Maytenus senegalensis, Olea europea var. sylvestris, Osyris lanceolata, Periploca angustifolia, Pinus halepensis, Pistacia lentiscus, Quercus coccifera, Rhamnus lycioides, Tetraclinis articulata.No presence of habitat species: 0.
(a) >0 to 1 species or (b) 1 to 2 species: 1.
(a) >1 to 3 species or (b) 3 to 4 species: 2.
(a) >3 species or (b) >4 species: 3.
AdNNumber of adult and sub-adult specimens (>8 cm diameter, no strobili production) per 100 m2. Sub-adults are adjusted using a 0.5 coefficient.No adult or sub-adult specimens: 0.
Only saplings or juveniles: 1.
Up to 0.5 adult or sub-adult specimens: 2.
>0.5 to 1 adult or sub-adult specimens: 3.
>1 adult or sub-adult specimens: 4.
RecNNumber of recruited or juvenile specimens (<8 cm diameter, no strobili production) per 100 m2.No juveniles or saplings specimens: 0.
Up to 2 juveniles or saplings specimens: 1.
>2 to 4 juveniles or saplings specimens: 2.
>4 juveniles or saplings specimens: 3.
LimFLimiting factors. Those species or factors affecting recruitment are considered. The linear coverage is registered, with at least 40 linear meters/100 m2, in units of 20 × 20 m.2(1—Σ non-overlapping cover percentage as a decimal of Pinus halepensis, Chamaerops humilis, Calicotome intermedia, Brachypodium retusum, compacted soil, or unfissured rock and Aleppo pine litter accumulations)
AImpAnthropogenic impacts. Habitat disturbances caused by human activities. Due to its heterogeneity, this factor is estimated for each survey plot.Null impact. No noticeable disturbances: 1.
Low. Minor impacts not functionally relevant to the habitat (adult or sub-adult specimens with more than three average basal stems, compacted soil, debris, and dumping surface area on less than 5%, no invasive species presence): 0.
Medium. Structurally and functionally relevant impact, which does not threaten demographic dynamics (5–25% of compacted soil area, invasive species < 10%, significant damage caused by drought or overgrazing, burned specimens with >50% original biomass recovery): −1 (single impact), −2 (more than one).
High. Structurally and functionally disturbed demographic dynamics (compacted soil area > 25%, invasive species > 10%, serious damage caused by drought or overgrazing, burned specimens with <50% original biomass recovery): −2 (single impact), −3 (more than one).
Table 3. Correlation matrix. SpR: focal species richness, AdN: No. of adults and sub-adults, RecN: No. of saplings and juveniles, LimF: limiting factors, AImp: anthropogenic impacts, Cov: tree canopy cover, Elev: elevation in meters above sea level, Slp: slope expressed as degrees, dNBR: differenced normalized burn ratio, NDVI: normalized difference vegetation index, GraD: overgrazing damage. Significant differences (p-value < 0.05) are shown in bold.
SpRAdNRecNLimFAImpCovElevSlpdNBRNDVI
AdN0.43---------
RecN0.240.3--------
LimF−0.210.03−0.1-------
AImp−0.65−0.1−0.10.24------
Cov0.320.130.120.38−0.4-----
Elev−0.210.02−0.050.360.410----
Slp0.270.250.21−0.46−0.08−0.02−0.36---
dNBR0.420.28−0.08−0.20.08−0.320.050.23--
NDVI0.460.170.15−0.08−0.520.75−0.140.220.16-
GraD0.040.210.46−0.340.08−0.22−0.170.180.13−0.07
Table 4. PCA obtained results. Contribution of the variables included in the habitat quality index (HQI) appears highlighted in grey. SpR: focal species richness, AdN: No. of adults and sub-adults, RecN: No. of saplings and juveniles, LimF: limiting factors, AImp: anthropogenic impacts, Cov: tree canopy cover, Elev: elevation in meters above sea level, Slp: slope expressed as degrees, dNBR: differenced normalized burn ratio, NDVI: normalized difference vegetation index, GraD: overgrazing damage.
ComponentEigenvalue% VarianceΣ VarianceVariableDim.1Dim.2Dim.3Dim.4
13.0127.3227.32SpR22.240.0000310.750.003
22.2020.0447.36AdN6.960.989.7422.32
31.4813.4960.84RecN5.551.796.3328.31
41.4513.1573.99LimF4.6519.882.199.69
50.817.3881.37AImp18.123.000.248.32
60.655.9587.32Cov7.6228.290.441.53
70.524.7692.08Elev7.123.008.6615.60
80.383.4295.50Slp8.909.970.0010.39
90.272.4997.99dNBR0.559.1844.100.26
100.121.0699.05NDVI17.0710.870.570.05
110.100.95100GraD1.2013.0516.9813.54
Table 5. Results of the ANOVA tests applied to the initial HQI values of the plots of each study group. p-value significance: * < 0.05, ** < 0.01, *** < 0.001.
ANOVA GroupsSum of SquaresMean of SquaresDFF Valuep-Value
Fire7.0051.75141.4660.262
Residuals17.9161.19415--
Competition12.574.19132.5010.0964
Residuals26.811.67516--
Mine tailing2.6632.66312.6260.131
Residuals12.1691.01412--
Limited seed reception1.5560.518830.6490.592
Residuals17.5980.799922--
Compacted Soil1.0481.048111.3790.274
Residuals6.0790.75998--
Overgrazing3.023.02311.020.326
Residuals53.342.96418--
Invasive species1.9290.964723.3680.056
Residuals5.4420.286419--
Table 6. Results of the ANOVA tests applied to the final HQI values of the plots of each study group. p-value significance: * < 0.05, ** < 0.01, *** < 0.001.
ANOVA GroupsSum of SquaresMean of SquaresDFF Valuep-Value
Fire5.2831.32140.6320.648
Residuals31.362.09115--
Competition4.341.44730.590.63
Residuals39.232.45216--
Mine tailing0.9560.955510.640.439
Residuals17.9121.492712--
Limited seed reception3.0091.00332.0580.135
Residuals10.7220.487422--
Compacted Soil2.512.50510.4160.537
Residuals48.136.0168--
Overgrazing5.545.54111.3740.256
Residuals72.614.03418--
Invasive species73.6336.82218.09<0.001 ***
Residuals38.682.0419--
Table 7. Paired t-test to evaluate the effects of the habitat improvement actions implemented on the quality index (HQIi: initial value, HQIf: final value). p-value significance: * < 0.05, ** < 0.01, *** < 0.001.
Action CodeMean HQIiMean HQIfDifferencestdfp-Value
Fire4.3125.341.0283.77219<0.01 **
Competition7.419.4662.0569.93619<0.001 ***
Mine Tailing−1.3841.112.4945.77613<0.001 ***
Limited seed reception4.3766.3011.92510.44625<0.001 ***
Compacted Soil−1.0412.0573.0984.1359<0.01 **
Overgrazing4.1755.4111.23710.18719<0.001 ***
Invasive species−2.360.6392.9986.93921<0.001 ***
Publisher’s Note: MDPI stays neutral with regard to jurisdictional claims in published maps and institutional affiliations.

