Provision of Ecosystem Services in Riparian Hemiboreal Forest Fixed-Width Buffers

 , , ,
, , ,  , and
, and 
Abstract
:1. Introduction
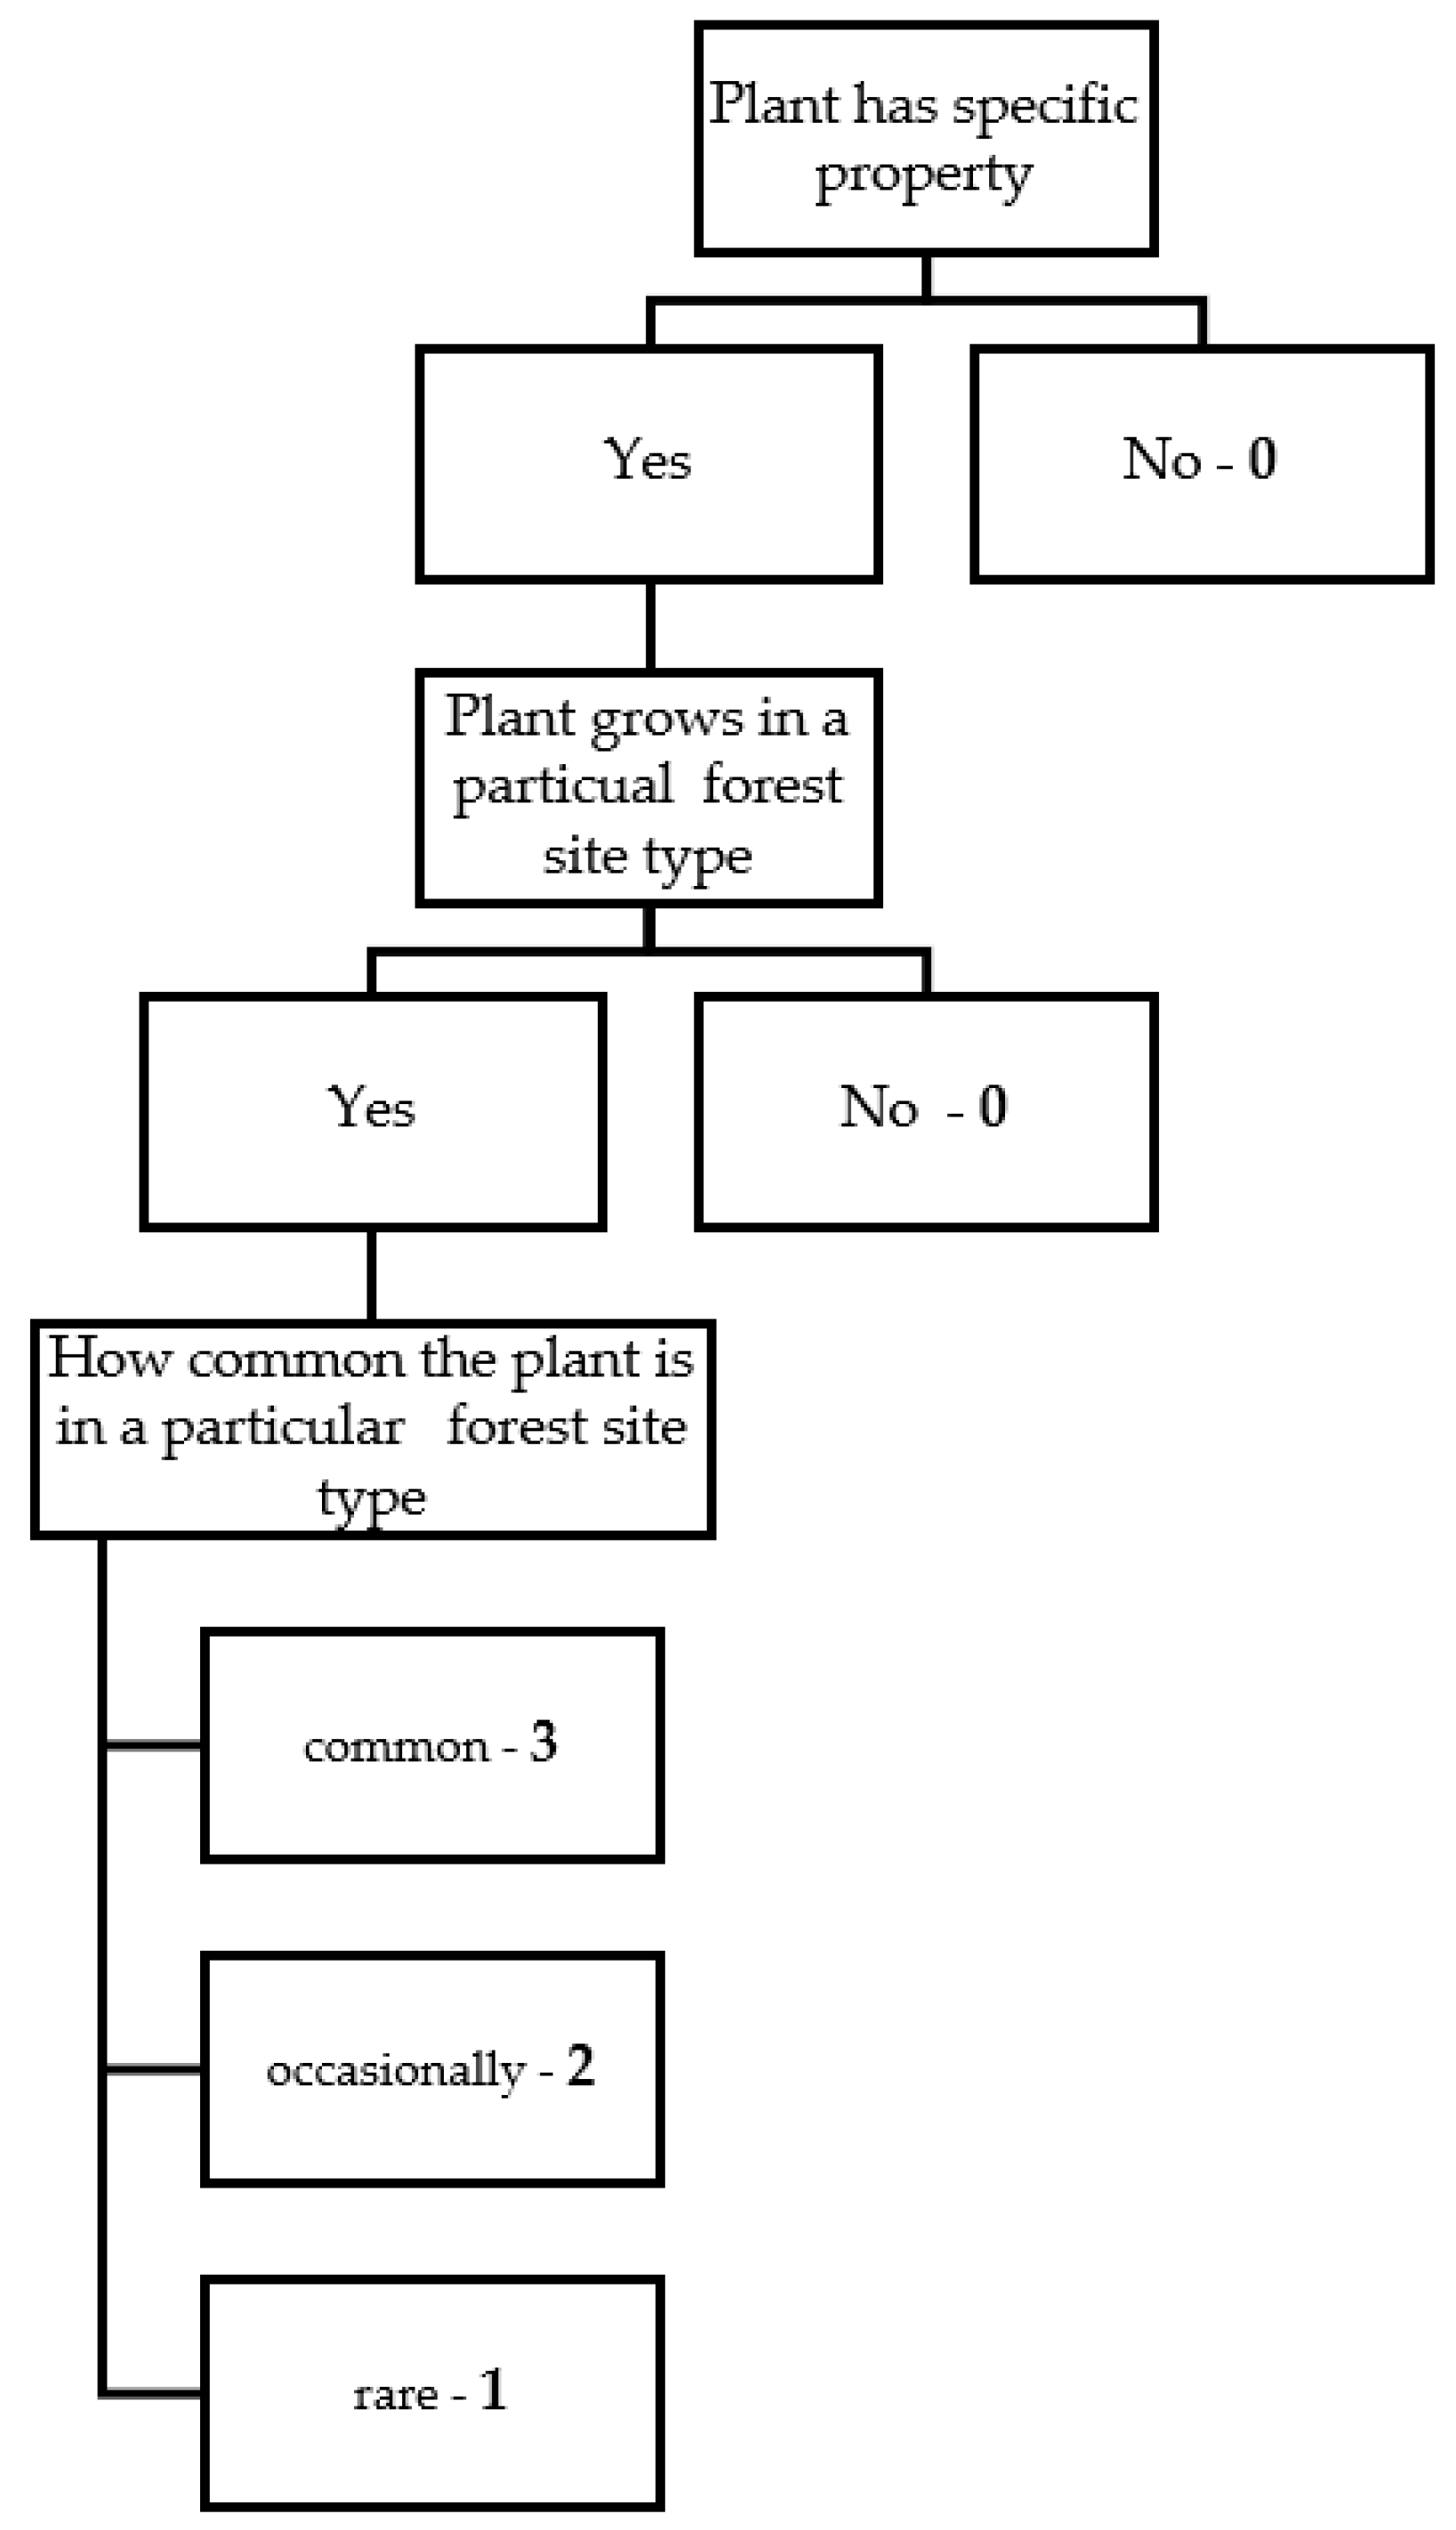
2. Materials and Methods
Data Analysis
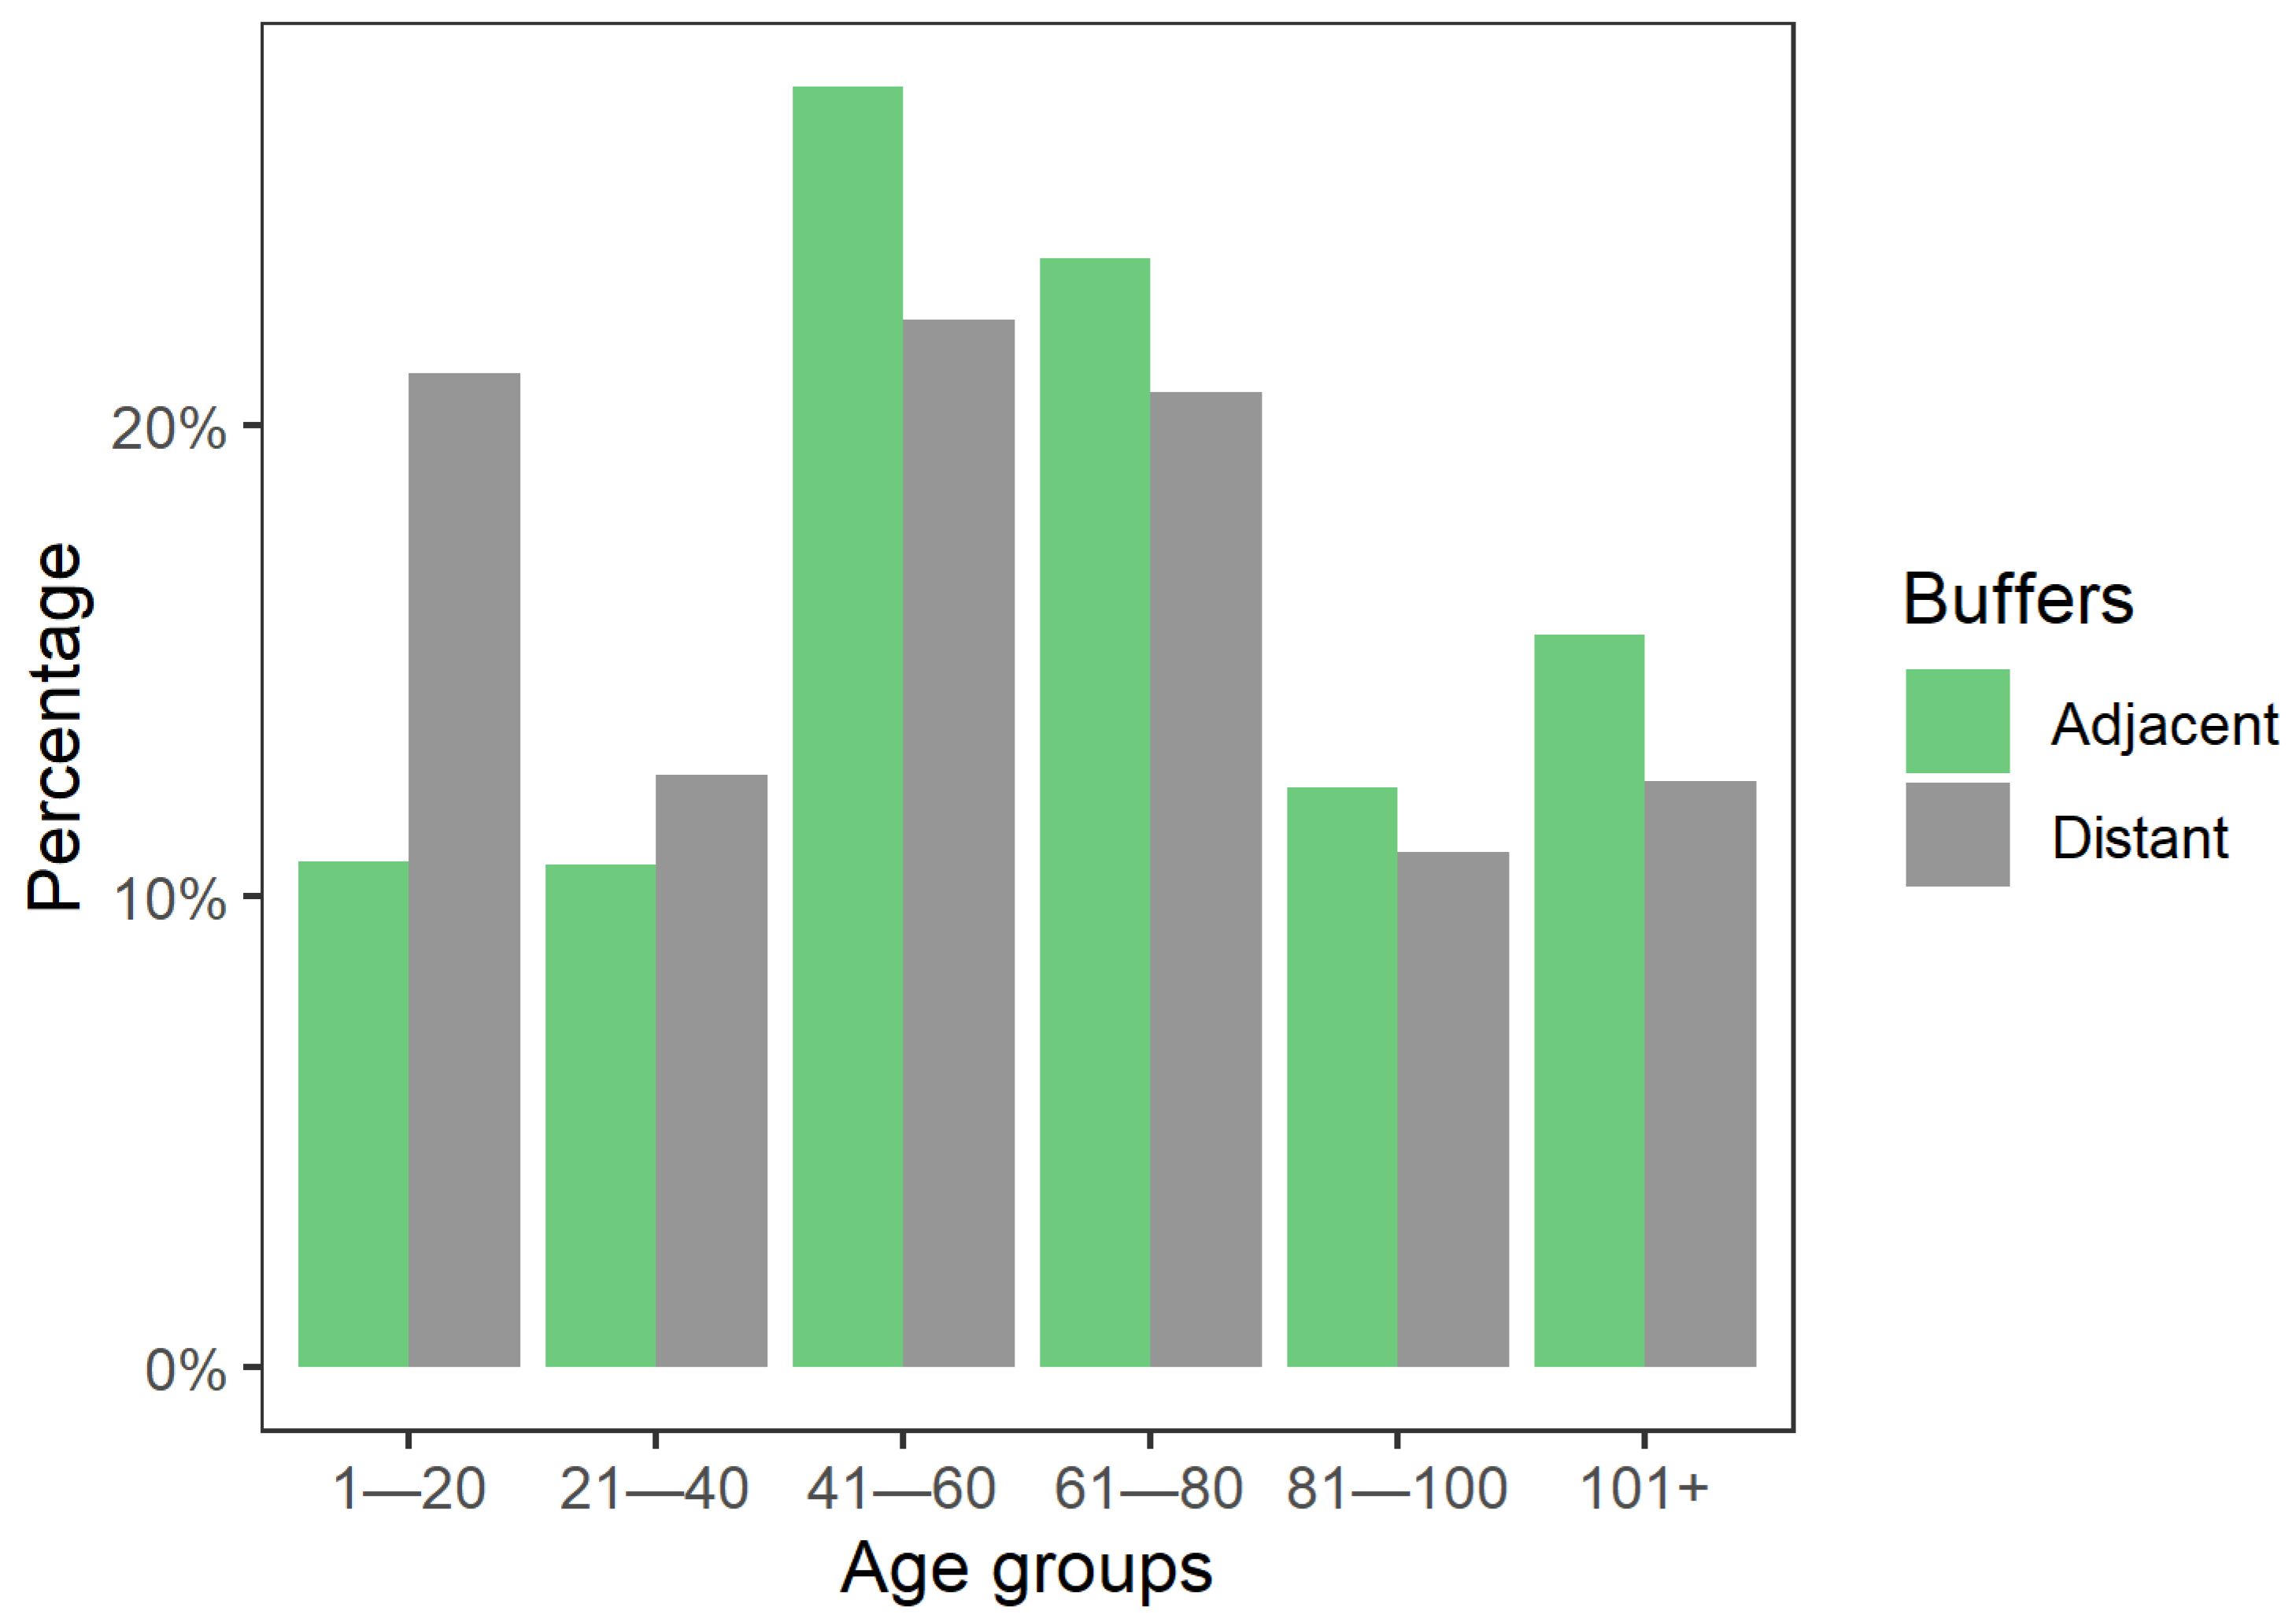
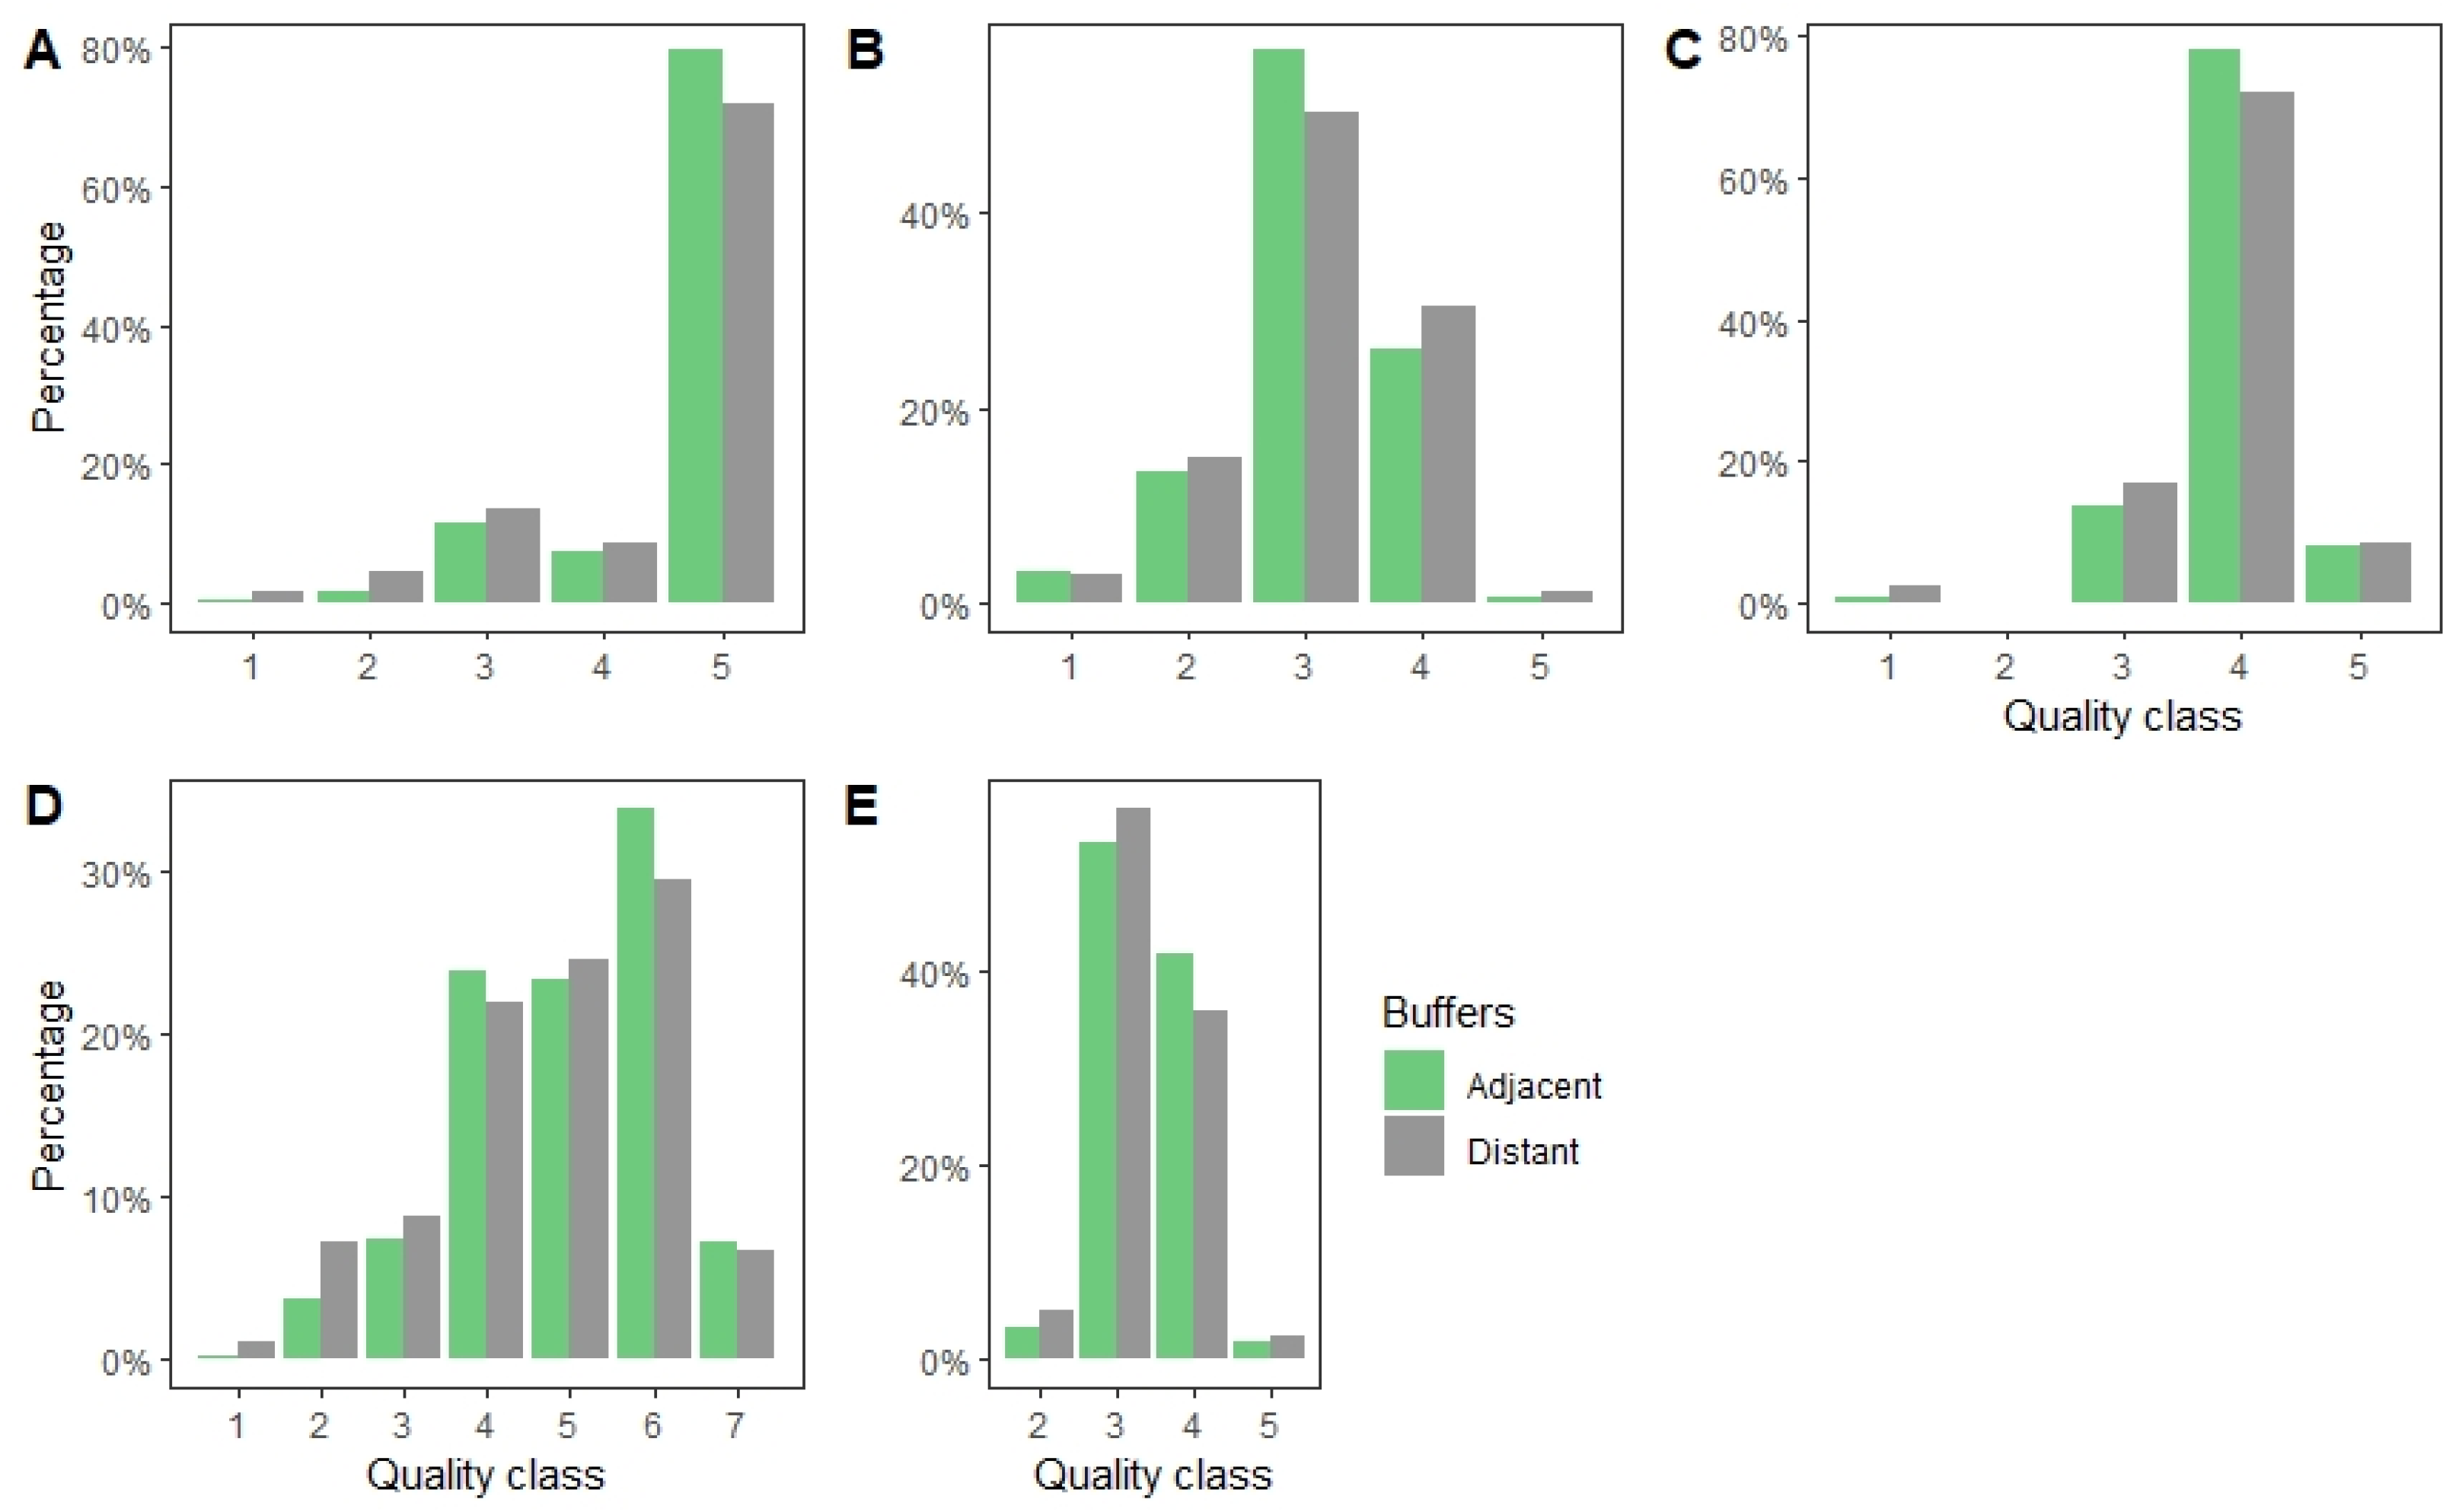
3. Results
4. Discussion
5. Conclusions
Supplementary Materials
Author Contributions
Funding
Institutional Review Board Statement
Informed Consent Statement
Data Availability Statement
Conflicts of Interest
References
- European Commision. New EU Forest Strategy for 2030. European Commission COM (2021) 572 Final. 2021, pp. 1–27. Available online: https://eur-lex.europa.eu/resource.html?uri=cellar:0d918e07-e610-11eb-a1a5-01aa75ed71a1.0001.02/DOC_1&format=PDF (accessed on 1 April 2022).
- Kokkoris, I.P.; Mallinis, G.; Bekri, E.S.; Vlami, V.; Zogaris, S.; Chrysafis, I.; Mitsopoulos, I.; Dimopoulos, P. National Set of MAES Indicators in Greece: Ecosystem Services and Management Implications. Forests 2020, 11, 595. [Google Scholar] [CrossRef]
- Millenium Ecosystem Assessment. Ecosystems and Human Well-Being: Opportunities and Challenges for Business and Industry; Island Press: Washington, DC, USA, 2005; pp. 1–36. [Google Scholar]
- Kowalska, A.; Affek, A.; Wolski, J.; Regulska, E.; Kruczkowska, B.; Zawiska, I.; Kołaczkowska, E.; Baranowski, J. Assessment of regulating ES potential of lowland riparian hardwood forests in Poland. Ecol. Indic. 2021, 120, 106834. [Google Scholar] [CrossRef]
- Dalal, E.L.H.; Raudsepp-Hearne, C.; Bennett, E.M. Effects of land use, cover, and protection on stream and riparian ecosystem services and biodiversity. Conserv. Biol. 2020, 34, 244–255. [Google Scholar] [CrossRef]
- Kuglerova´, L.; Ågren, A.; Jansson, R.; Laudon, H. Towards optimizing riparian buffer zones: Ecological and biogeochemical implications for forest management. For. Ecol. Manag. 2014, 334, 74–84. [Google Scholar] [CrossRef]
- Gregory, S.V.; Swanson, F.J.; McKee, W.A.; Cummins, K.W. An ecosystem perspective of riparian zones: Focus on links between land and water. Bioscience 1991, 41, 540–551. [Google Scholar] [CrossRef]
- Stefanidis, S.; Alexandridis, V.; Ghosal, K. Assessment of Water-Induced Soil Erosion as a Threat to Natura 2000 Protected Areas in Crete Island, Greece. Sustainability 2022, 14, 2738. [Google Scholar] [CrossRef]
- Vidal-Abarca Gutiérrez, M.R.; Suárez Alonso, M.L. Which are, what is their status and what can we expect from ecosystem services provided by Spanish rivers and riparian areas? Biodivers. Conserv. 2013, 22, 2469–2503. [Google Scholar] [CrossRef]
- Jūrmalis, E.; Bārdule, A.; Lībiete, Z. COVID-19-Induced changes in outdoor recreation habits in Latvia during winter holiday season of 2020/2021. In Proceedings of the 10th International Scientific Conference Rural Development, Jelgava, Latvia, 12–14 May 2021. [Google Scholar] [CrossRef]
- Füger, F.; Huth, F.; Wagner, S.; Weber, N. Can Visual Aesthetic Components and Acceptance Be Traced Back to Forest Structure? Forests 2021, 12, 701. [Google Scholar] [CrossRef]
- Arsénio, P.; Rodríguez-González, P.M.; Bernez, I.; Dias, F.S.; Bugalho, M.N.; Dufour, S. Riparian vegetation restoration: Does social perception reflect ecological value? River Res. Appl. 2019, 36, 907–920. [Google Scholar] [CrossRef]
- Kenwicka, R.A.; Shammin, M.R.; Sullivan, W.C. Preferences for riparian buffers. Landsc. Urban Plan. 2009, 91, 88–96. [Google Scholar] [CrossRef]
- Ring, E.; Johansson, J.; Sandström, C.; Bjarnadóttir, B.; Finér, L.; Lībiete, Z.; Lode, E.; Stupak, I.; Sætersdal, M. Mapping policies for surface water protection zones on forest land in the Nordic-Baltic region: Large differences in prescriptive-ness and zone width. Ambio 2017, 46, 878–893. [Google Scholar] [CrossRef] [PubMed]
- Angelstam, P.; Lazdinis, M. Tall herb sites as a guide for planning, maintenance and engineering of riparian continuous forest cover. Ecol. Eng. 2017, 103, 470–477. [Google Scholar] [CrossRef]
- Brumberg, H.; Beirne, C.; Broadbent, E.N.; Almeyda Zambrano, A.M.; Almeyda Zambrano, S.L.; Quispe Gil, C.A.; Lopez Gutierrez, B.; Eplee, R.; Whitworth, A. Riparian Buffer Length Is More Influential than Width on River Water Quality: A Case Study in Southern Costa Rica. J. Environ. Manag. 2021, 286, 112132. [Google Scholar] [CrossRef]
- Laudon, H.; Kuglerová, L.; Sponseller, R.A.; Futter, M.; Nordin, A.; Bishop, K.; Lundmark, T.; Egnell, G.; Ågren, A.M. The Role of Biogeochemical Hotspots, Landscape Heterogeneity, and Hydrological Connectivity for Minimizing Forestry Effects on Water Quality. Ambio 2016, 45, 152–162. [Google Scholar] [CrossRef] [PubMed] [Green Version]
- Feld, C.K.; Fernandes, M.R.; Ferreira, M.T.; Hering, D.; Ormerod, S.J.; Venohr, M.; Gutiérrez-Cánovas, C. Evaluating Riparian Solutions to Multiple Stressor Problems in River Ecosystems—A Conceptual Study. Water Res. 2018, 139, 381–394. [Google Scholar] [CrossRef]
- Bārdule, A.; Jūrmalis, E.; Lībiete, Z.; Pauliņa, I.; Donis, J.; Treimane, A. Use of Retail Market Data to Assess Prices and Flows of Non-Wood Forest Products in Latvia. Silva Fenn. 2020, 54, 10341. [Google Scholar] [CrossRef]
- Sile, I.; Romane, E.; Reinsone, S.; Maurina, B.; Tirzite, D.; Dambrova, M. Medicinal Plants and Their Uses Recorded in the Archives of Latvian Folklore from the 19th Century. J. Ethnopharmacol. 2020, 249, 112378. [Google Scholar] [CrossRef]
- Prūse, B.; Simanova, A.; Mežaka, I.; Kalle, R.; Prakofjewa, J.; Holsta, I.; Laizāne, S.; Sõukand, R. Active Wild Food Practices among Culturally Diverse Groups in the 21st Century across Latgale, Latvia. Biology 2021, 10, 551. [Google Scholar] [CrossRef]
- Sile, I.; Videja, M.; Makrecka-Kuka, M.; Tirzite, D.; Pajuste, K.; Shubin, K.; Krizhanovska, V.; Grinberga, S.; Pugovics, O.; Dambrova, M. Chemical Composition of Prunus padus L. Flower Extract and Its Anti-Inflammatory Activities in Primary Bone Marrow-Derived Macrophages. J. Ethnopharmacol. 2021, 268, 113678. [Google Scholar] [CrossRef]
- Jekabsone, A.; Sile, I.; Cochis, A.; Makrecka-Kuka, M.; Laucaityte, G.; Makarova, E.; Rimondini, L.; Bernotiene, R.; Raudone, L.; Vedlugaite, E.; et al. Investigation of Antibacterial and Antiinflammatory Activities of Proanthocyanidins from Pelargonium sidoides DC Root Extract. Nutrients 2019, 11, 2829. [Google Scholar] [CrossRef] [Green Version]
- Stryamets, N.; Elbakidze, M.; Ceuterick, M.; Angelstam, P.; Axelsson, R. From Economic Survival to Recreation: Contemporary Uses of Wild Food and Medicine in Rural Sweden, Ukraine and NW Russia. J. Ethnobiol. Ethnomed. 2015, 11, 53. [Google Scholar] [CrossRef] [PubMed] [Green Version]
- Mayer, M.; Vogl, C.R.; Amorena, M.; Hamburger, M.; Walkenhorst, M. Treatment of Organic Livestock with Medicinal Plants: A Systematic Review of European Ethnoveterinary Research. Forsch. Komplementmed. 2014, 21, 375–386. [Google Scholar] [CrossRef] [PubMed] [Green Version]
- Williams, I.H.; Padjus, P.; Pärn, E.; Rootslane, M.; Susi, J. A History of Beekeeping in Estonia. Bee World 1995, 76, 18–30. [Google Scholar] [CrossRef]
- Zacepins, A.; Kviesis, A.; Komasilovs, V.; Brusbardis, V.; Kronbergs, J. Status of the Precision Beekeeping Development in Latvia. Rural. Sustain. Res. 2021, 45, 86–92. [Google Scholar] [CrossRef]
- Popescu, A.; Dinu, T.A.; Stoian, E.; Șerban, V. Honey Production in the European Union in the period 2008–2019—A statistical approach. Scientific Papers. Ser. Manag. Econ. Eng. Agric. Rural. Dev. 2021, 21, 14. [Google Scholar]
- Labsvards, K.D.; Rudovica, V.; Kluga, R.; Rusko, J.; Busa, L.; Bertins, M.; Eglite, I.; Naumenko, J.; Salajeva, M.; Viksna, A. Determination of Floral Origin Markers of Latvian Honey by Using IRMS, UHPLC-HRMS, and 1H-NMR. Foods 2022, 11, 42. [Google Scholar] [CrossRef]
- Girard, M.; Chagnon, M.; Fournier, V. Pollen Diversity Collected by Honey Bees in the Vicinity of Vaccinium spp. Crops and Its Importance for Colony Development. Botany 2012, 90, 545–555. [Google Scholar] [CrossRef]
- Affek, A.N.; Regulska, E.; Kołaczkowska, E.; Kowalska, A.; Affek, K. Pollination Potential of Riparian Hardwood Forests—A Multifaceted Field-Based Assessment in the Vistula Valley, Poland. Forests 2021, 12, 907. [Google Scholar] [CrossRef]
- Ricou, C.; Schneller, C.; Amiaud, B.; Plantureux, S.; Bockstaller, C. A Vegetation-Based Indicator to Assess the Pollination Value of Field Margin Flora. Ecol. Indic. 2014, 45, 320–331. [Google Scholar] [CrossRef]
- Siitonen, J.; Martikainen, P.; Punttila, P.; Rauh, J. Coarse Woody Debris and Stand Characteristics in Mature Managed and Old-Growth Boreal Mesic Forests in Southern Finland. For. Ecol. Manag. 2000, 128, 211–225. [Google Scholar] [CrossRef]
- Gundersen, V.; Stange, E.E.; Kaltenborn, B.P.; Vistad, O.I. Public Visual Preferences for Dead Wood in Natural Boreal Forests: The Effects of Added Information. Landsc. Urban Plan. 2017, 158, 12–24. [Google Scholar] [CrossRef]
- MacDonald, R.L.; Chen, H.Y.H.; Palik, B.P.; Prepas, E.E. Influence of Harvesting on Understory Vegetation along a Boreal Riparian-Upland Gradient. For. Ecol. Manag. 2014, 312, 138–147. [Google Scholar] [CrossRef]
- Ahti, T.; Hämet-Ahti, L.; Jalas, J. Vegetation Zones and Their Sections in Northwestern Europe. Ann. Bot. Fenn. 1968, 5, 169–211. [Google Scholar]
- Protection Zone Law, Published in the Official Publication “Latvijas Vēstnesis”, No. 56/57 (771/772) Riga, Latvia, 25 Febrary 1997. (In Latvian). Available online: https://www.vestnesis.lv/ta/id/42348-aizsargjoslu-likums (accessed on 3 April 2022).
- Bušs, K. Fundamentals of Forest Classification in Latvia SSR; Latvijas Zinātniski Pētnieciskais Mežsaimniecības Problēmu Institūts: Rīga, Latvia, 1976; pp. 1–24. (In Latvian) [Google Scholar]
- Haines-Young, R.; Potschin, M.B. Common International Classification of Ecosystem Services (CICES) V5.1 and Guidance on the Application of the Revised Structure. 2018. Available online: www.cices.eu (accessed on 2 April 2022).
- Panagos, P.; Meusburger, K.; Ballabio, C.; Borrelli, P.; Alewell, C. Soil Erodibility in Europe: A High-Resolution Dataset Based on LUCAS. Sci. Total Environ. 2014, 479–480, 189–200. [Google Scholar] [CrossRef] [PubMed]
- Repshas, E.A. Optimization of Recreational Forest Management (by the Example of Lithuania); Nauka: Moscow, Russia, 1994; pp. 1–129. (In Russian) [Google Scholar]
- Donis, J. Development of Models for Sustainable, Economically Justified Use and Forecasting of Latvia’s Forest Resources; pp. 80–85. (In Latvian). Available online: https://www.zm.gov.lv/public/ck/files/ZM/mezhi/MAF/MAF_2013/Latv_me%C5%BEu_ilgtspejiga.pdf (accessed on 1 April 2022).
- Emsis, I. Recreational Use of the Forests of the Latvian SSR; Zinātne: Rīga, Latvia, 1989. (In Russian) [Google Scholar]
- Donis, J.; Straupe, I.; Baumanis, I.; Dāniele, I. Forestry and Providing Forest Ecosystem Services Interaction—Changes in the Availability and Quality of Non-Wood Products. In Report of the Results of the Research Programme ‘The Impact of Forest Management on Forest and Related Ecosystem Services’; LSFRI Silava: Salaspils, Latvia, 2016; pp. 154–190, (In Latvian). Available online: http://silava.lv/userfiles/file/Projektu%20parskati/2016_Libiete_LVM.pdf (accessed on 2 April 2022).
- R Core Team. A Language and Environment for Statistical Computing; R Foundation for Statistical Computing: Vienna, Austria. Available online: https://www.R-project.org/ (accessed on 1 March 2020).
- Bürkner, P.-C. Advanced Bayesian Multilevel Modeling with the R Package Brms. R J. 2018, 10, 395. [Google Scholar] [CrossRef]
- Gundersen, V.S.; Frivold, L.H. Public Preferences for Forest Structures: A Review of Quantitative Surveys from Finland, Norway and Sweden. Urban For. Urban Green. 2008, 7, 241–258. [Google Scholar] [CrossRef]
- Saklaurs, M.; Kārkliņa, A.; Liepa, L.; Jansons, Ā. The Evaluation of Small- and Medium-Stream Carbon Pools in the Riparian Forests in Latvia. Forests 2022, 13, 506. [Google Scholar] [CrossRef]
- Lībiete, Z. Recreation Preferences and Habits of Non-Wood Forest Product Gathering of the Inhabitants of Latvia. In Report of the Results of the Research Programme ‘The Impact of Forest Management on Forest and Related Ecosystem Services’; LSFRI Silava: Salaspils, Latvia, 2020; pp. 50–53, (In Latvian). Available online: http://silava.lv/userfiles/file/Projektu%20parskati/2020_LVM_Libiete_Ekosistemu_pakalp_2016_2020.pdf (accessed on 2 April 2022).
- Valujeva, K.; Straupe, I.; Grīnfelde, I. The use of Phytoremediation method in Latvia. In Proceedings of the 5th International Conference Civil Engineering’15 Proceedings Landscape, Environment and Land Management in Latvia University of Agriculture, Jelgava, Latvia, 14–15 May 2005; Volume 5, pp. 155–162. [Google Scholar]


| River | Buffer | The Most Common Forest Site Types (% of Area) |
|---|---|---|
| Korģe | Adjacent | Oxalidosa 50%; Hylocomniosa 15%; Myrtilloso-polytrichosa 13% |
| Distant | Oxalidosa 37%; Myrtilloso-polytrichosa 16%; Hylocomniosa 15% | |
| Līgatne | Adjacent | Oxalidosa 55%; Hylocomniosa 33% |
| Distant | Oxalidosa 46%; Hylocomniosa 37% | |
| Svētaine | Adjacent | Oxalidosa 48%; Mercurialiosa mel. 33% |
| Distant | Oxalidosa 47%; Mercurialiosa mel. 32% | |
| Vitrupe | Adjacent | Oxalidosa 37%; Hylocomniosa 16%; Aegopodiosa 16% |
| Distant | Oxalidosa 34%; Aegopodiosa 18%; Hylocomniosa 14% |
| Ecosystem Service | CICES 5.1 Class Code | Indicator | Grade | |
|---|---|---|---|---|
| 1 | Cultural (biotic): Ecological and geographical qualities of the forest stand which attract people | 3.1.1.1 | Recreation potential of the forest ecosystem | 0–100 |
| 2 | Cultural (biotic): Visual features (aesthetics) of the forest stand which attract people | 3.1.1.2 | Visual aesthetic quality of the forest landscape | 1–5 |
| 3 | Cultural (biotic): Characteristics of the forest stand which help to withstand recreational pressure | 3.1.1.1 | Potential to withstand recreational pressure | 1–7 |
| 4 | Regulation & Maintenance (biotic): Filtration/sequestration/storage/accumulation by micro-organisms, algae, plants, and animals (Phytoremediation) | 2.1.1.2 | Flora with phytoremediation potential | 1–5 |
| 5 | Provision (biotic): Wild plants used for nutrition | 1.1.5.1 | Potential for the presence of nectar plants | 1–5 |
| 6 | Provision (biotic): Fibers and other materials from wild plants available for direct use or processing | 1.1.5.2 | Potential for the presence medicinal plants | 1–5 |
| River | Percentages (%) of Quality Classes | ||||
|---|---|---|---|---|---|
| 5 | 4 | 3 | 2 | 1 | |
| Korģe | 90.6 | 5.9 | 2.6 | 0.9 | - |
| Līgatne | 95.7 | 3.4 | 0.6 | 0.1 | 0.1 |
| Svētaine | 63 | 28.7 | 5.6 | 2.7 | - |
| Vitrupe | 83.5 | 11.9 | 3.5 | 1 | - |
Publisher’s Note: MDPI stays neutral with regard to jurisdictional claims in published maps and institutional affiliations. |
© 2022 by the authors. Licensee MDPI, Basel, Switzerland. This article is an open access article distributed under the terms and conditions of the Creative Commons Attribution (CC BY) license (https://creativecommons.org/licenses/by/4.0/).
Share and Cite
Saklaurs, M.; Lībiete, Z.; Donis, J.; Kitenberga, M.; Elferts, D.; Jūrmalis, E.; Jansons, Ā. Provision of Ecosystem Services in Riparian Hemiboreal Forest Fixed-Width Buffers. Forests 2022, 13, 928. https://doi.org/10.3390/f13060928
Saklaurs M, Lībiete Z, Donis J, Kitenberga M, Elferts D, Jūrmalis E, Jansons Ā. Provision of Ecosystem Services in Riparian Hemiboreal Forest Fixed-Width Buffers. Forests. 2022; 13(6):928. https://doi.org/10.3390/f13060928
Chicago/Turabian StyleSaklaurs, Mārcis, Zane Lībiete, Jānis Donis, Māra Kitenberga, Didzis Elferts, Edgars Jūrmalis, and Āris Jansons. 2022. "Provision of Ecosystem Services in Riparian Hemiboreal Forest Fixed-Width Buffers" Forests 13, no. 6: 928. https://doi.org/10.3390/f13060928
APA StyleSaklaurs, M., Lībiete, Z., Donis, J., Kitenberga, M., Elferts, D., Jūrmalis, E., & Jansons, Ā. (2022). Provision of Ecosystem Services in Riparian Hemiboreal Forest Fixed-Width Buffers. Forests, 13(6), 928. https://doi.org/10.3390/f13060928